

Lack of effect of common single nucleotide polymorphisms in leukotriene pathway genes on platelet reactivity in patients with diabetes
- Authors:
- Published online on: July 3, 2013 https://doi.org/10.3892/mmr.2013.1567
- Pages: 853-860
Abstract
Introduction
Acetylsalicylic acid (ASA) is an effective inhibitor of platelet thromboxane A2 (TxA2) synthesis by cyclooxygenase-1 (COX-1), nevertheless it is often considered a relatively weak platelet inhibitor due to its limited effect on aggregation in the presence of high concentrations of other agonists, such as adenosine-5′-diphosphate (ADP) or collagen (1–3).
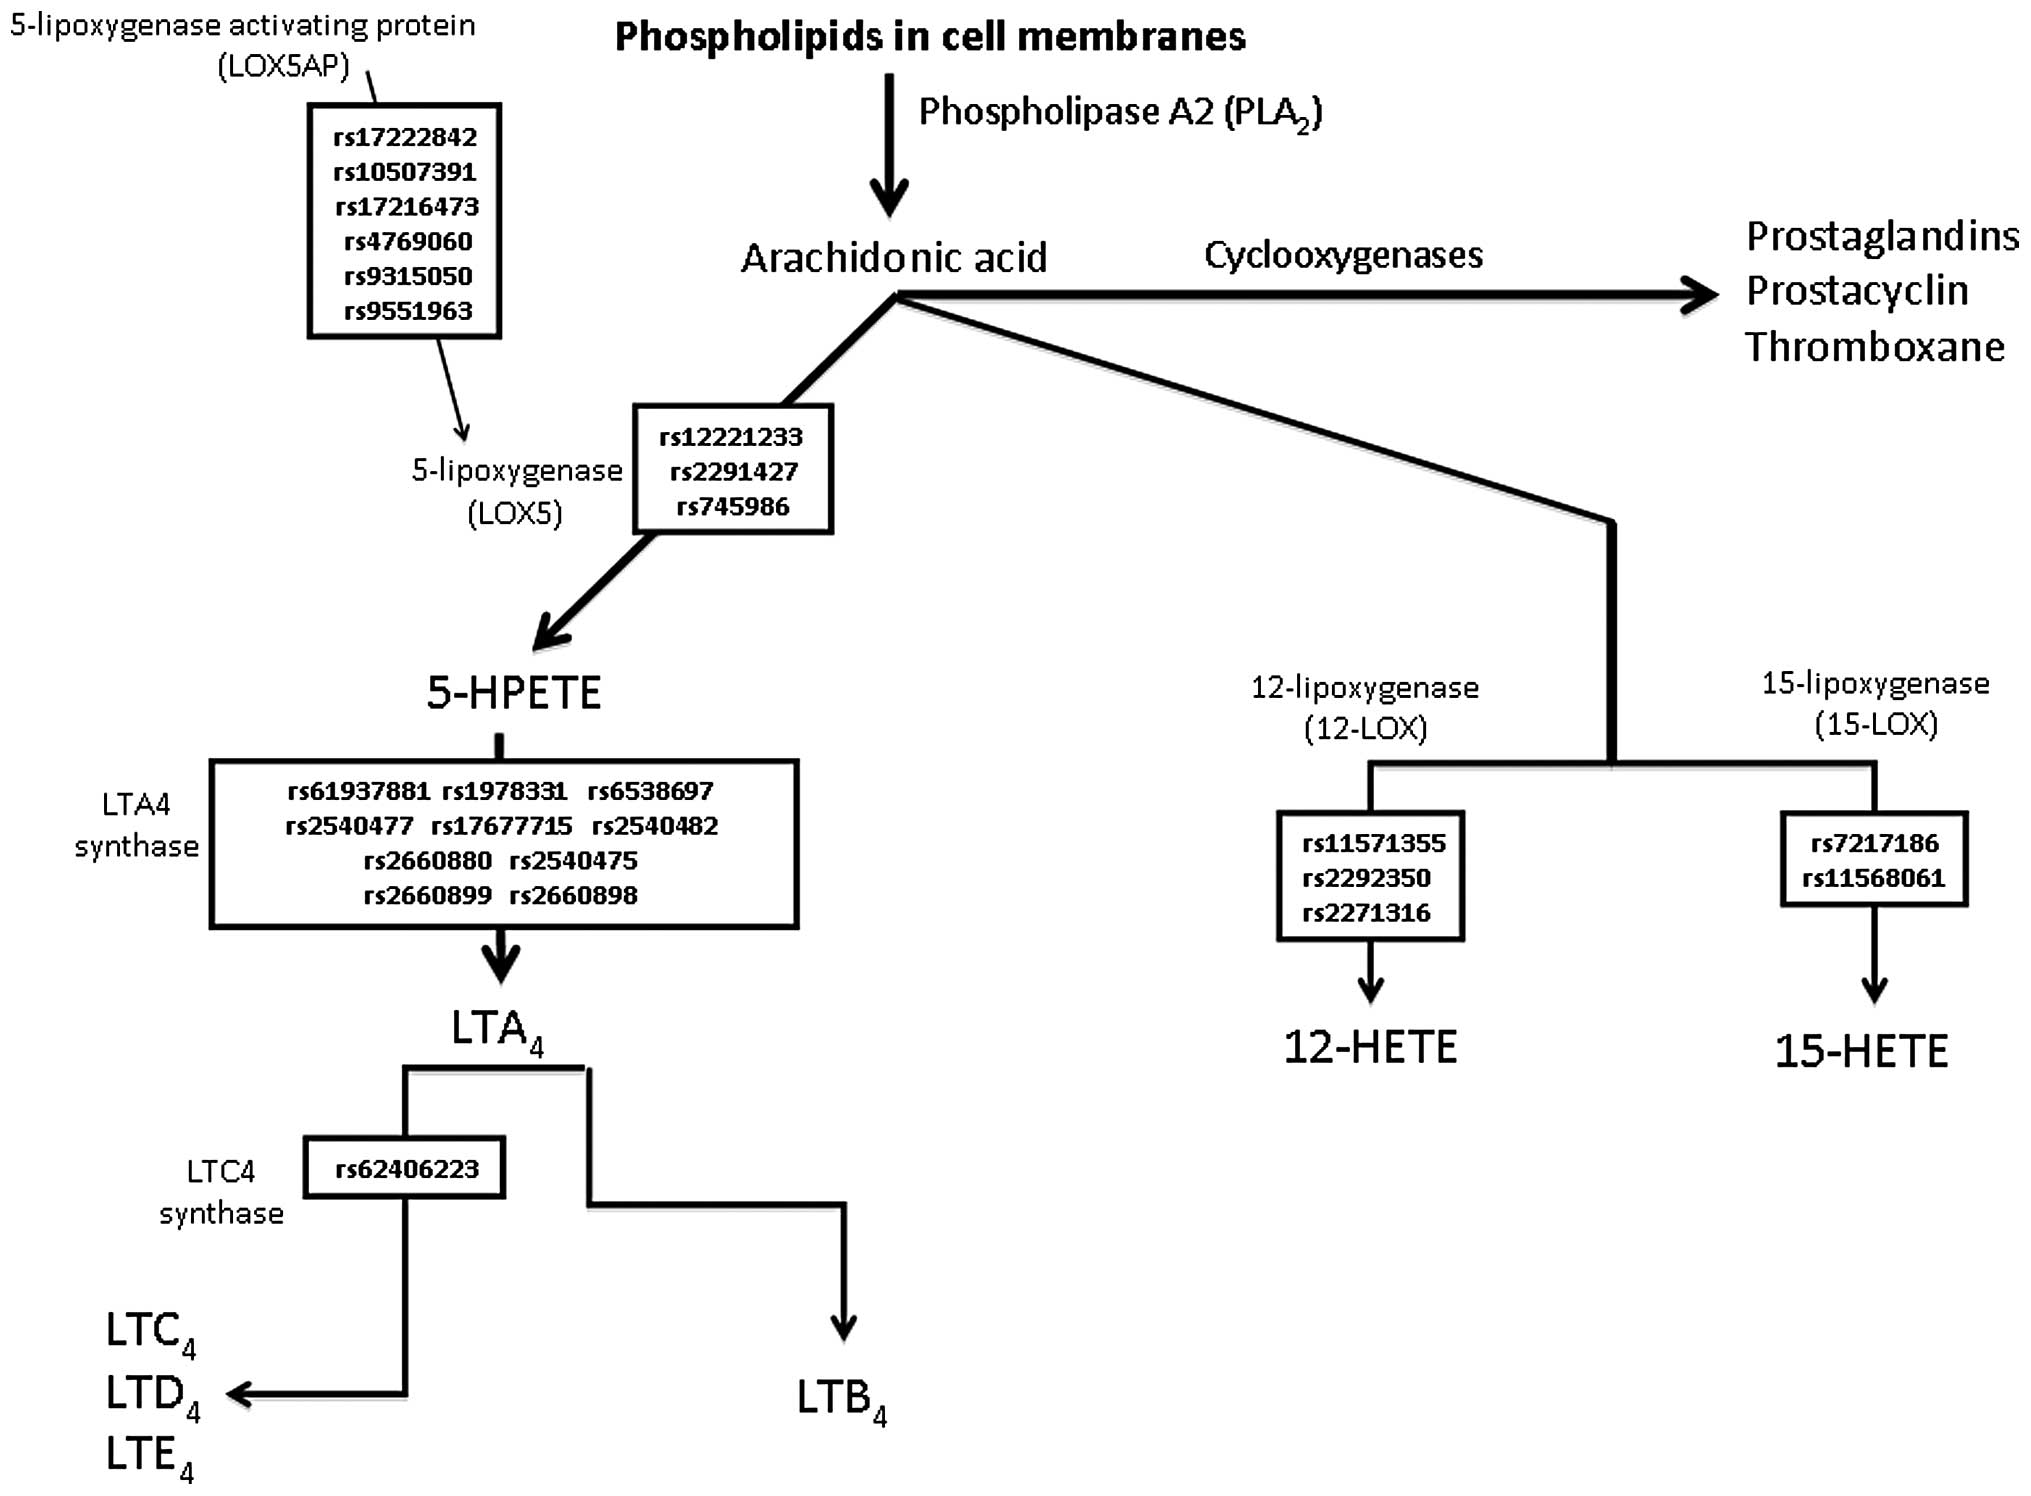
ASA-induced COX-1 inhibition may cause alternative processing of arachidonic acid (AA) via the 5-lipoxygenase (5-LOX) pathway, resulting in the increased production of proinflammatory leukotrienes (LTs) (4). In leukocytes, the 5-lipoxygenase gene (ALOX5) and the 5-lipoxygenase-activating protein gene (ALOX5AP) initialize the biosynthesis of LTs from AA. The biologically active LTs are synthesized by subsequent conversion to LTB4 and the cysteinyl LTs (LTC4, LTD4 and LTE4) via enzymatic reactions with LTA4 hydrolase (LTA4H) and LTC4 synthase (LTC4S), respectively (Fig. 1) (5). LTs subsequently affect the function of the target cells, including monocytes and other pro-inflammatory leukocytes, through receptor-mediated signal transduction.
The majority of research on the association of genomics and platelet reactivity with ASA therapy has been focused on specific agonists or single pathway platelet function phenotypes (6). Several single nucleotide polymorphisms (SNPs) may be responsible for certain inter-individual differences in platelet reactivity in the type 2 diabetes mellitus (T2DM) population treated with ASA (7).
The aim of this study was to determine whether SNPs in candidate genes, including ALOX5, ALOX5AP, ALOX12, ALOX15, LTA4H and LTC4S, in Caucasian patients with T2DM are associated with changes in platelet function analyzer (PFA)-100 collagen/epinephrine closure time (CEPI-CT) and/or collagen/ADP closure time (CADP-CT) and/or VerifyNow aspirin reaction units (ARU) and the concentrations of LTB4 and LTE4.
Materials and methods
Patient population and study design
The local ethics committee of the Medical University of Warsaw approved the study protocol and the informed consent form (date of approval, May 29 2007; certification number, KB/77/2007). The study was conducted in accordance with the Declaration of Helsinki and informed written consent was obtained from all patients. The genotyping in this study was reviewed and approved by the Institutional Review Board of Penn State Hershey Medical Center (Hershey, PA, USA). The subjects of the study were recruited consecutively from patients with T2DM participating in a multi-center, prospective, randomized and open-label AVOCADO (aspirin vs./or clopidogrel in aspirin-resistant diabetics inflammation outcomes) study presenting to the outpatient clinic of the Central Teaching Hospital of the Medical University of Warsaw. The full characterization of the population of the study, including the inclusion and exclusion criteria, have been published previously (7). Caucasian subjects with T2DM who, at the time of enrollment, had been receiving treatment with ASA tablets (75 mg/day) for at least 3 months for the primary or secondary prevention of myocardial infarction (MI) were recruited. No clopidogrel or antiplatelet drugs other than ASA were used in any of the investigated patients. All patients had received oral antidiabetic agents and/or insulin for at least 6 months; diet-controlled diabetic patients were not included in the study. Compliance to ASA therapy was determined upon enrollment in the study based on the statement of the patient and measurement of S-TxB2 levels.
Blood sample and assay procedure
Blood samples were obtained in the morning 2–3 h following the previous dose of ASA. Blood was extracted from the antecubital vein and the initial 2 ml of blood was discarded in order to avoid spontaneous platelet activation. Blood was drawn into tubes containing 3.2% sodium citrate for VerifyNow measurements and 3.8% sodium citrate for PFA-100 measurements. Blood samples were processed within 2 h of collection. For S-TxB2, whole blood was allowed to clot at 37°C for 1 h prior to serum separation by centrifugation. Serum was obtained from venous blood by centrifugation at 1000 × g for 15 min at 4°C and aliquots were stored at −80°C for further analysis. Routine laboratory testing was performed at the laboratory of the Central Teaching Hospital of the Medical University of Warsaw using standard techniques, including complete blood cell and platelet counts, fasting glycemia, glycosylated hemoglobin (HbA1c), lipid profile, C-reactive protein and serum creatinine concentrations.
The concentration of the functional epitope of the vWF molecule (vWF:Ag) was measured in the citrate plasma samples using an enzyme immunoassay (EIA) kit according to the manufacturer’s instructions (vWF Activity Kit, Sekisui Diagnostics, Stamford, CT, USA).
S-TxB2 and serum LTB4 concentrations were also measured with an EIA kit according to the manufacturer’s instructions (EIA kits, Cayman Chemicals, Ann Arbor, MI, USA). Each set of TxB2 and LTB4 EIA kits were tested for the impact of interferences. The correlation of results in three dilutions of five random samples were assessed, as proposed by the manufacturer’s instructions within the kit. Following the analysis of results, it was decided that the assay was to be used without purification, as the differences between the results did not exceed 20%. Samples with results outside the standard curve were re-assayed with appropriate dilutions. Optimal compliance was confirmed by S-TxB2 levels <7.2 ng/ml in all patients, as described previously in a diabetic population by Mortensen et al(1).
The first morning urine sample was collected and delivered by the patient within 2 h. The samples were collected into tubes containing indomethacin and subsequently stored at −80°C for further analysis. Urinary LTE4 concentrations were measured using an EIA kit according to the manufacturer’s instructions (Cayman Chemicals), following extraction and purification on SPE (C18) columns (Waters Associates, Milford, MA, USA), and data were normalized for urinary creatinine concentration.
Platelet function analysis
VerifyNow
The VerifyNow aspirin assay (Accumetrics, San Diego, CA, USA) uses cartridges containing a lyophilized preparation of human fibrinogen-coated beads and AA. The assay is a turbidimetric-based optical detection system, which measures platelet-induced agglutination as the increase in light transmittance in response to AA and converts luminosity transmittance units into ARU for VerifyNow. According to the manufacturer, ARU ≥550 indicates no effect of ASA on platelet aggregation, whereas ARU <550 indicates platelet dysfunction due to inhibition of the COX-1-dependent pathway (8).
PFA-100
The PFA-100 assay (Dade-Behring International, Inc., Newark, DE, USA) uses whole blood and simulates high shear stress conditions. A syringe aspirates citrated whole blood at a high shear rate through a small aperture cut into a membrane, coated with 2 μg of type I collagen and either 10 μg epinephrine (EPI) bitartrate or 50 μg ADP. The instrument records the time required for occlusion of the aperture, defined as CT, which is indicative of platelet reactivity in the whole blood sample. Based on our own and other previous reports (7,9–11), we applied three different cut-off values for high platelet reactivity in the CEPI-CT assay. In the first approach, adequate platelet inhibition with ASA is defined as CEPI-CT ≥165 sec, and in the second as CEPI-CT ≥193 sec (the manufacturer’s lower limit of the normal range for aspirin-free healthy controls) (12). The maximum CT provided for PFA-100 is 300 sec and is equivalent to non-occlusion (13). Thus, patients with CEPI-CT values ≥300 sec were defined as an alternative population with adequate platelet inhibition (14). Cut-off values for CADP-CT were based on the median value in the studied population.
DNA extraction, quality control and quantification
DNA was obtained from whole blood samples and frozen until it was required for analysis, which employed the membrane ultrafiltration method using a Fuji MiniGene 80 extractor (FujiFilm Life Sciences distributed by AutoGen, Inc., Holliston, MA, USA). DNA concentrations were determined spectrofluorometrically using a PicoGreen dsDNA Quantitation Reagent kit (Molecular Probes Inc., Eugene, OR, USA).
Individual SNP genotyping
Genotyping was performed at the Boston Children’s Hospital (Boston, MA, USA) using a custom Sequenom iPLEX assay in conjunction with the MassARRAY platform (Sequenom Inc., San Diego, CA, USA). One panel of SNP markers was designed using Sequenom Assay Design 3.2 software.
Statistical analysis of results
Power analysis
We planned a prospective, observational study of diabetic patients treated with ASA. The Hardy-Weinberg equilibrium (HWE) was evaluated using the two-tailed Chi-square test. The primary analysis utilized the two-tailed Chi-square test followed by univariate logistic regression with genotypes for each SNP as dependent variables, and VerifyNow ARU >550 phenotype (high on ASA platelet reactivity) as a binary independent variable. The logistic regression procedure enabled us to estimate the log of the odds ratio (OR), a measure of the increase in odds of experiencing VerifyNow ARU >550 for subjects carrying the variant compared with wild-type subjects. We obtained a 95% confidence interval around this estimate and the P-value for the OR. The P-value was compared with the pre-defined cut-off for statistical significance (α = 0.05/number of investigated SNPs and outcome phenotypes = 0.0017, since the nominal α-level of 0.05 was corrected by the Bonferroni method for 25 simultaneously analyzed polymorphisms and five outcome phenotypes). Given the expected population incidence of VerifyNow ARU>550 in the investigated diabetic population of ~20%, average allele frequency of minor allele 0.2, alpha level=0.0017 and a statistical power of 0.8, the study required at least 280 subjects to detect clinically significant OR=3 for experiencing VerifyNow ARU>550 in carriers of the minor allele.
Initial power analysis revealed that none of the analyzed SNP genotypes were associated with any of the measured outcome phenotypes (platelet reactivity or LTs concentrations).
Statistical calculations
Statistical analyses were performed using IBM-SPSS ver. 19 and Stata (Stata Corporation, College Station, TX, USA) software. Deviations from the HWE were calculated using the Chi-square test. The recorded clinical data, when distributed normally in the analyzed group of patients, are presented as the mean ± SD, and non-normally distributed data are presented as median and the interquartile range (IQR). We compared the distribution of predefined cut-off values for the assays, CEPI-CT for PFA-100 (<165 sec, <193 sec and <300 sec) and the ARU for VerifyNow (<550) using exact Chi-square statistics and distribution of medians, CEPI-CT and CADP-CT for PFA-100 and ARU for VerifyNow among all genotypes of successfully genotyped SNPs for three genotypes (homozygotes for minor allele and heterozygotes and homozygotes for major allele) using the Kruskal-Wallis test. SNPs were considered to be statistically significant when P<0.05/30 (the P-value is corrected for multiple comparisons).
SNPs with nominal statistically significant (P<0.05 prior to correcting for multiple comparisons) differences in the measurements for AA metabolite concentrations (LTE4 and LTB4) between medians for three genotypes (homozygotes for minor allele, heterozygotes and homozygotes for major allele) were subjected to further testing based on the dominant, recessive or additive genetic model by the Mann-Whitney test.
Results
Patients
From the initially enrolled 304 patients, complete clinical data and blood samples were available for 298 patients. Subsequently, eight patients were eliminated from the analysis due to suspected ASA non-compliance (S-TxB2 concentrations >7.2 ng/ml) and a further three patients were eliminated due to the lack of corresponding biochemical and genotype data. Demographic characteristics, clinical data and the results of platelet reactivity measurements, serum concentrations of S-TxB2, LTB4 and urinary concentrations of LTE4 for the remaining 287 patients are summarized in Table I.
Genotyping
Genotyping was initially attempted for 25 selected SNPs (see Fig. 1) in all 287 patients. There was one SNP that was considered to be a failure as it genotyped poorly (cut-off <85%; rs2660880, LTA4H gene) and one SNP was not included in the final analysis as we observed only homozygotes in our population (rs62406223, LTC4S gene). The remaining 23 SNPs genotyped well (>86% success rate) and were in the HWE.
The results of the allele and genotype frequencies for all genotyped SNPs included in the final analysis are summarized in Table II. For each of the successfully genotyped SNPs, we compared the corresponding platelet reactivity measurements (CEPI-CT and CADP-CT for PFA-100 and ARU for VerifyNow), serum LTB4 concentrations and urine concentrations of LTE4 data between three allelic groups (homozygotes for minor and major alleles, in addition to heterozygotes) using the non-parametric Kruskal-Wallis test. We observed no statistically significant differences in the platelet reactivity measurements and LTB4 or LTE4 concentrations for carriers and non-carriers of the investigated SNP variants (Table III). We did not observe any statistically significant results for groups of patients based on predefined cut-off values for platelet reactivity assays (CEPI-CT and ARU; data not shown).
Table IIFrequency of alleles and genotypes for single nucleotide polymorphisms (SNP) in the investigated group of patients. |
Table IIIEffect of various analyzed SNP genotypes in the LT pathway on platelet reactivity, LTB4 plasma levels and the urine excretion of LTE4 in diabetic patients on ASA therapy. |
Discussion
We genotyped 24 common SNPs within six genes associated with the metabolism of AA to LTs; six SNPs in ALOX5AP, three SNPs in ALOX5, three SNPs in ALOX12, two SNPs in ALOX15, one SNP in LTC4S and nine SNPs in LTAH4. In our study, no correlation was observed between the SNPs in candidate genes and measured platelet reactivity or metabolites of the LT pathway (LTB4 or LTE4) in a population of patients with T2DM. These findings suggest that no major effects of these genetic variations on inter-individual variations in platelet reactivity or LT pathway metabolites occur in the T2DM population.
The lack of correlation between SNPs within the LT metabolism pathway observed in our study does not exclude the role of the LT pathway metabolites in the pathogenesis of thrombosis. LTs posses an established role in a wide variety of inflammatory diseases, including asthma, allergic rhinitis, atherosclerotic cardiovascular disease (CVD), inflammatory bowel disease, multiple sclerosis and cancer (15–21). Moreover, Camacho et al(22) observed a significant genetic correlation between the expression of ALOX5AP and LTA4H and arterial thrombosis. The correlation between LTA4H and arterial thrombosis specifically highlights the role of LTB4 and leukocytes in cardiovascular events. However, analysis of correlation between LT traits and coagulation factors (factors IX, VII, VIII, XI, XII and fibrinogen) and platelet function (PFA-100 CEPI-CT and CADP-CT) revealed no correlation (22).
The lack of observed correlation between investigated SNPs in the LT pathway and platelet function phenotypes or LT concentrations in our study may be explained by a limited number of investigated variants, which represent only a small fraction of all previously documented variants in LOX pathway genes. Genotyped variants were selected on the basis of previous publications concerning mainly coronary artery disease (CAD) and MI (15–20,23–25). It is possible that selected variants may be involved in atherosclerosis and the risk of MI in studied population, through indirect association with platelet reactivity and the LT pathway. Certain variants, not investigated in our cohort, may affect the metabolism of the LT pathway and thus modify platelet reactivity and increase the risk of CAD and MI. Finally, the observed nominal statistically significant results may not have achieved statistical significance using multiple comparison correction due to the fact that the number of investigated patients was too small to obtain the true statistically significant results for a smaller than initially assumed OR.
The available results from previously published studies on the effect of genetic variations of the LT pathway on CAD, MI and stroke risk are inconsistent and depend on the analyzed population (15–20,22–25). As such, in other populations, the genetic variants investigated in our study may alter the risk of thrombosis associated with platelet functions. Furthermore, only patients with T2DM were included in our study, and we do not know if the lack of effect is related to the diabetic population and may become evident in other populations (CAD and non-diabetics).
A further limitation of our study is related to the choice of tests for measuring platelet reactivity. Light transmission aggregometry (LTA) is considered to be the ‘gold standard’ of platelet function tests, but it is poorly standardized, requires a specialist laboratory and is unlikely to be used widely in routine clinical practice (26). Thus, in our study, we assessed platelet reactivity by using three point-of-care tests (CEPI-CT and CADP-CT by PFA-100 and ARU by VerifyNow aspirin assay) that are used in multiple centers.
In conclusion, the results of our study failed to confirm whether the selected variants in genes within the LT metabolism pathway contribute to platelet reactivity in a diabetic population treated with ASA.
Acknowledgements
The authors would like to thank Thutrang Nguyen (Laboratory Manager) from the SNP Genotyping Core Facility at the Children’s Hospital, Boston, Massachusetts, USA, for performing the custom Sequenom iPLEX assay. Dr Postula was supported by a Fulbright Fellowship. The AVOCADO study was supported financially as part of the research grant from the Polish Pharmaceutical Company ADAMED for a Young Scientist 2007 Award (grant number: 1WR DAR1/2007) and the research grant of the National Centre for Science (grant number: 2011/01/N/NZ2/02987).
References
|
Mortensen SB, Larsen SB, Grove EL, Kristensen SD and Hvas AM: Reduced platelet response to aspirin in patients with coronary artery disease and type 2 diabetes mellitus. Thromb Res. 126:e318–e322. 2010. View Article : Google Scholar : PubMed/NCBI | |
|
Evangelista V, de Berardis G, Totani L, et al: Persistent platelet activation in patients with type 2 diabetes treated with low doses of aspirin. J Thromb Haemost. 5:2197–2203. 2007. View Article : Google Scholar : PubMed/NCBI | |
|
DiChiara J, Bliden KP, Tantry US, et al: The effect of aspirin dosing on platelet function in diabetic and nondiabetic patients: an analysis from the aspirin-induced platelet effect (ASPECT) study. Diabetes. 56:3014–3019. 2007. View Article : Google Scholar | |
|
Martel-Pelletier J, Lajeunesse D, Reboul P and Pelletier JP: Therapeutic role of dual inhibitors of 5-LOX and COX, selective and non-selective non-steroidal anti-inflammatory drugs. Ann Rheum Dis. 62:501–509. 2003. View Article : Google Scholar : PubMed/NCBI | |
|
Peters-Golden M and Henderson WR Jr: Leukotrienes. N Engl J Med. 357:1841–1854. 2007. View Article : Google Scholar | |
|
Johnson AD: The genetics of common variation affecting platelet development, function and pharmaceutical targeting. J Thromb Haemost. 9:246–257. 2011. View Article : Google Scholar : PubMed/NCBI | |
|
Postula M, Kaplon-Cieslicka A, Rosiak M, et al: Genetic determinants of platelet reactivity during acetylsalicylic acid therapy in diabetic patients: evaluation of 27 polymorphisms within candidate genes. J Thromb Haemost. 9:2291–2301. 2011. View Article : Google Scholar | |
|
Nielsen HL, Kristensen SD, Thygesen SS, et al: Aspirin response evaluated by the VerifyNow Aspirin System and light transmission aggregometry. Thromb Res. 123:267–273. 2008. View Article : Google Scholar : PubMed/NCBI | |
|
Postula M, Janicki PK, Rosiak M, et al: New single nucleotide polymorphisms associated with differences in platelets reactivity in patients with type 2 diabetes treated with acetylsalicylic acid: genome-wide association approach and pooled DNA strategy. J Thromb Thrombolysis. 36:65–73. 2013. View Article : Google Scholar | |
|
Renda G, Zurro M, Malatesta G, Ruggieri B and De Caterina R: Inconsistency of different methods for assessing ex vivo platelet function: relevance for the detection of aspirin resistance. Haematologica. 95:2095–2101. 2010. View Article : Google Scholar : PubMed/NCBI | |
|
Rosiak M, Postula M, Kaplon-Cieslicka A, et al: The effect of doubling the dose of acetylsalicylic acid (ASA) on platelet function parameters in patients with type 2 diabetes and platelet hyperreactivity during treatment with 75 mg of ASA: a subanalysis of the AVOCADO study. Kardiol Pol. 71(6): 552–557. 2013.PubMed/NCBI | |
|
Kunicki TJ, Williams SA, Salomon DR, et al: Genetics of platelet reactivity in normal, healthy individuals. J Thromb Haemost. 7:2116–2122. 2009. View Article : Google Scholar : PubMed/NCBI | |
|
Chakroun T, Addad F, Abderazek F, et al: Screening for aspirin resistance in stable coronary artery patients by three different tests. Thromb Res. 121:413–418. 2007. View Article : Google Scholar : PubMed/NCBI | |
|
Gonzalez-Conejero R, Rivera J, Corral J, Acuña C, Guerrero JA and Vicente V: Biological assessment of aspirin efficacy on healthy individuals: heterogeneous response or aspirin failure? Stroke. 36:276–280. 2005. View Article : Google Scholar : PubMed/NCBI | |
|
Zhang K, Wang YY, Liu QJ, et al: Two single nucleotide polymorphisms in ALOX15 are associated with risk of coronary artery disease in a Chinese Han population. Heart Vessels. 25:368–373. 2010. View Article : Google Scholar : PubMed/NCBI | |
|
Zhao J, He Z, Ma S and Li L: Association of ALOX15 gene polymorphism with ischemic stroke in Northern Chinese Han population. J Mol Neurosci. 47:458–464. 2012. View Article : Google Scholar : PubMed/NCBI | |
|
Helgadottir A, Gretarsdottir S, St Clair D, et al: Association between the gene encoding 5-lipoxygenase-activating protein and stroke replicated in a Scottish population. Am J Hum Genet. 76:505–509. 2005. View Article : Google Scholar : PubMed/NCBI | |
|
Helgadottir A, Manolescu A, Helgason A, et al: A variant of the gene encoding leukotriene A4 hydrolase confers ethnicity-specific risk of myocardial infarction. Nat Genet. 38:68–74. 2006. View Article : Google Scholar : PubMed/NCBI | |
|
Linsel-Nitschke P, Götz A, Medack A, et al: Genetic variation in the arachidonate 5-lipoxygenase-activating protein (ALOX5AP) is associated with myocardial infarction in the German population. Clin Sci (Lond). 115:309–315. 2008. View Article : Google Scholar : PubMed/NCBI | |
|
Hartiala J, Li D, Conti DV, et al: Genetic contribution of the leukotriene pathway to coronary artery disease. Hum Genet. 129:617–627. 2011. View Article : Google Scholar : PubMed/NCBI | |
|
Werz O and Steinhilber D: Therapeutic options for 5-lipoxygenase inhibitors. Pharmacol Ther. 112:701–718. 2006. View Article : Google Scholar : PubMed/NCBI | |
|
Camacho M, Martinez-Perez A, Buil A, et al: Genetic determinants of 5-lipoxygenase pathway in a Spanish population and their relationship with cardiovascular risk. Atherosclerosis. 224:129–135. 2012. View Article : Google Scholar : PubMed/NCBI | |
|
Burdon KP, Rudock ME, Lehtinen AB, et al: Human lipoxygenase pathway gene variation and association with markers of subclinical atherosclerosis in the diabetes heart study. Mediators Inflamm. 2010:1701532010. View Article : Google Scholar : PubMed/NCBI | |
|
Crosslin DR, Shah SH, Nelson SC, et al: Genetic effects in the leukotriene biosynthesis pathway and association with atherosclerosis. Hum Genet. 125:217–229. 2009. View Article : Google Scholar : PubMed/NCBI | |
|
Girelli D, Martinelli N, Trabetti E, et al: ALOX5AP gene variants and risk of coronary artery disease: an angiography-based study. Eur J Hum Genet. 15:959–966. 2007. View Article : Google Scholar : PubMed/NCBI | |
|
Michelson AD: Methods for the measurement of platelet function. Am J Cardiol. 103:20A–26A. 2009. View Article : Google Scholar : PubMed/NCBI |