Introduction
Lyme disease (LD) is an infectious disease caused by
the bacterium Borrelia burgdorferi (Bb), typically
transmitted to humans through the bites of infected ticks (1). In recent years, the incidence of LD
has significantly increased in the United States. According to
estimates from the Centers for Disease Control and Prevention, the
annual number of LD cases in the United States has increased to
~476,000, making it the most common tick-borne disease in the
country (2). The clinical
manifestations of LD are diverse, including skin rash, fever,
headache, joint pain, and, in severe cases, complications affecting
the nervous system, heart and joints (3).
Antibiotic treatment is currently the primary
strategy for controlling LD. The current treatment strategy is
effective in most cases; however, up to 17% of patients may still
have some symptoms a year after treatment (4). Additionally, numerous reports have
indicated that even after antibiotic treatment, Bb spirochetes can
have targeted and persistent effects on the host immune system
(5). Researchers have hypothesized
that Bb uses various strategies to evade and suppress the host
immune response, enabling it to persist within the human body for
an extended period, leading to chronic infection and persistent
symptoms. These strategies may include complement inhibition,
antigen variation, extracellular matrix degradation and host immune
dysregulation or suppression (6-8).
Owing to the complexity and diversity of Borrelia species,
the molecular mechanisms by which they modulate host immune
responses remain poorly understood. Further identification of novel
characteristic genes and virulence factors of Bb, as well as an
in-depth exploration of their interactions with the host immune
system, is of great significance for elucidating the pathogenesis
of LD, finding new therapeutic targets and developing effective
treatment strategies.
Glycolysis is a metabolic pathway that occurs in the
cytoplasmic matrix in which a series of enzymatic reactions break
down glucose molecules into pyruvate molecules, accompanied by the
production of a small amount of ATP (9). Substantial evidence has suggested
that glycolysis plays an important role in immune regulation.
During the immune response, immune cells such as macrophages,
dendritic cells and neutrophils rapidly activate glycolysis
(10,11). This metabolic shift helps immune
cells rapidly generate the energy and biosynthetic precursors
required to support their immune functions, such as cell
proliferation, differentiation, phagocytosis, cell migration and
secretion of inflammatory factors (12,13).
Excessive glycolysis can lead to an uncontrolled inflammatory
response (14,15). Studies have shown that inhibiting
glycolysis in immune cells can reduce inflammatory responses and
modulate immune functions, which have potential applications in the
treatment of autoimmune and chronic inflammatory diseases (16,17).
Changes in glycolysis have an important effect on
the pathogenesis of LD. Bb infection can significantly enhance the
glycolytic metabolism in host macrophages, leading to a weaker
inflammatory response, reduced cytokine release, and increased
survival and transmission of spirochetes within the host (18). Spirochetes also alter the protein
composition of the saliva of the tick vector, upregulating the
expression of glycolytic enzymes and providing more energy
substrates for their own benefit, thereby promoting their
colonization and replication at the tick bite site (19). Of note, inhibiting the glycolysis
of host cells or directly inhibiting the key glycolytic enzymes
(such as lactate dehydrogenase) of spirochetes can control the
infection process, alleviate the inflammatory response and modulate
host immune function, providing important clues for the development
of new treatment strategies for LD (20,21).
These findings reveal the critical role of glycolytic metabolism in
the pathogenesis of LD and provide a new perspective for a deeper
understanding of the disease mechanism.
In the present study, the differential expression of
glycolysis-related genes (GRGs) and the immune profile of
peripheral blood mononuclear cells (PBMCs) in individuals infected
with Bb were systematically analyzed. The least absolute shrinkage
and selection operator (LASSO) and support vector machine recursive
feature elimination (SVM-RFE) machine learning methods were used to
screened out risk characteristic genes, which were also validated
in an external dataset, and it was found that these genes could be
used to predict the occurrence of LD. Furthermore, a diagnostic
predictive nomogram model was constructed, consistent clustering,
immune infiltration and functional enrichment analyses of the
screened risk characteristic genes were performed, and a
competitive endogenous RNA (ceRNA) network and a drug-gene
interaction regulatory network were constructed. The present
results revealed the changes in GRG expression and immune profile
in host PBMCs caused by Bb infection, providing a new perspective
for understanding the pathogenesis of LD and potentially laying a
theoretical foundation for the development of personalized
treatment and immune regulation therapies for LD.
Methods
Data acquisition
The gene expression profiling datasets for
peripheral blood samples stimulated with Bb, GSE42606 (GPL10558
platform) and GSE63085 (GPL11154 platform), were retrieved from the
National Center for Biotechnology Information (NCBI) Gene
Expression Omnibus (GEO) database (https://www.ncbi.nlm.nih.gov/geo/). Specifically, the
GSE42606 dataset comprises 35 control samples (PBMCs from healthy
donors were stimulated with RPMI control for 24 h) and 36 diseased
samples (PBMCs from healthy donors were stimulated with Bb for 24
h). Although the data were derived from peripheral PBMCs rather
than isolated macrophages, peripheral PBMCs contained a significant
proportion of monocytes (macrophage precursors). The ex vivo
stimulation of PBMCs by Bb effectively captured the early systemic
activation and glycolytic shift of these innate immune cells, which
is consistent with previous reports of enhanced macrophage
glycolysis during Bb infection (18). The validation dataset (GSE63085)
included 13 healthy control PBMC samples and 28 PBMC samples from
patients with LD. The raw GEO data underwent normalization using R
software (version 4.2.1; R Foundation for Statistical Computing;
https://www.r-project.org/) and the
limma function ‘normalizeBetweenArrays’. A total of 200 GRGs
wereobtained from the HALLMARK_GLYCOLYSIS gene set in the Molecular
Signatures Database (MSigDB, v7.5.1; https://www.gsea-msigdb.org/gsea/msigdb). The gene
list of GRGs is provided in Table
SI. A comprehensive flowchart is shown in Fig. 1.
 | Figure 1Flow chart for bioinformatics
analysis of GRGs analysis in LD. GRGs, glycolysis-related genes;
LD, Lyme disease; GEO, Gene Expression Omnibus; GO, Gene Ontology;
KEGG, Kyoto Encyclopedia of Genes and Genomes; LASSO, Least
Absolute Shrinkage and Selection Operator; SVM-RFE, Support Vector
Machine-Recursive Feature Elimination; GSEA, Gene Set Enrichment
Analysis; GSVA, Gene Set Variation Analysis; ceRNA, competing
endogenous RNA; ROC, receiver operating characteristic; RT-qPCR,
reverse transcription-quantitative PCR. |
Identification of GRGs
Probe annotation was performed according to the
corresponding platform annotation file to map probe IDs to gene
symbols. For multiple probes mapping to the same gene symbol,
expression values were averaged using the avereps() function in the
limma package, so that each gene corresponded to a single
expression value for downstream analysis. Differential expression
analysis between normal and Bb-infected samples was then performed
using the ‘limma’ package (22)
with linear modeling and empirical Bayes moderation. P-values were
adjusted using the Benjamini-Hochberg method, and differentially
expressed genes (DEGs) with an adjusted P<0.05 and log2 fold
change (logFC) >0 were considered upregulated, while DEGs with
logFC <0 were considered downregulated.
Correlation between the GRGs
The correlation coefficient for GRGs expression was
computed and shown with the R package ‘corrplot’.
Gene ontology (GO) and Kyoto
encyclopedia of genes and genomes (KEGG) analysis
The GO and KEGG enrichment analyses were conducted
using the R package ‘clusterProfiler’ to explore the differential
signaling pathways and functions of the signature genes.
Machine learning algorithms
In the present study, two machine learning
algorithms were applied to identify hub genes: LASSO to select
important variables by shrinking the coefficients of less relevant
genes to zero and SVM-RFE to identify core genes by iteratively
removing less important features. To rigorously address potential
overfitting, a nested cross-validation (CV) framework was
implemented. Feature selection was performed by intersecting
results from LASSO (via ‘glmnet’, ‘lambda’ selected by minimum mean
squared error) and SVM-RFE (with linear kernel, 5 repeats of
10-fold CV) (23-26).
The feature sets from both methods were intersected to obtain the
final hub genes, which were visualized using a Venn diagram with
the ‘VennDiagram’ R package (27).
GSEA
The ‘c2.cp.kegg.v11.0. symbols’ gene set from MSigDB
was utilized as a reference for GSEA to investigate the biological
significance of key genes. GSEA was performed using the
‘clusterProfiler’ R package, with visualization supported by the
‘enrichplot’ package. A significance threshold of corrected
P<0.05 was established and 1,000 random sample alignments were
employed to normalize enrichment scores.
Immune cell infiltration and its
relationship with GRGs
Immune cell proportions were estimated using
CIBERSORT (28,29) with 1,000 permutations, and only
samples with P<0.05 were retained. Batch effects were corrected
to minimize platform-related bias, and P-values were adjusted for
multiple testing using the Benjamini-Hochberg method.
Box-and-whisker plots were generated with the ‘ggplot2’ R package
(30). To cross-validate the
results, xCell (https://xcell.ucsf.edu/) and Estimating the
Proportions of Immune and Cancer cells (https://github.com/GfellerLab/EPIC) methods were
applied. Correlations between GRG expression and immune cell
fractions were calculated using the ‘limma’, ‘dplyr’, ‘linkET’ and
‘ggplot2’ packages. Differences across groups were assessed with
the Wilcoxon test and visualization was performed using boxplots
and principal component analysis (PCA) in ‘ggplot2’.
Gene set variation analysis
(GSVA)
The ‘c5.go.symbols’ file and the
‘c2.cp.kegg.symbols’ file were procured from the GSVA section of
the MSigDB database. Subsequently, the R packages ‘GSVA’ and
‘limma’ were employed to examine the altered pathways and
biological functions (31,32) among the different clusters
categorized by high and low expression levels of specific GRGs.
Construction of competing endogenous
(ce)RNA regulatory networks
Databases, including miRanda algorithm (33,34),
miRDB (https://mirdb.org/) and TargetScan (https://www.targetscan.org/), were used to predict the
interactions between noncoding (nc)RNAs and mRNAs. In order to
visualize and elucidate the interactions present within the ceRNA
network, which encompasses long ncRNA-microRNA-mRNA interactions,
Cytoscape (version 3.10.2; https://cytoscape.org/) was used to construct and
visualize the network.
Validation of key genes in an
independent cohort and nomogram construction
Candidate gene expression was further validated in
an independent external cohort (GSE63085). After probe averaging
with avereps(), the expression matrix was normalized using the
limma package, and expression differences between control and LD
samples were visualized and statistically compared. A logistic
regression model based on the final key genes [lactate
dehydrogenase A (LDHA) and thioredoxin (TXN)] was then established
and visualized as a nomogram using the ‘rms’ package. Model
performance was evaluated by receiver operating characteristic
(ROC) analysis using ‘pROC’, and the area under the ROC curve (AUC)
with 95% CI was estimated by 1,000 bootstrap resamples (35,36).
Predicted probabilities were generated with plogis and shown in the
nomogram (37). Model performance
was evaluated by outer 5-fold cross-validation. Out-of-fold
predictions were pooled for discrimination, calibration and
decision curve analysis (DCA). Although an inner repeated 10-fold
cross-validation scheme (3 repeats) was predefined, no further
tuning or feature selection was performed because LDHA and TXN were
fixed in advance. Performance was assessed by fold-specific AUCs,
mean outer-fold AUC and pooled out-of-fold ROC with a bootstrap 95%
CI. The final nomogram was fitted on the full dataset for
visualization.
Experimental validation of key genes
via reverse transcription-quantitative RT-qPCR
THP-1 human monocytic leukemia cells (ATCC TIB-202;
American Type Culture Collection) were cultured in RPMI 1640 medium
supplemented with 10% fetal bovine serum (cat. no. DT-500-S;
DearyTech; official website: http://www.dearybio.cn/) and 1% antibiotic-antimycotic
(cat. no. 15240062; Gibco; Thermo Fisher Scientific, Inc.) at 37˚C
under 5% CO2. For differentiation, the cells were plated
and treated with 100 ng/ml phorbol 12-myristate 13-acetate for 24 h
and then incubated overnight for the resting stage. Differentiated
cells were subsequently infected with Bb strain B31 (ATCC
35210; American Type Culture Collection) at a multiplicity of
infection of 0.1 or treated with vehicle control (PBS) for 24 h.
Samples were collected and stored at -80˚C until processing. Total
RNA was extracted using the MolPure® Cell/Tissue Total
RNA Kit (cat. no. 19221ES50; Yeasen Biotechnology Co., Ltd.)
according to the manufacturer's instructions. cDNA was then
synthesized using the Hifair® III 1st Strand cDNA
Synthesis SuperMix for qPCR (cat. no. 11141ES60; Yeasen
Biotechnology Co., Ltd.) following the manufacturer's instructions.
Quantitative real-time PCR was performed using the Gentier 96R
System (Xi'an Tianlong Science and Technology Co., Ltd.) with Hieff
UNICON® Universal Blue qPCR SYBR Master Mix (cat. no.
11184ES08; Yeasen Biotechnology Co., Ltd) according to the
manufacturer's instructions, under the following conditions: 95˚C
for 2 min; 40 cycles of 95˚C for 1 sec and 60˚C for 30 sec. GAPDH
was used as the internal control. Gene expression was analyzed in
three independent experiments via the 2-ΔΔCq (38,39)
method using primers designed by Tsingke Biotechnology (sequences
shown in Table I).
 | Table IPrimer sequences for reverse
transcription-quantitative PCR. |
Table I
Primer sequences for reverse
transcription-quantitative PCR.
| Gene | Forward
(5'-3') | Reverse
(3'-5') |
|---|
| LDHA |
ACCGTGTTATTGGAAGCGGT |
CTCCATGTTCCCCAAGGACC |
| TXN |
GGTGAAGCAGATCGAGAGCA |
CCACGTGGCTGAGAAGTCAA |
| GAPDH |
TGTTGCCATCAATGACCCCT |
TCGCCCCACTTGATTTTGGA |
Measurement of extracellular glucose
(GLU) and lactate (LAC)
Using the same THP-1 differentiation and Bb
infection protocol described above, culture supernatants were
collected for GLU and LAC measurement. GLU levels were determined
using a GLU assay kit (cat. no. A154-1-1; Nanjing Jiancheng
Bioengineering Institute), according to the manufacturer's
instructions. LAC levels were measured using a Lactic Acid assay
kit (cat. no. A019-2-2; Nanjing Jiancheng Bioengineering
Institute), according to the manufacturer's instructions. For GLU
measurement, 2.5 µl of each supernatant sample was added to a
96-well plate, followed by 200 µl of working solution, incubation
at 37˚C for 10 min and absorbance measurement at 505 nm. For LAC
measurement, 2.5 µl of each sample was added to a 96-well plate,
followed by incubation with reagent 1 at 37˚C for 3 min and
absorbance measurement at 546 nm (A1) using a microplate reader.
Reagent 2 was then added, followed by further incubation at 37˚C
for 5 min and a second absorbance reading at 546 nm (A2) using a
microplate reader. GLU and LAC concentrations were calculated
according to the manufacturers' instructions.
Evaluation of applicant drugs
Drug molecules were identified using the Drug
Signatures Database (DSigDB) through Enrichr, focusing on the key
GRGs in the DEGs (40). Enrichr is
a prominent web portal that features diverse gene set libraries for
genome-wide gene set enrichment exploration (41). DSigDB functions as a global
repository for identifying targeted drug substances associated with
DEGs. The database comprises 22,527 gene sets. Access to DSigDB is
facilitated via Enrichr under the Diseases/Drugs function (42). To strengthen the biological
plausibility of the predicted drug-gene associations,
cross-database validation was performed using multiple publicly
available interaction resources, including the Comparative
Toxicogenomics Database (CTD; https://ctdbase.org/), BioGRID (https://thebiogrid.org/), STRING (https://string-db.org/) and DrugBank (https://go.drugbank.com/).
Statistical analysis
Statistical analyses were used to determine data
normality. For normally distributed data, an independent Student's
t-test was used for comparison. For non-normally distributed data,
the Mann-Whitney U-test was used for comparison. P<0.05 was
considered to indicate a statistically significant difference
between groups. Analyses and visualizations were performed using R
(version 4.2.1) and GraphPad Prism (version 9.0.0; Dotmatics). The
key analysis parameters and software package information are
summarised in Table SIX.
Results
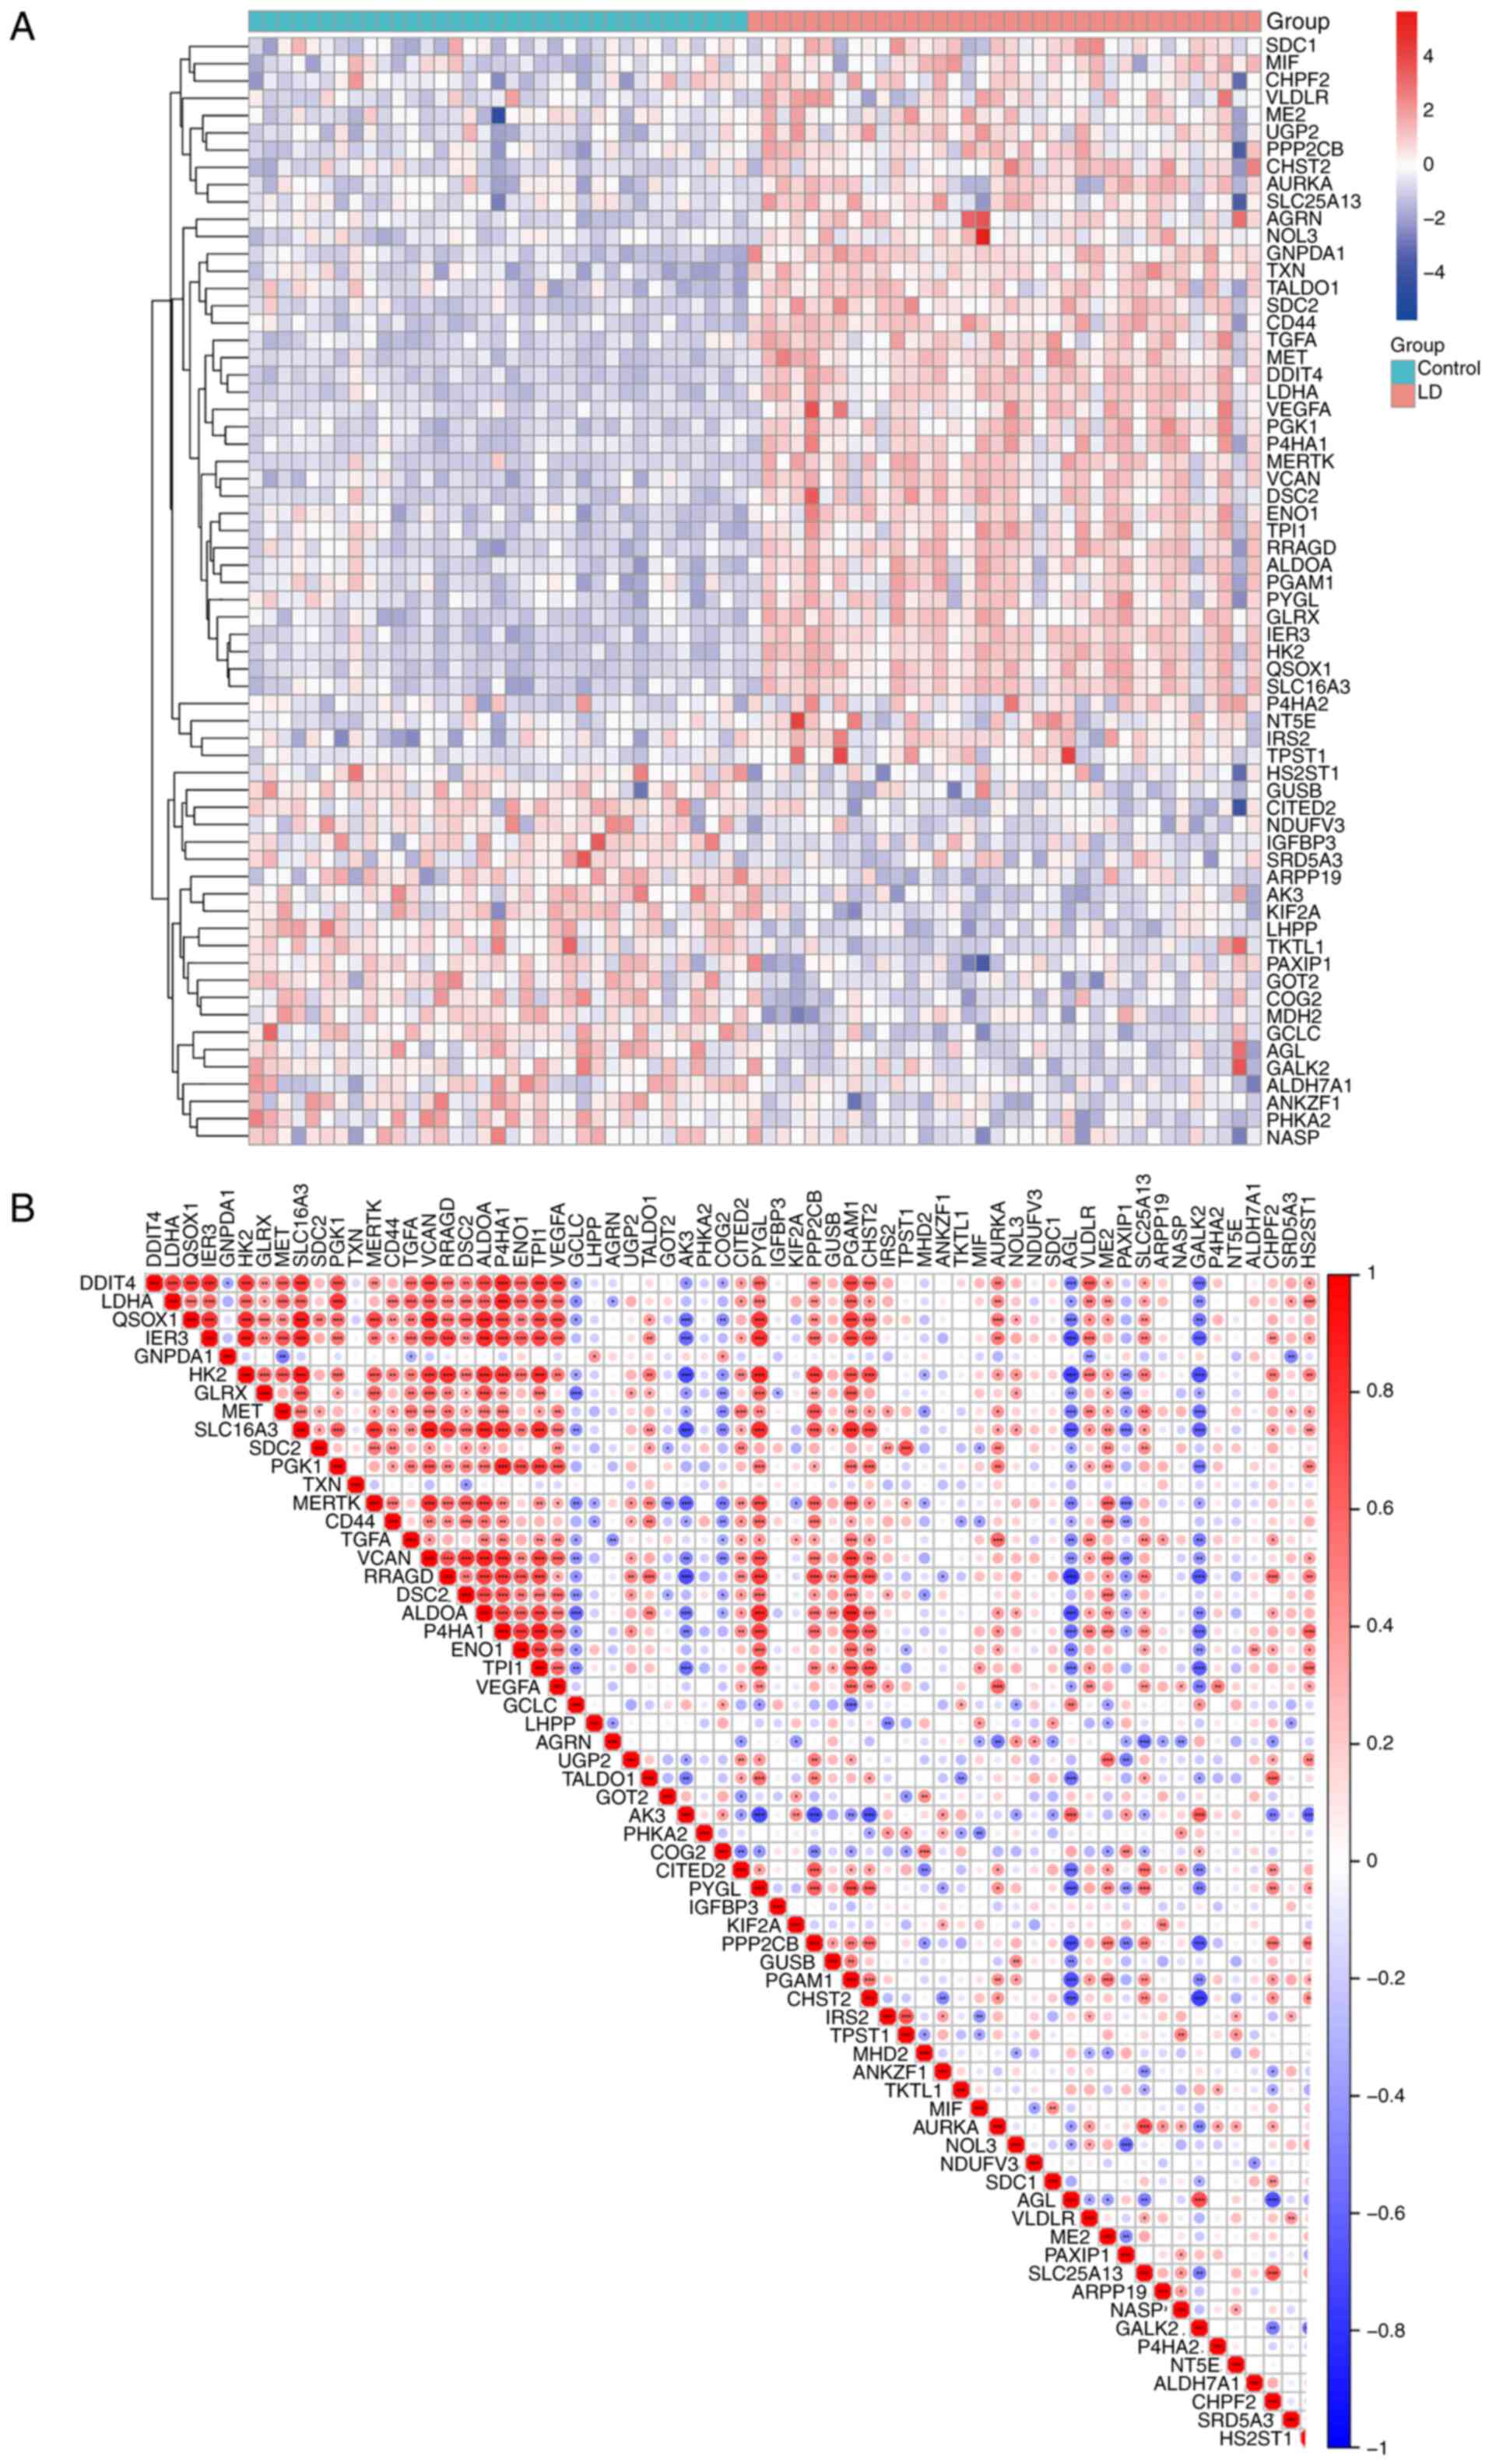
Expression profiles of GRGs in LD
To investigate the function of GRGs following Bb
infection, their modified expression was comprehensively assessed
using the GSE42606 database. The findings revealed significant
alterations in the expression profiles of 63 GRGs, with 43
demonstrating upregulation in transcription and 20 exhibiting
downregulation in expression (Fig.
2A). A list of the 63 significantly differentially expressed
GRGs is provided in Table SII. A
correlation analysis of these differentially expressed GRGs was
simultaneously performed to examine their complex interactions
(Fig. 2B). It became apparent that
certain GRGs exhibit notable synergistic and antagonistic
effects.
GO and KEGG analysis
The KEGG pathway analysis (Fig. 3A) of the 63 GRGs revealed
significant enrichment in pathways such as ‘Carbon metabolism’,
‘Glycolysis/Gluconeogenesis’, ‘Biosynthesis of amino acids’ and the
‘HIF-1 signaling pathway’. Enriched GO term analysis (Fig. 3B) highlighted the association of
these genes with terms such as ‘monosaccharide metabolic process’
(GO:0005996), ‘carbohydrate catabolic process’ (GO:0016052) and
‘pyridine nucleotide metabolic process’ (GO:0019362). These
findings suggest that there may be alterations in carbon metabolism
in patients with LD compared with healthy individuals.
Machine learning algorithms
Considering the distinct differences between LD and
controls, meaningful key genes were screened in the training
dataset using two machine learning algorithms (LASSO and SVM-RFE)
to differentiate Bb-infected samples. In the LASSO algorithm, 8 out
of 63 GRGs were selected (Fig. 3C
and D). Using the SVM-RFE
algorithm, 14 GRGs were identified (maximum precision=0.957,
minimum RMSE=0.0429) (Fig. 3E and
F). Finally, the results of the
two machine learning algorithms were combined with two genes
identified as key genes (LDHA and TXN) (Fig. 3G).
GSEA of key genes
Because the potential function of key genes in LD is
unknown, GSEA revealed their role and significance in LD. The first
six pathways associated with the enrichment of their key genes
(LDHA and TXN) are shown in Fig.
4A and B. The GSEA results
indicated that LDHA-related genes were significantly enriched in
several important pathways, including the ‘chemokine signaling
pathway’, ‘cytokine-cytokine receptor interaction’ and ‘lysosomes’.
Similarly, TXN-related genes were significantly enriched in
‘chemokine signaling’, ‘cytokine-cytokine receptor interactions’
and ‘graft-vs.-host disease’ pathways. These findings highlight the
involvement of LDHA and TXN in immune responses, intracellular
signaling and inflammation-related processes.
GSVA
Subsequently, GSVA was performed using KEGG and GO
gene sets to evaluate differences in pathway activity between the
high- and low-expression groups. GSVA using KEGG gene sets revealed
that no pathways were significantly enriched in the LDHA
high-expression group compared to the low-expression group.
However, multiple metabolic pathways had significantly lower
enrichment scores. Specifically, ‘Pantothenate and CoA
biosynthesis’, ‘Biosynthesis of unsaturated fatty acids’, ‘Steroid
biosynthesis’ and ‘Valine, leucine and isoleucine degradation’ were
downregulated. In addition, ‘Amino sugar and nucleotide sugar
metabolism’ and glycosaminoglycan biosynthesis-related pathways,
including ‘Glycosaminoglycan biosynthesis-chondroitin
sulfate/dermatan sulfate’ and ‘Glycosaminoglycan
biosynthesis-heparan sulfate/heparin’, were reduced. Several
immune- and stress-related pathways, including the ‘NOD-like
receptor signaling pathway’ and ‘Apoptosis’, also exhibited
decreased enrichment (Fig. 5A). In
the TXN high-expression group, KEGG analysis showed decreased
enrichment in ‘O-glycan biosynthesis’ and the ‘one-carbon pool by
folate’ compared to the low-expression group (Fig. 5B).
GO-based GSVA produced fewer and more heterogeneous
signals, several of which were not readily interpretable in the
PBMC context. Therefore, these results are provided in the
Supplementary Materials and were not over-interpreted in the main
text (Fig. S1).
Immune cell infiltration analysis
Employing CIBERSORT, the immunological disparities
between the LD and control groups were examined. PCA revealed a
striking non-overlapping configuration of elliptical clusters,
illustrating distinct immune cell infiltration patterns between the
LD and control groups (Fig. 6A).
Comparative analysis revealed that, compared with the control
cohort, the immunocellular landscape in the LD group showed
elevated proportions of memory B lymphocytes, regulatory T cells
(Tregs), M0 macrophages, activated dendritic cells, activated mast
cells and neutrophils. Conversely, the proportions of CD8+ T
lymphocytes, resting memory CD4+ T cells, activated natural killer
cells, M2 macrophages and resting mast cells were significantly
lower in the LD cohort than those in the control group (Fig. 6B). The quality control filtering
results for the CIBERSORT analysis are presented in Table SIII. The final immune cell
composition data are provided in Table SIV. Furthermore, an in-depth
investigation of the interrelationship between these pivotal
characteristic genes and the immunological microenvironment was
conducted. Notable findings included a strong positive correlation
between LDHA and Tregs (r=0.33, P=0.05), a negative correlation
with gamma delta T cells (r=-0.34, P=0.042) and a negative
correlation with CD4 memory resting T cells (r=-0.4, P=0.016). TXN
expression was significantly and negatively correlated with
monocytes (r=-0.36, P=0.03) (Fig.
6C and D).
Drug-gene interaction network and
cross-database validation of drug-gene interactions
To explore the potential therapeutic modulation of
glycolytic dysregulation in LD, a drug-gene enrichment analysis was
performed using DSigDB via the Enrichr platform. It is important to
emphasize that these analyses were intended for hypothesis
generation rather than direct therapeutic inference. A total of 6
candidate small molecules were identified based on the enrichment
of the two hub genes (LDHA and TXN). The interaction network was
visualized using Cytoscape (Fig.
7A). Fig. 7B shows the most
effective drug. Detailed evidence of the cross-database
interactions is provided in Table
SV.
Hypothesis-generating ceRNA regulatory
framework
To further explore the potential
post-transcriptional regulatory mechanisms, a ceRNA network
integrating the predicted lncRNA-miRNA-mRNA interactions was
constructed using miRanda, miRDB and TargetScan. The network
comprised 2 hub genes, 26 predicted miRNAs and 34 lncRNAs. This
ceRNA framework is based solely on in silico target
prediction and lacks matched miRNA and lncRNA expression data from
the same PBMC cohort. Therefore, the current network can be
regarded as a regulatory hypothesis map rather than a validated
ceRNA axis (Fig. 7C).
Diagnostic modeling
A diagnostic prediction model for LD was created
based on the hub genes LDHA and TXN in the training set (GSE42606).
ROC curve analysis was conducted and the AUC values for LDHA and
TXN were 0.975 and 0.934, respectively (Fig. 8A), indicating that both genes had
strong diagnostic potential for LD. The diagnostic model based on
these two genes showed robust performance, with an AUC of 0.974
(95% CI, 0.918-1.000) (Fig. 8B),
demonstrating a strong predictive ability. Importantly, the
LDHA-TXN logistic regression model retained good discriminative
performance in the validation analysis-in the external validation
set (GSE63085), the AUC values for LDHA and TXN were 0.826 and
0.874, respectively (Fig. 8C), ROC
curve analysis was conducted, with an AUC of 0.879 (95% CI,
0.761-0.967) (Fig. 8D). Using
case=1 as the positive class, the model achieved an accuracy of
0.805, a sensitivity of 0.857 and a specificity of 0.692. Detailed
classification metrics are provided in Table SVI, with related analytical
procedures and validation results described in Data S1, and detailed ROC analysis shown
in Fig. S2.
 | Figure 8ROC curve, calibration plot and
decision curve analysis of the LDHA-TXN model. (A) ROC curves of
the two individual key genes, LDHA and TXN, in the GSE42606 cohort.
The corresponding AUC values are shown in the panel. (B) ROC curve
of the combined two-gene diagnostic model constructed using LDHA
and TXN in the GSE42606 cohort. The AUC and 95% CI are indicated in
the figure. (C) ROC curves of the individual genes LDHA and TXN in
the independent validation cohort GSE63085, showing their
diagnostic performance in external validation. (D) ROC curve of the
combined two-gene diagnostic model in the independent validation
cohort GSE63085. The AUC and 95% CI are shown in the panel. (E)
Calibration curve of the nomogram/model. (F) DCA of the two-gene
model. The red line represents the net benefit of the model, while
the gray and black lines represent the strategies of treating all
patients or none, respectively. (G) Nomogram constructed based on
LDHA and TXN for individualized prediction of Lyme disease risk. In
the nomogram, each variable corresponds to a score and the total
score can be calculated by summing the scores of all variables. The
ROC curve, calibration plot, and DCA shown were generated from
pooled out-of-fold predictions obtained during outer 5-fold
cross-validation, whereas the nomogram was fitted on the full
dataset after validation for visualization only. ROC, receiver
operating characteristic; AUC, area under curve; CV,
cross-validation; DCA, decision curve analysis; OOF,
out-of-fold. |
Calibration curves confirmed that the nomogram
accurately estimated the probability of robust host response to Bb
exposure (Fig. 8E). The DCA
further indicated that patients with LD could benefit from this
nomogram (Fig. 8F). Detailed
performance metrics are provided in Table SVII, whereas the related
validation results and calibration/decision curve analyses are
described separately in Data S1.
A prediction model for diagnosing LD was developed using these
trait genes, with each factor assigned a specific score, and a
linear point axis was used to compute the total score associated
with different levels of LD risk (Fig.
8G). Table SVIII shows the
detailed coefficients of the 2-gene logistic regression diagnostic
model.
Validation of key genes in an
independent cohort
In the training set (GSE42606), the expression of
LDHA was significantly higher in the disease group than that in the
control group, whereas TXN showed significantly elevated expression
in the disease group (Fig. 9A and
B). To further validate these
findings, the diagnostic performance of the model was tested using
a validation set (GSE63085). In the validation set, LDHA and TXN
showed significantly higher expression in LD samples than in
controls (Fig. 9C and D).
Experimental validation of key gene
expression by RT-qPCR
The expression levels of hub genes were also
validated in THP-1 macrophages from both control and Bb-infected
groups. The RT-qPCR results indicated that LDHA and TXN levels were
significantly higher in the Bb-infected group than in the control
group (Fig. 9E and F).
Glycolysis-related metabolic
changes
To further verify whether Bb infection induced
glycolytic changes in THP-1 cells, extracellular GLU and LAC levels
were measured after Bb stimulation. Compared with the control
group, Bb-infected THP-1 cells showed a decrease in extracellular
GLU and a significant increase in LAC concentration in the
supernatant (Fig. 9G and H).
Discussion
Glycolysis is a central metabolic pathway that
provides energy to immune cells and plays a critical role in
regulating immune responses and inflammation. Dysregulated
glycolytic activity disrupts immune homeostasis and contributes to
chronic inflammatory states (43-45).
In addition, metabolic reprogramming of glycolysis is closely
linked to macrophage polarization, with pro-inflammatory M1
macrophages primarily relying on glycolysis, whereas
anti-inflammatory M2 macrophages depend more on oxidative
phosphorylation (46-48).
In the present study, 63 of the 200 GRGs were significantly altered
following Bb infection, suggesting that host cells dynamically
regulate glycolytic pathways during infection. Using the LASSO and
SVM-RFE algorithms, two feature genes, LDHA and TXN, were further
identified, which show transcriptional response signatures linked
to Bb infection.
Previous studies have suggested that the
pathophysiology of LD is significantly influenced by glycolysis
(21), and constructing a
predictive model based on GRGs is a promising approach to elucidate
the etiology of LD and guide novel therapeutic strategies. In the
present study, bioinformatics identified LDHA and TXN as key genes
in the LD diagnostic model. Notably, beyond transcriptomic
screening, it was observed that Bb infection was associated with
reduced extracellular GLU and increased LAC production, providing
experimental support that Bb infection is associated with
glycolytic activation in host monocyte/macrophage-like cells.
Within this framework, LDHA is mechanistically well aligned with
the observed phenotype, as it occupies a central position in LAC
metabolism, glycolytic flux and immune regulation. Increased LDHA
expression and elevated serum LAC levels have been observed in
patients with Lyme borreliosis (18), and enhanced glycolytic activity in
macrophages, accompanied by the upregulation of GRGs, including
LDHA, suggests a role for metabolic reprogramming in the immune
response to infection (49).
Furthermore, Bb relies on its own lactate dehydrogenase (BbLDH) to
maintain the NADH/NAD+ balance, which is essential for
bacterial survival and infectivity, and inhibition of BbLDH
effectively suppresses pathogen growth (50). LDH has also been reported to
inhibit growth in vitro, highlighting its central role in
pathogen metabolism during LD (21). LDHA-driven glycolytic remodeling
has also been linked to pro-inflammatory immune programs, including
Th17-associated responses (51).
By contrast, TXN is not a canonical glycolytic enzyme, but rather a
redox regulator induced under infection and inflammatory stress
(52-54).
Its identification therefore suggests that the LD-associated
transcriptional program extends beyond glycolysis itself and
includes adaptive redox control. Consistent with this
interpretation, GSEA revealed that both LDHA and TXN were
associated with chemokine signaling and cytokine-cytokine receptor
interaction pathways, which are central features of LD
immunopathology (55-60).
Together, these data support a model in which LDHA and TXN reflect
two interconnected layers of the host response to Bb
infection-metabolic activation and redox-inflammatory
regulation-and may therefore serve as candidate biomarkers
indicative of host response to Bb.
The relationship between diagnostic signature genes
and immune cell infiltration was also examined. LDHA expression was
positively correlated with Tregs and negatively correlated with γδ
T cells and CD4 memory resting T cells, whereas TXN was negatively
correlated with monocytes. These associations suggest that immune
cell populations play a role in LD pathogenesis. Treg cells have
been shown to mitigate arthritis symptoms (61,62),
while γδ T cells are critical for promoting adaptive immune
responses in Bb-infected mice, enhancing dendritic cell expression
in lymph nodes and facilitating CD4+ T and B cell responses,
thereby contributing to bacterial control and reduction of cardiac
inflammation (63). Although
direct evidence linking CD4 memory resting T cells to LD is
lacking, multiple studies have reported that infection activates
CD4+ T cells and promotes their migration to infected tissues to
participate in inflammatory responses (64). Monocytes are directly activated by
live Bb, inducing robust inflammatory responses including TNF-α,
IL-6, IL-10 and IFN-β production, highlighting their role as key
effector cells in LD immunity (65). Additionally, TXN can act as a
chemotactic factor for monocytes, neutrophils and T cells,
emphasizing its potential role in immune cell recruitment and
regulation of inflammatory responses (52). Collectively, these findings suggest
that LDHA and TXN may influence the pathogenesis of LD, partly by
modulating immune cell infiltration.
Furthermore, these feature genes were analyzed by
constructing a ceRNA network and predicting candidate drugs,
thereby providing possible directions for future investigation of
glycolysis-related regulatory mechanisms and immunotherapy for
glycolytic abnormalities in LD. As both the drug-gene interaction
analysis and ceRNA network construction were computationally
inferred, a validation framework was proposed to improve
translational relevance. First, an in vitro Bb infection
model using THP-1-derived macrophages or primary PBMCs was
established (51,55,62,66),
followed by treatment with candidate drugs at graded
concentrations. The key evaluation endpoints included inflammatory
cytokine levels (67), glycolytic
flux (9), LAC production (49) and changes in LDHA and TXN
expression. Secondly, immune phenotype modulation can be assessed
using macrophage polarization markers (68-70).
Third, transcriptomic profiling after efficient drug treatment
could determine whether the predicted glycolysis-immune axis is
restored to a non-inflammatory state.
This study has several limitations. First, the
present analyses were based on ex vivo peripheral PBMC
stimulation models rather than on transcriptomic data from patients
with clinical LD. As only a single 24-h time-point was examined,
the identified two-gene signature likely reflects an early acute
infection-related response rather than a definitive diagnostic
model and may not be generalizable to chronic or late-stage LD.
Secondly, several confounding factors should be considered.
Inter-individual variation in the basal immune status of PBMC
donors may have affected the stability of the machine learning
models, whereas the public blood-derived datasets lacked sufficient
geographical and ethnic diversity and did not capture localized
immune features of affected tissues, such as skin or synovial
fluid. Although correlations between these key genes and immune
cell infiltration were observed, the underlying molecular
mechanisms remain elusive. Finally, the present THP-1 experiments
should be interpreted as preliminary monocyte-lineage validation of
hub-gene expression trends. Further validation in primary cells and
independent clinical cohorts will be an important direction of
future work.
In conclusion, in the present study, the role of
GRGs in LD was investigated. Bb infection induces significant
alterations in host glycolytic gene expression, highlighting the
importance of metabolic reprogramming in the immune response. Using
integrated machine-learning analysis, two key feature genes, LDHA
and TXN, were identified as having potential predictive value of Bb
infection and were associated with immune infiltration. Abnormal
immune cell infiltration was observed in PBMC following Bb
infection, and the expression of these genes correlated with
variations in immune cell proportions. In addition, several
potential small-molecule candidates that target glycolytic
dysregulation were identified. Collectively, these findings provide
new insights into the metabolic-immune interactions underlying LD
and may contribute to future diagnostic strategies and targeted
therapeutic development.
Supplementary Material
Supplementary methods
GO-based GSVA between the high- and
low-expression groups of LDHA and TXN. (A) GO-based GSVA results
comparing the LDHA high- and low-expression groups. (B) GO-based
GSVA results comparing the TXN high- and low- expression groups.
GO, Gene Ontology; GSVA, gene set variation analysis; LDHA, lactate
dehydrogenase A; TXN, thioredoxin.
Validation performance of the LDHA-TXN
model. In the validation analysis, the LDHA-TXN logistic regression
model demonstrated good discriminative ability, with an AUC of
0.879 (95% CI, 0.761-0.967). When case=1 was treated as the
positive class, the confusion matrix showed 24 true-positives, 9
true-negatives, 4 false-positives and 4 false-negatives. The
overall accuracy was 0.805 (95% CI, 0.651-0.912), with a κ value of
0.549. The sensitivity was 0.857, the specificity was 0.692, the
positive predictive value was 0.857, the negative predictive value
was 0.692 and the balanced accuracy was 0.775. LDHA, lactate
dehydrogenase A; TXN, thioredoxin.
200 glycolysis-related genes.
List of 63 glycolysis-related genes
and their direction.
CIBERSORT sample filtering results for
immune infiltration analysis.a
Relative proportions of 22 immune cell
types in samples retained after CIBERSORT filtering.
Cross-database validation of candidate
drug-gene interactions.
Classification performance of the
lactate dehydrogenase A-thioredoxin logistic regression model in
the validation analysis.
Performance of the lactate
dehydrogenase A-thioredoxin logistic regression model in the outer
five-fold cross-validation framework.
Coefficients of the revised two-gene
logistic regression diagnostic model.
Key analysis parameters and
software/package information used in this study.a
Acknowledgements
The authors extend their sincere appreciation to
Professor Yiqun Kuang for graciously facilitating access to the
Biosafety Laboratory at the Research Center for Clinical Medicine
within the First Affiliated Hospital of Kunming Medical University
(Kunming, China).
Funding
Funding: The study was supported by the Yunnan Fundamental
Research Projects (grant no. 202301BE070001-036) and the internal
projects of the First People's Hospital of Anning, affiliated with
Kunming University of Science and Technology (grant nos. 2024AYY001
and 2024AYY005).
Availability of data and materials
The data generated in the present study may be
requested from the corresponding author.
Authors' contributions
YD and YC contributed equally to this work. YD, YC
and GZ conceived and designed the study. YL, ML, CS, XC, FY and QL
performed the experiments and collected the data. YD, YC and YL
analyzed and interpreted the data. YD and YC drafted the
manuscript. GZ critically revised the manuscript and supervised the
study. YD and GZ checked and confirmed the authenticity of the raw
data. All authors have read and approved the final manuscript.
Ethics approval and consent to
participate
Not applicable.
Patient consent for publication
Not applicable.
Competing interests
The authors declare that they have no competing
interests.
References
|
1
|
Steere AC, Strle F, Wormser GP, Hu LT,
Branda JA, Hovius JW, Li X and Mead PS: Lyme borreliosis. Nat Rev
Dis Primers. 2(16090)2016.PubMed/NCBI View Article : Google Scholar
|
|
2
|
Kugeler KJ, Schwartz AM, Delorey MJ, Mead
PS and Hinckley AF: Estimating the frequency of Lyme disease
diagnoses, United States, 2010-2018. Emerg Infect Dis. 27:616–619.
2021.PubMed/NCBI View Article : Google Scholar
|
|
3
|
Cardenas-de LGJ, De la Cruz-Valadez E,
Ocampo-Candiani J and Welsh O: Clinical spectrum of Lyme disease.
Eur J Clin Microbiol Infect Dis. 38:201–208. 2019.PubMed/NCBI View Article : Google Scholar
|
|
4
|
Wormser GP, Ramanathan R, Nowakowski J,
McKenna D, Holmgren D, Visintainer P, Dornbush R, Singh B and
Nadelman RB: Duration of antibiotic therapy for early Lyme disease:
A randomized double-blind placebo-controlled trial. Ann Intern Med.
138:697–704. 2003.PubMed/NCBI View Article : Google Scholar
|
|
5
|
Bockenstedt LK, Gonzalez DG, Haberman AM
and Belperron AA: Spirochete antigens persist near cartilage after
murine Lyme borreliosis therapy. J Clin Invest. 122:2652–2660.
2012.PubMed/NCBI View
Article : Google Scholar
|
|
6
|
Williams MT, Zhang Y, Pulse ME, Berg RE
and Allen MS: Suppression of host humoral immunity by Borrelia
burgdorferi varies over the course of infection. Infect Immun.
92(e00018)2024.PubMed/NCBI View Article : Google Scholar
|
|
7
|
Kraiczy P: Hide and seek: How Lyme disease
spirochetes overcome complement attack. Front Immunol.
7(385)2016.PubMed/NCBI View Article : Google Scholar
|
|
8
|
Elsner RA, Hastey CJ, Olsen KJ and
Baumgarth N: Suppression of long-lived humoral immunity following
Borrelia burgdorferi infection. PLoS Pathog.
11(e1004976)2015.PubMed/NCBI View Article : Google Scholar
|
|
9
|
Soto-Heredero G, Gómez DLHM,
Gabandé-Rodríguez E, Oller J and Mittelbrunn M: Glycolysis: A key
player in the inflammatory response. FEBS J. 287:3350–3369.
2020.PubMed/NCBI View Article : Google Scholar
|
|
10
|
O'Neill LA and Pearce EJ: Immunometabolism
governs dendritic cell and macrophage function. J Exp Med.
213:15–23. 2016.PubMed/NCBI View Article : Google Scholar
|
|
11
|
Ye L, Jiang Y and Zhang M: Crosstalk
between glucose metabolism, lactate production and immune response
modulation. Cytokine Growth Factor Rev. 68:81–92. 2022.PubMed/NCBI View Article : Google Scholar
|
|
12
|
Pearce EL and Pearce EJ: Metabolic
pathways in immune cell activation and quiescence. Immunity.
38:643. 2013.PubMed/NCBI View Article : Google Scholar
|
|
13
|
Buck MD, Sowell RT, Kaech SM and Pearce
EL: Metabolic instruction of immunity. Cell. 169:570–586.
2017.PubMed/NCBI View Article : Google Scholar
|
|
14
|
Pålsson-McDermott EM and O'Neill L:
Targeting immunometabolism as an anti-inflammatory strategy. Cell
Res. 30:300–314. 2020.PubMed/NCBI View Article : Google Scholar
|
|
15
|
Kornberg MD, Bhargava P, Kim PM, Putluri
V, Snowman AM, Putluri N, Calabresi PA and Snyder SH: Dimethyl
fumarate targets GAPDH and aerobic glycolysis to modulate immunity.
Science. 360:449–453. 2018.PubMed/NCBI View Article : Google Scholar
|
|
16
|
Shirai T, Nazarewicz RR, Wallis BB, Yanes
RE, Watanabe R, Hilhorst M, Tian L, Harrison DG, Giacomini JC,
Assimes TL, et al: The glycolytic enzyme PKM2 bridges metabolic and
inflammatory dysfunction in coronary artery disease. J Exp Med.
213:337–354. 2016.PubMed/NCBI View Article : Google Scholar
|
|
17
|
Peng M, Yin N, Chhangawala S, Xu K, Leslie
CS and Li MO: Aerobic glycolysis promotes T helper 1 cell
differentiation through an epigenetic mechanism. Science.
354:481–484. 2016.PubMed/NCBI View Article : Google Scholar
|
|
18
|
Oosting M, Kerstholt M, Ter Horst R, Li Y,
Deelen P, Smeekens S, Jaeger M, Lachmandas E, Vrijmoeth H, Lupse M,
et al: Functional and genomic architecture of Borrelia
burgdorferi-induced cytokine responses in humans. Cell Host
Microbe. 20:822–833. 2016.PubMed/NCBI View Article : Google Scholar
|
|
19
|
Kim TK, Tirloni L, Bencosme-Cuevas E, Kim
TH, Diedrich JK, Yates JR and Mulenga A: Borrelia
burgdorferi infection modifies protein content in saliva of
Ixodes scapularis nymphs. BMC Genomics.
22(152)2021.PubMed/NCBI View Article : Google Scholar
|
|
20
|
Corona A and Schwartz I: Borrelia
burgdorferi: Carbon metabolism and the tick-mammal enzootic
cycle. Microbiol Spectr. 3(10)2015.PubMed/NCBI View Article : Google Scholar
|
|
21
|
Lynch A, Pearson P, Savinov SN, Li AY and
Rich SM: Lactate dehydrogenase inhibitors suppress Borrelia
burgdorferi growth in vitro. Pathogens. 12(962)2023.PubMed/NCBI View Article : Google Scholar
|
|
22
|
Ritchie ME, Phipson B, Wu D, Hu Y, Law CW,
Shi W and Smyth GK: limma powers differential expression analyses
for RNA-sequencing and microarray studies. Nucleic Acids Res.
43(e47)2015.PubMed/NCBI View Article : Google Scholar
|
|
23
|
Tibshirani R: Regression shrinkage
selection via the LASSO. J R Stat Soc Series B Stat Methodol.
73:273–282. 2011.
|
|
24
|
Sauerbrei W, Royston P and Binder H:
Selection of important variables and determination of functional
form for continuous predictors in multivariable model building.
Stat Med. 26:5512–5528. 2007.PubMed/NCBI View Article : Google Scholar
|
|
25
|
Guyon I, Weston J, Barnhill S and Vapnik
V: Gene selection for cancer classification using support vector
machines. Mach Learn. 46:389–422. 2002.
|
|
26
|
Lewis MJ, Spiliopoulou A, Goldmann K,
Pitzalis C, McKeigue P and Barnes MR: nestedcv: An R package for
fast implementation of nested cross-validation with embedded
feature selection designed for transcriptomics and high-dimensional
data. Bioinform Adv. 3(vbad048)2023.PubMed/NCBI View Article : Google Scholar
|
|
27
|
Chen H and Boutros PC: VennDiagram: A
package for the generation of highly customizable Venn and Euler
diagrams in R. BMC Bioinformatics. 12(35)2011.PubMed/NCBI View Article : Google Scholar
|
|
28
|
Aran D, Hu Z and Butte AJ: xCell:
Digitally portraying the tissue cellular heterogeneity landscape.
Genome Biol. 18(220)2017.PubMed/NCBI View Article : Google Scholar
|
|
29
|
Aran D: Cell-type enrichment analysis of
bulk transcriptomes using xCell. Methods Mol Biol. 2120:264–276.
2020.PubMed/NCBI View Article : Google Scholar
|
|
30
|
Gustavsson EK, Zhang D, Reynolds RH,
Garcia-Ruiz S and Ryten M: ggtranscript: An R package for the
visualization and interpretation of transcript isoforms using
ggplot2. Bioinformatics. 38:3844–3846. 2022.PubMed/NCBI View Article : Google Scholar
|
|
31
|
Hänzelmann S, Castelo R and Guinney J:
GSVA: Gene set variation analysis for microarray and RNA-seq data.
BMC Bioinformatics. 14(7)2013.PubMed/NCBI View Article : Google Scholar
|
|
32
|
Lin Y, Liang R, Ye J, Li Q, Liu Z, Gao X,
Piao X, Mai R, Zou D and Ge L: A twenty gene-based gene set
variation score reflects the pathological progression from
cirrhosis to hepatocellular carcinoma. Aging (Albany NY).
11:11157–11169. 2019.PubMed/NCBI View Article : Google Scholar
|
|
33
|
Betel D, Wilson M, Gabow A, Marks DS and
Sander C: The microRNA.org resource: Targets and expression.
Nucleic Acids Res. 36:D149–D153. 2008.PubMed/NCBI View Article : Google Scholar
|
|
34
|
John B, Enright AJ, Aravin A, Tuschl T,
Sander C and Marks DS: Human MicroRNA targets. PLoS Biol.
2(e363)2004.PubMed/NCBI View Article : Google Scholar
|
|
35
|
Mandrekar JN: Receiver operating
characteristic curve in diagnostic test assessment. J Thorac Oncol.
5:1315–1316. 2010.PubMed/NCBI View Article : Google Scholar
|
|
36
|
Robin X, Turck N, Hainard A, Tiberti N,
Lisacek F, Sanchez JC and Müller M: pROC: An open-source package
for R and S+ to analyze and compare ROC curves. BMC Bioinformatics.
12(77)2011.PubMed/NCBI View Article : Google Scholar
|
|
37
|
Pajouheshnia R, Pestman WR, Teerenstra S
and Groenwold RHH: A computational approach to compare regression
modelling strategies in prediction research. BMC Med Res Methodol.
16(107)2016.PubMed/NCBI View Article : Google Scholar
|
|
38
|
Livak KJ and Schmittgen TD: Analysis of
relative gene expression data using real-time quantitative PCR and
the 2(-Delta Delta C(T)) method. Methods. 25:402–408.
2001.PubMed/NCBI View Article : Google Scholar
|
|
39
|
Schmittgen TD and Livak KJ: Analyzing
real-time PCR data by the comparative C(T) method. Nat Protoc.
3:1101–1108. 2008.PubMed/NCBI View Article : Google Scholar
|
|
40
|
Yoo M, Shin J, Kim J, Ryall KA, Lee K, Lee
S, Jeon M, Kang J and Tan AC: DSigDB: Drug signatures database for
gene set analysis. Bioinformatics. 31:3069–3071. 2015.PubMed/NCBI View Article : Google Scholar
|
|
41
|
Kuleshov MV, Jones MR, Rouillard AD,
Fernandez NF, Duan Q, Wang Z, Koplev S, Jenkins SL, Jagodnik KM,
Lachmann A, et al: Enrichr: A comprehensive gene set enrichment
analysis web server 2016 update. Nucleic Acids Res. 44:W90–W97.
2016.PubMed/NCBI View Article : Google Scholar
|
|
42
|
Keenan AB, Jenkins SL, Jagodnik KM, Koplev
S, He E, Torre D, Wang Z, Dohlman AB, Silverstein MC, Lachmann A,
et al: The library of integrated network-based cellular signatures
NIH program: System-level cataloging of human cells response to
perturbations. Cell Syst. 6:13–24. 2018.PubMed/NCBI View Article : Google Scholar
|
|
43
|
Tannahill GM, Curtis AM, Adamik J,
Palsson-McDermott EM, McGettrick AF, Goel G, Frezza C, Bernard NJ,
Kelly B, Foley NH, et al: Succinate is an inflammatory signal that
induces IL-1β through HIF-1α. Nature. 496:238–242. 2013.PubMed/NCBI View Article : Google Scholar
|
|
44
|
Palsson-McDermott EM, Curtis AM, Goel G,
Lauterbach MAR, Sheedy FJ, Gleeson LE, van den Bosch MW, Quinn SR,
Domingo-Fernandez R, Johnston DG, et al: Pyruvate kinase M2
regulates HIF-1α activity and IL-1β induction and is a critical
determinant of the Warburg effect in LPS-activated macrophages.
Cell Metab. 21:65–80. 2015.PubMed/NCBI View Article : Google Scholar
|
|
45
|
O'Neill LA, Kishton RJ and Rathmell J: A
guide to immunometabolism for immunologists. Nat Rev Immunol.
16:553–565. 2016.PubMed/NCBI View Article : Google Scholar
|
|
46
|
Martínez-Reyes I and Chandel NS:
Mitochondrial TCA cycle metabolites control physiology and disease.
Nat Commun. 11(102)2020.PubMed/NCBI View Article : Google Scholar
|
|
47
|
Chen S, Xu Y, Zhuo W and Zhang L: The
emerging role of lactate in tumor microenvironment and its clinical
relevance. Cancer Lett. 590(216837)2024.PubMed/NCBI View Article : Google Scholar
|
|
48
|
Viola A, Munari F, Sánchez-Rodríguez R,
Scolaro T and Castegna A: The metabolic signature of macrophage
responses. Front Immunol. 10(1462)2019.PubMed/NCBI View Article : Google Scholar
|
|
49
|
Barriales D, Martín-Ruiz I,
Carreras-González A, Montesinos-Robledo M, Azkargorta M, Iloro I,
Escobés I, Martín-Mateos T, Atondo E, Palacios A, et al:
Borrelia burgdorferi infection induces long-term memory-like
responses in macrophages with tissue-wide consequences in the
heart. PLoS Biol. 19(e3001062)2021.PubMed/NCBI View Article : Google Scholar
|
|
50
|
Sze CW, Lynch MJ, Zhang K, Neau DB, Ealick
SE, Crane BR and Li C: Lactate dehydrogenase is the Achilles' heel
of Lyme disease bacterium Borreliella burgdorferi. mBio.
16(e037284)2025.PubMed/NCBI View Article : Google Scholar
|
|
51
|
Dai M, Wang L, Yang J, Chen J, Dou X, Chen
R, Ge Y and Lin Y: LDHA as a regulator of T cell fate and its
mechanisms in disease. Biomed Pharmacother.
158(114164)2023.PubMed/NCBI View Article : Google Scholar
|
|
52
|
Bertini R, Howard OM, Dong HF, Oppenheim
JJ, Bizzarri C, Sergi R, Caselli G, Pagliei S, Romines B, Wilshire
JA, et al: Thioredoxin, a redox enzyme released in infection and
inflammation, is a unique chemoattractant for neutrophils,
monocytes and T cells. J Exp Med. 189:1783–1789. 1999.PubMed/NCBI View Article : Google Scholar
|
|
53
|
Li B, Ming H, Qin S, Nice EC, Dong J, Du Z
and Huang C: Redox regulation: Mechanisms, biology and therapeutic
targets in diseases. Signal Transduct Target Ther.
10(72)2025.PubMed/NCBI View Article : Google Scholar
|
|
54
|
Dagah OMA, Silaa BB, Zhu M, Pan Q, Qi L,
Liu X, Liu Y, Peng W, Ullah Z, Yudas AF, et al: Exploring immune
redox modulation in bacterial infections: Insights into
thioredoxin-mediated interactions and implications for
understanding host-pathogen dynamics. Antioxidants (Basel).
13(545)2024.PubMed/NCBI View Article : Google Scholar
|
|
55
|
Shin JJ, Strle K, Glickstein LJ, Luster AD
and Steere AC: Borrelia burgdorferi stimulation of chemokine
secretion by cells of monocyte lineage in patients with Lyme
arthritis. Arthritis Res Ther. 12(R168)2010.PubMed/NCBI View
Article : Google Scholar
|
|
56
|
Botey-Bataller J, Vrijmoeth HD, Ursinus J,
Kullberg BJ, van den Wijngaard CC, Ter Hofstede H, Alaswad A, Gupta
MK, Roesner LM, Huehn J, et al: A comprehensive genetic map of
cytokine responses in Lyme borreliosis. Nat Commun.
15(3795)2024.PubMed/NCBI View Article : Google Scholar
|
|
57
|
Lu Y, Osis G, Zmijewska AA, Traylor A,
Thukral S, Wilson L, Barnes S, George JF and Agarwal A:
Macrophage-specific lactate dehydrogenase expression modulates
inflammatory function in vitro. Kidney360. 6:197–207.
2025.PubMed/NCBI View Article : Google Scholar
|
|
58
|
Song YJ, Kim A, Kim GT, Yu HY, Lee ES,
Park MJ, Kim YJ, Shim SM and Park TS: Inhibition of lactate
dehydrogenase A suppresses inflammatory response in RAW 264.7
macrophages. Mol Med Rep. 19:629–647. 2019.PubMed/NCBI View Article : Google Scholar
|
|
59
|
Qayyum N, Haseeb M, Kim MS and Choi S:
Role of thioredoxin-interacting protein in diseases and its
therapeutic outlook. Int J Mol Sci. 22(2754)2021.PubMed/NCBI View Article : Google Scholar
|
|
60
|
Nakamura H, Herzenberg LA, Bai J, Araya S,
Kondo N, Nishinaka Y, Herzenberg LA and Yodoi J: Circulating
thioredoxin suppresses lipopolysaccharide-induced neutrophil
chemotaxis. Proc Natl Acad Sci USA. 98:15143–15148. 2001.PubMed/NCBI View Article : Google Scholar
|
|
61
|
Mason LM, Veerman CC, Geijtenbeek TB and
Hovius JW: Menage a trois: Borrelia, dendritic cells and tick
saliva interactions. Trends Parasitol. 30:95–103. 2014.PubMed/NCBI View Article : Google Scholar
|
|
62
|
Shen S, Shin JJ, Strle K, McHugh G, Li X,
Glickstein LJ, Drouin EE and Steere AC: Treg cell numbers and
function in patients with antibiotic-refractory or
antibiotic-responsive Lyme arthritis. Arthritis Rheum.
62:2127–2137. 2010.PubMed/NCBI View Article : Google Scholar
|
|
63
|
Shi C, Sahay B, Russell JQ, Fortner KA,
Hardin N, Sellati TJ and Budd RC: Reduced immune response to
Borrelia burgdorferi in the absence of γδ T cells. Infect
Immun. 79:3940–3946. 2011.PubMed/NCBI View Article : Google Scholar
|
|
64
|
Tracy KE and Baumgarth N: Borrelia
burgdorferi manipulates innate and adaptive immunity to
establish persistence in rodent reservoir hosts. Front Immunol.
8(116)2017.PubMed/NCBI View Article : Google Scholar
|
|
65
|
Salazar JC, Duhnam-Ems S, La Vake C, Cruz
AR, Moore MW, Caimano MJ, Velez-Climent L, Shupe J, Krueger W and
Radolf JD: Activation of human monocytes by live Borrelia
burgdorferi generates TLR2-dependent and independent responses
including induction of IFN-β. PLoS Pathog.
5(e1000444)2009.PubMed/NCBI View Article : Google Scholar
|
|
66
|
Stokes JV, Moraru GM, McIntosh C, Kummari
E, Rausch K and Varela-Stokes AS: Differentiated THP-1 cells
exposed to pathogenic and nonpathogenic Borrelia species
demonstrate minimal differences in production of inflammatory
cytokines. Vector Borne Zoonotic Dis. 16:691–695. 2016.PubMed/NCBI View Article : Google Scholar
|
|
67
|
Strle K, Drouin EE, Shen S, El Khoury J,
McHugh G, Ruzic-Sabljic E, Strle F and Steere AC: Borrelia
burgdorferi stimulates macrophages to secrete higher levels of
cytokines and chemokines than Borrelia afzelii or
Borrelia garinii. J Infect Dis. 200:1936–1943.
2009.PubMed/NCBI View
Article : Google Scholar
|
|
68
|
Lasky CE, Olson RM and Brown CR:
Macrophage polarization during murine Lyme borreliosis. Infect
Immun. 83:2627–2645. 2015.PubMed/NCBI View Article : Google Scholar
|
|
69
|
Akinlusi I, Kan B, Shi T, Barragan J,
Bouchot C and Cervantes J: Human microglia polarization following
infection with the Lyme disease spirochete. J Investig Med.
73:172–178. 2025.PubMed/NCBI View Article : Google Scholar
|
|
70
|
Woitzik P and Linder S: Molecular
mechanisms of Borrelia burgdorferi phagocytosis and
intracellular processing by human macrophages. Biology (Basel).
10(567)2021.PubMed/NCBI View Article : Google Scholar
|