Introduction
Heparin is a potent blood anticoagulant, and
previous studies have demonstrated that it can attenuate
inflammatory responses and organ function injury in sepsis
(1–4). Sepsis is the systemic inflammatory
response syndrome (SIRS) secondary to bacterial infection (5). SIRS is characterized by the
activation of the inflammatory and coagulation systems, which can
lead to generalized hypoperfusion, multiple organ failure and
mortality. Previous studies have shown that septic plasma reduces
the oxygen consumption of healthy mitochondria. In addition, sepsis
severity has been shown to significantly correlate with
mitochondrial function inhibition (6). Thus, sepsis is considered to be a
microcirculation-mitochondrial distress syndrome (7).
Azurocidin (AZU), a protein with strong
heparin-binding potential, is stored in neutrophil granules and is
released following the stimulation of cells in proximity to
endothelial cells. AZU is known to be a multifunctional
inflammatory mediator with the ability to induce vascular leakage
(8). In addition, AZU has been
hypothesized to promote the release of inflammatory factors and
inhibit apoptosis (9–11). A previous study demonstrated that
plasma AZU levels were significantly higher in patients with severe
sepsis or septic shock when compared with patients with a
non-septic illness in the intensive care unit (12). Furthermore, AZU has been found to
be associated with the severity of disease, and elevated AZU levels
at admission were shown to correlate with an increased risk of
mortality (13,14). Endothelial cells are able to uptake
AZU, and the internalized protein is targeted to perinuclear
compartments of the endothelial cells, where AZU colocalizes with
the mitochondria (10).
Although increased AZU levels and the inhibition of
mitochondrial function are associated with the severity of sepsis,
the function of AZU in mitochondrial oxygen metabolism has yet to
be reported. Therefore, the present study investigated
mitochondrial oxygen metabolism function by analyzing the
mitochondrial membrane potential (ΔΨ), mitochondrial morphology and
the expression of cytochrome c oxidase subunit II (Cox II).
In addition, the present study investigated the inhibitory effect
of heparin on the endocytosis of AZU by human umbilical vein
endothelial cells (HUVECs).
Materials and methods
Cell culture
HUVECs were obtained from the American Type Culture
Collection (Manassas, VA, USA). The cells were cultured in
Dulbecco’s modified Eagle’s medium (Invitrogen Life Technologies,
Carlsbad, CA, USA) supplemented with 10% fetal calf serum
(Invitrogen Life Technologies), 100 IU/ml penicillin
(Sigma-Aldrich, St. Louis, MO, USA) and 100 μg/ml streptomycin
(Sigma-Aldrich). The cells were grown on sterile tissue culture
dishes and were passaged every three days using 0.25% trypsin
(Invitrogen Life Technologies). The HUVECs were cultured to a
density of 90% to prepare for the subsequent experiments.
Experimental protocol
HUVECs were randomly divided into four groups. The
blank control group were incubated with phosphate-buffered saline
(PBS) in a 5% CO2 incubator at 37°C for 12 h. The AZU
group were incubated with AZU (p20160; USCN Life Science, Inc.,
Wuhan, China), at a final concentration of 1 μg/ml, in a 5%
CO2 incubator at 37°C for 12 h. The heparin plus AZU
group were incubated with 100 μg/ml heparin (Qianhong Biochemistry
Co., Ltd., Changzhou, China) in a 5% CO2 incubator at
37°C for 2 h, and were subsequently incubated with 1 μg/ml AZU in a
5% CO2 incubator at 37°C for 12 h. The heparin group
were incubated with heparin, at a final concentration of 100 μg/ml,
in a 5% CO2 incubator at 37°C for 12 h.
JC-1 fluorescence analysis and flow
cytometry
Following the cell treatment, HUVECs from each group
were dyed with JC-1 to determine the mitochondrial membrane
potential (ΔΨ). JC-1 is a membrane permeable lipophilic dye that
manifests as J-aggregates in the mitochondrial matrix (red
fluorescence) and as monomers in the cytoplasm (green
fluorescence). During mitochondrial depolarization, the red
J-aggregates form green monomers due to a change in the ΔΨ. Thus,
the ΔΨ can be measured as the red fluorescence intensity ratio.
The JC-1 assay was performed as follows. HUVECs from
each group were digested with 0.25% trypsin and collected by
centrifugation at 1,000 × g for 5 min. After removing the
supernatant, the HUVECs were washed twice with PBS and collected by
centrifugation at 2,000 × g for 5 min. JC-1 working solution (500
μl; KeyGen BioTech, Nanjing, China) was added to the system and the
cells were resuspended. Following incubation for 20 min at 37°C,
the HUVECs were collected by centrifugation at 2,000 × g for 5 min
and washed twice with 1X incubation buffer (KeyGen BioTech). The
HUVECs were resuspended in 500 μl 1X incubation buffer and analyzed
by flow cytometry (FACSCalibur™; BD Biosciences, Franklin Lakes,
NJ, USA) to determine the ΔΨ.
Isolation of mitochondria
HUVECs were collected by centrifugation at 800 × g
for 3 min, and resuspended in ice-cold PBS. Following removal of
the supernatant, the HUVECs were incubated with 1 ml mitochondrial
separation reagent with phenylmethanesulfonyl fluoride (Beyotime
Institute of Biotechnology, Haimen, China) on ice for 15 min. The
HUVECs were homogenized 50 times and centrifuged at 600 × g at 4°C
for 10 min. The supernatant was transferred to an additional
centrifuge tube, which was centrifuged at 4°C at 11,000 × g for 10
min. Following removal of the supernatant, the precipitation
comprised the isolated mitochondria.
Electron microscopy
Isolated mitochondria were fixed in 4%
glutaraldehyde at 4°C overnight, and immersed in 1% osmium
tetroxide for 2 h. Following washing in PBS, the specimens were
dehydrated as follows: 50% alcohol for 10 min; 70% alcohol for 10
min; 80% acetone for 10 min (twice); 90% acetone for 10 min
(twice); and dry acetone for 10 min (twice). The specimens were
embedded in SPI-Pon 812 (Structure Probe, Inc./SPI Supplies, West
Chester, PA, USA), and 600–800-nm sections were prepared. The
sections were dyed with uranyl acetate and lead citrate for 5 min,
and the samples were viewed using a transmission electron
microscope (JEM-1200EX; JEOL, Ltd., Akishima, Japan).
Western blotting
Total protein for AZU detection was extracted from
the cytoplasm of the HUVECs, while for Cox II expression
determination, specimens were extracted from the mitochondrial
matrix. Total proteins from the cells were extracted using
cytoplasmic protein reagent A (Beyotime Institute of
Biotechnology), while total proteins from the mitochondrial matrix
were extracted using a mitochondrial lysate (Beyotime Institute of
Biotechnology). The proteins were quantified using the Bradford
method. Samples of 50 μg protein were separated by SDS-PAGE and
transferred to polyvinylidene fluoride membranes (Millipore,
Billerica, MA, USA). The membranes were incubated overnight at 4°C
with antibodies against Cox II (ab79393; 1:100) and Cox IV
(ab110272; 1:100; Abcam, Shanghai, China), AZU (sc-33129; 1:100)
and β-actin (sc-130301; 1:500; Santa Cruz Biotechnology, Inc.
Dallas, TX, USA). Following incubation with a peroxidase-coupled
anti-mouse IgG (sc-2371; Santa Cruz Biotechnology, Inc.) at 37°C
for 2 h, bound proteins were visualized using enhanced
chemiluminescence (Pierce Biotechnology, Inc., Rockford, IL, USA)
and detected using a BioImaging System (UVP, Inc., Upland, CA,
USA). Relative protein expression levels were quantified using
β-actin and Cox IV as the loading controls.
Quantitative polymerase chain reaction
(PCR) using the SYBR Green method
Quantitative PCR was performed using the SYBR Green
PCR master mix (Applied Biosystems, Foster City, CA, USA) in a
total volume of 20 μl on a Fast Real-Time PCR System (Exicycler 96;
Bioneer Corporation, Daejeon, Korea). The conditions were as
follows: 95°C for 30 sec, followed by 40 cycles at 95°C for 5 sec
and 60°C for 30 sec. A dissociation step was performed to generate
a melting curve to confirm the specificity of the amplification.
Cox IV was used as the reference gene. The relative gene expression
levels were represented as ΔCt = Ct gene − Ct reference, and the
fold change of gene expression was calculated using the
2−ΔΔCt method. Experiments were repeated in
quadruplicate. The primer sequences were obtained from GenBank and
were as follows: Cox II forward, 5′-TCCCCTTCTGCCTGACACCT-3′, and
reverse, 5′-TTCCTACCACCAGCAACCCT-3′; Cox IV forward,
5′-GTTATCATGTGGCAGAAGCA-3′; and reverse,
5′-CCAGTAAATAGGCATGGAGTT-3′.
Immunofluorescence analysis
HUVECs were fixed in 4% paraformaldehyde for 15 min
and incubated with an antibody against AZU (1:50; sc-33129; Santa
Cruz Biotechnology, Inc.) at 4°C overnight. The HUVECs were
incubated with a fluorescein isothiocyanate-conjugated secondary
antibody (F4512,Sigma-Aldrich) for 60 min at room temperature in
the dark. The nuclei were dyed with DAPI (Cell Signaling
Technology, Inc., Boston, MA, USA) for cellular localization, and
the system was sealed by half a drop of anti-fluorescent quencher
(Solarbio Science & Technology Co., Ltd., Beijing, China). The
samples were viewed using a laser scanning confocal microscope
(FV1000S-SIM/IX81; Olympus Corporation, Tokyo, Japan) at a
magnification of ×600, from which the green fluorescence intensity
was calculated. The cytoplasmic concentration of AZU was
represented as the fluorescence intensity.
Statistical analysis
SPSS version 19.0 for Windows (IBM, Armonk, NY, USA)
was used for all statistical analyses. The Student’s t-test was
used to compare the red fluorescence intensity ratio and the
relative expression levels of the target proteins between any two
groups. All the P-values were based on a two-sided statistical
analysis and P<0.05 was considered to indicate a statistically
significant difference.
Results
Mitochondrial membrane potential (ΔΨ)
changes in each group
Flow cytometry was employed to evaluate the ΔΨ in
each group of HUVECs, and was measured as the red fluorescence
intensity ratio. Compared with the blank control group (90.59±0.05,
n=4), the ΔΨ was found to decrease in the AZU group (81.07±0.07;
n=4; P<0.01). In the heparin plus AZU group (87.69±0.23, n=4),
the ΔΨ was higher compared with that in the AZU group (81.07±0.07;
n=4; P<0.01; Fig. 1A). These
observations demonstrated that the ΔΨ was inhibited by AZU, and
this function was antagonized by heparin.
Changes to mitochondrial morphology in
each group
Transmission electron microscopy was employed to
evaluate the morphology of the mitochondria. The morphology of
mitochondria in the blank control group was almost normal, with
electron microscopy revealing that the matrix particles rarely
disappeared and the crest was complete with the inside and outside
membrane structures legible (Fig.
1B). The majority of the mitochondrial matrix density in the
AZU group was severely reduced and exhibited vacuolation. The crest
had parted or disappeared, and sections of the inside and outside
membrane structures had vanished (Fig.
1C). The mitochondrial matrix density in the heparin plus AZU
group was reduced and the crest was complete. In addition, the
integrity of the inside and outside membranes was reserved, and few
mitochondria showed vacuolation (Fig.
1D). The majority of the mitochondrial matrix density in the
heparin group was almost normal. The crest was complete, with the
inside and outside membrane structures legible (Fig. 1E). These observations demonstrated
that AZU destroyed the structure of the mitochondria, but this
function was antagonized by heparin.
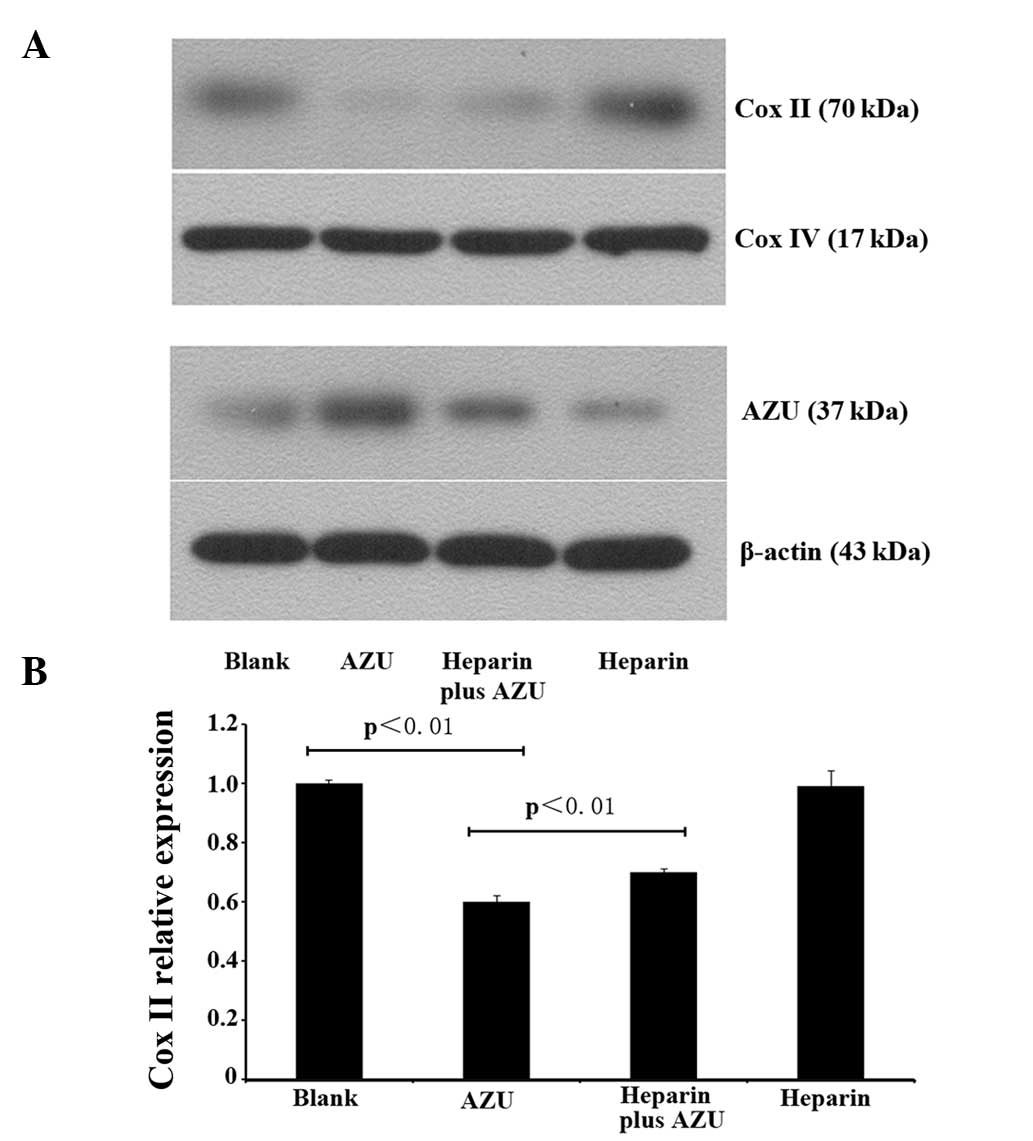
Expression levels of Cox II in the
mitochondria
Protein expression levels of Cox II were analyzed by
western blotting. Cox II expression levels were found to be lower
in the AZU group compared with those in the blank control group. In
addition, higher Cox II expression levels were observed in the
heparin plus AZU group than in the AZU group (Fig. 2A). Quantitative PCR was employed to
evaluate the mRNA expression levels of Cox II, and the results
indicated that Cox II expression was lower in the AZU group
(0.60±0.02; n=4) compared with the blank control group (1.00±0.01;
n=4; P<0.01). Compared with the AZU group (0.60±0.02; n=4), Cox
II expression in the heparin plus AZU group (0.70±0.01; n=4) was
higher (P<0.01; Fig. 2B). These
observations demonstrated that Cox II expression was inhibited by
AZU, and this function was antagonized by heparin.
Uptake and internalization of AZU by
HUVECs
Immunofluorescence analysis was used to evaluate the
concentration of AZU. The intensity of green fluorescence was
deemed to be the concentration of AZU. HUVECs exhibited the lowest
green fluorescence intensity in the cytoplasm of the blank control
and heparin groups (Fig. 3A and
D). By contrast, the AZU group has the highest intensity of
green fluorescence (Fig. 3B).
Compared with the AZU group, the intensity of green fluorescence
was significantly reduced in the heparin plus AZU group (Fig. 3C). In order to evaluate the
relative cytoplasmic concentration of AZU, quantitative
fluorescence was used to detect the green fluorescence intensity in
the cytoplasm. The cytoplasmic green fluorescence intensity in the
AZU group was significantly higher (157.4±4.36; n=4) compared with
the blank control group (22.3±3.12; n=4; P<0.01). In addition,
the cytoplasmic green fluorescence intensity in the heparin plus
AZU group (52.7±4.75; n=4) was significantly decreased compared
with that in the AZU group (157.4±4.36; n=4; P<0.01; Fig. 3E).
Western blotting was also employed to evaluate the
concentration of AZU. Since the expression of AZU in the cytoplasm
is low, western blotting was used to determine the degree of AZU
endocytosis. The protein expression levels of AZU in the AZU group
were significantly increased, while the levels in the heparin plus
AZU group were significantly decreased compared with those in the
AZU group (Fig. 2A). These results
demonstrated that the HUVECs were able to uptake and internalize
AZU, with heparin exhibiting an antagonistic function in this
process.
Discussion
AZU is a multifunctional, inactive serine-protease
homolog (15). Since the protein
has a strong heparin binding potential, AZU is also known as
heparin-binding protein. A previous study demonstrated that AZU has
a high basic amino acid content and contains consensus sequences
(-X-B-B-X-B-X and -X-B-B-B-X-X-B-X) that are known as
glycosaminoglycan recognition sites (16). However, the mode of interaction
between AZU and heparin remains unclear. The slightly different
distribution of basic residues in AZU and the heterogeneity of
heparin indicates that non-specific electrostatic forces form the
main basis of the interactions (16). In the present study, HUVECs were
shown to uptake AZU analogously. The expression of AZU is low in
HUVECs, but the results revealed that the content was significantly
increased following the addition of exogenous AZU, as demonstrated
by western blotting and immunofluorescence analysis. In addition,
heparin was shown to reduce the content of exogenous AZU in the
cytoplasm.
Glycocalyx, considered to be an analog of heparin,
is negatively charged with a mesh-like structure (17). AZU is hypothesized to bind to the
glycoprotein, which allows for the uptake by endothelial cells.
Subsequently, AZU causes the rearrangement of the endothelial cell
cytoskeleton via the Rho-Rho-kinase pathway and increases the
vascular permeability. In addition, AZU promotes the migration of
neutrophils across the vascular wall, functioning as an
inflammatory mediator (8,18,19).
Glycocalyx plays a role as the binding site for AZU on the surface
of endothelial cells (20). In the
present study, heparin was considered to be an antagonist of
glycocalyx by binding to AZU. AZU was shown to inhibit the function
of mitochondrial oxygen metabolism, while heparin effectively
reduced the uptake of AZU by endothelial cells. Heparin and
glycocalyx were hypothesized to exhibit a competitive inhibition
function against AZU binding to endothelial cells, since heparin
and glycocalyx have a similar structure and charge
characteristics.
Mitochondria are the respiratory and energetic
centers of cells. Sepsis is considered as cytopathic hypoxia
(21), and different experimental
models support an underlying role of cytopathic hypoxia in
mitochondrial dysfunction. Mitochondrial complex IV (cytochrome
c oxidase) is responsible for the final oxygen reduction
into water. The mitochondrial membrane potential (ΔΨ) is also
considered as the function of mitochondrial oxygen metabolism. The
results of the present study indicated that AZU reduced the
expression of Cox II, which is a subunit of Cox that is
mitochondrial encoded only. AZU was also shown to reduce the ΔΨ and
destroy the morphology of the mitochondria. Thus, AZU was
hypothesized to destroy mitochondrial function and morphology, and
inhibit the oxygen metabolic function of mitochondria by reducing
the synthesis of key enzymes involved in mitochondrial oxygen
metabolism.
The import of proteins into the mitochondria is
controlled by several membrane-associated translocation complexes,
including the translocase of the outer membrane (TOM)complex, the
translocase of the inner membrane (TIM) complex, the sorting and
assembly machinery complex for the insertion of β-barrel proteins
into the outer membrane and the presequence translocase-associated
motor complex that drives preprotein translocation into the matrix.
These mitochondrial protein translocases, as well as specific
cytosolic chaperones, recognize targeting information in proteins
requiring importation, such as the N-terminal presequence and
molecular charge, and assist with unfolding, membrane insertion or
translocation and refolding/assembly in the mitochondria (22). In the present study, AZU was shown
to inhibit the expression of Cox II, which exists only in the
matrix of mitochondria. Cox II has a positive molecular charge and
a β-barrel structure; thus, AZU has the structure foundation for
translocation into the mitochondria via the TOM/TIM pathway, after
which AZU was shown to affect protein function in the mitochondrial
matrix. However, further experiments are required to confirm this
hypothesis.
In conclusion, the present study has demonstrated
that AZU inhibits the oxygen metabolic function in mitochondria.
This function was effectively antagonized by heparin via the
inhibition of AZU endocytosis by HUVECs. Therefore, heparin may be
a potential therapeutic agent for treating sepsis-induced
mitochondrial dysfunction in the future.
References
|
1
|
Mu E, Ding R, An X, et al: Heparin
attenuates lipopolysaccharide-induced acute lung injury by
inhibiting nitric oxide synthase and TGF-β/Smad signaling pathway.
Thromb Res. 129:479–485. 2012.
|
|
2
|
Zhao D, Ding R, Mao Y, et al: Heparin
rescues sepsis-associated acute lung injury and lethality through
the suppression of inflammatory responses. Inflammation.
35:1825–1832. 2012. View Article : Google Scholar : PubMed/NCBI
|
|
3
|
Ding R, Zhao D, Guo R, Zhang Z and Ma X:
Treatment with unfractionated heparin attenuates coagulation and
inflammation in endotoxemic mice. Thromb Res. 128:e160–e165. 2011.
View Article : Google Scholar : PubMed/NCBI
|
|
4
|
Han J, Ding R, Zhao D, Zhang Z and Ma X:
Unfractionated heparin attenuates lung vascular leak in a mouse
model of sepsis: role of RhoA/Rho kinase pathway. Thromb Res.
132:e42–e47. 2013. View Article : Google Scholar : PubMed/NCBI
|
|
5
|
Levy MM, Fink MP, Marshall JC, et al;
International Sepsis Definitions Conference. 2001
SCCM/ESICM/ACCP/ATS/SIS International Sepsis Definitions
Conference. Intensive Care Med. 29:530–538. 2003. View Article : Google Scholar : PubMed/NCBI
|
|
6
|
Garrabou G, Morén C, López S, et al: The
effects of sepsis on mitochondria. J Infect Dis. 205:392–400. 2012.
View Article : Google Scholar : PubMed/NCBI
|
|
7
|
Spronk PE, Kanoore-Edul VS and Ince C:
Microcirculatory and mitochondrial distress syndrome (MMDS): A new
look at sepsis. Functional Hemodynamic Monitoring. Pinsky MR and
Payden D: 42. Springer; Berlin: pp. 47–67. 2005, View Article : Google Scholar
|
|
8
|
Totsukawa G, Yamakita Y, Yamashiro S, et
al: Distinct roles of ROCK (Rho-kinase) and MLCK in spatial
regulation of MLC phosphorylation for assembly of stress fibers and
focal adhesions in 3T3 fibroblasts. J Cell Biol. 150:797–806. 2000.
View Article : Google Scholar : PubMed/NCBI
|
|
9
|
Rasmussen PB, Bjørn S, Hastrup S, et al:
Characterization of recombinant human HBP/CAP37/azurocidin, a
pleiotropic mediator of inflammation-enhancing LPS-induced cytokine
release from monocytes. FEBS Lett. 390:109–112. 1996. View Article : Google Scholar : PubMed/NCBI
|
|
10
|
Olofsson AM, Vestberg M, Herwald H, et al:
Heparin-binding protein targeted to mitochondrial compartments
protects endothelial cells from apoptosis. J Clin Invest.
104:885–894. 1999. View
Article : Google Scholar : PubMed/NCBI
|
|
11
|
Mai S, Klinkenberg M, Auburger G,
Bereiter-Hahn J and Jendrach M: Decreased expression of Drp1 and
Fis1 mediates mitochondrial elongation in senescent cells and
enhances resistance to oxidative stress through PINK1. J Cell Sci.
123:917–926. 2010. View Article : Google Scholar
|
|
12
|
Chew MS, Linder A, Santen S, et al:
Increased plasma levels of heparin-binding protein in patients with
shock: a prospective, cohort study. Inflamm Res. 61:375–379. 2012.
View Article : Google Scholar : PubMed/NCBI
|
|
13
|
Holub M and Beran O: Should
heparin-binding protein levels be routinely monitored in patients
with severe sepsis and septic shock? Crit Care.
16:1332012.PubMed/NCBI
|
|
14
|
Linder A, Akesson P, Inghammar M, et al:
Elevated plasma levels of heparin-binding protein in intensive care
unit patients with severe sepsis and septic shock. Critical Care.
16:R902012. View
Article : Google Scholar : PubMed/NCBI
|
|
15
|
Tapper H, Karlsson A, Morgelin M,
Flodgaard H and Herwald H: Secretion of heparin-binding protein
from human neutrophils is determined by its localization in
azurophilic granules and secretory vesicles. Blood. 99:1785–1793.
2002. View Article : Google Scholar : PubMed/NCBI
|
|
16
|
Flodgaard H, Ostergaard E, Bayne S, et al:
Covalent structure of two novel neutrophile leucocyte-derived
proteins of porcine and human origin. Neutrophile elastase
homologues with strong monocyte and fibroblast chemotactic
activities. Eur J Biochem. 197:535–547. 1991. View Article : Google Scholar
|
|
17
|
Nieuwdorp M, Meuwese MC, Vink H, et al:
The endothelial glycocalyx: a potential barrier between health and
vascular disease. Curr Opin Lipidol. 16:507–511. 2005. View Article : Google Scholar : PubMed/NCBI
|
|
18
|
Arfors KE, Lundberg C, Lindbom L, et al: A
monoclonal antibody to the membrane glycoprotein complex CD18
inhibits polymorphonuclear leukocyte accumulation and plasma
leakage in vivo. Blood. 69:338–340. 1987.
|
|
19
|
Chertov O, Ueda H, Xu LL, et al:
Identification of human neutrophil-derived cathepsin G and
azurocidin/CAP37 as chemoattractants for mononuclear cells and
neutrophils. J Exp Med. 186:739–747. 1997. View Article : Google Scholar : PubMed/NCBI
|
|
20
|
Soehnlein O, Xie X, Ulbrich H, et al:
Neutrophil-derived heparin-binding protein (HBP/CAP37) deposited on
endothelium enhances monocyte arrest under flow conditions. J
Immunol. 174:6399–6405. 2005. View Article : Google Scholar : PubMed/NCBI
|
|
21
|
Lunemann JD, Buttgereit F, Tripmacher R,
et al: Norepinephrine inhibits energy metabolism of human
peripheral blood mononuclear cells via adrenergic receptors. Biosci
Rep. 21:627–635. 2001. View Article : Google Scholar : PubMed/NCBI
|
|
22
|
Perry AJ, Rimmer KA, Mertens HD, et al:
Structure, topology and function of the translocase of the outer
membrane of mitochondria. Plant Physiol Biochem. 46:265–274. 2008.
View Article : Google Scholar : PubMed/NCBI
|