Introduction
Non-insulin-dependent diabetes mellitus (NIDDM or
type 2 DM), the predominant form of adult-onset DM, is rapidly
becoming a global public health emergency (1). Insulin resistance (IR) and pancreatic
islet cell dysfunction are the major pathophysiological
characteristics of the disease, leading to relative insulin
deficiency and aberrant glucose metabolism (2). The development of IR is closely
associated with inflammatory processes, and NIDDM is increasingly
recognized as an inflammatory metabolic disorder. In NIDDM, the
chronic elevation of inflammatory cytokines and free fatty acids
(FFAs) disrupts insulin signaling and, ultimately, causes the
degeneration of pancreatic cells (3–6). The
insulin receptor (InsR)/insulin receptor substrate
(IRS)/phosphoinositide 3-kinase (PI3K)/Akt pathway is the critical
homeostatic cascade linking insulin release to tissue glucose
uptake (7). Increasing evidence
suggests that this pathway is a target of multiple metabolic
signals and inflammatory cytokines associated with obesity
(8,9). This pathway is also considered to
represent a key risk factor in the development of NIDDM, including
its actions upon FFAs, tumor necrosis factor α (TNF-α) and the
pro-inflammatory interleukins IL-1β and IL-6 (10–12).
Amongst other effects, these factors cause aberrant phosphorylation
and dephosphorylation of InsR, IRS and Akt; this reduces the
efficacy of insulin signaling, including insulin-evoked glucose
transport (4,6,7,10,11).
The celiac plexus is the body's largest autonomic
nerve plexus; neurolytic celiac plexus block (NCPB) is therefore an
effective method to relieve pain, for instance in cancer treatments
(13). Our previous study of NCPB in
rats following resection of 70% of the liver indicated that NCPB
attenuated IR; this may be due to an inhibition of systemic
inflammatory response syndrome that typically occurs following
severe trauma (14). NCPB may
therefore slow or reverse NIDDM-associated dysfunction via the
suppression of immune-mediated IR. The current study therefore
measured functional and molecular changes associated with NIDDM,
including oral glucose tolerance tests (OGTTs), insulin
sensitivity, skeletal muscle glucose uptake, serum cytokines and
skeletal muscle insulin signaling in the Goto-Kakizaki (GK) rat
model of diabetes (15,16).
Materials and methods
Chemicals and reagents
Rat enzyme-linked immunosorbent assay (ELISA) kits
for measurement of FFAs, TNF-α, IL-1β and IL-6 were purchased from
Cusabio Biotech Co., Ltd. (Wuhan, China). Insulin radioimmunoassay
kit purchased from Tianjin Jiuding Medical Biology Engineering Co.
(Tianjin, China). Tissue protein extraction solution was purchased
from Pierce Biotechnology, Inc. (Rockford, IL, USA). The following
primary antibodies were purchased from Santa Cruz Biotechnology,
Inc. (Dallas, TX, USA): Anti-glyceraldehyde-3-phosphate
dehydrogenase (GAPDH) mouse monoclonal immunoglobulin G (IgG; cat.
no. sc-166574), anti-insulin receptor β (Rβ) rabbit polyclonal IgG
(cat. no. sc-711), anti-p-insulin Rβ antibody (Tyr 1162/1163; cat.
no. sc-25103), anti-insulin receptor substrate-1 (IRS-1) rabbit
polyclonal IgG (cat. no. sc-559), anti-p-IRS-1 (S307) rabbit
polyclonal IgG (cat. no. sc-33956), anti-Akt1/2/3 rabbit polyclonal
IgG (cat. no. sc-8312), anti-p-Akt1/2/3 (S473) rabbit polyclonal
IgG (cat. no. sc-7985-R), anti-glucose transporter type 4 (GLUT4)
rabbit polyclonal IgG (cat. no. sc-7938) and goat anti-p-insulin Rβ
(Y1162/Y1163; cat. no. sc-25103). Horseradish peroxidase
(HRP)-labeled rabbit anti-mouse IgG (cat. no. TA130002),
HRP-labeled rabbit anti-goat IgG (cat. no. TA130024), HRP-labeled
goat anti-rabbit IgG (cat. no. TA130031) and enhanced
chemiluminescence (ECL) detection reagents were from OriGene
Technologies, Inc. (Beijing, China).
GK rat model of NIDDM
A total of 25, 3-month-old GK male rats (weighing
305.7±18.4 g) were purchased from Shanghai SLAC Laboratory Animal
Co., Ltd. (Shanghai, China). The animal experiments were approved
by the Committee of Animal Care and Use within the of Chengdu
Military General Hospital Command Area (Chengdu, China). Diabetes
was induced using a high-fat and high-sugar diet, as previously
described (17). After the first 2
weeks of the diet, fasting blood glucose (FBG) was tested weekly
after an 18-h fast, using blood from the tail vein. A FBG level of
>9 mmol/l was considered to indicate NIDDM. All 25 rats
demonstrated tail vein FBG values >9 mmol/l at the first
test.
Baseline OGTT and insulin sensitivity indices
(ISI1 and ISI2) were recorded in 5 NIDDM rats
(N0), and the remainder were randomly divided into two groups. The
NCPB group received daily bilateral percutaneous injections of 0.5%
lidocaine (1 ml/side) and control group rats received the same
volume of 0.9% saline into the celiac plexus. Following the 14th
(N14) and 28th (N28) injections, OGTT, IR, serum cytokine levels
and the expression and phosphorylation status of insulin signaling
factors in skeletal muscles were measured in 5 rats from each
group.
Neurolytic celiac plexus block
Rats received 0.5% lidocaine (2 ml once/day) or
saline under ether anesthesia. The puncture point was determined in
accordance with a previous report (18). Briefly, rats were injected
bilaterally at the first lumbar transverse process, the first bony
protrusion under the root of the last rib. The needle was inserted
vertically until it touched the tip of the transverse process, and
was then turned medially and 70–80° vertically over the outer edge
of the transverse process tip. Insertion continued until
penetration was felt.
OGTT assay
Rats were administered 500 g/l glucose at 2 g/kg
body mass by gavage, under ether anesthesia and following an 18-h
fast. Blood samples (0.5 ml) from the orbital venous plexus were
obtained at T0 (0 min), T1 (60 min) and
T2 (120 min). Blood glucose was measured by the glucose
oxidase method (19) and serum
insulin by radioimmunoassay using the insulin radioimmunoassay kit
according to the manufacturer's protocol. Blood glucose at
T0 was considered to be the FBG and T0
insulin as fasting insulin (FIns). OGTT values were used to
calculate the insulin sensitivity indices (ISI1 and
ISI2) as previously described (13,20):
ISI1 = 1/(FBG × FIns) and ISI2 = area under
the curve of glucose (AUCg)/area under the insulin curve (AUCi),
where AUCi = [(I0 min + I60 min)/2] +
[(I60 min + I120 min)/2] and AUCg = [(G0
min + G60 min)/2] + [(G60 min +
G120 min)/2].
Determination of skeletal muscle
glucose uptake
Rats were sacrificed by decapitation 12 h after the
OGTT test. Serum and quadriceps muscle samples for biochemical
analyses were collected, which were stored at −80°C until use. A
100 mg sample of freshly isolated soleus muscle was used to
determine skeletal muscle 2-deoxy-D-glucose (2-DG) uptake in each
rat (14). Soleus muscle bundles
were placed in Krebs-Ringer bicarbonate buffer (OriGene
Technologies, Inc., Beijing, China) with or without 1.0 µmol/ml
insulin to measure insulin-stimulated and basal glucose uptake,
respectively. After 1 h shaking at 37°C under 95% O2 and
5% CO2, 1.85×10⁴ Bq 3H-2-DG and
1.5 nmol/l 2-DG (Serva Electrophoresis GmbH, Heidelberg, Germany)
were added and incubation continued with shaking for 30 min. Muscle
samples were washed and placed in liquid scintillation vials with
ethylene glycol ether (5 ml) and scintillation fluid (0.5 g
2,5-diphenyloxazole, 0.2 g phenylene benzoxazole and 1,000 ml
toluene). Vials were left overnight in a darkroom. Other muscle
samples were boiled prior to their use in assays, in order to
correct for extracellular glucose uptake and non-specific
absorption. Radioactivity was measured using a gamma counter
(Wizard® gamma; PerkinElmer, Inc., Waltham, MA,
USA).
Serum cytokine detection
Serum samples collected prior to and following the
14th and 28th daily injections were used to detect serum levels of
FFAs and the inflammatory cytokines TNF-α, IL-1β and IL-6, using
commercial ELISA kits in accordance with the manufacturers'
instructions.
Western blotting
Skeletal muscle total protein was extracted in
protein extraction solution in accordance with the manufacturer's
instructions, and measured using the Bradford method. Extracted
proteins were separated on 6% sodium dodecyl sulfate polyacrylamide
gels at 50 µg protein per lane, and transferred to polyvinylidene
difluoride membranes using semi-dry electroblotting for 1 h. The
membranes were blocked in phosphate-buffered saline (PBS)
containing 0.5% bovine serum albumin (OriGene Technologies, Inc.);
membranes were then incubated overnight at 4°C in 0.01 mol/l PBS
containing an antibody against insulin Rβ, IRS-1, Akt1/2/3, GLUT4,
p-Rβ, p-IRS-1, p-Akt1/2/3 or GAPDH, the gel loading control. The
immunolabeled membranes were washed 3 times, 5 min/wash, with 0.01
mol/l PBS-0.02% Tween and then incubated with an HRP-labeled rabbit
anti-mouse or HRP-labeled goat anti-rabbit secondary antibody, as
appropriate (dilution, 1:400) for 1 h at 37°C. Following treatment
with ECL detection reagents, immunoblot images were acquired and
the optical density (intensity) × area (mm2) of the
bands were measured using a UVP GelDoc 310 Imaging system (UVP,
Inc., Upland, CA, USA). The relative target protein expression
levels were estimated by the ratio of the optical density
(intensity) × area (mm2) of the target band and that of
the GAPDH band.
Statistical analysis
Statistical analysis was performed using SPSS
statistical software, version 17.0 (SPSS Inc., Chicago, IL, USA).
Experimental data are presented as the mean ± standard deviation.
All data sets were tested for homogeneity of variance (probability
of error of 5%). Groups with homogeneity of variance were compared
using an analysis of variance. When the heterogeneity of variance
assumption was rejected, groups were compared using F-tests.
P<0.05 was considered to indicate a statistically significant
difference.
Results
NCPB decreases serum glucose levels in
NIDDM rats
Indices of glucose tolerance, insulin sensitivity
and skeletal muscle insulin signaling in NIDDM model rats treated
by daily neurolytic celiac plexus block (NCPB) using 0.5%
lidocaine, and control rats injected with saline were compared.
Fasting OGTTs in NIDDM model rats (T0) revealed
significantly lower mean FBG levels in NCPB group rats following
the 14th and 28th daily NCPB (N14 and N28) compared with the first
measurement prior to NCPB (vs. N0; P<0.01; Fig. 1A). By contrast, control group rats
demonstrated no reduction in FBG following the 14th and 28th daily
saline injection compared with N0; furthermore, NCPB-treated rats
reported significantly lower FBG compared with the control,
saline-treated rats following N14 and N28 (P<0.01; Fig. 1A). NCPB group rats also demonstrated
lower blood sugar levels subsequent to N14 at T1 (60
min; P<0.05; Fig. 1B), and
subsequent to N14 and N28 at T2 (120 min; P<0.01;
Fig. 1C) following glucose gavage,
compared with blood sugar readings at N0. NCPB-treated rats also
reported lower blood sugar values compared with the control group
following N14 and N28, at T1 and at T2
(P<0.01; Fig. 1B and C); however,
it is of note that at T2, control group blood glucose
levels following N14 and N28 were significantly higher than those
at N0 (P<0.05). Serum insulin levels at T0 and
T1 were comparable amongst all groups (Fig. 1D and E); however, the serum insulin
level at T2 was significantly lower than the baseline
value (N0) in NCPB rats (P<0.05 following N14; P<0.01
following N28) and lower than the control group value following N28
at T2 (P<0.05; Fig.
1F). It was therefore concluded that daily NCPB treatments
enhanced glucose tolerance in NIDDM model rats.
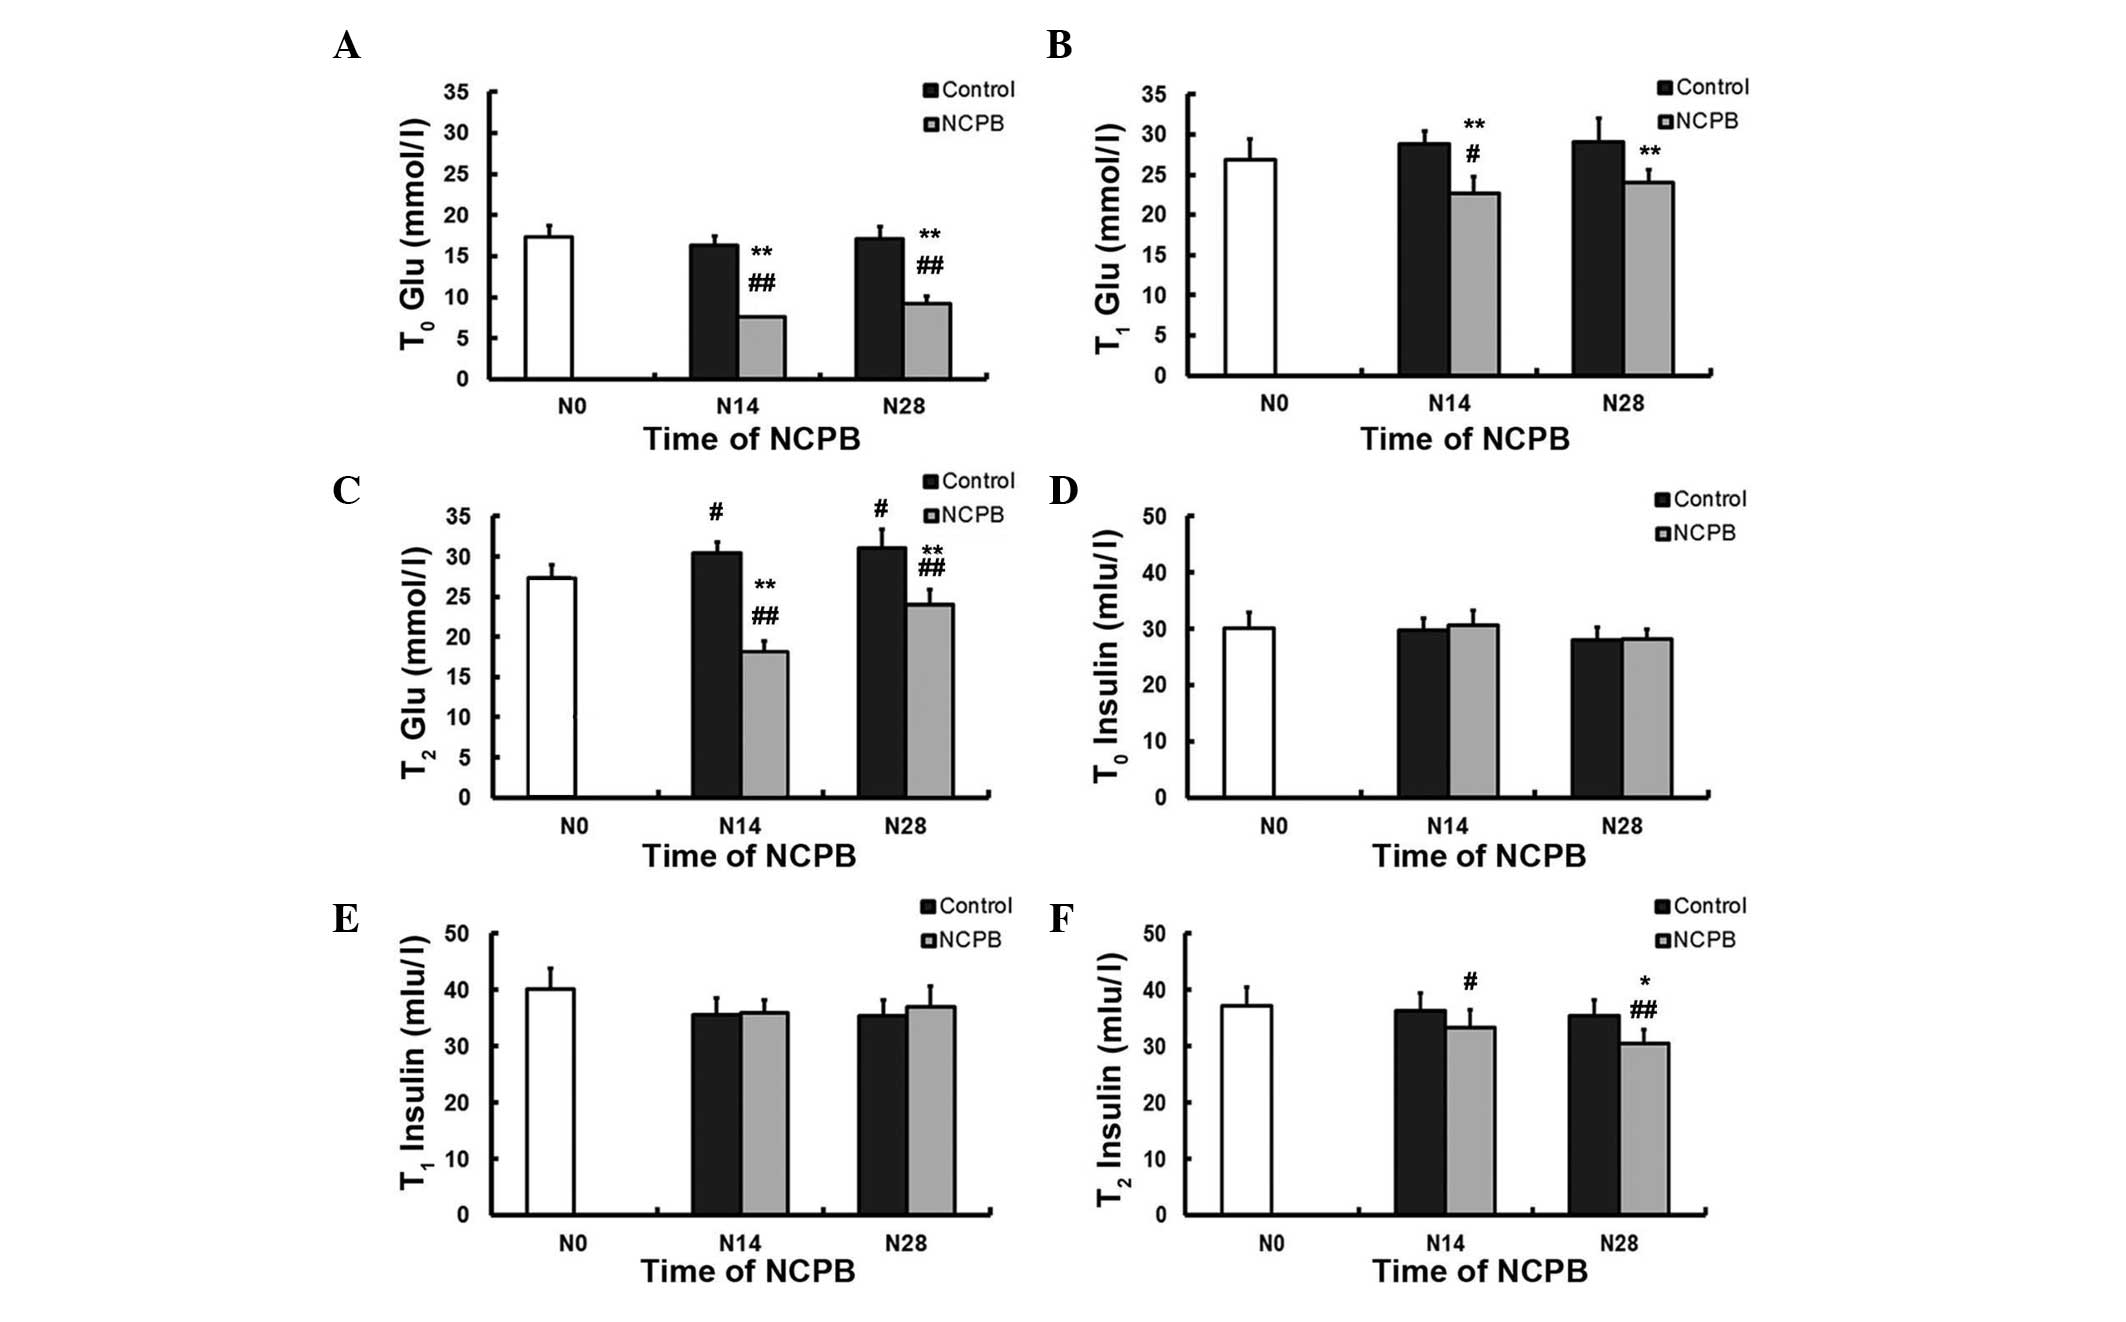 | Figure 1.Daily neurolytic celiac plexus block
enhances glucose tolerance in non-insulin-dependent diabetes
mellitus model rats. The mean concentrations of blood glucose at
(A) T0, (B) T1 and (C) T2, and
serum insulin at (D) T0, (E) T1 and (F)
T2, measured using an oral glucose tolerance test, in
the control and NCPB groups. Data are expressed as the mean ±
standard deviation at each time point (n=5). T0, 0 min
after glucose gavage; T1, 60 min after glucose gavage;
T2, 120 min after glucose gavage; N0, injection day 0;
N14, injection day 14; N28, injection day 28; T, time; Glu, blood
glucose; NCPB, neurolytic celiac plexus block.
#P<0.05 and ##P<0.01 vs. N0; *P<0.05
and **P<0.01 vs. control group. |
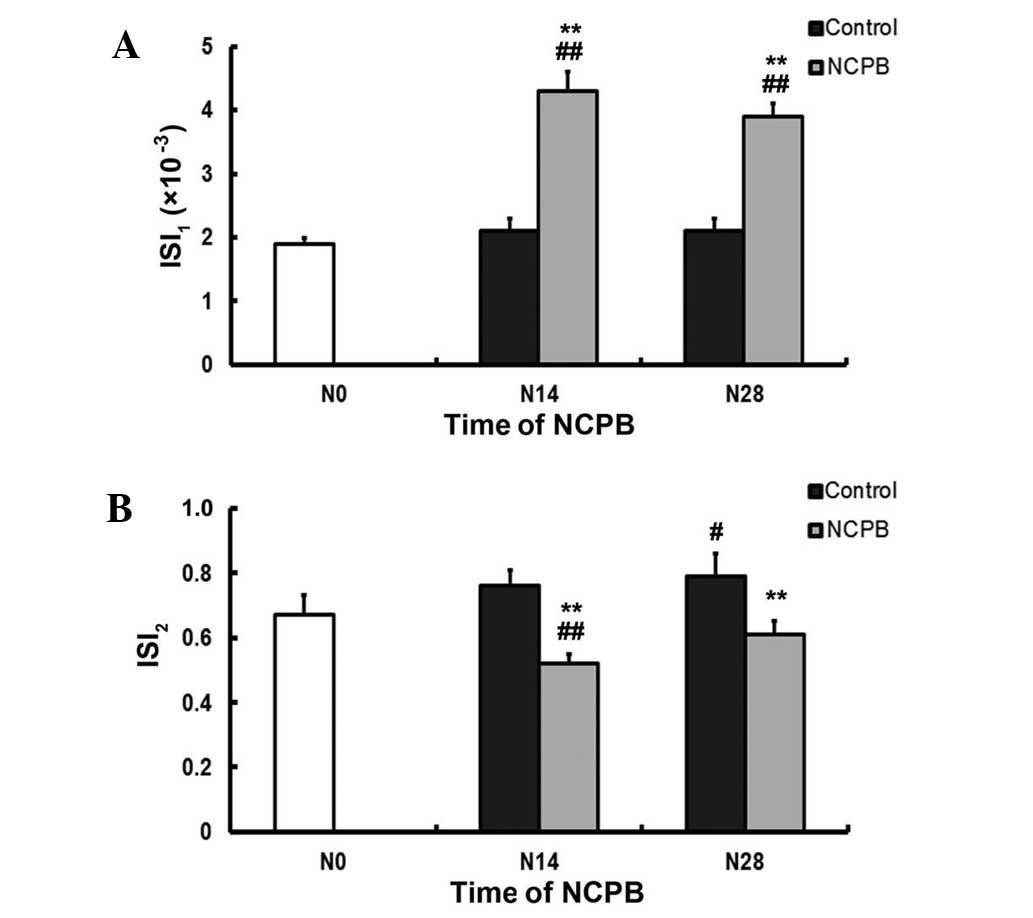
NCPB reduces IR
In the control group, the ISI1 values
measured at N14 and N28 were not significantly different from that
at N0. By contrast, the ISI1 values reported following
N14 and N28 in the NCPB group were significantly higher than the
ISI1 values at N0, and than the relevant control values
(P<0.01; Fig. 2A). The
ISI2 value of the control group at N28 was significantly
higher than that at N0 (P<0.05; Fig.
2B). In the NCPB group, the ISI2 at N14 was
significantly lower than that at N0, and significantly lower than
the corresponding control group values following N14 and N28
(P<0.01; Fig. 2B).
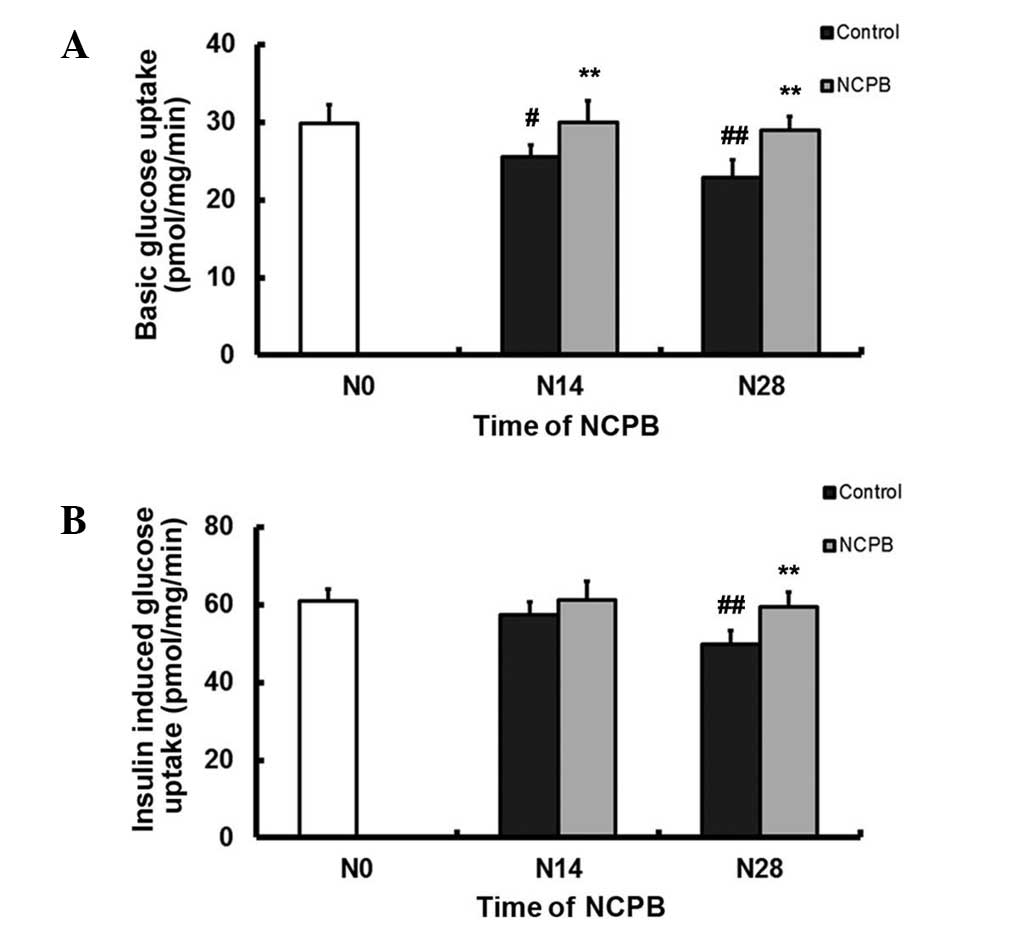
NCPB enhances baseline and
insulin-stimulated glucose uptake in skeletal muscle
Basal glucose uptake by skeletal muscle in control
group rats decreased between N0 and N14 (P<0.05) and more so
following N28 (P<0.01; Fig. 3A).
By contrast, basal glucose uptake was maintained in the NCPB group
rats, revealing no significant change from the N0 baseline but
higher values following N14 and N28 compared with controls
(P<0.01; Fig. 3A).
Insulin-stimulated glucose uptake by skeletal muscle in the control
group rats did not significantly change following N14, but was
significantly lower than that at N0 by N28 (P<0.01; Fig. 3B). Insulin-stimulated glucose uptake
by skeletal muscle from the NCPB group following N14 did not differ
from baseline, but was significantly higher at N28 compared with
that of the control group (P<0.01; Fig. 3B).
NCPB reduces serum FFA and
pro-inflammatory cytokine levels
In the control group, serum TNF-α levels were
significantly higher at N14 and N28 compared with the N0, baseline
level (P<0.05 and P<0.01, respectively; Fig 4A). There was no significant change in
serum TNF-α in the NCPB group following N14 and N28 compared with
the levels at N0; however, N14 and N28 TNF-α levels were
significantly lower than the corresponding control group values
(P<0.05 and P<0.01, respectively; Fig. 4A). Similarly, serum IL-1β levels
increased in the control group compared with the N0 baseline levels
(P<0.05 at N14; P<0.01 at N28), but decreased in the NCPB
group (P<0.01 following N14 and N28 compared with the N0
levels); furthermore, NCPB group values were significantly lower
than corresponding control values (P<0.01; Fig. 4B). Serum IL-6 levels did not change
in the control group during 28 days of saline injections, but were
lower in the NCPB group compared with the N0 baseline levels
(P<0.05 at N14; P<0.01 at N28) and with the corresponding
control group values (P<0.05 and P<0.01, respectively;
Fig. 4C). Control group rats
demonstrated significantly elevated serum FFA levels following N14
and N28 compared with N0 levels (P<0.05 and P<0.01,
respectively; Fig. 4D). By contrast,
serum FFA levels in the NCPB group gradually decreased and were
significantly lower than the N0 baseline values following N28
(P<0.01; Fig. 4D). Following N14
and N28, serum FFA levels were significantly lower in the NCPB
group compared with the respective control group values (P<0.01;
Fig. 4D).
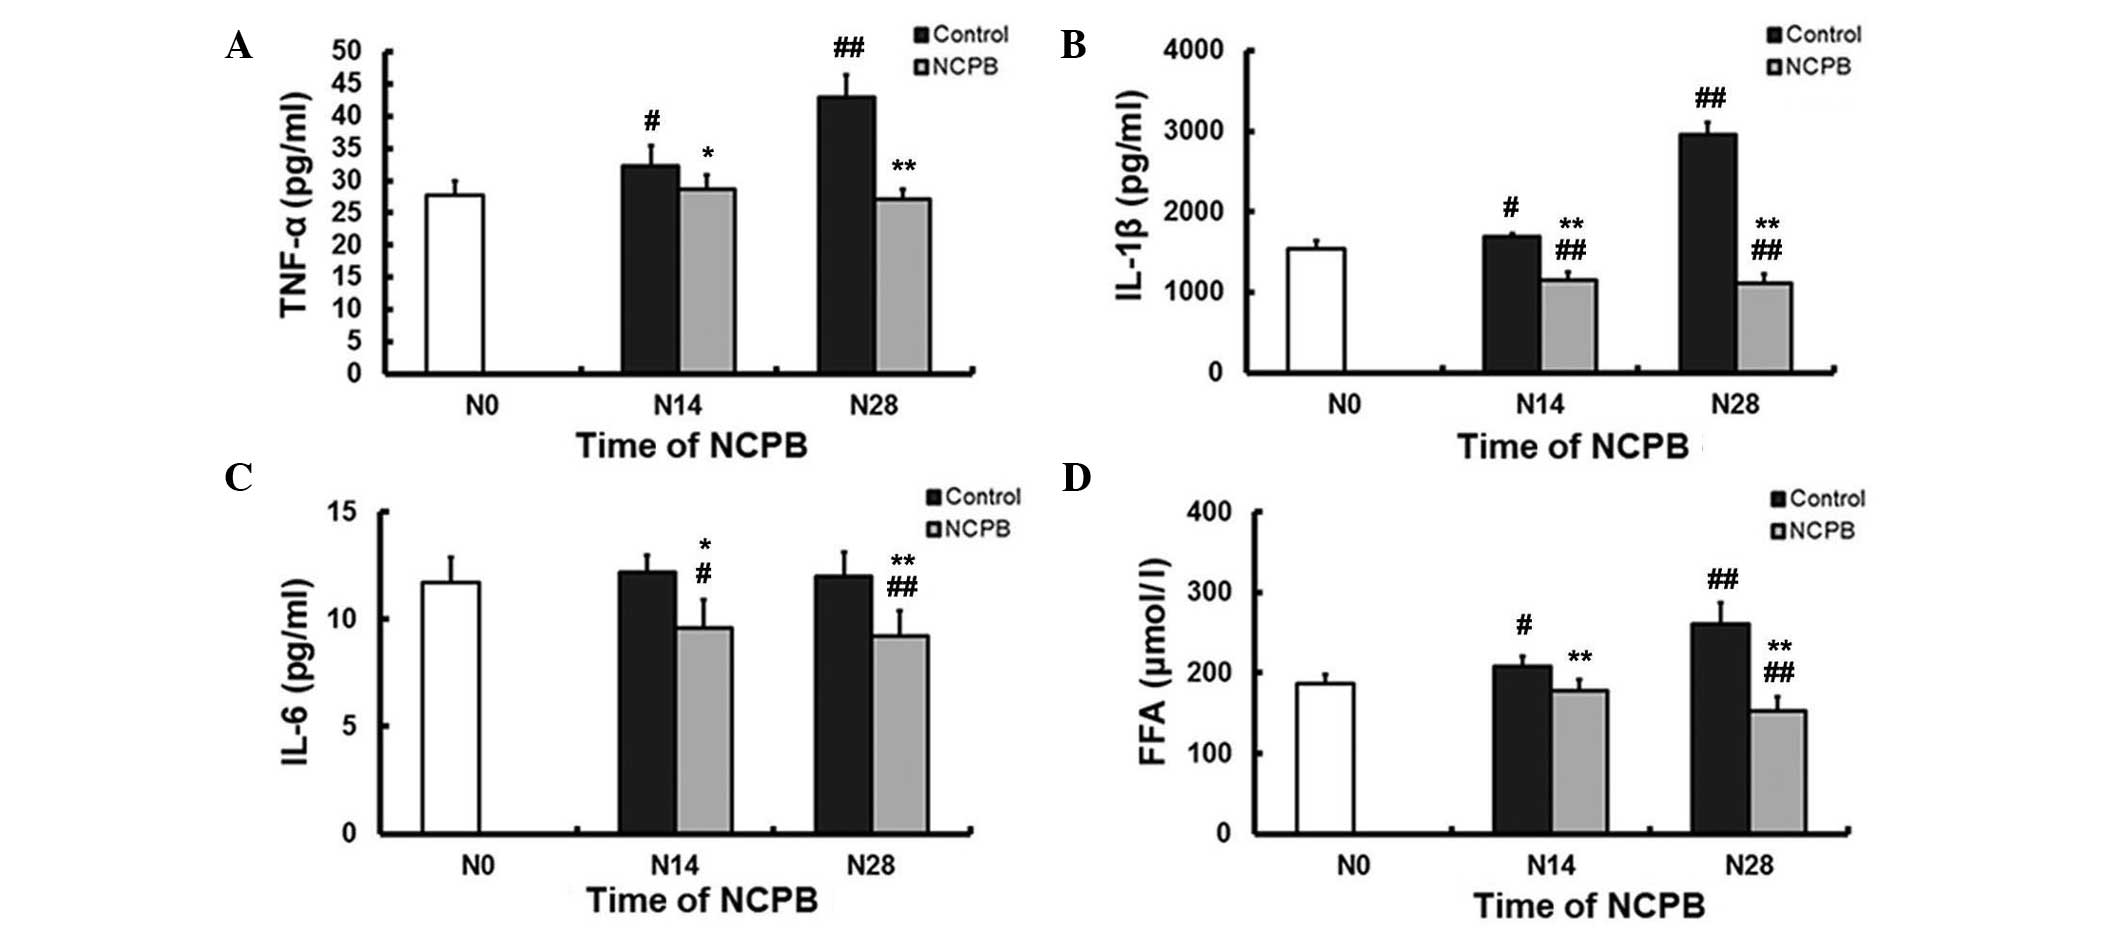 | Figure 4.Serum concentrations of (A) TNF-α,
(B) IL-1β, (C) IL-6, and (D) FFAs in control and NCPB group rats.
Data are expressed as the mean ± standard deviation at each time
point (n=5). N0, injection day 0; N14, injection day 14; N28,
injection day 28; NCPB, neurolytic celiac plexus block; TNF-α,
tumor necrosis factor-α; IL, interleukin; FFAs, free fatty acids.
#P<0.05 and ##P<0.01 vs. N0; *P<0.05
and **P<0.01 vs. control group. |
Expression and activation of insulin
signaling factors in skeletal muscle
Expression of insulin Rβ in skeletal muscle did not
differ significantly from N0 levels in the NCPB or control groups
following N14 and N28 (Fig. 5A and
B). However, Rβ tyrosine 1162 and 1163 dual phosphorylation,
which is required for receptor autophosphorylation and
insulin-induced signaling, including glucose uptake (21,22), was
significantly lower following N14 and N28 in the control group
compared with N0 levels (P<0.01; Fig.
5A and C). In the NCPB group, phosphorylated tyrosine 1162 and
1163 levels did not significantly decrease until N28 (P<0.01),
and N14 and N28 expression levels were significantly higher than
those of the control group at N14 and N28 (P<0.01; Fig. 5A and C). Expression of IRS-1, a key
adaptor protein in transmission of signals from insulin receptors
to Akt and other kinases (23), did
not differ from baseline levels in skeletal muscle from control
rats following N14 or N28, but increased significantly in skeletal
muscle from the NCPB group compared with baseline and control
levels (P<0.01; (Fig. 5A and D).
Phosphorylation of IRS-1 serine 307, a post-translational
modification associated with insulin resistance (24), was unchanged at N14 and N28 relative
to the baseline levels in skeletal muscle from control rats, but
decreased significantly at the two time points in the NCPB group
compared with baseline levels (P<0.01) and with the
corresponding levels observed in the control group (P<0.01;
Fig. 5A and E). Expression of Akt in
skeletal muscle did not differ from baseline values in either group
(Fig. 5A and F), but Akt serine 473
phosphorylation was significantly reduced compared with baseline
levels in control and NCPB groups following N14 and N28 (P<0.0;
Fig. 5A and F). However, expression
was significantly higher in the NCPB group compared with the
control group at N14 (P<0.01) and at N28 (P<0.05; Fig. 5A and G). Finally, skeletal muscle
expression of GLUT4 was significantly reduced following N14 and N28
in the control group (P<0.01), but significantly increased in
the NCPB group following N28 (P<0.05; Fig. 5A and H). GLUT4 expression in the NCPB
group was also significantly higher than that in the control group
following N14 and N28 (P<0.01) (Fig.
5A and H). NCPB therefore partially or completely reversed
numerous alterations to insulin signaling associated with IR and
NIDDM.
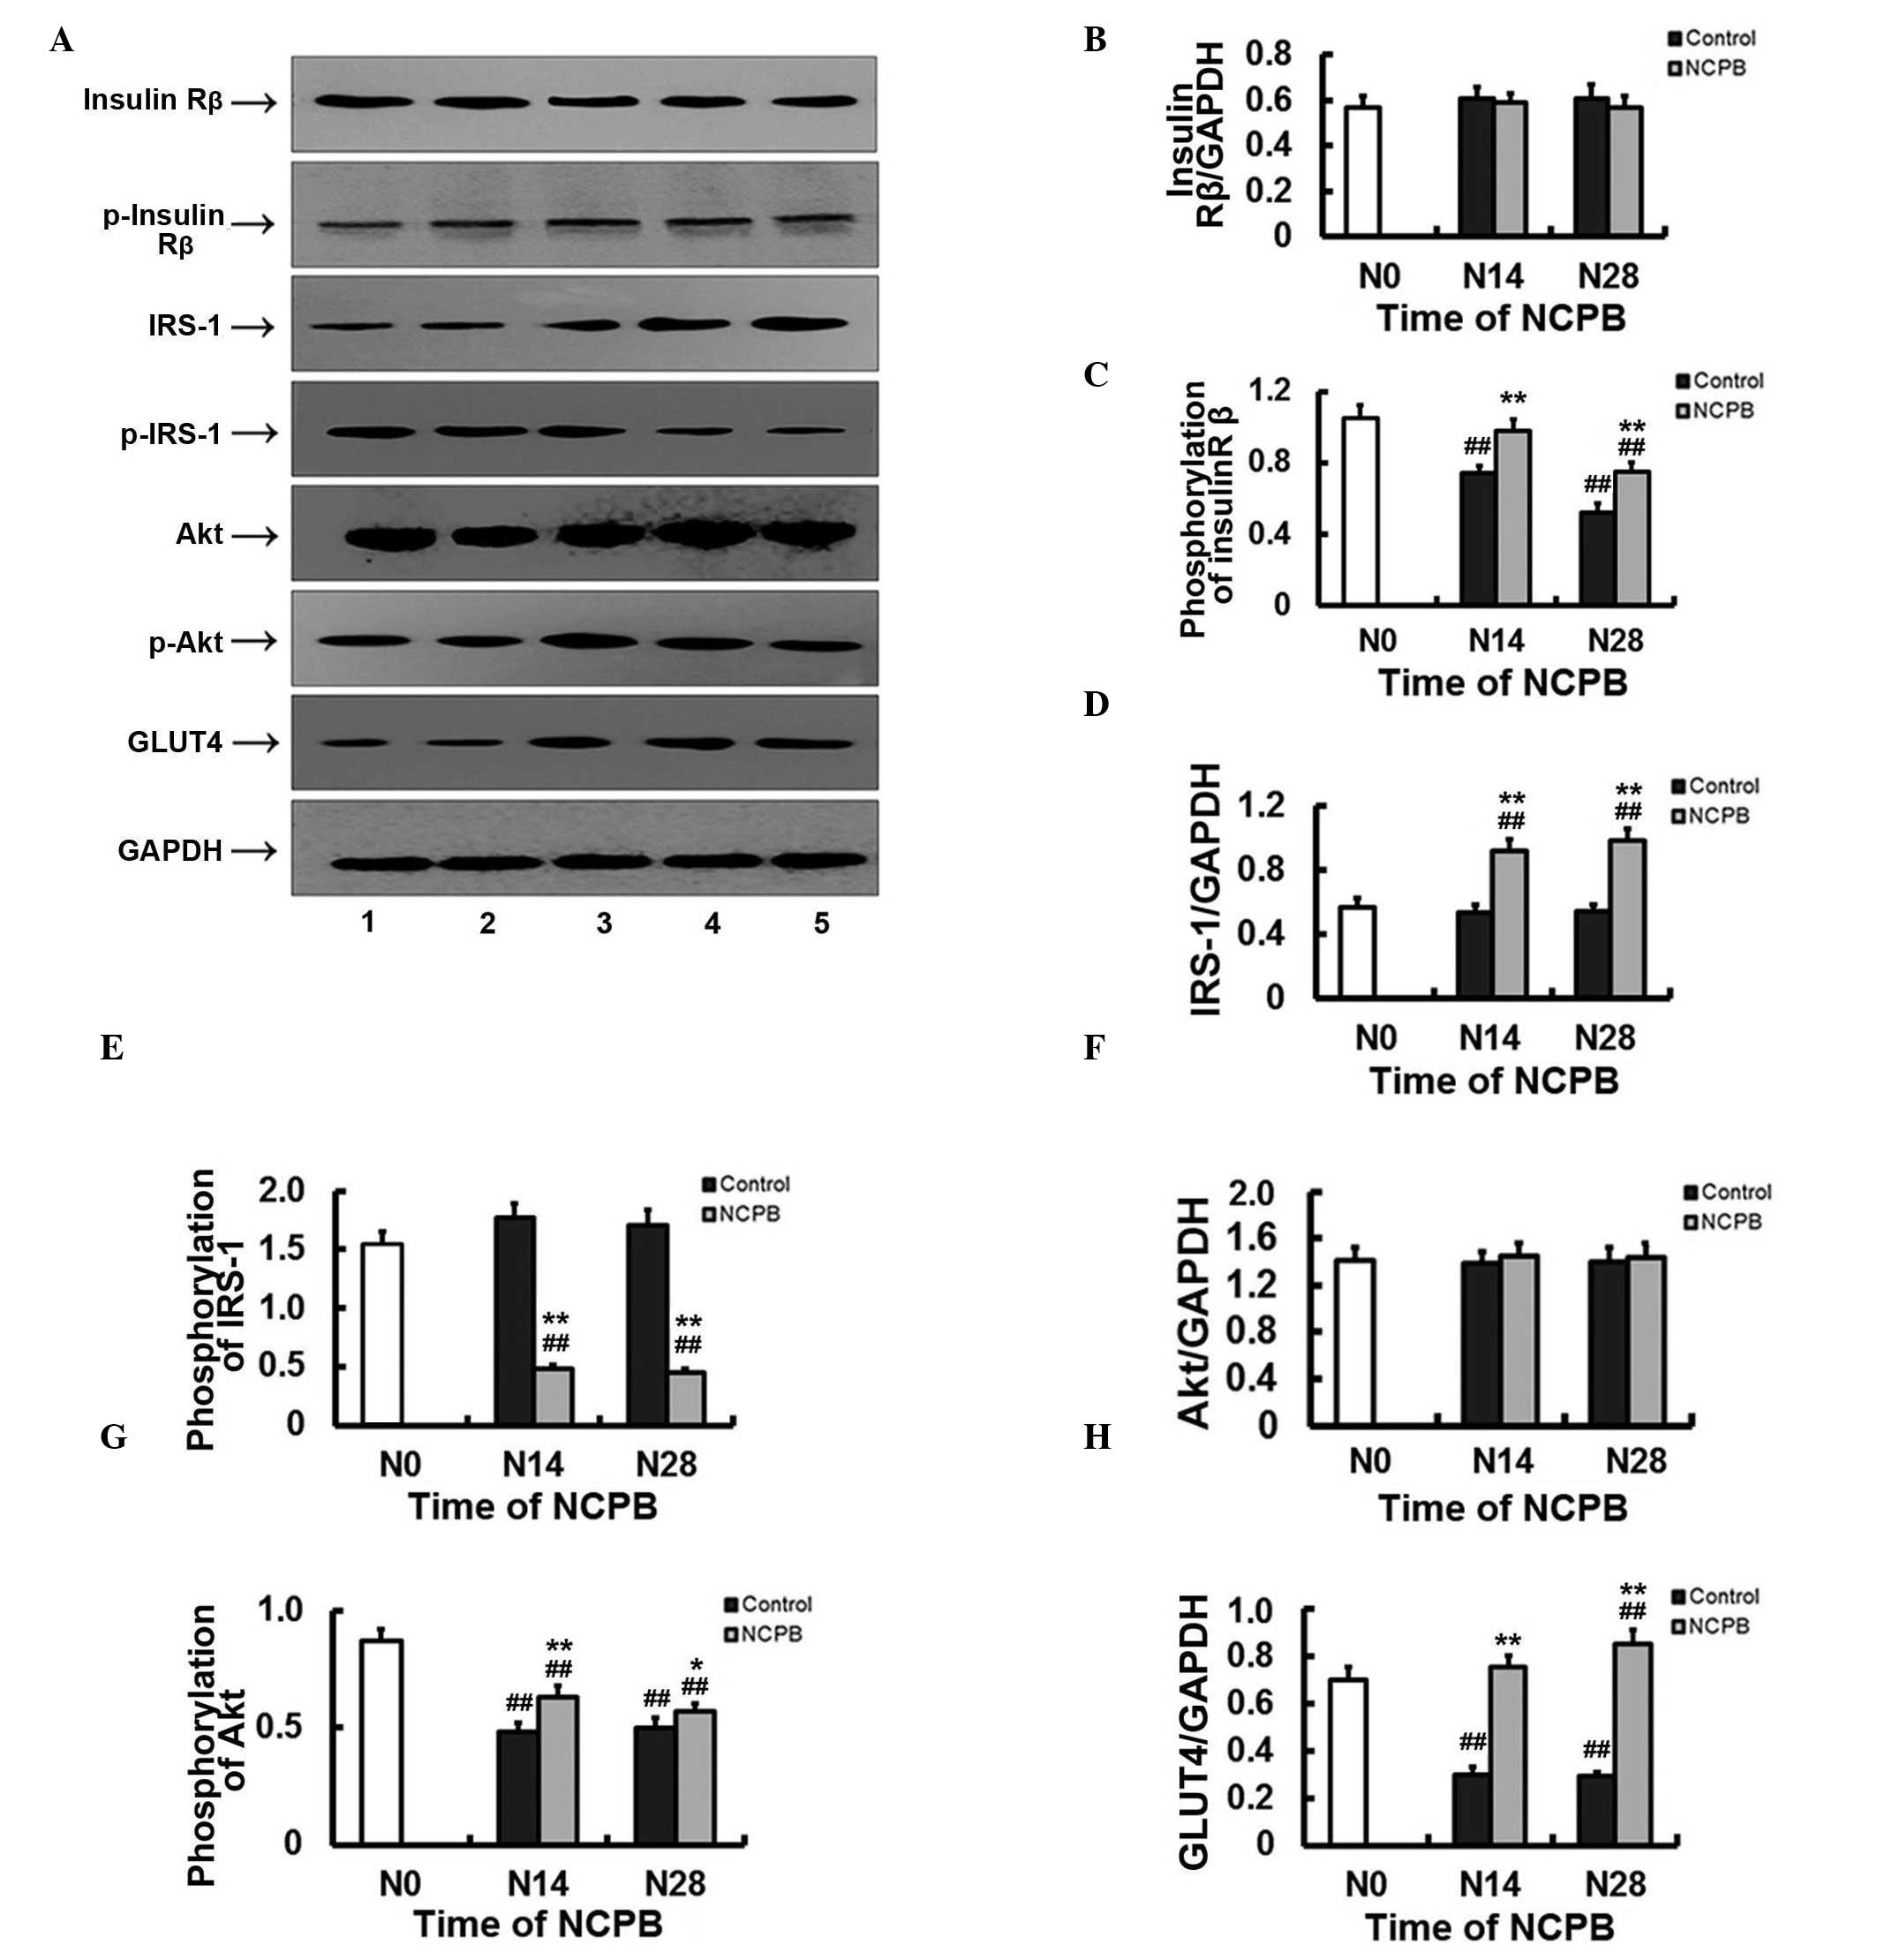 | Figure 5.Protein expression and
phosphorylation levels of muscular insulin Rβ, IRS-1, Akt and GLUT4
in control and NCPB group rats. (A) Lanes 1 and 2, protein
expression or phosphorylation level in the control group at N28 and
N14, respectively. Lane 3, protein expression or phosphorylation
level at N0. Lanes 4 and 5, protein expression or phosphorylation
level in the NCPB group at N14 and N28, respectively. (B-H)
Densitometric analyses (target protein optical density/GAPDH
optical density). (B) Insulin Rβ, (C) pY1162/pY1163 insulin Rβ, (D)
IRS-1, (E) pS307 IRS-1, (F) Akt, (G) pS473 Akt and (H) GLUT4. N,
injection day 0; N14, injection day 14; N28, injection day 28;
IRS-1, insulin receptor substrate-1; GLUT4, glucose transporter
type 4; GAPDH, glyceraldehyde-3-phosphate dehydrogenase; NCPB,
neurolytic celiac plexus block. ##P<0.01 vs. N0;
*P<0.05 and **P<0.01 vs. control group. |
Discussion
In the present study, GK rats fed a high-fat and
high-sugar diet demonstrated several physiological deficits and
molecular changes consistent with NIDDM, including elevated FBG
levels, impaired glucose clearance, IR, reduced skeletal muscle
glucose uptake and reduced expression levels of GLUT4 in skeletal
muscle. In addition, dual Y1162/Y1163 phosphorylation of insulin
receptor β and Akt S473 phosphorylation were reduced. Finally, this
model of NIDDM was associated with elevated serum FFA and
inflammatory cytokine levels. Chronic NCPB, generated by the daily
injection of 0.5% lidocaine, completely or partially attenuated
these changes, which suggests that NCPB may mitigate a number of
the pathophysiological deficits of NIDDM, such as IR, by reducing
inflammatory damage.
IR is a critical pathogenic mechanism leading to the
development of NIDDM. Development of IR involves changes to insulin
receptor expression, and to downstream signaling pathways (25,26). The
insulin receptor is a multifunctional transmembrane glycoprotein
consisting of an α subunit and a β subunit. The α subunit is
responsible for binding insulin, whilst the β subunit has intrinsic
tyrosine protein kinase (TPK) activity that initiates downstream
intracellular signaling events (27). Numerous studies have demonstrated
that diabetic hyperglycemia is associated with aberrant insulin
receptor phosphorylation and reduced TPK activity (28,29). In
the present GK model, insulin Rβ dual tyrosine 1162 and 1163
phosphorylation was markedly reduced. As Y1162/Y1163 dual
phosphorylation is required for TPK autophosphorylation and
activation, this reduction is likely to lead to decreased insulin
signaling, which is indicative of insulin resistance. This
IR-associated change was partially reversed by NCPB, as suggested
by the OGTT results, consistent with partial attenuation of IR.
IRS-1 is an important mediator of insulin signaling
(30). Insulin Rβ Y1162/Y1163 dual
phosphorylation in the NCPB group was lower than baseline levels,
which suggests only partial attenuation of IR, but daily NCPB
significantly increased IRS-1 expression in skeletal muscle; this
may compensate for the reduced insulin Rβ phosphorylation and
thereby maintain skeletal muscle insulin signaling. Furthermore,
insulin-triggered glucose uptake was maintained in NCPB-treated
rats but lower than baseline values were reported in control group
rats. Tyrosine residues 465, 612, 632, 662, 941 and 989 are the
major IRS-1 tyrosine sites and are crucial regulatory sites for
insulin signaling (31).
Inflammatory cytokines hinder IRS tyrosine phosphorylation by
activating serine-threonine kinases that, in turn, phosphorylate
IRS-1 on residues, impeding interaction with insulin receptors and
thereby reducing downstream signaling. TNF-α may also induce the
phosphorylation of IRS-1 at serine 307 (32,33).
Phosphorylation of skeletal muscle IRS-1 at serine 307 was
significantly reduced following NCPB treatments, indicating that
attenuated IR achieved using NCPB may be associated with the
decreased phosphorylation of IRS-1 serine 307.
Akt is a serine/threonine protein kinase and
downstream target of PI3K (34).
Under the action of insulin, PI3K activation produces
phosphatidylinositol 3,4-bisphosphate and phosphatidylinositol
3,4,5-trisphosphate, which promote phosphoinositide-dependent
kinase-1-mediated phosphorylation, activating Akt (35). Akt has two phosphorylation sites,
serine 473 and threonine 308, and Akt is completely activated only
when the two sites are phosphorylated (36). NCPB treatment did not affect Akt
expression levels, but did partially reverse the reduced
phosphorylation at serine 473 in control GK rats. Phosphorylated
Akt may regulate insulin metabolism by controlling GLUT
translocation (37) and NCPB may
therefore maintain skeletal muscle glucose uptake by sustaining Akt
activity. As a polar molecule, glucose must be transported into
cells across the cell membrane by GLUTs in the majority of tissues,
with the exception of cells in the small intestine and the renal
tubules (38,39). GLUT4 is an insulin-dependent glucose
transporter that is only expressed in insulin-sensitive tissues,
such as skeletal muscle, cardiac muscle and adipose tissue.
GLUT4-mediated glucose transport is the rate-limiting step in
glucose utilization in peripheral tissues such as fat and muscle.
Reduced expression or translocation of GLUT4 impairs glucose
utilization in peripheral tissues, thereby causing IR (40). In the adipocytes of patients with
NIDDM and obese individuals, GLUT4 expression is significantly
reduced (41) and, whilst total
skeletal muscle GLUT4 expression is normal, defects occur in GLUT4
translocation to the membrane (42).
In the current study, GLUT4 expression in skeletal muscle was
significantly increased by NCPB, possibly by maintenance of Akt
phospho-activation and sustained membrane translocation, which is
consistent with maintenance of skeletal muscle glucose uptake and
improved glucose clearance in NCPB-treated rats.
Inflammation is a central pathogenic mechanism in
the development of IR and type 2 diabetes (43–46).
Obesity, a key risk factor for NIDDM, is associated with chronic
inflammation and the release of inflammatory mediators such as
TNF-α from adipose tissue; these inflammatory components may
subsequently reduce insulin signaling and insulin-evoked glucose
uptake into skeletal muscle, and may also damage insulin-producing
pancreatic β cells (3–6,11,12,43–46).
As observed, TNF-α interferes with insulin receptor downstream
signaling by phosphorylating IRS-1 at serine 307, resulting in
reduced PI3K/Akt activity and GLUT4 translocation (32,33,47–49). In
addition, TNF-α also directly inhibits GLUT4 mRNA expression
(50–52). Furthermore, TNF-α directly inhibits
adipocyte differentiation and accelerates the decomposition of fat,
resulting in increased serum FFA levels (53,54),
which can cause IR by PKC-θ-mediated IRS-1 serine 307
phosphorylation (55). TNF-α may
also indirectly affect insulin signaling by stimulating the
secretion of glucocorticoids, glucagon and catecholamines (56). In the present study, NCPB treatment
reduced serum FFA and TNF-α levels, which may have contributed to
the reduction in IR.
IL-1β can also induce IR by interfering with insulin
signaling. Activation of IL-1R induces the secretion and release of
other pro-inflammatory cytokines by activating inhibitor of nuclear
factor (NF)-κB kinase β subunit and NF-κB. Inhibitor of NF-κB
kinase β subunit additionally prevents the association of InR and
IRS, thereby terminating insulin signaling to PI3K, by
phosphorylating IRS-1 at serine 307 (24,57).
Furthermore, IL-1β can phosphorylate IRS-1 serine 307 through the
activation of c-Jun N-terminal kinases (33), increase the expression of suppressor
of cytokine signaling (SOCS) (58),
thereby inhibiting insulin receptor-mediated tyrosine
phosphorylation of IRS, and promote IRS-1/2 degradation through the
competitive tyrosine phosphorylation of insulin receptor tyrosine
960 (59). IL-1β also decreases
GLUT4 gene expression, shortens GLUT4 mRNA half-life (60) and reduces transmembrane GLUT4
transport by attenuating Akt activity (61). IL-1β can additionally decrease IRS-1
mRNA levels via the activation of extracellular signaling
regulatory kinases (62), and may
phosphorylate serine 24 of the IRS-1 pleckstrin homology domain to
reduce its tyrosine phosphorylation (63). The increase in serum IL-1β levels
observed in control GK rats was markedly inhibited by NCPB in the
current study, possibly contributing to the reduced IR observed in
the NCPB-treated GK rats. IL-6 has previously been reported to
reduce insulin receptor expression, IRS expression, IRS tyrosine
phosphorylation, Akt activation and GLUT4 expression (64,65) and
to induce SOCS expression through the Janus kinase/Signal
Transducer and Activator of Transcription signaling pathway to
suppress insulin signaling. Similarly to IL-1β and TNF-α, serum
levels of IL-6 were significantly decreased following NCPB in the
present study, which may have contributed to the alleviation of
IR.
Serum FFAs may interfere with multiple aspects of
insulin signaling. In a previous study using transgenic mice,
elevated FFAs reduced IRS-2 expression, IRS-2 phosphorylation, PI3K
activity and GLUT2 expression in liver cells (66); the reduction in IR resulting from
NCPB treatments observed in the present study may therefore have
resulted in part from reduced serum FFA levels.
The analgesic effect of NCPB is hypothesized to
depend on a reduction in the response of the sympathetic nervous
system and inhibition of catecholamine release. These effects may
also be involved in the reduction of serum FFA and inflammatory
cytokine secretion, although this requires additional study. Whilst
the mechanisms behind NCPB have yet to be elucidated, it is evident
that NCPB can attenuate IR in GK rats by improving insulin
signaling and enhancing glucose uptake, suggesting that NCPB may be
a feasible treatment for NIDDM. Clinical studies are necessary to
test the efficacy of this potential therapeutic in patients with
NIDDM.
Acknowledgements
This study was funded by the Open Foundation of
Development and Regeneration Key Laboratory of Sichuan Province
(grant no. 12z058), the Hospital Foundation of General Hospital of
Chengdu Military Command Area (grant no. 2013YG-B010) and the
National Natural Science Foundation of China (grant no.
81171869/H2101).
References
|
1
|
Chen L, Magliano DJ and Zimmet PZ: The
worldwide epidemiology of type 2 diabetes mellitus - present and
future perspectives. Nat Rev Endocrinol. 8:228–236. 2011.
View Article : Google Scholar : PubMed/NCBI
|
|
2
|
Brunetti A, Chiefari E and Foti D: Recent
advances in the molecular genetics of type 2 diabetes mellitus.
World J Diabetes. 5:128–140. 2014.PubMed/NCBI
|
|
3
|
Montane J, Cadavez L and Novials A: Stress
and the inflammatory process: A major cause of pancreatic cell
death in type 2 diabetes. Diabetes Metab Syndr Obes. 7:25–34.
2014.PubMed/NCBI
|
|
4
|
Mandrup-Poulsen T: Type 2 diabetes
mellitus: A metabolic autoinflammatory disease. Dermatol Clin.
31:495–506. 2013. View Article : Google Scholar : PubMed/NCBI
|
|
5
|
Eguchi K and Manabe I: Macrophages and
islet inflammation in type 2 diabetes. Diabetes Obes Metab.
15(Suppl 3): 152–158. 2013. View Article : Google Scholar : PubMed/NCBI
|
|
6
|
Richardson VR, Smith KA and Carter AM:
Adipose tissue inflammation: Feeding the development of type 2
diabetes mellitus. Immunobiology. 218:1497–1504. 2013. View Article : Google Scholar : PubMed/NCBI
|
|
7
|
Mackenzie RW and Elliott BT: Akt/PKB
activation and insulin signaling: A novel insulin signaling pathway
in the treatment of type 2 diabetes. Diabetes Metab Syndr Obes.
7:55–64. 2014. View Article : Google Scholar : PubMed/NCBI
|
|
8
|
McPhee JB and Schertzer JD:
Immunometabolism of obesity and diabetes: Microbiota link
compartmentalized immunity in the gut tometabolic tissue
inflammation. Clin Sci (Lond). 129:1083–1096. 2015. View Article : Google Scholar : PubMed/NCBI
|
|
9
|
Tanti JF, Ceppo F, Jager J and Berthou F:
Implication of inflammatory signaling pathways in obesity-induced
insulin resistance. Front Endocrinol (Lausanne). 8:1812013.
|
|
10
|
Jaiswal N, Gunaganti N, Maurya CK,
Narender T and Tamrakar AK: Free fatty acid induced impairment of
insulin signaling is prevented by the diastereomeric mixture of
calophyllic acid and isocalophyllic acid in skeletal muscle cells.
Eur J Pharmacol. 746:70–77. 2015. View Article : Google Scholar : PubMed/NCBI
|
|
11
|
Luo C, Yang H, Tang C, Yao G, Kong L, He H
and Zhou Y: Kaempferol alleviates insulin resistance via hepatic
IKK/NF-κB signal in type 2 diabetic rats. Int Immunopharmacol.
28:744–750. 2015. View Article : Google Scholar : PubMed/NCBI
|
|
12
|
McCall KD, Holliday D, Dickerson E,
Wallace B, Schwartz AL, Schwartz C, Lewis CJ, Kohn LD and Schwartz
FL: Phenylmethimazole blocks palmitate-mediated induction of
inflammatory cytokine pathways in 3T3L1 adipocytes and RAW 264.7
macrophages. J Endocrinol. 207:343–353. 2010. View Article : Google Scholar : PubMed/NCBI
|
|
13
|
Yang FR, Wu BS, Lai GH, Wang Q, Yang LQ,
He MW and Ni JX: Assessment of consecutive neurolytic celiac plexus
block (NCPB) technique outcomes in the management of refractory
visceral cancer pain. Pain Med. 13:518–521. 2012. View Article : Google Scholar : PubMed/NCBI
|
|
14
|
Li J, Wei XH, Lin L, Che JX, Qiu QM, Zuo
HT, An H, Liu YH, Bai SR and Tian FZ: Effect of neurolytic celiac
plexus block on insulin resistance after partial hepatectomy in
rats. Zhongguo Ji Jiu Yi Xue. 33:1124–1126. 2013.(In Chinese).
|
|
15
|
Akash MS, Rehman K and Chen S:
Goto-Kakizaki rats: Its suitability as non-obese diabetic animal
model for spontaneous type 2 diabetes mellitus. Curr Diabetes Rev.
9:387–396. 2013. View Article : Google Scholar : PubMed/NCBI
|
|
16
|
Portha B, Giroix MH, Tourrel-Cuzin C,
Le-Stunff H and Movassat J: The GK rat: A prototype for the study
of non-overweight type 2 diabetes. Methods Mol Biol. 933:125–159.
2012.PubMed/NCBI
|
|
17
|
Chen R, Wang L, Cao HW, Tang CW, Bai XZ
and Ji QH: Expression of GLP-1 receptor mRNA in intestine and
pancreas of diabetic rats. Di 4 Jun Yi Da Xue Xue Bao.
29:1235–1238. 2008.(In Chinese).
|
|
18
|
Li J, Yan HT, Che JX, Bai SR, Qiu QM, Ren
L, Pan F, Sun XQ, Tian FZ, Li DX and Tang LJ: Effects of neurolytic
celiac plexus block on liver regeneration in rats with partial
hepatectomy. PLoS One. 8:e731012013. View Article : Google Scholar : PubMed/NCBI
|
|
19
|
Wincey C and Marks V: A micro-method for
measuring glucose using the autoanalyzer and glucose-oxidase. J
Clin Pathol. 14:558–559. 1961. View Article : Google Scholar : PubMed/NCBI
|
|
20
|
Banerji MA, Chaiken RL, Gordon D, Kral JG
and Lebovitz HE: Does intra-abdominal adipose tissue in black men
determine whether NIDDM is insulin-resistant or insulin-sensitive?
Diabetes. 44:141–146. 1995. View Article : Google Scholar : PubMed/NCBI
|
|
21
|
Ellis L, Clauser E, Morgan DO, Edery M,
Roth RA and Rutter WJ: Replacement of insulin receptor tyrosine
residues 1162 and 1163 compromises insulin-stimulated kinase
activity and uptake of 2-deoxyglucose. Cell. 45:721–732. 1986.
View Article : Google Scholar : PubMed/NCBI
|
|
22
|
Cherqui G, Reynet C, Caron M, Melin B,
Wicek D, Clauser E, Capeau J and Picard J: Insulin receptor
tyrosine residues 1162 and 1163 control insulin stimulation of
myristoyl-diacylglycerol generation and subsequent activation of
glucose transport. J Biol Chem. 265:21254–21261. 1990.PubMed/NCBI
|
|
23
|
Virkamäki A, Ueki K and Kahn CR:
Protein-protein interaction in insulin signaling and the molecular
mechanisms of insulin resistance. J Clin Invest. 103:931–943. 1999.
View Article : Google Scholar : PubMed/NCBI
|
|
24
|
Aguirre V, Werner ED, Giraud J, Lee YH,
Shoelson SE and White MF: Phosphorylation of Ser307 in insulin
receptor substrate-1 blocks interactions with the insulin receptor
and inhibits insulin action. J Biol Chem. 277:1531–1537. 2002.
View Article : Google Scholar : PubMed/NCBI
|
|
25
|
Hsueh WA and Buchanan TA: Obesity and
hypertension. Endocrinol Metab Clin North Am. 23:405–427.
1994.PubMed/NCBI
|
|
26
|
Elmendorf JS, Damrau-Abney A, Smith TR,
David TS and Turinsky J: Phosphatidylinositol 3-kinase and dynamics
of insulin resistance in denervated slow and fast muscles in vivo.
Am J Physiol. 272:E661–E670. 1997.PubMed/NCBI
|
|
27
|
Lee J and Pilch PF: The insulin receptor:
Structure, function and signaling. Am J Physiol. 266:C319–C334.
1994.PubMed/NCBI
|
|
28
|
Kobayashi M, Iwanishi M, Egawa K and
Shigeta Y: Pioglitazone increases insulin sensitivity by activating
insulin receptor kinase. Diabetes. 41:476–483. 1992. View Article : Google Scholar : PubMed/NCBI
|
|
29
|
Ola MS: Effect of hyperglycemia on insulin
receptor signaling in the cultured retinal Müller glial cells.
Biochem Biophys Res Commun. 444:264–269. 2014. View Article : Google Scholar : PubMed/NCBI
|
|
30
|
Fasshauer M, Klein J, Kriauciunas KM, Ueki
K, Benito M and Kahn CR: Essential role of insulin receptor
substrate 1 in differentiation of brown adipocytes. Mol Cell Biol.
21:319–329. 2001. View Article : Google Scholar : PubMed/NCBI
|
|
31
|
Lehr S, Kotzka J, Herkner A, Sikmann A,
Meyer HE, Krone W and Müller-Wieland D: Identification of major
tyrosine phosphorylation sites in the human insulin receptor
substrate Gab-1 by insulin receptor kinase in vitro. Biochemistry.
39:10898–10907. 2000. View Article : Google Scholar : PubMed/NCBI
|
|
32
|
Hotamisligil GS, Peraldi P, Budavari A,
Ellis R, White MF and Spiegelman BM: IRS-1-mediated inhibition of
insulin receptor tyrosine kinase activity in TNF-alpha- and
obesity-induced insulin resistance. Science. 271:665–668. 1996.
View Article : Google Scholar : PubMed/NCBI
|
|
33
|
Aguirre V, Uchida T, Yenush L, Davis R and
White MF: The c-Jun NH(2)-terminal kinase promotes insulin
resistance during association with insulin receptor substrate-1 and
phosphorylation of Ser (307). J Biol Chem. 275:9047–9054. 2000.
View Article : Google Scholar : PubMed/NCBI
|
|
34
|
Anderson KE, Coadwell J, Stephens LR and
Hawkins PT: Translocation of PDK-1 to the plasma membrane is
important in allowing PDK-1 to activate protein kinase B. Curr
Biol. 8:684–691. 1998. View Article : Google Scholar : PubMed/NCBI
|
|
35
|
Cao S, Li B, Yi X, Chang B, Zhu B, Lian Z,
Zhang Z, Zhao G, Liu H and Zhang H: Effects of exercise on AMPK
signaling and downstream components to PI3K in rat with type 2
diabetes. PLoS One. 7:e517092012. View Article : Google Scholar : PubMed/NCBI
|
|
36
|
He L, Simmen FA, Mehendale HM, Ronis MJ
and Badger TM: Chronic ethanol intake impairs insulin signaling in
rats by disrupting Akt association with the cell membrane. Role of
TRB3 in inhibition of Akt/protein kinase B activation. J Biol Chem.
281:11126–11134. 2006. View Article : Google Scholar : PubMed/NCBI
|
|
37
|
Rea S and James DE: Moving GLUT4: The
biogenesis and trafficking of GLUT4 storage vesicles. Diabetes.
46:1667–1677. 1997. View Article : Google Scholar : PubMed/NCBI
|
|
38
|
Mueckler M: Facilitative glucose
transporters. Eur J Biochem. 219:713–725. 1994. View Article : Google Scholar : PubMed/NCBI
|
|
39
|
Mueckler M, Caruso C, Baldwin SA, Panico
M, Blench I, Morris HR, Allard WJ, Lienhard GE and Lodish HF:
Sequence and structure of a human glucose transporter. Science.
229:941–945. 1985. View Article : Google Scholar : PubMed/NCBI
|
|
40
|
Kahn BB: Facilitative glucose
transporters: Regulatory mechanisms and dysregulation in diabetes.
J Clin Invest. 89:1367–1374. 1992. View Article : Google Scholar : PubMed/NCBI
|
|
41
|
Garvey WT, Maianu L, Huecksteadt TP,
Birnbaum MJ, Molina JM and Ciaraldi TP: Pretranslational
suppression of a glucose transporter protein causes insulin
resistance in adipocytes from patients with non-insulin-dependent
diabetes mellitus and obesity. J Clin Invest. 87:1072–1081. 1991.
View Article : Google Scholar : PubMed/NCBI
|
|
42
|
Kelley DE, Mintun MA, Watkins SC, Simoneau
JA, Jadali F, Fredrickson A, Beattie J and Thériault R: The effect
of non-insulin-dependent diabetes mellitus and obesity on glucose
transport and phosphorylation in skeletal muscle. J Clin Invest.
97:2705–2713. 1996. View Article : Google Scholar : PubMed/NCBI
|
|
43
|
Calle MC and Fernandez ML: Inflammation
and type 2 diabetes. Diabetes Metab. 38:183–191. 2012. View Article : Google Scholar : PubMed/NCBI
|
|
44
|
Donath MY: Inflammation as a sensor of
metabolic stress in obesity and type 2 diabetes. Endocrinology.
152:4005–4006. 2011. View Article : Google Scholar : PubMed/NCBI
|
|
45
|
Borst SE: The role of TNF-alpha in insulin
resistance. Endocrine. 23:177–182. 2004. View Article : Google Scholar : PubMed/NCBI
|
|
46
|
Qi C and Pekala PH: Tumor necrosis
factor-alpha-induced insulin resistance in adipocytes. Proc Soc Exp
Biol Med. 223:128–135. 2000. View Article : Google Scholar : PubMed/NCBI
|
|
47
|
Kanety H, Feinstein R, Papa MZ, Hemi R and
Karasik A: Tumor necrosis factor alpha-induced phosphorylation of
insulin receptor substrate-1 (IRS-1). Possible mechanism for
suppression of insulin-stimulated tyrosine phosphorylation of
IRS-1. J Biol Chem. 270:23780–23784. 1995. View Article : Google Scholar : PubMed/NCBI
|
|
48
|
Paz K, Hemi R, LeRoith D, Karasik A,
Elhanany E, Kanety H and Zick Y: A molecular basis for insulin
resistance. Elevated serine/threonine phosphorylation of IRS-1 and
IRS-2 inhibits their binding to the juxtamembrane region of the
insulin receptor and impairs their ability to undergo
insulin-induced tyrosine phosphorylation. J Biol Chem.
272:29911–29918. 1997. View Article : Google Scholar : PubMed/NCBI
|
|
49
|
Heydrick SJ, Jullien D, Gautier N, Tanti
JF, Giorgetti S, Van Obberghen E and Le Marchand-Brustel Y: Defect
in skeletal muscle phosphatidylinositol-3-kinase in obese
insulin-resistant mice. J Clin Invest. 91:1358–1366. 1993.
View Article : Google Scholar : PubMed/NCBI
|
|
50
|
Stephens JM, Lee J and Pilch PF: Tumor
necrosis factor-alpha-induced insulin resistance in 3T3-L1
adipocytes is accompanied by a loss of insulin receptor substrate-1
and GLUT4 expression without a loss of insulin receptor-mediated
signal transduction. J Biol Chem. 272:971–976. 1997. View Article : Google Scholar : PubMed/NCBI
|
|
51
|
Wang CN, O'Brien L and Brindley DN:
Effects of cell-permeable ceramides and tumor necrosis factor-alpha
on insulin signaling and glucose uptake in 3T3-L1 adipocytes.
Diabetes. 47:24–31. 1998. View Article : Google Scholar : PubMed/NCBI
|
|
52
|
Hauner H, Petruschke T, Russ M, Röhrig K
and Eckel J: Effects of tumour necrosis factor alpha (TNF alpha) on
glucose transport and lipid metabolism of newly-differentiated
human fat cells in cell culture. Diabetologia. 38:764–771. 1995.
View Article : Google Scholar : PubMed/NCBI
|
|
53
|
Miles PD, Romeo OM, Higo K, Cohen A,
Rafaat K and Olefsky JM: TNF-alpha-induced insulin resistance in
vivo and its prevention by troglitazone. Diabetes. 46:1678–1683.
1997. View Article : Google Scholar : PubMed/NCBI
|
|
54
|
Lang CH, Dobrescu C and Bagby GJ: Tumor
necrosis factor impairs insulin action on peripheral glucose
disposal and hepatic glucose output. Endocrinology. 130:43–52.
1992. View Article : Google Scholar : PubMed/NCBI
|
|
55
|
Yu C, Chen Y, Cline GW, Zhang D, Zong H,
Wang Y, Bergeron R, Kim JK, Cushman SW, Cooney GJ, et al: Mechanism
by which fatty acids inhibit insulin activation of insulin receptor
substrate-1 (IRS-1)-associated phosphatidylinositol 3-kinase
activity in muscle. J Biol Chem. 277:50230–50236. 2002. View Article : Google Scholar : PubMed/NCBI
|
|
56
|
Hotamisligil GS and Spiegelman BM: Tumor
necrosis factor alpha: A key component of the obesity-diabetes
link. Diabetes. 43:1271–1278. 1994. View Article : Google Scholar : PubMed/NCBI
|
|
57
|
Takaesu G, Ninomiya-Tsuji J, Kishida S, Li
X, Stark GR and Matsumoto K: Interleukin-1 (IL-1)
receptor-associated kinase leads to activation of TAK1 by inducing
TAB2 translocation in the IL-1 signaling pathway. Mol Cell Biol.
21:2475–2484. 2001. View Article : Google Scholar : PubMed/NCBI
|
|
58
|
Emanuelli B, Glondu M, Filloux C, Peraldi
P and Van Obberghen E: The potential role of SOCS-3 in the
interleukin-1beta-induced desensitization of insulin signaling in
pancreatic beta-cells. Diabetes. 53(Suppl 3): S97–S103. 2004.
View Article : Google Scholar : PubMed/NCBI
|
|
59
|
Rui L, Yuan M, Frantz D, Shoelson S and
White MF: SOCS-1 and SOCS-3 block insulin signaling by
ubiquitin-mediated degradation of IRS1 and IRS2. J Biol Chem.
277:42394–42398. 2002. View Article : Google Scholar : PubMed/NCBI
|
|
60
|
Fujishiro M, Gotoh Y, Katagiri H, Sakoda
H, Ogihara T, Anai M, Onishi Y, Ono H, Funaki M, Inukai K, et al:
MKK6/3 and p38 MAPK pathway activation is not necessary for
insulin-induced glucose uptake but regulates glucose transporter
expression. J Biol Chem. 276:19800–19806. 2001. View Article : Google Scholar : PubMed/NCBI
|
|
61
|
Eguez L, Lee A, Chavez JA, Miinea CP, Kane
S, Lienhard GE and McGraw TE: Full intracellular retention of GLUT4
requires AS160 Rab GTPase activating protein. Cell Metab.
2:263–272. 2005. View Article : Google Scholar : PubMed/NCBI
|
|
62
|
Jager J, Grémeaux T, Cormont M, Le
Marchand-Brustel Y and Tanti JF: Interleukin-1beta-induced insulin
resistance in adipocytes through down-regulation of insulin
receptor substrate-1 expression. Endocrinology. 148:241–251. 2007.
View Article : Google Scholar : PubMed/NCBI
|
|
63
|
Kim JA, Yeh DC, Ver M, Li Y, Carranza A,
Conrads TP, Veenstra TD, Harrington MA and Quon MJ: Phosphorylation
of Ser24 in the pleckstrin homology domain of insulin receptor
substrate-1 by Mouse Pelle-like kinase/interleukin-1
receptor-associated kinase: Cross-talk between inflammatory
signaling and insulin signaling that may contribute to insulin
resistance. J Biol Chem. 280:23173–23183. 2005. View Article : Google Scholar : PubMed/NCBI
|
|
64
|
Lagathu C, Bastard JP, Auclair M, Maachi
M, Capeau J and Caron M: Chronic interleukin-6 (IL-6) treatment
increased IL-6 secretion and induced insulin resistance in
adipocyte: Prevention by rosiglitazone. Biochem Biophys Res Commun.
311:372–379. 2003. View Article : Google Scholar : PubMed/NCBI
|
|
65
|
Senn JJ, Klover PJ, Nowak IA and Mooney
RA: Interleukin-6 induces cellular insulin resistance in
hepatocytes. Diabetes. 51:3391–3399. 2002. View Article : Google Scholar : PubMed/NCBI
|
|
66
|
Sun Y, Liu S, Ferguson S, Wang L, Klepcyk
P, Yun JS and Friedman JE: Phosphoenolpyruvate carboxykinase
overexpression selectively attenuates insulin signaling and hepatic
insulin sensitivity in transgenic mice. J Biol Chem.
277:23301–23307. 2002. View Article : Google Scholar : PubMed/NCBI
|