Introduction
The adipose tissue between epicardium and the
myocardial surface is called epicardial adipose tissue (EAT)
(1). EAT is rich in heart arteries
and is one of the most important types of tissues in the human body
(2). At present, studies (3–5) have
proven that local inflammatory mediator produced by EAT is closely
related to the occurrence and development of coronary
atherosclerosis, and its mechanism of action is not yet clear. With
the increased incidence of coronary atherosclerosis in recent years
(6), the studies on correlations
between coronary atherosclerosis and EAT have attracted increased
attention. Tsushima et al (7)
have shown that measuring the EAT volume can effectively predict
coronary artery disease. However, measurement of EAT was not
accurate in the past due to the technical difficulties (8). With the rapid development of modern
technology, EAT now can be accurately measured by CT. The most
serious and common complications of chronic kidney disease are
cardiovascular and cerebrovascular diseases (9). Carlsson et al (10) showed that the main causes of death in
patients with chronic kidney disease in 2015 were acute coronary
syndrome, and heart failure and sudden death after myocardial
infarction. However, there is no effective indicator for the
detection of sudden cardiovascular disease in patients with chronic
kidney disease. Therefore, we speculate that EAT may be used as an
indicator of coronary atherosclerosis in patients with renal
disease to monitor the occurrence of sudden cardiovascular and
cerebrovascular condition. Correlation between EAT and
atherosclerosis in patients with nephropathy are not yet clear.
Therefore, we analyzed the correlation between EAT and coronary
atherosclerosis, calcification, and the number of lesions in
patients with nephropathy to evaluate the possible application of
EAT as an indicator of atherosclerotic conditions in patients with
nephropathy. Our study provided reference for future clinical
studies.
Materials and methods
General information
A retrospective analysis was performed on 529
patients with chronic kidney disease who were highly suspected to
have coronary atherosclerosis during preliminary examination in
Xianyang Central Hospital (Xianyang, China) from August 2013 to
September 2016. Those patients included 354 males and 175 females,
and the age ranged from 30 to 60 years, with a mean age of
43.75±9.62 years. Inclusion criteria: patients diagnosed with
chronic kidney disease in Xianyang Central Hospital; patients aged
from 30 to 60 years; patients with complete clinical case, and
patients with clinical symptoms of coronary atherosclerosis.
Exclusion criteria: patients with cardiovascular and
cerebrovascular disease; patients with other respiratory diseases;
drug-sensitive patients; pregnant patients; patients with a family
history; patients with a history of cancer, and patients with
iodine allergy.
The study was approved by the Ethics Committee of
Xianyang Central Hospital. The patients signed an informed
consent.
Method
CT was performed in strict accordance with operation
guideline of 2010 CT examination of the coronary artery (11). Parameter settings are shown in
Table I.
 | Table I.CT parameter settings. |
Table I.
CT parameter settings.
| Items | Parameters |
|---|
| Thickness | 3 mm |
| A/B tube voltage | 140 kV/80 kV |
| Electric current | 350–420 mA |
| Collimate | 64×0.6 mm |
Calcification integral scan was performed first, and
the heart was scanned from the point 1 cm below the trachea towards
feet. The enhanced scan was preceded by injection of 60–80 ml of
umbilical non-ionic iopromide contrast agent with a speed of 5
ml/sec, followed by another 30–40 ml with a speed of 5 ml/sec.
Bolus tracking was used to determine scan trigger time, and the
optimal diastolic and systolic periods were automatically
reconstructed, with a tolerance of 0.75 mm and overlap of 0.5
mm.
Interpretation of results
The 2015 CT coronary angiography guidelines were
used as the diagnostic criteria for atherosclerosis (12). A CT value of ≥130 HU and image
showing a red color was judged as calcification. Imaging results
were double-blindly reviewed by three senior imaging physicians in
Xianyang Central Hospital. A right coronary artery, left anterior
descending, and left circumflex coronary artery lesion was counted
as one coronary artery disease, while left main coronary artery l
lesion was counted as 2 coronary artery lesions. Degree of coronary
calcification was divided into ≤50 group, 51–200 group, 201–500
group, 501–1,000 group, and >1,000 group.
Statistical analysis
SPSS 22.0 statistical software (IBM Corp., Armonk,
NY, USA) was used to analyze and process data. Measurement data are
expressed as mean ± standard deviation and t-tests were used.
Analysis of variance followed by post hoc test (Least Significant
Difference) was used for comparisons among multiple groups.
Correlation analysis was performed using linear correlation
analysis. P<0.05 was considered to be statistically
significant.
Results
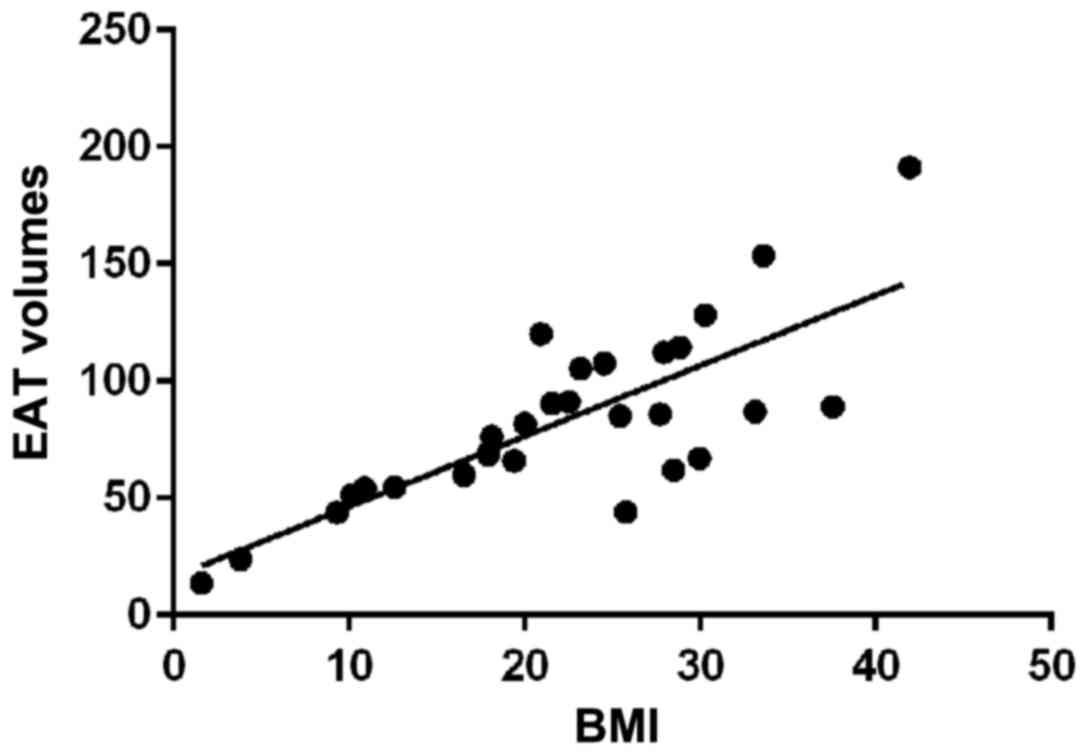
EAT volume in patients with different
BMI
Mean EAT volume of the 529 patients with nephropathy
was 97.81±49.31 mm3, and the maximum volume was 742
mm3, and the minimum volume was 26.57 mm3.
Mean BMI of the 529 patients was 22.37±9.63 kg/m2, the
highest was 38.74 kg/m2, and the lowest was 15.23
kg/m2. Coronary atherosclerosis was seen in 319 out of
529 patients. Mean EAT volume in patients with coronary
atherosclerosis was 81.42±29.68 mm3, and mean EAT volume
in patients without coronary atherosclerosis was 62.15±36.16
mm3, significant differences were found between them
(p<0.01). According to the median BMI, patients were divided
into BMI <22 kg/m2 group (221 cases) and BMI >22
kg/m2 group (308 cases). EAT volume in patients with BMI
<22 kg/m2 was 95.23±40.53 mm3, which was
significantly higher than that in patients with BMI ≥22
kg/m2 112.61±48.17 mm3 (p<0.01). Linear
correlation analysis showed a positive correlation between EAT
volume and BMI (r=0.61, p<0.05) (Tables II and III, Fig.
1).
| Table II.Differences in EAT volume in patients
with or without coronary atherosclerosis (mm3). |
Table II.
Differences in EAT volume in patients
with or without coronary atherosclerosis (mm3).
| Variable | Coronary
atherosclerosis (n=319) | Non-coronary
atherosclerosis (n=210) | t | P-value |
|---|
| EAT volume | 81.42±29.68 | 62.15±36.16 | 4.23 | <0.01 |
| Table III.Difference in EAT volume in different
patients with BMI patients (mm3). |
Table III.
Difference in EAT volume in different
patients with BMI patients (mm3).
| Variable | BMI <22
kg/m2 (n=221) | BMI ≥22
kg/m2 (n=308) | t | P-value |
|---|
| EAR volume | 95.23±40.53 | 112.61±48.17 | 3.37 | <0.01 |
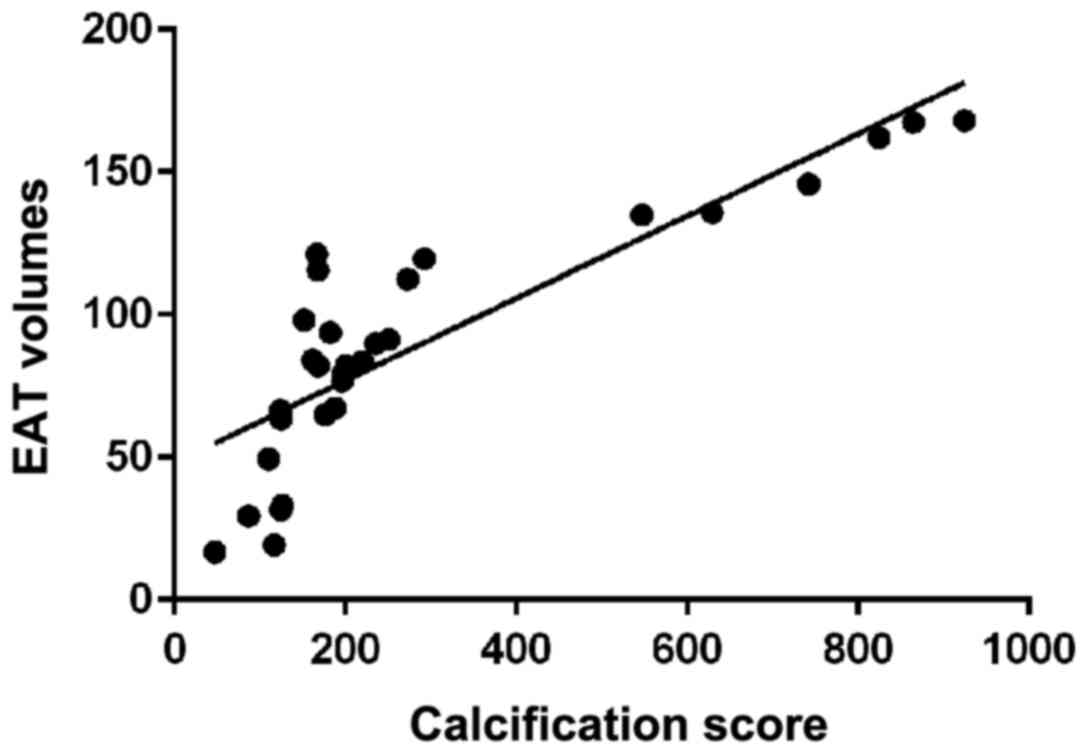
EAT volume in patients with different
calcification scores
There were 447 cases of atherosclerosis
calcification in 529 patients with nephropathy, of which 243
patients had calcification score <50, and mean EAT volume was
82.34±49.78 mm3, 62 patients had calcification score
between 51–200, and mean EAT volume was 91.33±51.67 mm3,
73 patients had calcification score between 201–500, and mean EAT
volume was 113.82±62.02 mm3, 57 patients had
calcification score between 501–1,000, and mean EAT volume was
(13.82±62.02 mm3, 57 patients had calcification score
>1,000, and mean EAT volume was 104.69±59.68 mm3. EAT
volume in patients with calcification integral ≤50 was the
smallest, followed by 51–200 group and 201–500 group, and the
volume in 501–1,000 group was the largest. EAT volume of >1,000
group was significantly lower than that of the 501–1,000 group and
significantly higher than that of 201–500 group (p<0.05). Linear
correlation analysis showed a positive correlation between EAT
volume and calcification score (r=0.72, p<0.05) (Table IV and Fig. 2).
| Table IV.Different EAT volumes in patients with
different calcification scores (mm3). |
Table IV.
Different EAT volumes in patients with
different calcification scores (mm3).
| Calcification
scores | n | EAT volume |
|---|
| ≤50 | 243 | 82.34±49.78 |
| 51–200 | 62 |
91.33±51.67a |
| 201–500 | 73 |
102.17±56.57a,b |
| 501-1,000 | 57 |
113.82±62.02a–c |
| >1,000 | 12 |
104.69±59.68a–d |
| F |
| 5.24 |
| P-value |
| <0.01 |
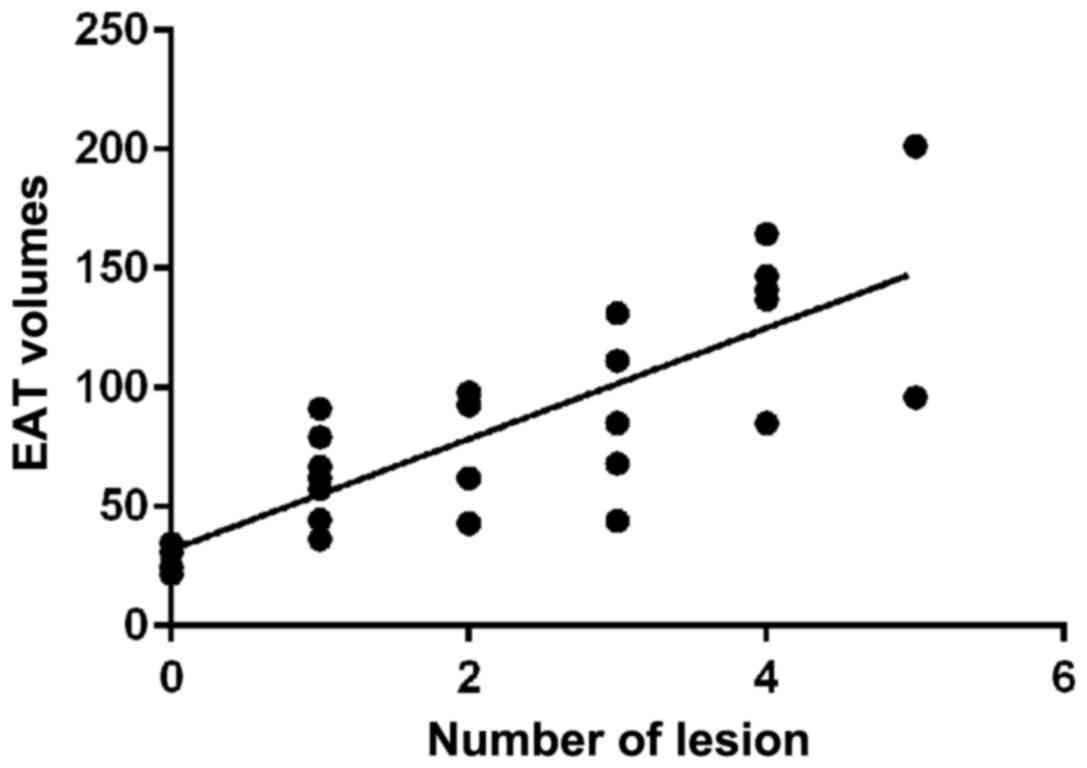
EAT volume in patients with different
numbers of coronary artery lesions
Coronary lesions were seen in 315 patients with 529
nephropathy, and mean EAT volume in non-lesioned patients was
80.71±53.27 mm3. There were 117 patients with 1 lesion
and the mean EAT volume was 80.71±53.27 mm3. There were
94 patients with 2 lesions and mean EAT volume was 94.84±52.33
mm3. There were 72 patients with 3 lesions and mean EAT
volume was 101.37±54.08 mm3. There were 32 patients with
4 lesions and mean EAT volume was 104.74±36.68 mm3. EAT
volume increased with the number of lesions (p<0.05). Linear
correlation analysis showed that the EAT volume was positively
correlated with the number of coronary lesions (r=0.64, p<0.05)
(Table V and Fig. 3).
| Table V.EAT volume in patients with different
numbers of coronary artery lesions (mm3). |
Table V.
EAT volume in patients with different
numbers of coronary artery lesions (mm3).
| Groups (n=529) | n | EAT volume |
|---|
| Non-lesion | 214 | 80.71±53.27 |
| 1 | 117 |
86.14±49.37a |
| 2 | 94 |
94.84±52.33a,b |
| 3 | 72 |
101.37±54.08a–c |
| 4 | 32 |
104.74±36.68a–d |
| F |
| 3.56 |
| P-value |
| <0.01 |
Discussion
After the report of the role of EAT in inducing
coronary atherosclerosis by local inflammatory mediators, detecting
EAT volume has been widely used as a predictor of coronary
atherosclerosis. EAT develops from embryonic adipose tissue and
shares homology with mesenteric and omental adipose tissue
(13,14). Studies have shown that EAT can
secrete and synthesize a variety of types of cell adipokines and
related inflammatory factors to act on the surface of coronary
arteries and enhance atherosclerosis (6,15–17). In
this study, high-resolution dual-source CT was used to examine the
EAT volume in patients with suspected coronary atherosclerosis,
which not only provided a better assessment of the coronary artery
lesions, but also improved the accuracy of the measurement of the
volume of EAT.
Results of this study indicate that the EAT volume
is positively correlated with BMI, coronary artery calcification,
and the number of coronary artery lesions in patients with
nephropathy, which is basically consistent with the findings of
Mazurek and Opolski (18) and Pawar
et al (19), indicating that
EAT volume can be used as an independent indicator to predict the
occurrence and development of coronary arteriosclerosis. Higher BMI
was accompanied with larger EAT volume. High BMI can increase the
level of plasma positive cytokine to promote the process of
atherosclerosis (4), but the
mechanism of action still needs to be further studied. EAT not only
reserves energy, but also serves as an endocrine organ to secrete
large amounts of free fatty acids (20). The secreted cytokines affect the
metabolism of heart muscle by regulating heart morphology, so as to
promote the proliferation of smooth muscle cells of the coronary
vascular wall, and accelerate the process of coronary artery
stenosis (21). Free fatty acids
released by EAT not only induce apoptosis of vascular endothelial
cells, but also impair intravascular endothelium relaxation and
contraction. Secretion of excessive inflammatory factors such as
TNF-α and MCP-1 accelerate the process of coronary atherosclerosis
(22). The degree of coronary artery
calcification is positively correlated with the severity of lesions
and EAT volume. Patients with calcification score >1,000
patients had a decreased EAT volume compared with patients with a
calcification score of 501–1,000. The reason may be the bias caused
by the small number of cases in this study, but the overall
correlation between calcification and EAT volume is still positive.
Our future studies are expected to confirm the findings. Chaowalit
et al (23) showed that there
was no significant correlation between calcification and the
volume, possibly due to the different detection methods. Chaowalit
et al used ultrasound as the main measurement instrument.
Ultrasound was only accurate for the measurement of local thickness
of EAT. Distribution of EAT thickness on the surface of the heart
varies from individual to individual. Ultrasound may not be an
appropriate imaging method for measurement of EAT.
In this study, CT was used to detect EAT volume in
patients with suspected coronary atherosclerotic nephropathy, and
correlations of EAT with BMI, calcification, and pathological
conditions were analyzed. There are still deficiencies, such as the
small sample size. Our future studies will solve these
problems.
In summary, coronary atherosclerosis, BMI,
calcification, and number of lesions are positively correlated with
the volume of EAT in patients with nephropathy. Detection of EAT
volume may serve as an indicator of the occurrence and development
of coronary atherosclerosis in the future.
Acknowledgements
Not applicable.
Funding
No funding was received.
Availability of data and materials
The datasets used and/or analyzed during the present
study are available from the corresponding author on reasonable
request.
Authors' contributions
HZ and YZ drafted the manuscript. HZ and QM analyzed
and interpreted calcification integral scan. YZ and QM treated
patients and were responsible for statistical analysis. All authors
read and approved the final manuscript.
Ethics approval and consent to
participate
The study was approved by the Ethics Committee of
Xianyang Central Hospital (Xianyang, China). Signed informed
consents were obtained from the patients or guardians.
Patient consent for publication
Not applicable.
Competing interests
The authors declare that they have no competing
interests.
References
|
1
|
Iacobellis G: Local and systemic effects
of the multifaceted epicardial adipose tissue depot. Nat Rev
Endocrinol. 11:363–371. 2015. View Article : Google Scholar : PubMed/NCBI
|
|
2
|
Yamaguchi Y, Cavallero S, Patterson M,
Shen H, Xu J, Kumar SR and Sucov HM: Adipogenesis and epicardial
adipose tissue: A novel fate of the epicardium induced by
mesenchymal transformation and PPARγ activation. Proc Natl Acad Sci
USA. 112:2070–2075. 2015. View Article : Google Scholar : PubMed/NCBI
|
|
3
|
Kitagawa T, Yamamoto H, Sentani K,
Takahashi S, Tsushima H, Senoo A, Yasui W, Sueda T and Kihara Y:
The relationship between inflammation and neoangiogenesis of
epicardial adipose tissue and coronary atherosclerosis based on
computed tomography analysis. Atherosclerosis. 243:293–299. 2015.
View Article : Google Scholar : PubMed/NCBI
|
|
4
|
Gaborit B, Venteclef N, Ancel P, Pelloux
V, Gariboldi V, Leprince P, Amour J, Hatem SN, Jouve E, Dutour A,
et al: Human epicardial adipose tissue has a specific
transcriptomic signature depending on its anatomical peri-atrial,
peri-ventricular, or peri-coronary location. Cardiovasc Res.
108:62–73. 2015. View Article : Google Scholar : PubMed/NCBI
|
|
5
|
Vacca M, Di Eusanio M, Cariello M,
Graziano G, D'Amore S, Petridis FD, D'orazio A, Salvatore L,
Tamburro A, Folesani G, et al: Integrative miRNA and whole-genome
analyses of epicardial adipose tissue in patients with coronary
atherosclerosis. Cardiovasc Res. 109:228–239. 2016. View Article : Google Scholar : PubMed/NCBI
|
|
6
|
McAninch EA, Fonseca TL, Poggioli R, Panos
AL, Salerno TA, Deng Y, Li Y, Bianco AC and Iacobellis G:
Epicardial adipose tissue has a unique transcriptome modified in
severe coronary artery disease. Obesity (Silver Spring).
23:1267–1278. 2015. View Article : Google Scholar : PubMed/NCBI
|
|
7
|
Tsushima H, Yamamoto H, Kitagawa T, Urabe
Y, Tatsugami F, Awai K and Kihara Y: Association of epicardial and
abdominal visceral adipose tissue with coronary atherosclerosis in
patients with a coronary artery calcium score of zero. Circ J.
79:1084–1091. 2015. View Article : Google Scholar : PubMed/NCBI
|
|
8
|
Du Y, Ji Q, Cai L, Huang F, Lai Y, Liu Y,
Yu J, Han B, Zhu E, Zhang J, et al: Association between omentin-1
expression in human epicardial adipose tissue and coronary
atherosclerosis. Cardiovasc Diabetol. 15:902016. View Article : Google Scholar : PubMed/NCBI
|
|
9
|
Shah AD, Langenberg C, Rapsomaniki E,
Denaxas S, Pujades-Rodriguez M, Gale CP, Deanfield J, Smeeth L,
Timmis A and Hemingway H: Type 2 diabetes and incidence of
cardiovascular diseases: A cohort study in 1·9 million people.
Lancet Diabetes Endocrinol. 3:105–113. 2015. View Article : Google Scholar : PubMed/NCBI
|
|
10
|
Carlsson AC, Östgren CJ, Nystrom FH, Länne
T, Jennersjö P, Larsson A and Ärnlöv J: Association of soluble
tumor necrosis factor receptors 1 and 2 with nephropathy,
cardiovascular events, and total mortality in type 2 diabetes.
Cardiovasc Diabetol. 15:402016. View Article : Google Scholar : PubMed/NCBI
|
|
11
|
Alexopoulos N, McLean DS, Janik M,
Arepalli CD, Stillman AE and Raggi P: Epicardial adipose tissue and
coronary artery plaque characteristics. Atherosclerosis.
210:150–154. 2010. View Article : Google Scholar : PubMed/NCBI
|
|
12
|
SCOT-HEART investigators: CT coronary
angiography in patients with suspected angina due to coronary heart
disease (SCOT-HEART): An open-label, parallel-group, multicentre
trial. Lancet. 385:2383–2391. 2015. View Article : Google Scholar : PubMed/NCBI
|
|
13
|
Hatem SN, Redheuil A and Gandjbakhch E:
Cardiac adipose tissue and atrial fibrillation: The perils of
adiposity. Cardiovasc Res. 109:502–509. 2016. View Article : Google Scholar : PubMed/NCBI
|
|
14
|
Ohyama K, Matsumoto Y, Nishimiya K, Hao K,
Tsuburaya R, Ota H, Amamizu H, Uzuka H, Takahashi J, Ito K, et al:
Increased coronary perivascular adipose tissue volume in patients
with vasospastic angina. Circ J. 80:1653–1656. 2016. View Article : Google Scholar : PubMed/NCBI
|
|
15
|
Torres T, Bettencourt N, Mendonça D,
Vasconcelos C, Gama V, Silva BM and Selores M: Epicardial adipose
tissue and coronary artery calcification in psoriasis patients. J
Eur Acad Dermatol Venereol. 29:270–277. 2015. View Article : Google Scholar : PubMed/NCBI
|
|
16
|
Hirata Y, Yamada H, Kusunose K, Iwase T,
Nishio S, Hayashi S, Bando M, Amano R, Yamaguchi K, Soeki T, et al:
Clinical utility of measuring epicardial adipose tissue thickness
with echocardiography using a high-frequency linear probe in
patients with coronary artery disease. J Am Soc Echocardiogr.
28:1240–1246.e1. 2015. View Article : Google Scholar : PubMed/NCBI
|
|
17
|
Nakatani Y, Kumagai K, Minami K, Nakano M,
Inoue H and Oshima S: Location of epicardial adipose tissue affects
the efficacy of a combined dominant frequency and complex
fractionated atrial electrogram ablation of atrial fibrillation.
Heart Rhythm. 12:257–265. 2015. View Article : Google Scholar : PubMed/NCBI
|
|
18
|
Mazurek T and Opolski G: Pericoronary
adipose tissue: A novel therapeutic target in obesity-related
coronary atherosclerosis. J Am Coll Nutr. 34:244–254. 2015.
View Article : Google Scholar : PubMed/NCBI
|
|
19
|
Pawar AS, Zhu X-Y, Eirin A, Tang H, Jordan
KL, Woollard JR, Lerman A and Lerman LO: Adipose tissue remodeling
in a novel domestic porcine model of diet-induced obesity. Obesity
(Silver Spring). 23:399–407. 2015. View Article : Google Scholar : PubMed/NCBI
|
|
20
|
Patel VB, Mori J, McLean BA, Basu R, Das
SK, Ramprasath T, Parajuli N, Penninger JM, Grant MB, Lopaschuk GD,
et al: ACE2 deficiency worsens epicardial adipose tissue
inflammation and cardiac dysfunction in response to diet-induced
obesity. Diabetes. 65:85–95. 2016.PubMed/NCBI
|
|
21
|
Antonopoulos AS, Margaritis M, Verheule S,
Recalde A, Sanna F, Herdman L, Psarros C, Nasrallah H, Coutinho P,
Akoumianakis I, et al: Mutual regulation of epicardial adipose
tissue and myocardial redox state by PPAR-γ/adiponectin signalling.
Circ Res. 118:842–855. 2016. View Article : Google Scholar : PubMed/NCBI
|
|
22
|
Aydın AM, Kayalı A, Poyraz AK and Aydın K:
The relationship between coronary artery disease and pericoronary
epicardial adipose tissue thickness. J Int Med Res. 43:17–25. 2015.
View Article : Google Scholar : PubMed/NCBI
|
|
23
|
Chaowalit N, Somers VK, Pellikka PA, Rihal
CS and Lopez-Jimenez F: Subepicardial adipose tissue and the
presence and severity of coronary artery disease. Atherosclerosis.
186:354–359. 2006. View Article : Google Scholar : PubMed/NCBI
|