Introduction
Uveal melanoma (UM) is the most common type of
malignant tumor that occurs in the eyes of adults (1). There are 6–7 cases/million people in
America each year (2,3). Research on the gene expression module
of UM is rare, which limits the understanding of critical genes
associated with the occurrence and development of the disease.
Despite the advances in the diagnosis and treatment of UM, the
prognosis for patients with UM remains poor. UM frequently
metastasizes and due to its hematologic nature, the liver is often
the first site of metastatic disease. Approximately 50% of patients
with UM will eventually succumb to their disease and the 5-year
survival rate was 84% among all patients (4). Novel markers for UM are urgently
required to improve the clinical management of individuals with the
disease and increase their life expectancy.
Previously there have been few studies investigating
the expression data of UM gene modules, which has limited the
overall understanding of the function of critical genes within UM.
Weighted gene co-expression network analysis (WGCNA) is a method
frequently used to study biological networks with paired
correlations between variables (5).
WGCNA is a comprehensive collection of R functions for performing
various aspects of weighted correlation network analysis (6). This technique has been widely used to
study various biological processes, including cancer, genetics and
brain imaging data, where it can help identify candidate biomarkers
or therapeutic targets (7). Not only
can WGCNA compare differentially expressed genes, but it can also
discern the interactions between genes in different co-expression
modules (8). WGCNA has been reported
to have identified independent predictors of life expectancy for
patients with breast cancer (7).
WGCNA analysis has also been useful in the identification of
potential oncogenetic drivers and therapeutic targets for patients
with small cell lung cancer (9).
The present study aimed to construct co-expression
modules using the gene expression data of patients with UM. Gene
Ontology (GO) term and Kyoto Encyclopedia of Genes and Genomes
(KEGG) pathway enrichment analyses were performed on the modules
constructed, in order to establish the primary functions of the
genes within these modules. These findings may be valuable for
developing novel therapies to treat UM.
Materials and methods
Cluster analysis of UM microarray
data
The microarray dataset GSE44295 and probe signal
values were obtained from the Genome Expression Omnibus (GEO)
database (ncbi.nlm.nih.gov/geo/query/acc.cgi?acc=GSE44295). This
dataset comprised 58 samples of classic UM. The reference nos. of
the UM samples were GSM1082563, GSM1082565-GSM1082566,
GSM1082568-GSM1082575, GSM1082577-GSM1082584, GSM1082586-GSM1082596
and GSM1082598-GSM1082625. The sequencing platform used was GPL6883
HumanRef-8 Expression BeadChip (version 3.0; Illumina, Inc., San
Diego, CA, USA). Microarray information was transformed into gene
expression information by the expression value of probes from the
GEO dataset. Microarray annotation information was used to match
probes with corresponding genes. Probes with more than one gene
were eliminated and the average value was calculated for genes
corresponding to more than one probe. Samples with negative values
were also eliminated. The threshold value was determined by the
number of genes with a different threshold of expression. The WGCNA
algorithm (7) was used to evaluate
the gene expression value. The flashClust tools package (version
1.1.25; cran.r-project.org/web/packages/fastcluster/) in
R language was used to perform the cluster analysis of the samples
with appropriate threshold values.
Construction of co-expression modules
for UM
The power value was screened out in the construction
of each module using the WGCNA algorithm (7). The gradient method was used to test the
independence and the average connectivity degree of different
modules with different power values (the power value ranging from
1–20). The appropriate power value was determined when the degree
of independence was 0.8. Once the power value was determined, the
module construction proceeded using the WGCNA algorithm. The
corresponding gene information for each module was extracted and
the minimum number of genes was set as 50 to enable high
reliability of the results.
Analysis of the co-expression
modules
The interaction of co-expression modules was
determined using R language (10)
and the WGCNA algorithm. The Heatmap tools package (version 1.1.1;
cran.r-project.org/web/packages/heatmap3) was used to
analyze the strength of the interactions.
Functional enrichment analysis of the
co-expression modules
The constructed modules were arranged by the number
of genes they contained and then functional enrichment analysis was
performed on the genes in these modules. The corresponding gene
information was mapped to the Database for Annotation,
Visualization and Integrated Discovery (david.ncifcrf.gov/summary.jsp) (11). GO (12) term and KEGG (13,14)
pathway enrichment analyses were then performed on the results.
P≤0.05 after correction was used as the threshold for significant
enrichment. The top five records were extracted if there were more
than five significant results.
Results
Cluster analysis of UM samples
Following the elimination of probes with >1 gene,
a total of 7,576 gene expression values were obtained. Then, the
5,000 genes with the highest average expression value were
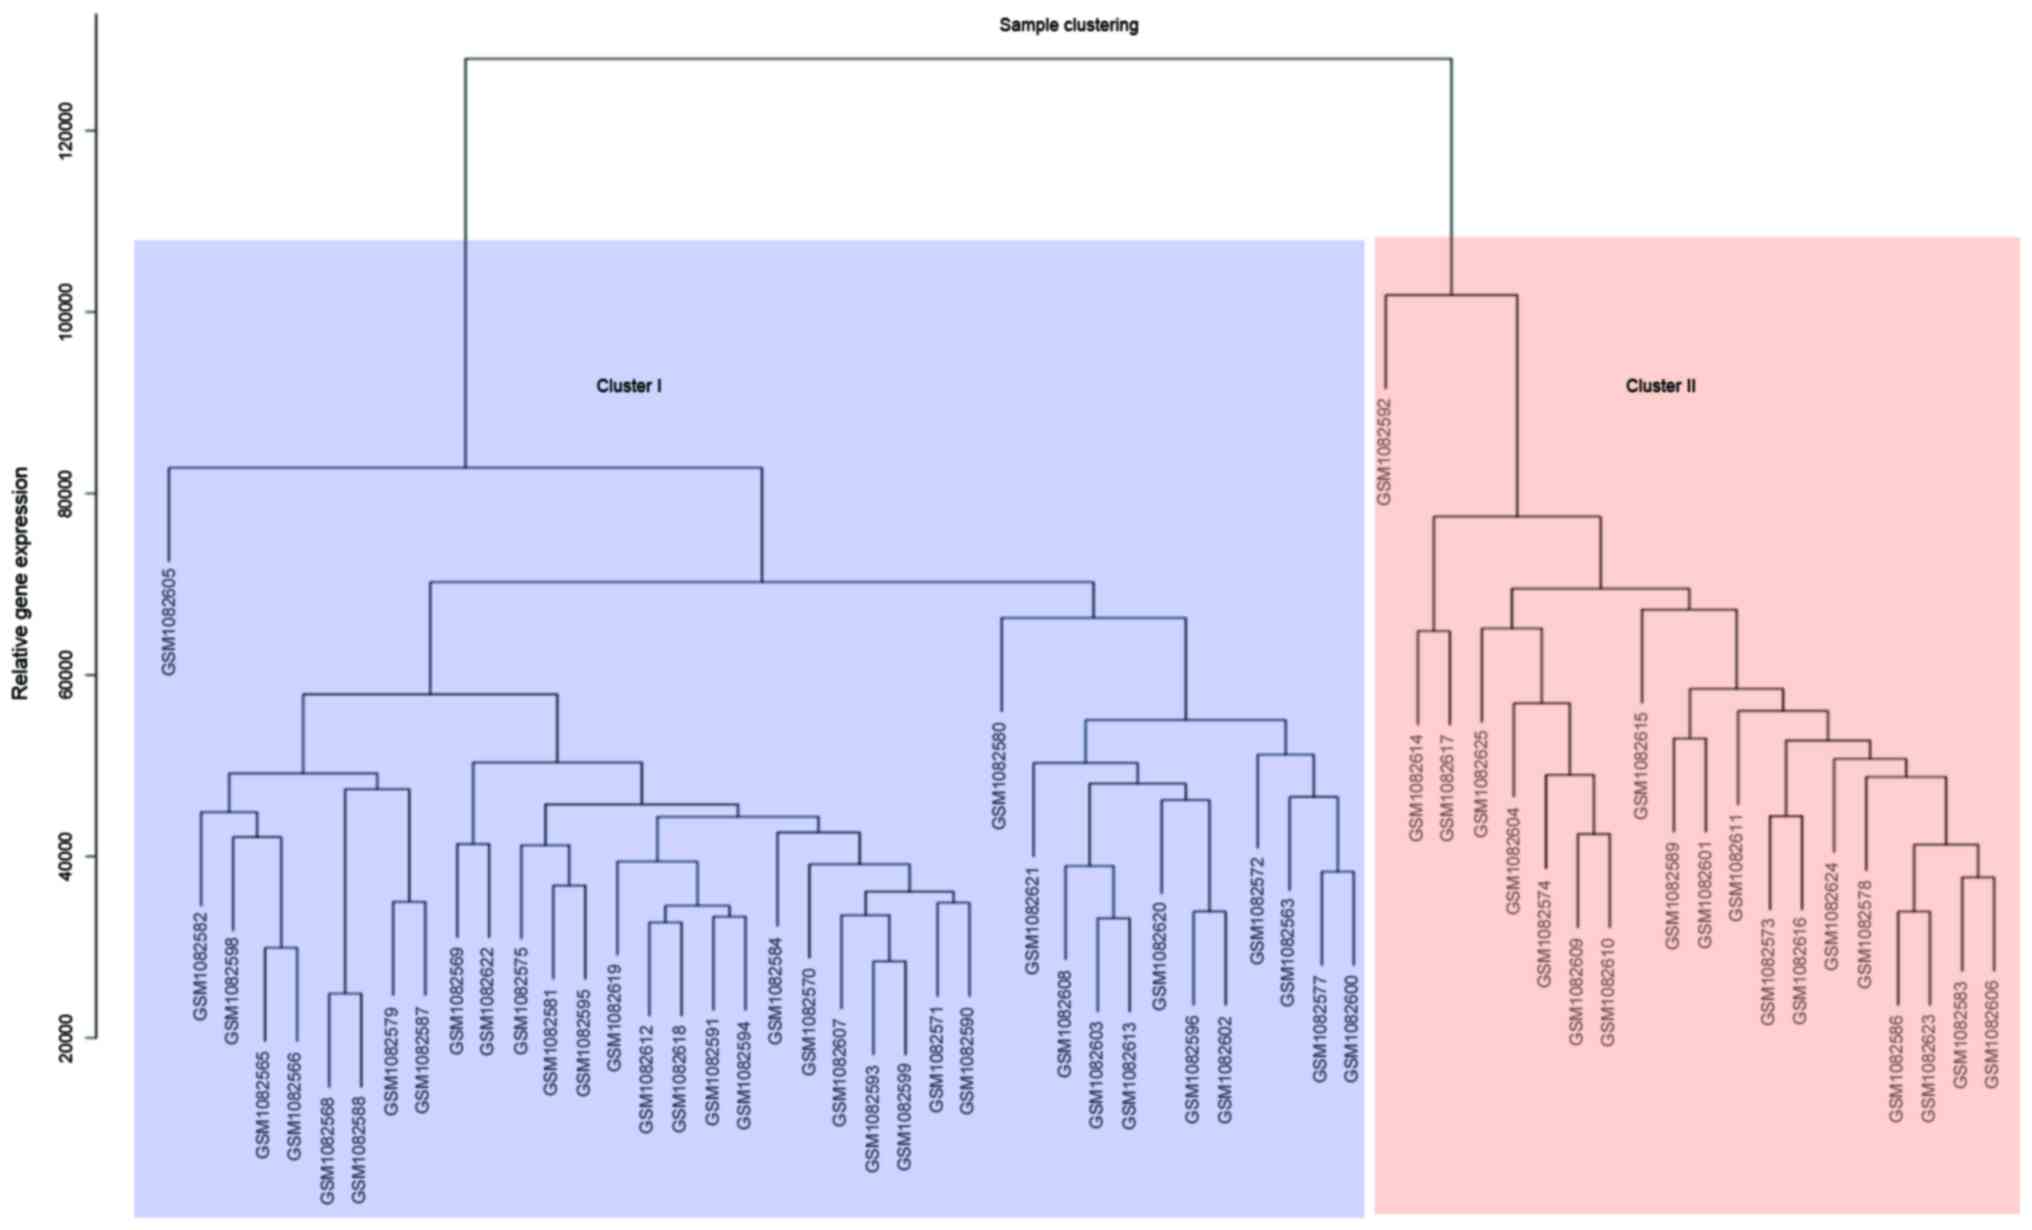
extracted. The flashClust tools package was used to perform the
cluster analysis on these samples and the results are presented in
Fig. 1. The 58 samples were divided
into two clusters. A total of 38 samples were included in the first
cluster, where sample GSM1082605 had the highest expression value.
The second cluster included 20 samples, where sample GSM1082592 had
the highest expression value.
Construction of co-expression modules
for UM
The expression values of 5,000 genes in 58 samples
of UM were used to construct co-expression modules using the WGCNA
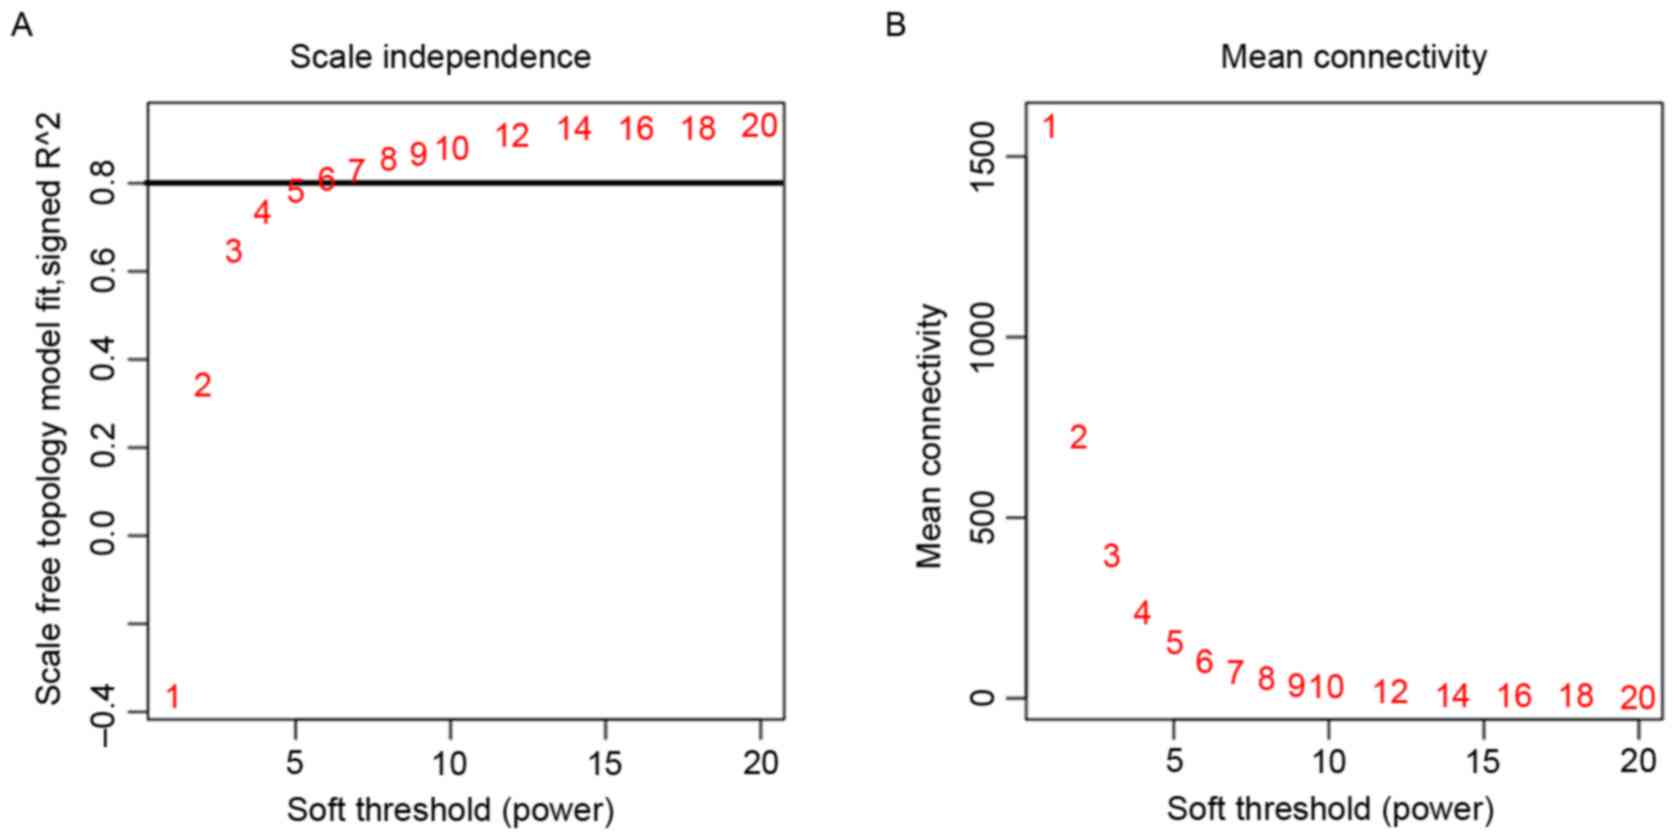
algorithm. One of the critical parameters was the power value,
which mainly affected the independence and the average degree of
connectivity within co-expression modules. Firstly, the power value
was identified (Fig. 2). When the
power value was 6, the independence degree was ≥0.8; the power
value could appropriately assess the scale free topology of the
network according to the WGCNA algorithm. Therefore, the power
value used to construct the co-expression modules was determined to
be 6.
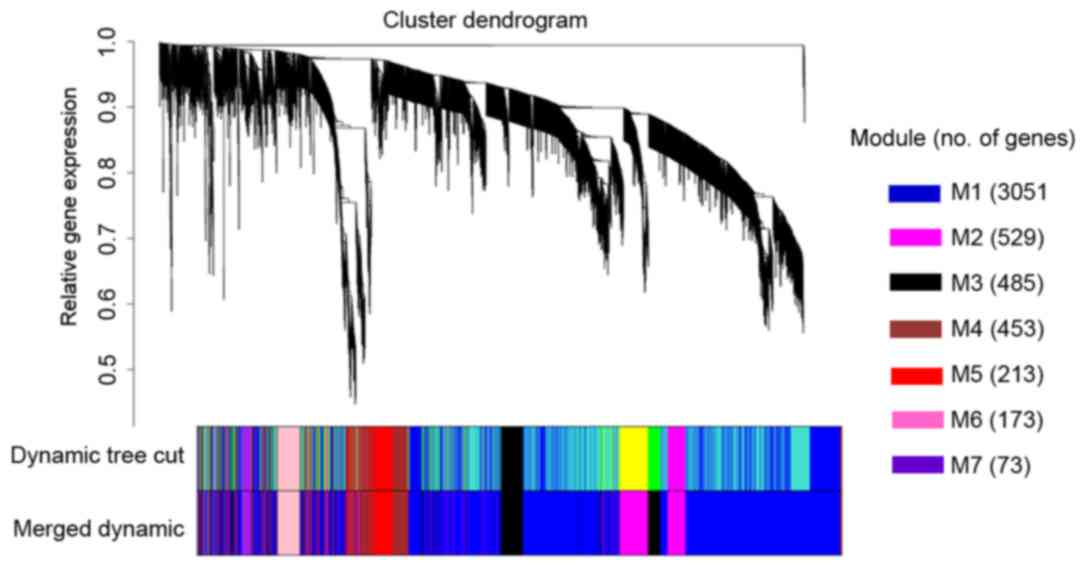
As a result, seven co-expression modules were
constructed (Fig. 3). These modules
ranged from large to small by the number of genes they contained.
The number of genes in the seven modules was 3,051, 529, 485, 453,
213, 173 and 73. The average number of the genes included in the
seven modules was 711. There were 23 genes that did not belong to
any of the seven modules.
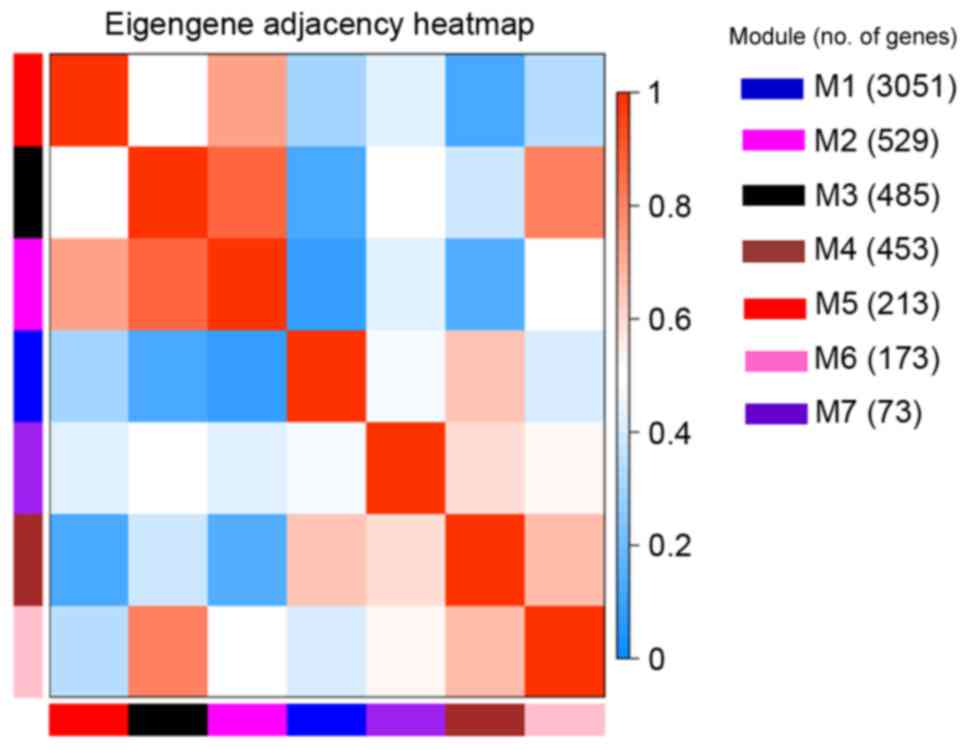
Interaction analysis of the
co-expression modules
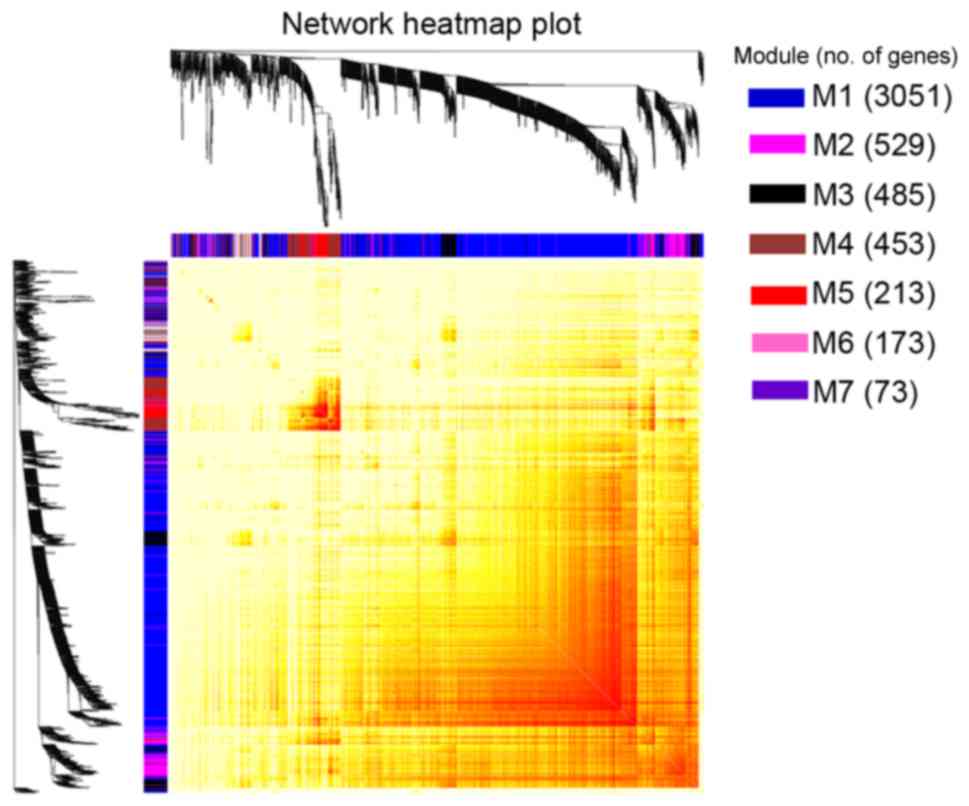
Interactions of the seven co-expression modules were
analyzed (Fig. 4). There was a clear
difference between the interactions among different modules. The
degree of connectivity between critical genes was analyzed in order
to better clarify the interactions among the constructed
co-expression modules (Fig. 5). With
the exception of self-comparison, the strongest connectivity
interactions were observed between modules 2 and 3, along with
interactions between modules 2 and 7 (~0.8).
Functional enrichment analysis of
genes in the co-expression modules
GO term and KEGG pathway enrichment analyses were
performed on the genes in the seven constructed modules (Tables I and II, respectively). There was a significant
difference in the biological processes that different modules were
enriched in. Genes in module 1 were mainly enriched in
translational initiation (GO:0006413), signal recognition
particle-dependent co-translational protein targeting to membranes
(GO:0006614) and translation (GO:0006412), while genes in module 2
were mainly enriched in transcriptional regulatory processes,
including the regulation of DNA-templated transcription
(GO:0006355), DNA-templated transcription (GO:0006351) and
transcription from the RNA polymerase II promoter (GO:0006366).
Genes in module 3 were mainly enriched in RNA processing and
transportation processes, including RNA export from the nucleus
(GO:0006405), mRNA splicing via the spliceosome (GO:0000398) and
mRNA export from the nucleus (GO:0006406).
 | Table I.GO term enrichment analysis of genes
in the co-expression modules. |
Table I.
GO term enrichment analysis of genes
in the co-expression modules.
| Module | GO no. | Term | No. of genes | Background genes
(%) | P-value |
|---|
| 1 | GO:0006413 | Translational
initiation | 86 | 2.842975 | 7.33E-33 |
|
| GO:0006614 | SRP-dependent
cotranslational protein targeting to membrane | 64 | 2.115702 | 3.31E-27 |
|
| GO:0006412 | Translation | 114 | 3.768595 | 2.07E-26 |
|
| GO:0000184 | Nuclear-transcribed
mRNA catabolic process, nonsense-mediated decay | 70 | 2.31405 | 2.09E-24 |
|
| GO:0019083 | Viral
transcription | 67 | 2.214876 | 6.48E-24 |
| 2 | GO:0006355 | Regulation of
transcription, DNA-templated | 66 | 1.26E+01 | 3.17E-04 |
|
| GO:0006351 | Transcription,
DNA-templated | 76 | 1.45E+01 | 0.002697 |
|
| GO:0006366 | Transcription from
RNA polymerase II promoter | 25 | 4.77E+00 | 0.0108 |
|
| GO:0000122 | Negative regulation
of transcription from RNA polymerase II promoter | 31 | 5.92E+00 | 0.023932 |
|
| GO:0045944 | Positive regulation
of transcription from RNA polymerase II promoter | 38 | 7.25E+00 | 0.043971 |
| 3 | GO:0006405 | RNA export from
nucleus | 9 | 1.86722 | 7.36E-05 |
|
| GO:0000398 | mRNA splicing, via
spliceosome | 17 | 3.53E+00 | 2.00E-04 |
|
| GO:0006406 | mRNA export from
nucleus | 11 | 2.28E+00 | 2.43E-04 |
|
| GO:0016032 | Viral process | 21 | 4.36E+00 | 3.31E-04 |
|
| GO:0051301 | Cell division | 21 | 4.36E+00 | 6.34E-04 |
| 4 | GO:0000398 | mRNA splicing, via
spliceosome | 15 | 3.36E+00 | 6.48E-04 |
|
| GO:0006886 | Intracellular protein
transport | 14 | 3.14E+00 | 3.30E-03 |
|
| GO:0006099 | Tricarboxylic acid
cycle | 5 | 1.12E+00 | 0.004148 |
|
| GO:0000184 | Nuclear-transcribed
mRNA catabolic process, nonsense-mediated decay | 9 | 2.02E+00 | 0.006867 |
|
| GO:0006541 | Glutamine metabolic
process | 4 | 8.97E-01 | 0.010284 |
| 5 | GO:0006357 | Regulation of
transcription from RNA polymerase II promoter | 12 | 5.77E+00 | 0.00501 |
|
| GO:0045494 | Photoreceptor cell
maintenance | 4 | 1.92E+00 | 0.005265 |
|
| GO:0045664 | Regulation of
neuron differentiation | 3 | 1.44E+00 | 0.018871 |
|
| GO:0006351 | Transcription,
DNA-templated | 29 | 1.39E+01 | 0.036089 |
|
| GO:0045893 | Positive regulation
of transcription, DNA-templated | 11 | 5.29E+00 | 0.03745 |
| 6 | GO:0008380 | RNA splicing | 11 | 6.36E+00 | 2.89E-06 |
|
| GO:0006406 | mRNA export from
nucleus | 9 | 5.20E+00 | 3.46E-06 |
|
| GO:0075733 | Intracellular
transport of virus | 6 | 3.47E+00 | 9.57E-05 |
|
| GO:0006409 | tRNA export from
nucleus | 5 | 2.89E+00 | 1.91E-04 |
|
| GO:0010827 | Regulation of
glucose transport | 5 | 2.89E+00 | 2.15E-04 |
| 7 | GO:0060337 | Type I interferon
signaling pathway | 16 | 2.19E+01 | 5.44E-23 |
|
| GO:0060333 |
Interferon-γ-mediated signaling
pathway | 12 | 1.64E+01 | 6.13E-15 |
|
| GO:0006955 | Immune
response | 17 | 2.33E+01 | 1.28E-11 |
| Table II.KEGG pathway enrichment analysis of
genes in the co-expression modules. |
Table II.
KEGG pathway enrichment analysis of
genes in the co-expression modules.
| Module | KEGG no. | Pathway | No. of genes | Background genes
(%) | P-value |
|---|
| 1 | hsa03010 | Ribosome | 82 | 2.710744 | 6.68E-26 |
|
| hsa00190 | Oxidative
phosphorylation | 63 | 2.082645 | 3.34E-13 |
|
| hsa05016 | Huntington's
disease | 71 | 2.347107 | 8.71E-09 |
|
| hsa05012 | Parkinson's
disease | 57 | 1.884298 | 1.14E-08 |
|
| hsa05010 | Alzheimer's
disease | 64 | 2.115702 | 1.41E-08 |
| 2 | hsa04330 | Notch signaling
pathway | 7 | 1.335878 | 2.37E-03 |
|
| hsa03018 | RNA
degradation | 7 | 1.335878 | 2.31E-02 |
|
| hsa05200 | Pathways in
cancer | 19 | 3.625954 | 3.37E-02 |
|
| hsa04120 | Ubiquitin mediated
proteolysis | 9 | 1.717557 | 4.37E-02 |
|
| hsa04141 | Protein processing
in endoplasmic reticulum | 10 | 1.908397 | 5.47E-02 |
|
| hsa05169 | Epstein-Barr virus
infection | 10 | 1.908397 | 9.76E-02 |
| 3 | hsa04120 | Ubiquitin mediated
proteolysis | 16 | 3.319502 | 2.50E-06 |
|
| hsa03040 | Spliceosome | 14 | 2.904564 | 4.08E-05 |
|
| hsa03018 | RNA
degradation | 9 | 1.86722 | 8.54E-04 |
|
| hsa03015 | mRNA surveillance
pathway | 8 | 1.659751 | 9.59E-03 |
|
| hsa03013 | RNA transport | 11 | 2.282158 | 1.46E-02 |
| 4 | hsa04120 | Ubiquitin mediated
proteolysis | 11 | 2.466368 | 2.30E-03 |
|
| hsa01100 | Metabolic
pathways | 47 | 10.53812 | 2.54E-03 |
|
| hsa00020 | Citrate cycle (TCA
cycle) | 5 | 1.121076 | 6.38E-03 |
|
| hsa01200 | Carbon
metabolism | 8 | 1.793722 | 2.35E-02 |
|
| hsa03015 | mRNA surveillance
pathway | 7 | 1.569507 | 2.68E-02 |
| 6 | hsa03013 | RNA transport | 7 | 4.046243 | 0.002524 |
|
| hsa03040 | Spliceosome | 5 | 2.890173 | 0.022281 |
|
| hsa05202 | Transcriptional
misregulation in cancer | 5 | 2.890173 | 0.046592 |
| 7 | hsa04612 | Antigen processing
and presentation | 12 | 16.43836 | 1.77E-13 |
|
| hsa05168 | Herpes simplex
infection | 14 | 19.17808 | 9.17E-12 |
|
| hsa05150 | Staphylococcus
aureus infection | 8 | 10.9589 | 1.51E-08 |
|
| hsa05332 | Graft-vs.-host
disease | 7 | 9.589041 | 2.14E-08 |
|
| hsa05416 | Viral
myocarditis | 8 | 10.9589 | 2.23E-08 |
Genes in module 4 were similar to that of genes in
module 3, which were mainly enriched in mRNA splicing via the
spliceosome (GO:0000398). Genes in module 5 were mainly enriched in
transcriptional regulation processes, such as the regulation of
transcription from RNA polymerase II promoter (GO:0006357). Genes
in module 6 were mainly enriched in biological processes associated
with RNA processing and transcription, including RNA splicing
(GO:0008380) and mRNA export from nucleus (GO:0006406), which was
similar to the result of modules 3 and 4. Genes in module 7 were
mainly enriched in biological processes involving immune responses,
including the type I interferon signaling pathway (GO:0060337), the
interferon-γ-mediated signaling pathway (GO:0060333) and immune
responses (GO:0006955).
KEGG pathway enrichment analysis was conducted on
the genes in the 7 modules (Table
II). The results demonstrated that there were significantly
enriched pathways within all of the modules except module 5. Genes
in module 1 were mainly enriched in metabolic pathways such as the
ribosome (hsa03010) and oxidative phosphorylation (hsa00190), while
genes in module 2 were mainly enriched in the notch signaling
pathway (hsa04330), the RNA degradation pathway (hsa03018), cancer
progression pathways (hsa05200) and ubiquitin mediated proteolysis
(hsa04120). Genes in module 3 were also mainly enriched in
ubiquitin-mediated proteolysis (hsa04120), and pathways associated
with RNA transportation and degradation. Genes in module 4 were
mainly enriched in ubiquitin-mediated proteolysis (hsa04120), while
module 6 was mainly enriched in metabolic pathways associated with
RNA transportation and processing. Genes in module 7 were mainly
enriched in pathways associated with antigen processing and
presentation (hsa04612), and herpes simplex infection
(hsa05168).
Module 2 was regarded as a critical module in the
occurrence of UM based on the result of the GO and KEGG enrichment
analyses. Additionally, the ubiquitin mediated proteolysis
(hsa04120) pathway was significantly enriched in modules 2–4. This
suggests that ubiquitination may serve an important role in the
occurrence and development of UM.
Discussion
In the present study, a total of seven co-expression
modules were constructed from the 5,000 genes from 58 human UM
samples using the WGCNA method. The results of the functional
enrichment analysis revealed that there was a significant
difference in interactions among different modules, and that this
was largely associated with their different functions. The results
demonstrated that module 2 was enriched in pathways associated with
transcriptional regulation processes, and was regarded as a key
module in the occurrence and development of UM. The ubiquitin
mediated proteolysis pathway was identified to be significantly
enriched in modules 2–4, suggesting that it may exhibit potential
as a prognostic and predictive marker for the survival of patients
with UM.
In the present study the WGCNA method was used to
construct the seven co-expression modules, each of which included a
series of genes with similar expression profiles. Genes within the
same module were considered to be associated with each other by
function. This method, unlike regular cluster analysis, where
clusters are constructed based on the geometric distance of data,
was advantageous since the analysis performed by WGCNA has
biological significance, making the results more applicable.
The GO functional enrichment analysis revealed that
module 2 was mostly enriched in transcriptional regulatory
processes, including the regulation of DNA-templated transcription
and transcription from the RNA polymerase II promoter. Module 2 was
mostly enriched in KEGG pathways associated with metabolic
processes, including the notch signaling pathway, the RNA
degradation pathway, pathways in cancer and ubiquitin mediated
proteolysis. Since the occurrence and development of cancer is
accompanied by the abnormal expression of oncogenes or
anti-oncogenes, the enriched pathways that module 2 is involved in
may regulate the translation of protein-coding genes involved in
the cell cycle or cell proliferation. Therefore, module 2 may be
the most critical in the occurrence and development of UM.
The present study examined the degree of
connectivity between critical genes to determine the interactions
between the co-expression modules. The results demonstrated that
there was a significant difference in the interactions among
different modules; this may be as a result of their different
functions. The results identified that there was strong interaction
connectivity between modules 2 and 3 and modules 3 and 6. It was
also revealed that ubiquitin mediated proteolysis was significantly
enriched in modules 2–4. Several studies have reported that
ubiquitination is associated with the occurrence and development of
cancer when accompanied by the dysregulation of oncogenes (15,16).
Mutation of the cellular tumor antigen p53 gene has been reported
to be associated with the occurrence of the majority of different
types of cancer. The ubiquitination pathway regulates p53 tumor
suppressor protein stability, localization, and functions in normal
and cancerous cells (17).
Therefore, it has been suggested that ubiquitination serves an
essential role in the occurrence and development of UM, as it was
the most enriched function according to the functional enrichment
analysis, and it can disturb the expression of relevant proteins
involved in the cell cycle and proliferation. Ubiquitination is an
important post-translational protein modification that regulates a
host of critical cellular processes. It has been previously
reported that the inhibition of ubiquitination was very effective
in the treatment of multiple myeloma (18). Proteasome-mediated degradation is a
common mechanism by which cells renew their intracellular proteins
and maintain protein homeostasis (19). Cellular activity is often initiated
by enzymes, which are proteins that are closely associated with
cell cycle processes. The results of the present study suggest that
ubiquitin is able to regulate the cell system within UM by
controlling the activity or degradation of the majority of proteins
in the cells of the eye. Since the majority of patients with UM
succumb to liver metastases (20),
the reason for which is unclear, the enriched signaling pathway
identified in the present study may help to clarify the metastasis
of UM tumors (21,22). The inhibition of the ubiquitin
mediated proteolysis pathway or the genes included in the
co-expression modules may be an effective treatment for UM
(15).
In summary, module 2 was regarded as the most
critical module in the development of UM disease. The ubiquitin
mediated proteolysis pathway was identified as being significantly
enriched in three modules, meaning the constituent proteins could
have potential as diagnostic and prognostic biomarkers of UM;
however, further research is required to investigate this.
Acknowledgements
Not applicable.
Funding
The current study was supported by the Funds for
Guangxi Zhuang Autonomous Region Science And Technology Hall (grant
no. 114000-3B-86).
Availability of data and materials
The analyzed data sets generated during the present
study are available from the corresponding author on reasonable
request.
Authors' contributions
QW and MY conceived and designed the study. XH, HY
and DH performed the computational experiments. QW and MY wrote the
paper. CJW and JL reviewed and edited the manuscript.
Ethics approval and consent to
participate
Not applicable.
Patient consent for publication
Not applicable.
Competing interests
All authors declare that they have no competing
interests.
References
|
1
|
Stang A, Parkin DM, Ferlay J and Jöckel
KH: International uveal melanoma incidence trends in view of a
decreasing proportion of morphological verification. Int J Cancer.
114:114–123. 2005. View Article : Google Scholar : PubMed/NCBI
|
|
2
|
Singh AD and Topham A: Incidence of uveal
melanoma in the United States: 1973–1997. Ophthalmology.
110:956–961. 2003. View Article : Google Scholar : PubMed/NCBI
|
|
3
|
Egan KM, Seddon JM, Glynn RJ, Gragoudas ES
and Albert DM: Epidemiologic aspects of uveal melanoma. Surv
Ophthalmol. 32:239–251. 1988. View Article : Google Scholar : PubMed/NCBI
|
|
4
|
Bedikian AY, Legha SS, Mavligit G,
Carrasco CH, Khorana S, Plager C, Papadopoulos N and Benjamin RS:
Treatment of uveal melanoma metastatic to the liver: A review of
the M.D. Anderson Cancer Center experience and prognostic factors.
Cancer. 76:1665–1670. 1995. View Article : Google Scholar : PubMed/NCBI
|
|
5
|
Clarke C, Madden SF, Doolan P, Aherne ST,
Joyce H, O'Driscoll L, Gallagher WM, Hennessy BT, Moriarty M, Crown
J, et al: Correlating transcriptional networks to breast cancer
survival: A large-scale coexpression analysis. Carcinogenesis.
34:2300–2308. 2013. View Article : Google Scholar : PubMed/NCBI
|
|
6
|
Wan Q, Tang J, Han Y and Wang D:
Co-expression modules construction by WGCNA and identify potential
prognostic markers of uveal melanoma. Exp Eye Res. 166:13–20. 2018.
View Article : Google Scholar : PubMed/NCBI
|
|
7
|
Langfelder P and Horvath S: WGCNA: An R
package for weighted correlation network analysis. BMC
Bioinformatics. 9:5592008. View Article : Google Scholar : PubMed/NCBI
|
|
8
|
Shi Z, Derow CK and Zhang B: Co-expression
module analysis reveals biological processes, genomic gain, and
regulatory mechanisms associated with breast cancer progression.
BMC Syst Biol. 4:742010. View Article : Google Scholar : PubMed/NCBI
|
|
9
|
Udyavar AR, Hoeksema MD, Clark JE, Zou Y,
Tang Z, Li Z, Li M, Chen H, Statnikov A, Shyr Y, et al:
Co-expression network analysis identifies Spleen Tyrosine Kinase
(SYK) as a candidate oncogenic driver in a subset of small-cell
lung cancer. BMC Syst Biol. 7 Suppl 5:S12013. View Article : Google Scholar : PubMed/NCBI
|
|
10
|
Ihaka R and Gentleman R: R: A language for
data analysis and graphics. J Comput Graph Stat. 5:299–314. 1996.
View Article : Google Scholar
|
|
11
|
Dennis G Jr, Sherman BT, Hosack DA, Yang
J, Gao W, Lane HC and Lempicki RA: DAVID: Database for annotation,
visualization, and integrated discovery. Genome Biol. 4:P32003.
View Article : Google Scholar : PubMed/NCBI
|
|
12
|
Ashburner M, Ball CA, Blake JA, Botstein
D, Butler H, Cherry JM, Davis AP, Dolinski K, Dwight SS, Eppig JT,
et al: Gene ontology: Tool for the unification of biology. Nat
Genet. 25:25–29. 2000. View
Article : Google Scholar : PubMed/NCBI
|
|
13
|
Kanehisa M, Goto S, Kawashima S, Okuno Y
and Hattori M: The KEGG resource for deciphering the genome.
Nucleic Acids Res. 32:(Database Issue). D277–D280. 2004. View Article : Google Scholar : PubMed/NCBI
|
|
14
|
Kanehisa M and Goto S: KEGG: Kyoto
encyclopedia of genes and genomes. Nucleic Acids Res. 28:27–30.
2000. View Article : Google Scholar : PubMed/NCBI
|
|
15
|
Gong J, Cao J, Liu G and Huo JR: Function
and mechanism of F-box proteins in gastric cancer (Review). Int J
Oncol. 47:43–50. 2015. View Article : Google Scholar : PubMed/NCBI
|
|
16
|
Testa U: Proteasome inhibitors in cancer
therapy. Curr Drug Targets. 10:968–981. 2009. View Article : Google Scholar : PubMed/NCBI
|
|
17
|
Sane S and Rezvani K: Essential roles of
E3 ubiquitin ligases in p53 regulation. Int J Mol Sci. 18:E4422017.
View Article : Google Scholar : PubMed/NCBI
|
|
18
|
Weathington NM and Mallampalli RK:
Emerging therapies targeting the ubiquitin proteasome system in
cancer. J Clin Invest. 124:6–12. 2014. View
Article : Google Scholar : PubMed/NCBI
|
|
19
|
Liu J, Shaik S, Dai X, Wu Q, Zhou X, Wang
Z and Wei W: Targeting the ubiquitin pathway for cancer treatment.
Biochim Biophys Acta. 1855:50–60. 2015.PubMed/NCBI
|
|
20
|
Gragoudas ES, Egan KM, Seddon JM, Glynn
RJ, Walsh SM, Finn SM, Munzenrider JE and Spar MD: Survival of
patents with metastases from uveal melanoma. Ophthalmology.
98:383–390. 1991. View Article : Google Scholar : PubMed/NCBI
|
|
21
|
Harbour JW, Onken MD, Roberson ED, Duan S,
Cao L, Worley LA, Council ML, Matatall KA, Helms C and Bowcock AM:
Frequent mutation of BAP1 in metastasizing uveal melanomas.
Science. 330:1410–1413. 2010. View Article : Google Scholar : PubMed/NCBI
|
|
22
|
Woodman SE: Metastatic uveal melanoma:
Biology and emerging treatments. Cancer J. 18:148–152. 2012.
View Article : Google Scholar : PubMed/NCBI
|