Introduction
Obesity is the consequence of an imbalance between
energy intake and energy utilization, and animal models of obesity
reflect the behavioural and metabolic features that predispose
humans to chronic caloric overconsumption. The overnutrition of
animals can be achieved by forced feeding, the administration of
high calorie diets, the genetic modification of feeding behaviour
or a combination of these approaches (1).
Obesity is tightly connected with chronic, low-grade
systemic inflammation (2). In the
liver, this complex process begins with the migration of monocytes
across the endothelium, followed by their differentiation into
liver macrophages (Kupffer cells) (3). Kupffer cells secrete tumor necrosis
factor (Tnfa), interleukin (Il)-6 and other inflammatory mediators
and are thus highly pro-inflammatory. Monocyte migration is
dependent on different chemotactic signals, such as monocyte
chemotactic protein 1 (Mcp1; also known as Ccl2), which is
predominant in the liver (4). The
increased synthesis of these mediators reflects obesity-induced
transcriptional upregulation of inflammatory genes.
Although the links between gut microbiota and
obesity remain unclear, chronic low-grade endotoxemia has been
suggested as one of the mechanisms involved in the development of
obesity-related disorders (5).
Lipopolysaccharides (LPS) are endotoxins that act on Toll-like
receptor 4 (TLR4), induce mitogen-activated protein kinase (MAPK)
and nuclear factor (NF)-κB expression, and subsequently induce the
release of pro-inflammatory molecules (6). An excess calorie intake increases
the LPS concentration in serum as a consequence of a change in the
proportion of Gram-negative bacteria in the gut or the permeability
of the gut to bacteria (7).
Obesity-induced endotoxemia and related systemic and liver
inflammation can be lowered by treatment with prebiotics (6). Thus, chronic low-grade inflammation,
a characteristic of obesity, can be indicative of the response to
LPS released by the gut microflora. The results of our recently
published transcriptome-based analyses are in agreement with this
finding (8,9).
The genetic program is directed by epigenetic
information and accomplished by cell-specific, developmental
stage-specific and metabolism-related changes in gene expression.
Epigenetic changes modulate the accessibility of genes and their
cis-regulatory elements to transcriptional complexes,
predominantly through histone post-translational modifications
(PTMs). PTMs are highly dynamic, may appear and disappear within
only a few minutes in response to stimuli, and are likely to be
common to each cell type in an organism (10). The acetylation of lysines is an
ubiquitous PTM and is regulated by histone acetyltransferases
(HATs) and histone deacetylases (HDACs), two families of enzymes
with opposing activities (11).
Acetylation neutralises the positive charge on the lysine
side-chain, relaxes the chromatin structure and generates docking
sites for bromodomain (BRD)-containing proteins (12).
Improvements in the sensitivity of chromatin
immunoprecipitation (ChIP) assays have allowed the study of
transcriptional and epigenetic changes in tissue (13–15). Using a multiplex Matrix-ChIP
platform (14), in this study, we
simultaneously analyzed the selected chromatin modifications and
chromatin-bound factors in liver samples obtained from obese mice
and cultured hepatocytes treated with LPS. We found that the
increased expression of Tnfa and Ccl2 was marked by
acetylated histone H3.
Materials and methods
Tissue samples
For chromatin isolation, we used liver samples
collected in our previous studies (8,9).
Briefly, 5-week-old male wild-type (wt) C57BL/6J mice and mice that
were homozygous for the leptin gene mutation
B6.V-Lepob/J (ob/ob) were purchased from the Jackson
Laboratory (Raritan, NJ, USA). During 1 week of adaptation, all
mice were fed a normal diet (ND) with 10% of calories from fat
(D12450B; Research Diets, New Brunswick, NJ, USA). At 6 weeks of
age, 12 wt C57BL/6J (control group) and 12 ob/ob mice were further
fed a ND, while another 12 wt C57BL/6J mice were fed a high-fat
diet (HFD) with 60% of calories from fat (D12492; Research Diets).
At either 16 or 48 weeks of age, 6 mice from each group were
sacrificed and liver tissues collected. The experimental protocols
were approved by the 2nd Local Ethics Committee for Animal Research
in Warsaw, Poland. The experimental design and results of liver
histopathological examination and serum biochemical analyses were
described in our previous study (9).
Cell line
The mouse hepatocyte cell line, Hepa1-6, was
delivered from the American Type Culture Collection (ATCC;
Manassas, VA, USA). The cells were grown for 24 h in 6-well culture
plates to 40–50% confluence, then treated with either DMSO (0.01%)
or LPS at the final concentration of 10 μg/ml for 30, 60 and 90 or
120 min and harvested for downstream analyses.
ChIP assay
Tissue (50 mg) was immersed in 2 ml of hypotonic
buffer A (10mM HEPES pH 7.9, 2 mM MgCl2, 2 mM KCl)
supplemented with protease and phosphatase inhibitors (78441;
Thermo Scientific, Rockford, IL, USA) and homogenized by 10 strokes
with a loose pestle and 30 strokes with a tight pestle in a Dounce
homogenizer (Wheaton, Millville, NJ, USA) followed by
centrifugation at 2,000 rpm for 5 min in 4°C. The nuclei pellet was
cross-linked in 1 ml 1% formaldehyde/PBS for 10 min at room
temperature and then formaldehyde was quenched at room temperature
for 5 min by the addition of 2 M glycine to a 125 mM final
concentration. Following 5-min centrifugation at 2,000 rpm at room
temperature, the nuclei were washed once with 1 ml of PBS and
stored at −80°C.
The nuclei pellet was resuspended in lysis buffer
(12.5 mM Tris-HCl, pH 8.0; 2.5 mM EDTA; 0.25% SDS) containing
protease and phosphatase inhibitors (Thermo; 78441). Chromatin was
sheared in a Bioruptor® Plus [Diagenode, Seraing
(Ougrée), Belgium] using 30 sec on-off cycles for 15 min at high
intensity according to the protocol. ChIP assays were performed
using Matrix-ChIP on polypropylene plates (BioExpress, Kaysville,
UT, USA), as previously described (16). The ChIP DNA data were expressed as
the percentage of input DNA or as the ratio of modified histone to
total histone H3, as previously described (14). The following antibodies were used
in ChIP assay: non-specific rabbit IgG (I-1,000; Vector
Laboratories, Inc., Burlingame, CA, USA), polymerase 2 RNA (Pol2;
4H8) (sc-47701; Santa Cruz Biotechnology, Santa Cruz, CA, USA),
NF-κB p65 (ab7970; Abcam, Cambridge, MA, USA), histone H3 (ab1791;
Abcam), histone H3 lysine 9 and 18 acetylation (H3K9/K18Ac, 07–593;
Millipore, Billerica, MA, USA), H3 lysine 4 trimethylation
(H3K4me3, pAb-003–050; Diagenode), H3 lysine 36 trimethylation
(H3K36me3, ab9050; Abcam).
Total RNA extraction and RT reaction
Total RNA was extracted from either cells or liver
tissue using the TRIzol® Plus RNA Purification kit
(Invitrogen, Carlsbad, CA, USA) with On-column DNase I treatment.
Total RNA (1 μg) and random hexamers were used in cDNA synthesis
with SuperScript III (Invitrogen) according to the manufacturer’s
instructions.
Quantitative PCR (qPCR)
qPCR analysis of the cDNA and ChIP samples was
carried out using an Applied Biosystems 7900HT Fast Real-Time PCR
System with a SensiMix SYBR kit (Bioline, Tautan, MA, USA). The
expression of Mrpl36, Hmbs and Mcoln1 was used to generate a
normalizing factor with geNorm software, as previously described
(17). The sequences of all
primers used are listed in Table
I. Differences were evaluated using the Mann-Whitney U test
with GraphPad Prism 5 software. A P-value <0.05 was considered
to indicate a statistically significant difference.
 | Table IList of primers used in qPCR. |
Table I
List of primers used in qPCR.
| Gene | Orientation | Sequence
(5′→3′) | Assay |
|---|
| Gapdh | Forward
Reverse |
CCCATCACGTCCTCCATC
TGGGCACTGTACGGGTCT | ChIP |
|
Ccl2-ex1 | Forward
Reverse |
GCCAACACGTGGATGCTC
AGCCAACTCTCACTGAAGCC | ChIP |
|
Ccl2-ex3 | Forward
Reverse |
TTAAGGCATCACAGTCCGAG
TTGAATGTGAAGTTGACCCG | ChIP |
|
Tnfa-ex1 | Forward
Reverse |
GCAGGTTCTGTCCCTTTCAC
AGTGCCTCTTCTGCCAGTTC | ChIP |
|
Tnfa-ex4 | Forward
Reverse |
TATGGCTCAGGGTCCAACTC
GCTCCAGTGAATTCGGAAAG | ChIP |
| Tnfa | Forward
Reverse |
GCTACGACGTGGGCTACAG
CCCTCACACTCAGATCATCTTCT | RT |
| Ccl2 | Forward
Reverse |
ATGTCTGGACCCATTCCTTCT
AGGTGTCCCAAAGAAGCTGTA | RT |
| Mrpl36 | Forward
Reverse |
CTCAGGTGCAGGAACGGGTC
CCCTTCCCAGGTCTGGGCTC | RT |
| Hmbs | Forward
Reverse |
AAGGGTTTTCCCGTTTGC
TCCCTGAAGGATGTGCCTA | RT |
| Mcoln1 | Forward
Reverse |
CCACCACGGACATAGGCATAC
GCTGGGTTACTCTGATGGGTC | RT |
Results
Animal experiments
Altered gene expression leading to the the
activation of pro-inflammatory signaling and the deregulation of
metabolic pathways is characteristic of obesity-induced hepatic
inflammation (18). In this
study, we performed experiments using 16- and 48-week-old HFD-fed
and ND-fed wild-type C57BL/6J mice and hyperphagic (ob/ob) obese
mice, as previously described (9). Six mice per group of each given
genotype, age and diet were used.
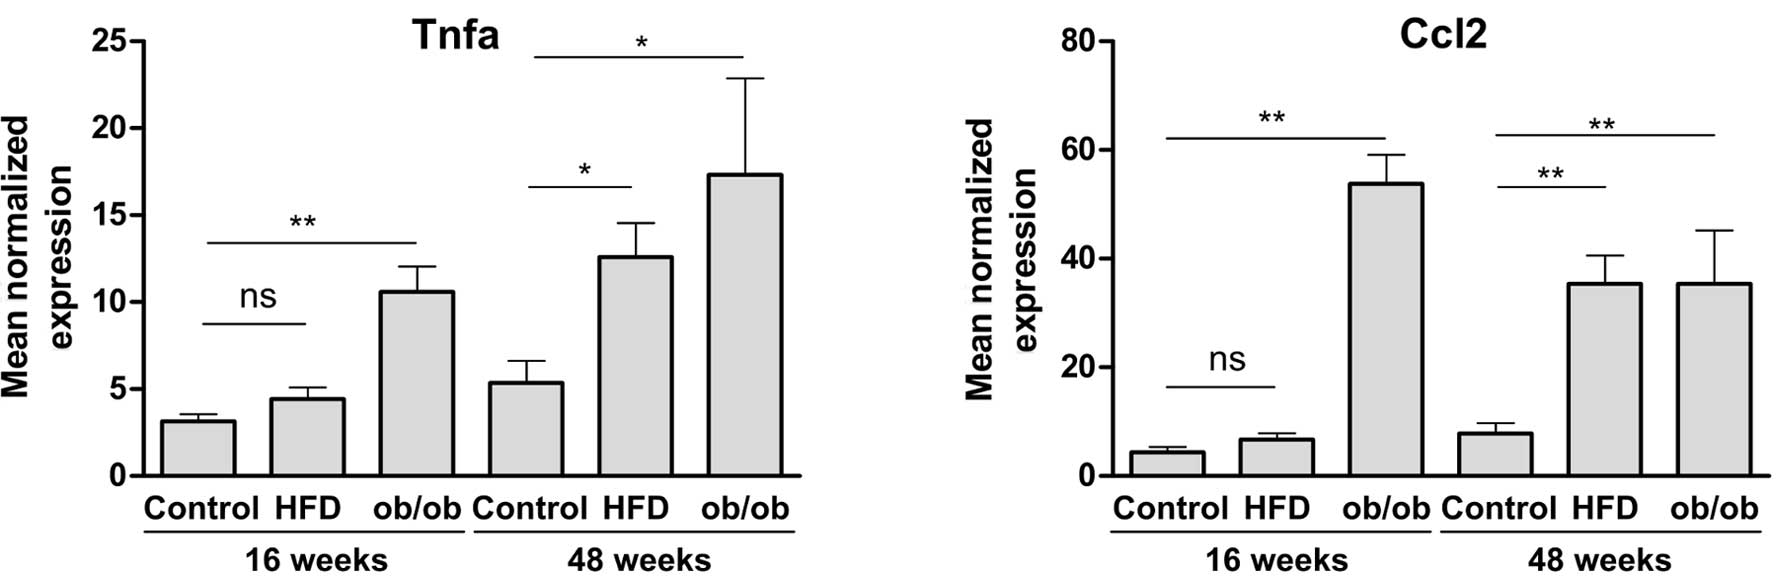
The expression of Tnfa and Ccl2 was
analyzed in the liver samples by qPCR. As shown in Fig. 1, the mRNA levels of both
transcripts were higher in the 16-week-old (young) and the
48-week-old (old) ob/ob mice and the old HFD-fed mice than in the
control and young wt HFD-fed mice. As was observed in a recent
study of ours (9), young and old
ob/ob mice developed steatosis, which was accompanied by moderate
inflammation in the older mice. The livers of both the 16- and
48-week-old control mice, as well as of the young HFD-fed mice,
were histologically normal, while the livers of the old HFD-fed
mice displayed steatosis with mild inflammation. Hyperinsulinemia,
hyperglycemia and hypercholesterolemia were observed in the ob/ob
and old HFD-fed mice (9). Thus,
animals exhibiting increased expression of both pro-inflammatory
cytokines related to fatty liver were combined into a single group
henceforth referred to as the obese group. The control group
comprised of 16-week old HFD-fed mice and ND-fed control mice of
both age groups.
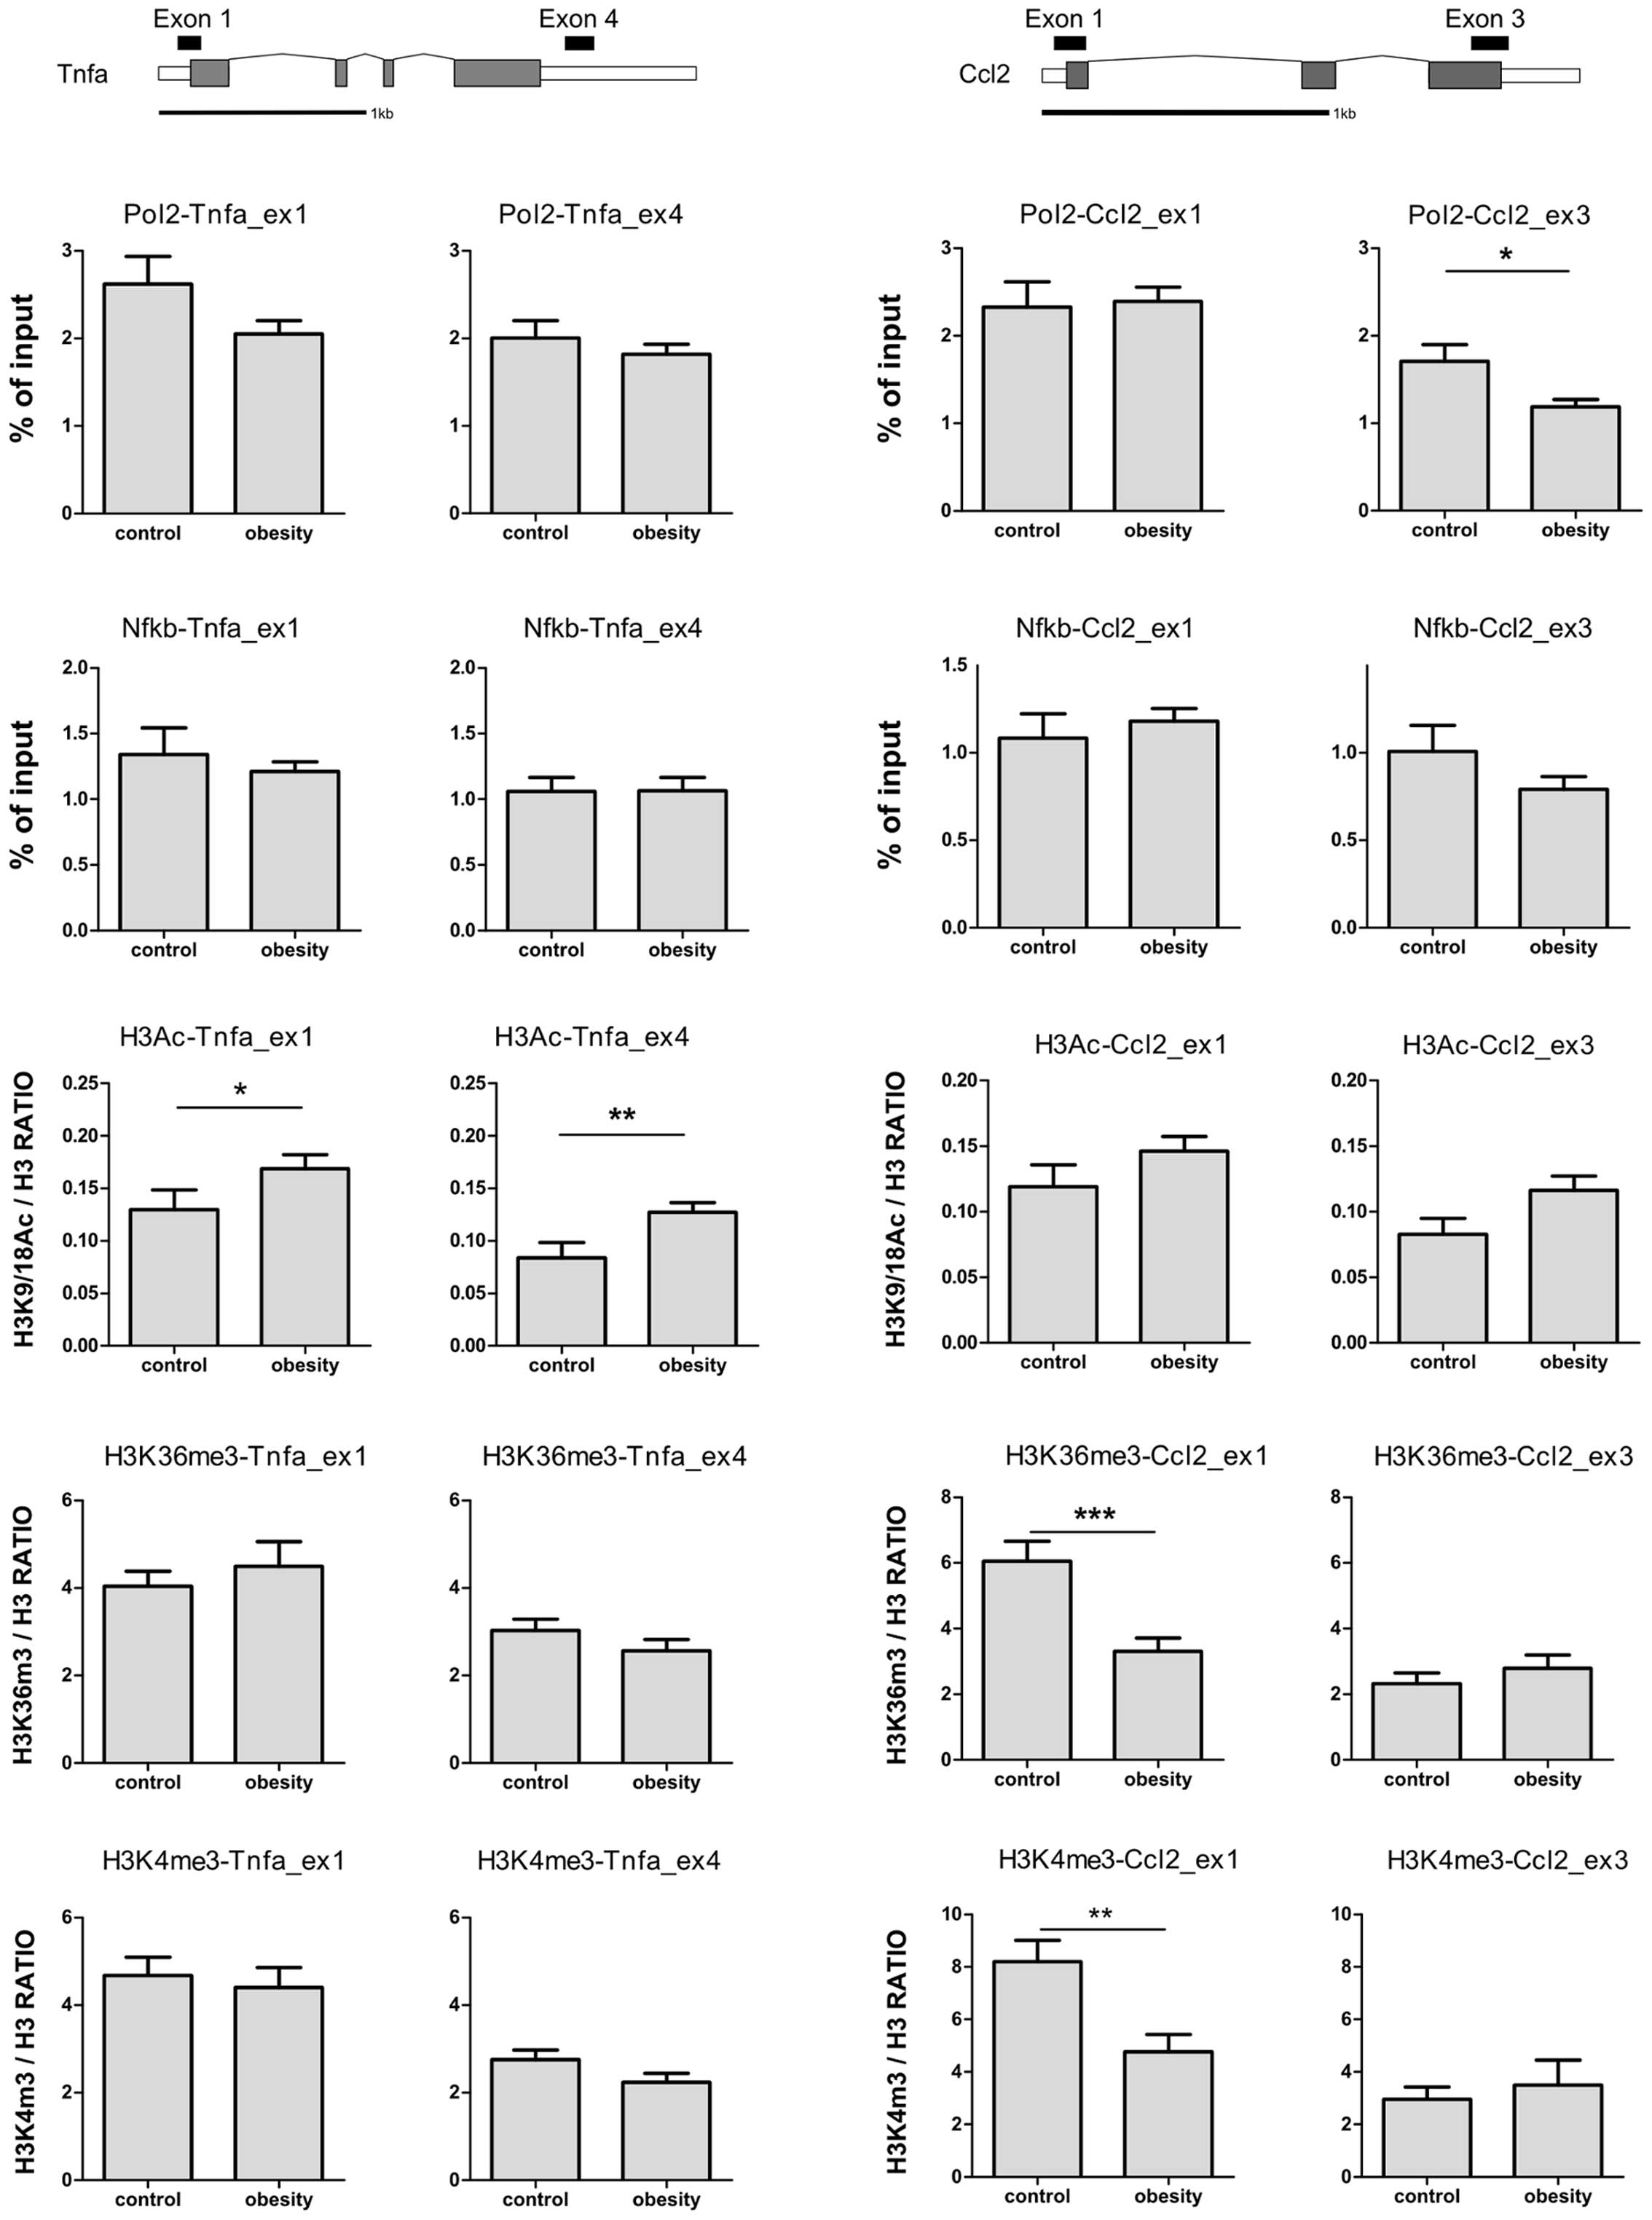
The distribution of histone PTMs and nuclear
proteins along chromatin, including Pol2 and transcription factors,
were analyzed using ChIP assays. To estimate the contribution of
Pol2 and NF-κB recruitment to changes in Tnfa and Ccl2 transcript
levels, Pol2 and NF-κB levels were determined by ChIP assay at the
first exon near the transcription start site and at one site within
the last exon of each gene (Fig.
2). NF-κB plays a central role in the induction of
pro-inflammatory gene expression (19). Unexpectedly, neither the Pol2 nor
the NF-κB levels corresponded to the increased mRNA levels of
Tnfa and Ccl2 observed in the livers of the obese
mice. Additionally, Pol2 abundance at Ccl2 was decreased in
these mice.
Subsequently, in order to elucidate the contribution
of the state of the chromatin at the Tnfa and Ccl2
loci to their transcription, histone modification markers
associated with active transcription were examined (Fig. 2). The acetylation of lysines
eliminates their positive charge, which has been shown to have a
negative effect on the higher order structure of chromatin, making
it less compact (11). The
acetylation of histone H3 lysine 9 and 18 (H3K9K18Ac) is associated
with actively transcribed genes (12). The levels of H3K9K18Ac at the
Tnfa gene were significantly higher at the first and last
exon in the obese mice. The H3K9K18Ac levels at the Ccl2
gene were also increased, although this did not reach the
significance threshold. These results are consistent with those of
several studies on histone acetylation patterns of actively
transcribed genes, as reviewed by Medzhitov and Horng (20).
The trimethylation of histone H3 lysine 4 (H3K4me3)
is regarded as an indicator of active chromatin at the 5′ ends of
actively transcribed genes (12).
The H3K4me3 levels at Tnfa were not changed in obese
animals. In addition, the abundance of this mark at the first exon
of Ccl2 was significantly decreased in the obese animals,
contrary to the expectation that H3K4me3 correlates with an
elevated mRNA expression. The trimethylation of histone H3 lysine
36 (H3K36me3) is associated with transcription elongation and is
expected to gradually increase toward the 3′ end of a transcribed
gene (12). The level of H3K36me3
was unaffected at the Tnfa gene, while its level at the
first exon of Ccl2 mirrored the changes observed for
H3K4me3. Taken together, these results demonstrate that the
increased acetylation of K9/K18 residues at histone H3 along
inflammatory genes in murine fatty liver is an epigenetic mark that
correlates with their expression.
Cell culture studies
Unexpectedly, only the acetylation of histone H3
differed in the livers of the obese mice compared to the control
mice. To confirm that our methodology reliably determined the
epigenetic make-up at these inflammatory genes, we used LPS to
induce an inflammatory response in Hepa1-6 cells, a cell line
derived from murine hepatocytes. LPS mediates an inflammatory
response through TLRs and differentially regulates the expression
of numerous genes involved in cell migration, tissue repair and
remodeling, antimicrobial defense, phagocytosis, metabolic
reprogramming and the regulation of adaptive immune responses
(20).
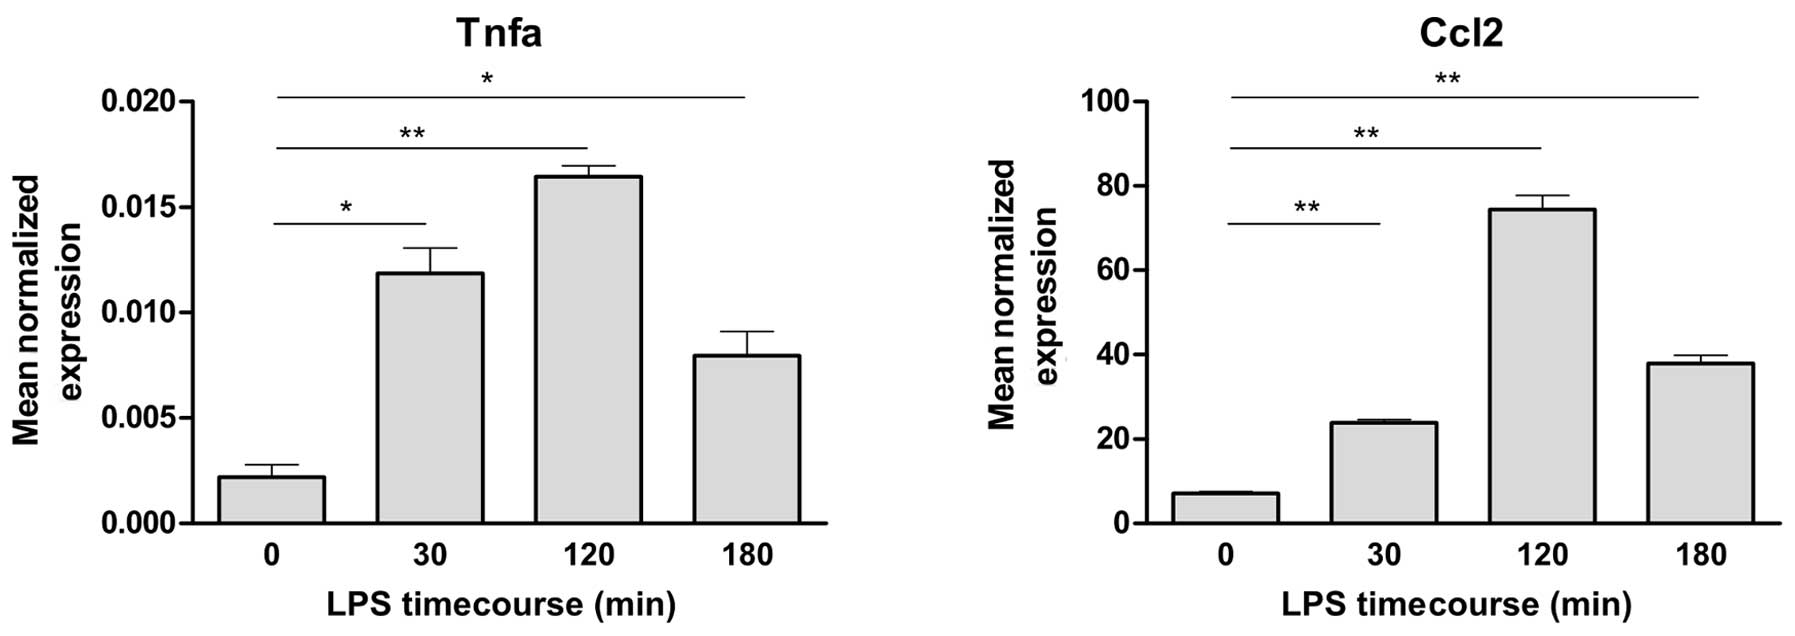
The Hepa1-6 cells were treated with LPS at a
concentration of 10 μg/ml. This induced a substantial increase in
the mRNA expression of Tnfa and Ccl2, with a peak
expression at 120 min (Fig. 3).
Subsequently, we stimulated the Hepa1-6 cells with LPS for 30, 60
and 90 min to capture the epigenetic changes at the Tnfa and
Ccl2 loci that preceded the maximum mRNA expression of these
genes. ChIP analyses were performed for the same factors and
histone marks as analyzed in the experiments on chromatin isolated
from liver samples.
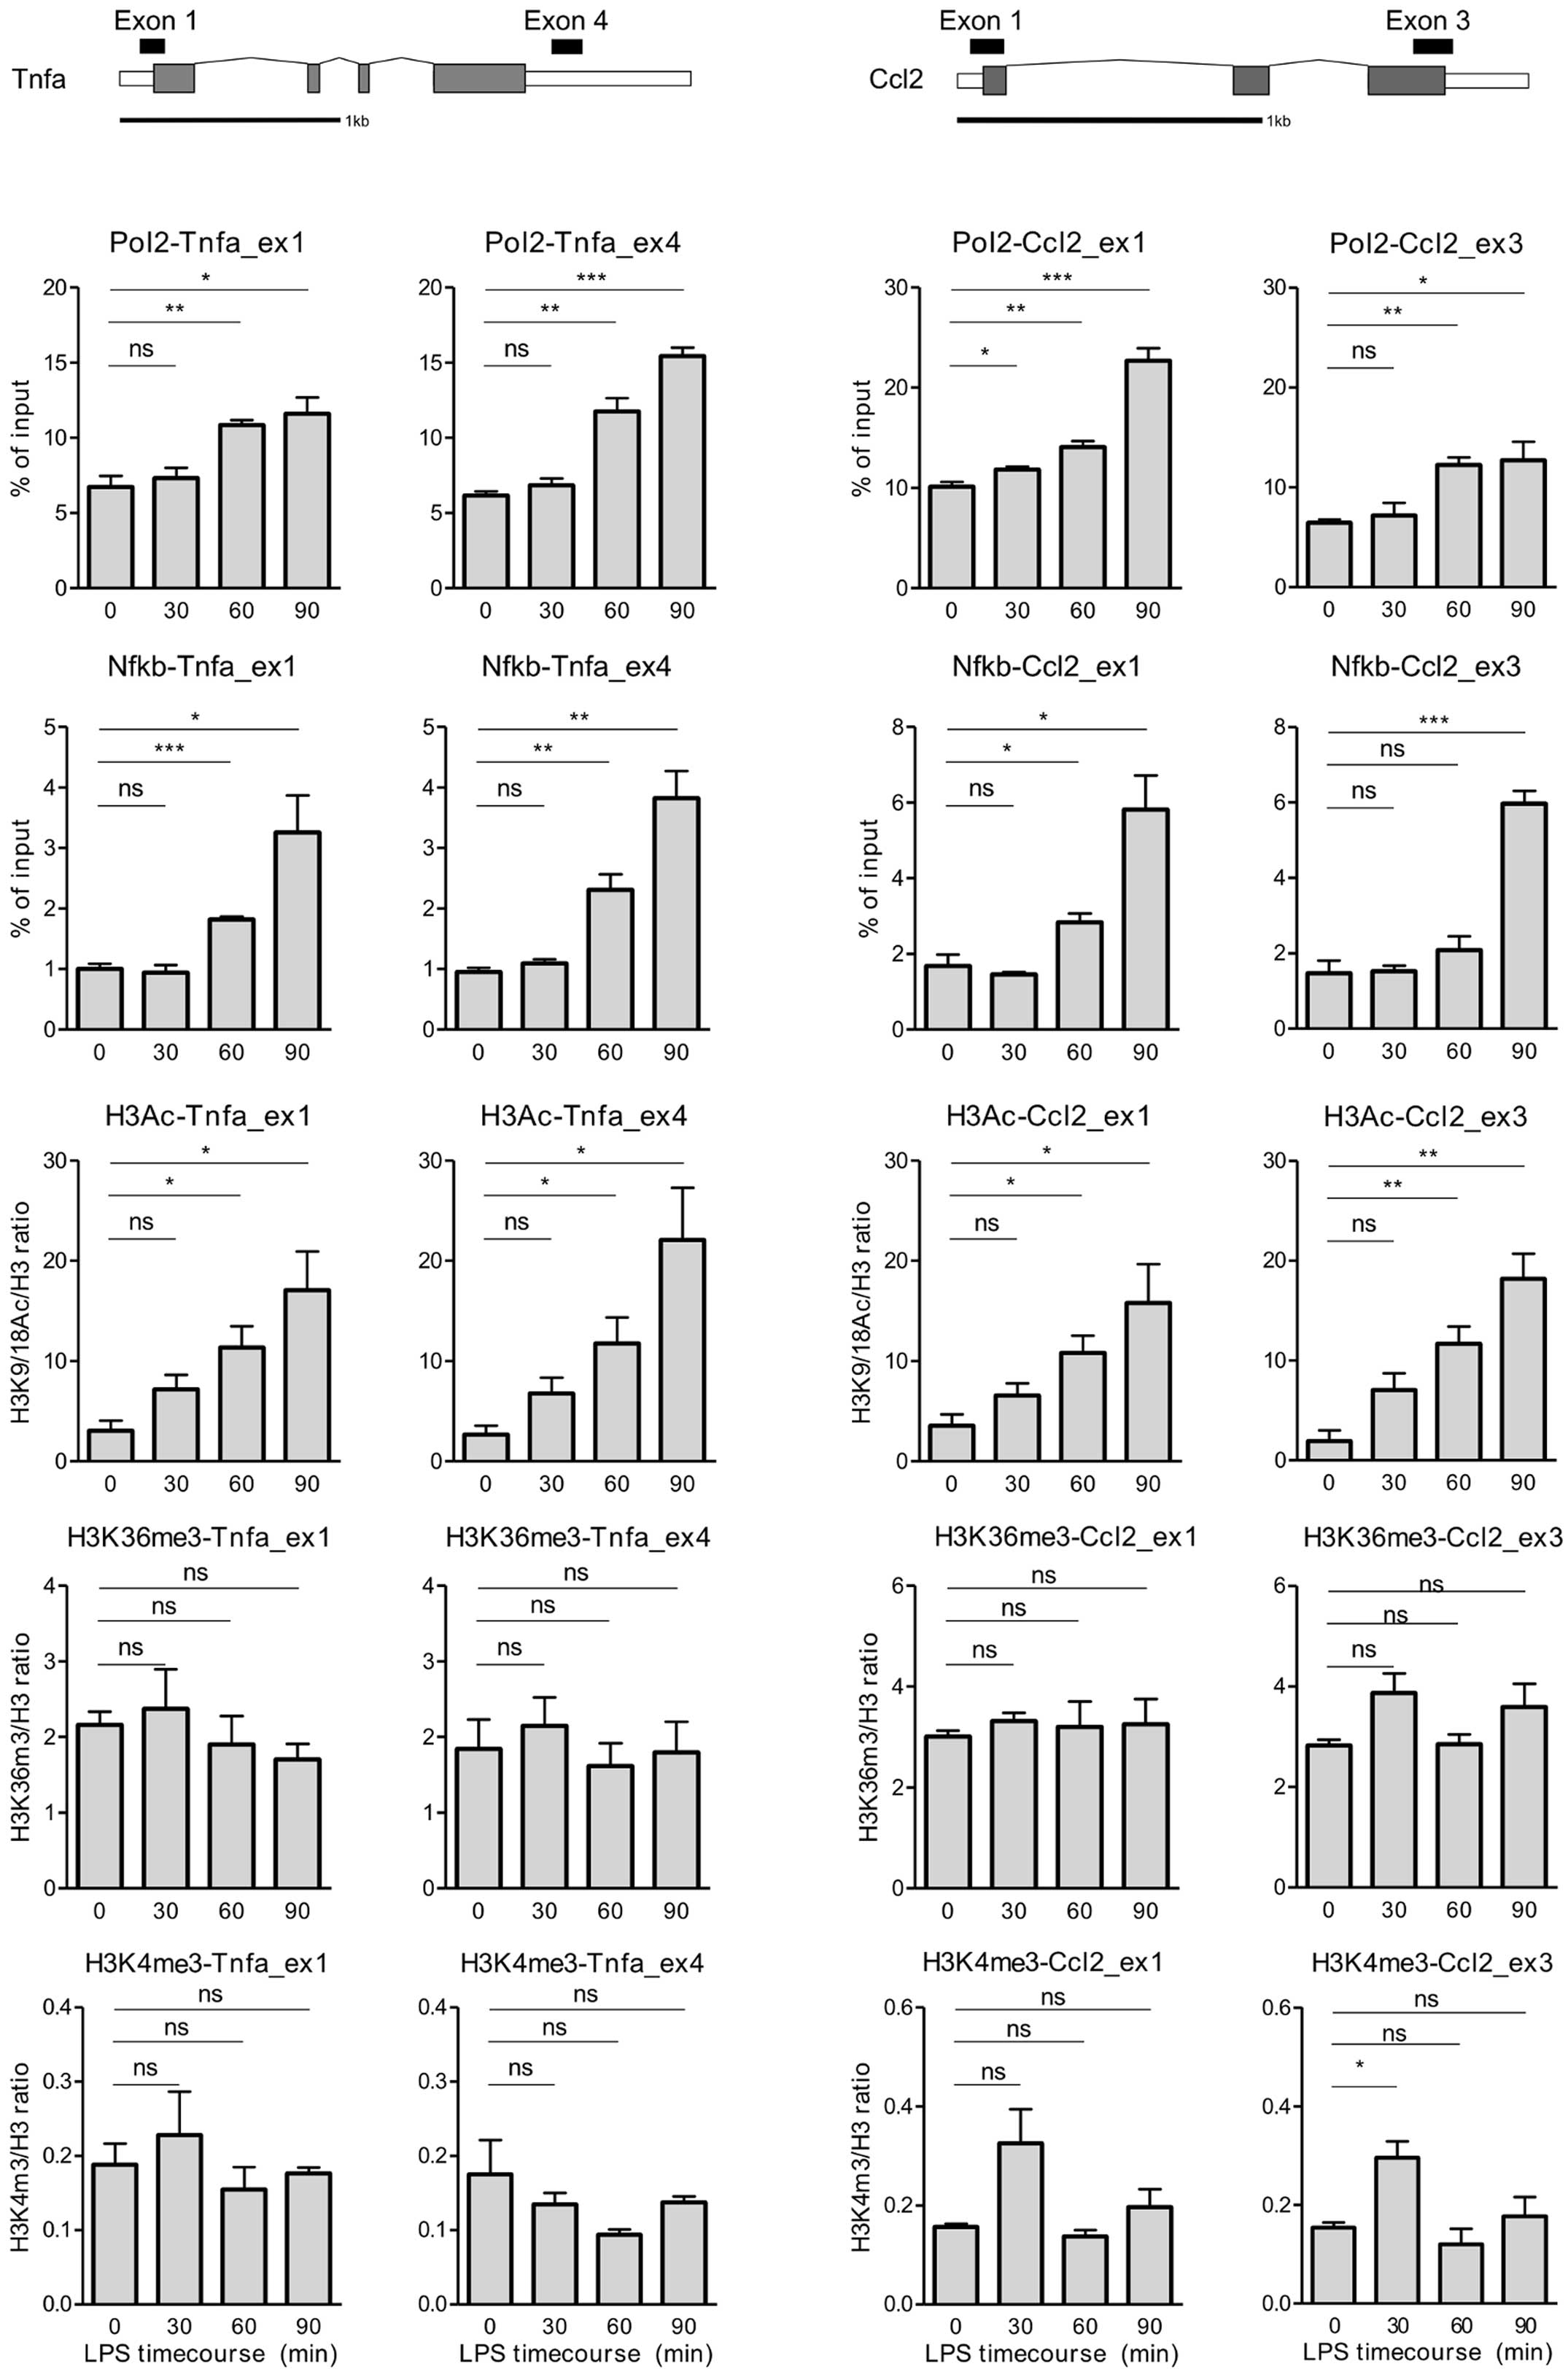
In response to LPS treatment, Pol2 levels at
Tnfa and Ccl2 progressively increased, with a peak at
90 min (Fig. 4). This
LPS-mediated increase in Pol2 density was associated with higher
levels of NF-κB and H3K9/18Ac at these loci. We also examined NF-κB
binding at the ends of the genes since the presence of
transcription factors in the body of an activated gene, rather than
simply at the promoter region, has been observed, and this binding
followed the Pol2 distribution pattern (21). Furthermore, NF-κB distribution
along chromosome 22 has been reported, suggesting that it binds to
sites other than the promoter (22). In concordance with these
observations, NF-κB binding at Tnfa and Ccl2
following LPS stimulation resembled the pattern of Pol2 recruitment
(Fig. 4).
Notably, H3K9/18Ac abundance also mirrored Pol2 and
NF-κB density at these genes; however, it was more robust and,
although not significant, already pronounced after 30 min of LPS
stimulation (Fig. 4).
Surprisingly, no significant differences were observed in the
H3K4me3 and H3K36me3 marks in this experimental setup, with the
exception of an increase in the H3K4me3 levels at the end of
Ccl2 after 30 min of LPS stimulation. At the same time, LPS
had no effect on the expression of the Gapdh housekeeping gene,
which was characterized by high basal levels of H3K9/18Ac, H3K4me3
and Pol2 at its promoter (data not shown). In conclusion, our
survey of epigenetic changes at Tnfa and Ccl2 in
cells treated with LPS confirmed that the acetylation of histone H3
is strongly associated with the increased transcription of these
genes.
Discussion
The interplay between chromatin states and gene
expression represent key mechanisms underlying the development of
numerous disease phenotypes, including the modulation of the
expression of pro-inflammatory factors produced by a wide variety
of cells (23). Non-alcoholic
fatty liver disease (NAFLD)-associated phenotypes, both in humans
and animal models of obesity, are associated with the altered
expression of genes involved in a number of processes, including
hepatic glucose and lipid metabolism, insulin signaling,
inflammation, coagulation, cell adhesion, oxygen stress and
chaperone activity (24). Some of
these processes are modulated by Tnfa, Il-6 and interferon-γ and
their increased expression reflects both global chronic
inflammation and local liver injury (25–27).
Given the link between obesity and low-grade
inflammation in the liver, we set out to survey epigenetic changes
at two of the inflammatory genes that accompany this process, i.e.,
Tnfa and Ccl2. As expected, both Tnfa and
Ccl2 mRNA levels were significantly increased in ob/ob and
old HFD mice (Fig. 1) and
corresponded with liver steatosis, as determined by
histopathological evaluation (9).
These expression data are in accordance with a previous study by
Stanton et al (28), in
which fatty liver was induced by a high cholesterol diet.
To the best of our knowledge, no previous studies
have investigated epigenetic changes at inflammatory genes in liver
tissue upon steatosis. As Tnfa and Ccl2 mRNA levels
were elevated in our model of obesity, we surveyed epigenetic
events at the chromatin of these two loci. However, out of several
chromatin features tested, only the acetylation of histone H3 was
associated with an increase in the mRNA levels of these two
inflammatory genes in the livers of obese mice (Figs. 1 and 2). Although post-transcriptional
mechanisms may account for the observed changes in the mRNA levels
of these inflammatory genes (29–31), the survey of Pol2 complexes along
the locus provided a means to assess the rates of transcription.
Although conditions of acute endotoxemia accompany elevated plasma
levels of inflammatory mediators and potentially contribute to
multi-organ failure, including acute renal failure (15,32), in our study, we did not observe an
increase in Pol2 transcriptional complex density at these genes
(Fig. 2). On the other hand, the
observed increase in histone H3 acetylation may result in the
higher accessibility of the Pol2 complex to chromatin, thereby
allowing more robust Pol2 traveling along the gene. In contrast to
in vivo studies of the LPS-induced inflammatory response
(Fig. 3), LPS-induced acute
inflammation in Hepa1-6 cells was accompanied by an increase in the
binding of Pol2 transcriptional complexes (Fig. 4).
Liver steatosis is a chronic state, in contrast to
the acute inflammatory response induced in cultured cells
challenged with LPS (15). It is
likely that this difference is the reason we did not observe the
same results in vitro and in vivo. Chronic liver
steatosis in which acetylation marks are already established can
render inflammatory loci more transcription-permissive without
inducing measurable changes in Pol2 levels. Another possible reason
for the differences in the results obtained from analyses of liver
samples and cells in culture may stem from the general cellular
heterogeneity of organs and tissues. When certain epigenetic
changes are present only in a minority cell type, the analysis of
samples taken from whole tissues has an obvious limitation, as
cells that compose the majority of the tissue can mask the probed
epigenetic marks. These limitations may be addressed with a
combination approach utilizing laser capture microdissection and
more sensitive ChIP methods requiring the input of fewer cells.
Histone acetylation is a well-established PTM
associated with transcriptional activity in eukaryotic cells
(33), and increased histone
acetylation at inflammatory gene loci has been shown in both in
vivo and in vitro studies (20). For example, increased histone H3
and H4 acetylation at the Tnfa promoter is associated with
the induction of transcription by LPS, high glucose concentrations,
a diabetic state and systemic lupus erythematosus. However, it must
be stressed that the majority of these studies were performed on
monocytes and macrophages in vivo or in cell culture
(34–37). Consequently, Tnfa
transcription has been shown to be regulated by a number of HATs,
including CBP/p300, p/CAF and GCN5 (38). Histone acetyl-lysine modifications
also serve as docking sites for factors that promote transcription
through interactions with BRD-containing proteins. Recently
developed small molecule inhibitors targeting BRD-containing
proteins have been shown to selectively interfere with inflammatory
gene expression (39). In line
with the action of these drugs are the effects of knockdown of
BRD-containing proteins, particularly Brd2. Brd2 disruption
in mice has been shown to ameliorate obesity-induced inflammatory
responses, protect animals from insulin resistance, glucose
intolerance, and pancreatic beta cell dysfunction and uncoupled
obesity from the onset of diabetes (40,41). The role of chronic inflammation
and metabolic dysfunction in NAFLD is a considerable public health
issue, and new epigenetic drugs, such as those targeting
BRD-containing proteins, may provide a novel means of treating or
preventing obesity-related diseases (42).
While the level of H3K4m3 marks has generally been
shown to correlate with gene expression and histone H3 acetylation
(43), our measurements displayed
no such dependency at the Tnfa and Ccl2 genes in
either liver or cell culture (Figs.
2 and 4). Furthermore,
together with upregulated gene expression, an increase in H3K36me3
histone marks is expected at the 3′ end of actively transcribed
genes (44). However, the present
study did not demonstrate such a pattern at Tnfa and
Ccl2. In line with our observation regarding the lack of
changes in H3K4me3 and H3K36me3 upon Tnfa and Ccl2
activation are recent findings in yeast by Zhang et al
(45), who provided evidence that
a marked increase in transcription can occur in the context of
little, if any, covalent histone modification including the two
aforementioned marks. Our data therefore suggest that these two
permissive epigenetic modifications may not act in concert with
histone H3 acetylation to generate a transcriptional response at
Tnfa and Ccl2 in the liver and liver-derived cell
lines.
In conlcusion, the use of a multiplex Matrix-ChIP
platform allowed us to assess obesity-mediated epigenetic changes
in the liver at two pro-inflammatory genes, Tnfa and
Ccl2, suggesting that histone H3 acetylation is associated
with obesity.
Acknowledgements
The present study was supported by a grant (N N401
532240) from the Polish Ministry of Science and Higher
Education.
References
|
1
|
Larter CZ and Yeh MM: Animal models of
NASH: getting both pathology and metabolic context right. J
Gastroenterol Hepatol. 23:1635–1648. 2008. View Article : Google Scholar : PubMed/NCBI
|
|
2
|
Hotamisligil GS: Inflammation and
metabolic disorders. Nature. 444:860–867. 2006. View Article : Google Scholar
|
|
3
|
Curat CA, Miranville A, Sengenès C, Diehl
M, Tonus C, Busse R and Bouloumié A: From blood monocytes to
adipose tissue-resident macrophages: induction of diapedesis by
human mature adipocytes. Diabetes. 53:1285–1292. 2004. View Article : Google Scholar : PubMed/NCBI
|
|
4
|
Kamei N, Tobe K, Suzuki R, et al:
Overexpression of monocyte chemoattractant protein-1 in adipose
tissues causes macrophage recruitment and insulin resistance. J
Biol Chem. 281:26602–26614. 2006. View Article : Google Scholar
|
|
5
|
Musso G, Gambino R and Cassader M:
Obesity, diabetes, and gut microbiota: the hygiene hypothesis
expanded? Diabetes Care. 33:2277–2284. 2010. View Article : Google Scholar : PubMed/NCBI
|
|
6
|
Moreno-Indias I, Cardona F, Tinahones FJ
and Queipo-Ortuño MI: Impact of the gut microbiota on the
development of obesity and type 2 diabetes mellitus. Front
Microbiol. 5:1902014. View Article : Google Scholar : PubMed/NCBI
|
|
7
|
Cani PD and Delzenne NM: The role of the
gut microbiota in energy metabolism and metabolic disease. Curr
Pharm Des. 15:1546–1558. 2009. View Article : Google Scholar : PubMed/NCBI
|
|
8
|
Nesteruk M, Hennig EE, Mikula M, et al:
Mitochondrial-related proteomic changes during obesity and fasting
in mice are greater in the liver than skeletal muscles. Funct
Integr Genomics. 14:245–259. 2014. View Article : Google Scholar : PubMed/NCBI
|
|
9
|
Hennig EE, Mikula M, Goryca K, et al:
Extracellular matrix and cytochrome P450 gene expression can
distinguish steatohepatitis from steatosis in mice. J Cell Mol Med.
18:1762–1772. 2014. View Article : Google Scholar : PubMed/NCBI
|
|
10
|
Prinjha R and Tarakhovsky A: Chromatin
targeting drugs in cancer and immunity. Genes Dev. 27:1731–1738.
2013. View Article : Google Scholar : PubMed/NCBI
|
|
11
|
Bannister AJ and Kouzarides T: Regulation
of chromatin by histone modifications. Cell Res. 21:381–395. 2011.
View Article : Google Scholar : PubMed/NCBI
|
|
12
|
Kouzarides T: Chromatin modifications and
their function. Cell. 128:693–705. 2007. View Article : Google Scholar : PubMed/NCBI
|
|
13
|
Dahl JA and Collas P: MicroChIP: chromatin
immunoprecipitation for small cell numbers. Methods Mol Biol.
567:59–74. 2009. View Article : Google Scholar : PubMed/NCBI
|
|
14
|
Flanagin S, Nelson JD, Castner DG,
Denisenko O and Bomsztyk K: Microplate-based chromatin
immunoprecipitation method, Matrix ChIP: a platform to study
signaling of complex genomic events. Nucleic Acids Res. 36:e172008.
View Article : Google Scholar : PubMed/NCBI
|
|
15
|
Bomsztyk K, Flanagin S, Mar D, Mikula M,
Johnson A, Zager R and Denisenko O: Synchronous recruitment of
epigenetic modifiers to endotoxin synergistically activated Tnf-α
gene in acute kidney injury. PLoS ONE. 8:e703222013.PubMed/NCBI
|
|
16
|
Yu J, Feng Q, Ruan Y, Komers R, Kiviat N
and Bomsztyk K: Microplate-based platform for combined chromatin
and DNA methylation immunoprecipitation assays. BMC Mol Biol.
12:492011. View Article : Google Scholar : PubMed/NCBI
|
|
17
|
Vandesompele J, De Preter K, Pattyn F,
Poppe B, Van Roy N, De Paepe A and Speleman F: Accurate
normalization of real-time quantitative RT-PCR data by geometric
averaging of multiple internal control genes. Genome Biol.
3:RESEARCH00342002. View Article : Google Scholar : PubMed/NCBI
|
|
18
|
Tian Y, Wong VWS, Chan HLY and Cheng ASL:
Epigenetic regulation of hepatocellular carcinoma in non-alcoholic
fatty liver disease. Semin Cancer Biol. 23:471–482. 2013.
View Article : Google Scholar : PubMed/NCBI
|
|
19
|
Lawrence T: The nuclear factor NF-kappaB
pathway in inflammation. Cold Spring Harb Perspect Biol.
1:a0016512009. View Article : Google Scholar : PubMed/NCBI
|
|
20
|
Medzhitov R and Horng T: Transcriptional
control of the inflammatory response. Nat Rev Immunol. 9:692–703.
2009. View
Article : Google Scholar : PubMed/NCBI
|
|
21
|
Freaney JE, Kim R, Mandhana R and Horvath
CM: Extensive cooperation of immune master regulators IRF3 and
NF-κB in RNA Pol II recruitment and pause release in human innate
antiviral transcription. Cell Rep. 4:959–973. 2013.PubMed/NCBI
|
|
22
|
Martone R, Euskirchen G, Bertone P, et al:
Distribution of NF-kappaB-binding sites across human chromosome 22.
Proc Natl Acad Sci USA. 100:12247–12252. 2003. View Article : Google Scholar : PubMed/NCBI
|
|
23
|
Shanmugam MK and Sethi G: Role of
epigenetics in inflammation-associated diseases. Subcell Biochem.
61:627–657. 2013. View Article : Google Scholar : PubMed/NCBI
|
|
24
|
Naik A, Košir R and Rozman D: Genomic
aspects of NAFLD pathogenesis. Genomics. 102:84–95. 2013.
View Article : Google Scholar
|
|
25
|
Kim Y and Park T: DNA microarrays to
define and search for genes associated with obesity. Biotechnol J.
5:99–112. 2010. View Article : Google Scholar : PubMed/NCBI
|
|
26
|
Xu C, Wang G, Hao Y, Zhi J, Zhang L and
Chang C: Correlation analysis between gene expression profile of
rat liver tissues and high-fat emulsion-induced nonalcoholic fatty
liver. Dig Dis Sci. 56:2299–2308. 2011. View Article : Google Scholar : PubMed/NCBI
|
|
27
|
Nishida T, Tsuneyama K, Fujimoto M, et al:
Spontaneous onset of nonalcoholic steatohepatitis and
hepatocellular carcinoma in a mouse model of metabolic syndrome.
Lab Invest. 93:230–241. 2013. View Article : Google Scholar : PubMed/NCBI
|
|
28
|
Stanton MC, Chen SC, Jackson JV, et al:
Inflammatory Signals shift from adipose to liver during high fat
feeding and influence the development of steatohepatitis in mice. J
Inflamm (Lond). 8:82011. View Article : Google Scholar : PubMed/NCBI
|
|
29
|
Semaan N, Frenzel L, Alsaleh G, et al:
miR-346 controls release of TNF-α protein and stability of its mRNA
in rheumatoid arthritis via tristetraprolin stabilization. PLoS
ONE. 6:e198272011.PubMed/NCBI
|
|
30
|
Deleault KM, Skinner SJ and Brooks SA:
Tristetraprolin regulates TNF TNF-alpha mRNA stability via a
proteasome dependent mechanism involving the combined action of the
ERK and p38 pathways. Mol Immunol. 45:13–24. 2008. View Article : Google Scholar : PubMed/NCBI
|
|
31
|
Li Z, Chao TC, Chang KY, et al: The long
noncoding RNA THRIL regulates TNFα expression through its
interaction with hnRNPL. Proc Natl Acad Sci USA. 111:1002–1007.
2014.PubMed/NCBI
|
|
32
|
Naito M, Bomsztyk K and Zager RA:
Endotoxin mediates recruitment of RNA polymerase II to target genes
in acute renal failure. J Am Soc Nephrol. 19:1321–1330. 2008.
View Article : Google Scholar : PubMed/NCBI
|
|
33
|
Struhl K: Histone acetylation and
transcriptional regulatory mechanisms. Genes Dev. 12:599–606. 1998.
View Article : Google Scholar : PubMed/NCBI
|
|
34
|
Shebzukhov YV, Horn K, Brazhnik KI,
Drutskaya MS, Kuchmiy AA, Kuprash DV and Nedospasov SA: Dynamic
changes in chromatin conformation at the TNF transcription start
site in T helper lymphocyte subsets. Eur J Immunol. 44:251–264.
2014. View Article : Google Scholar : PubMed/NCBI
|
|
35
|
Miao F, Gonzalo IG, Lanting L and
Natarajan R: In vivo chromatin remodeling events leading to
inflammatory gene transcription under diabetic conditions. J Biol
Chem. 279:18091–18097. 2004. View Article : Google Scholar : PubMed/NCBI
|
|
36
|
Sullivan KE, Reddy ABM, Dietzmann K,
Suriano AR, Kocieda VP, Stewart M and Bhatia M: Epigenetic
regulation of tumor necrosis factor alpha. Mol Cell Biol.
27:5147–5160. 2007. View Article : Google Scholar : PubMed/NCBI
|
|
37
|
Garrett S, Dietzmann-Maurer K, Song L and
Sullivan KE: Polarization of primary human monocytes by IFN-gamma
induces chromatin changes and recruits RNA Pol II to the TNF-alpha
promoter. J Immunol. 180:5257–5266. 2008. View Article : Google Scholar : PubMed/NCBI
|
|
38
|
Falvo JV, Tsytsykova AV and Goldfeld AE:
Transcriptional control of the TNF gene. Current Directions in
Autoimmunity. 11. Kollias G and Sfikakis PP: Karger; Basel: pp.
27–60. 2010, View Article : Google Scholar : PubMed/NCBI
|
|
39
|
Nicodeme E, Jeffrey KL, Schaefer U, et al:
Suppression of inflammation by a synthetic histone mimic. Nature.
468:1119–1123. 2010. View Article : Google Scholar : PubMed/NCBI
|
|
40
|
Wang F, Liu H, Blanton WP, Belkina A,
Lebrasseur NK and Denis GV: Brd2 disruption in mice causes severe
obesity without Type 2 diabetes. Biochem J. 425:71–83. 2010.
View Article : Google Scholar : PubMed/NCBI
|
|
41
|
Wang F, Deeney JT and Denis GV: Brd2 gene
disruption causes ‘metabolically healthy’ obesity: epigenetic and
chromatin-based mechanisms that uncouple obesity from type 2
diabetes. Vitam Horm. 91:49–75. 2013.
|
|
42
|
Belkina AC and Denis GV: BET domain
co-regulators in obesity, inflammation and cancer. Nat Rev Cancer.
12:465–477. 2012. View Article : Google Scholar : PubMed/NCBI
|
|
43
|
Zhang Y and Reinberg D: Transcription
regulation by histone methylation: interplay between different
covalent modifications of the core histone tails. Genes Dev.
15:2343–2360. 2001. View Article : Google Scholar : PubMed/NCBI
|
|
44
|
Shilatifard A: Chromatin modifications by
methylation and ubiquitination: implications in the regulation of
gene expression. Annu Rev Biochem. 75:243–269. 2006. View Article : Google Scholar : PubMed/NCBI
|
|
45
|
Zhang H, Gao L, Anandhakumar J and Gross
DS: Uncoupling transcription from covalent histone modification.
PLoS Genet. 10:e10042022014. View Article : Google Scholar : PubMed/NCBI
|