Introduction
Obesity is characterized by increased lipid storage
in visceral adipose tissue, and is associated with ectopic lipid
deposition in non-adipose tissue, such as the liver and skeletal
muscle. Non-alcoholic fatty liver disease (NAFLD) has emerged as a
growing public health concern worldwide (1) and encompasses a spectrum of
pathological conditions, ranging from simple steatosis to
non-alcoholic steatohepatitis (NASH), resulting from oxidative
stress, lipid peroxidation and increased cytokine production
(2). In NASH, lipids that
accumulate in the liver are derived from circulating fatty acids
(FAs) which occurs due to the insulin resistance-associated
dysregulation of peripheral lipolysis, and de novo
lipogenesis (DNL). During NAFLD, increased mitochondrial FA
oxidation plays a critical role in producing additional adenosine
triphosphate (ATP) needed for DNL and gluconeogenesis (3). This adaption induces an increase in
reactive oxygen species (ROS) production, and further impairs
energy output, which results from a reduction in the mitochondrial
respiratory chain and promotes lipid peroxidation and mitochondrial
DNA (mtDNA) damage (4–7). A progressive loss of mitochondrial
function in conjunction with the transition from insulin resistance
to type 2 diabetes (T2D) likely contributes to the progression of
NAFLD (8). Moreover,
mitochondrial glutathione (GSH) depletion has been reported in
models of alcoholic steatohepatitis/NASH (9). Accordingly, NASH has been described
as a mitochondrial disease (10).
Forkhead box O1 (FoxO1) is a critical mediator of
cellular stress response and has been implicated in numerous
nutrient-regulated processes (11); for example, FoxO1 plays an
important role in controlling the expression of genes involved in
gluconeogenesis in the liver (12,13). In this regard, transgenic mice
expressing a constitutively active FoxO1 allele exhibit insulin
resistance and hepatic steatosis (14), whereas the antisense
oligonucleotide-mediated targeted reduction of FoxO1 in the liver
or adipose tissue has been shown to improve glucose tolerance and
peripheral insulin function in mice with diet-induced obesity (DIO)
(15,16). As regards individuals with obesity
and T2D, studies have documented the reduced ability of insulin to
suppress glucose production and gluconeogenesis, and this effect
was principally driven by the increased activity of
phosphoenolpyruvate carboxykinase (PEPCK) and glucose 6-phosphatase
(G6Pase) (17,18). Thus, the disruption FoxO1 activity
has been demonstrated to improve hepatic and peripheral insulin
sensitivity, and subsequently reduce fasting glucose levels in
obese or diabetic mice (13,19). In addition, FoxO1 mediates the
effects of insulin on triglyceride (TG) metabolism. A previous
study suggested that the overexpression of FoxO1 in mouse livers
contributes to the progression of hepatic steatosis through
increased TG accumulation and decreased FA oxidation (14). Haeusler et al also
demonstrated that hepatic FoxO1 ablation exacerbated lipid
abnormalities during hyperglycemia (20). Furthermore, abnormal morphology,
function and the biogenesis of mitochondria have been observed in
the livers of insulin receptor substrate (IRS)-1/2 double-knockout
mice (21), in association with
the increased expression of FoxO1. In addition, the expression of
mitochondrial genes was partially restored to normal levels upon
the deletion of FoxO1 (21).
The endocannabinoid system, consisting of the
cannabinoid receptor, endogenous cannabinoid ligands and their
biosynthetic and degradative enzymes, has emerged as an ubiquitous
system with key functions in various physiological settings.
Cannabinoid receptor type 1 (CB1R) is widely distributed in the
brain (22), and also exists
peripherally, including in the liver tissue (23). The dysregulation of CB1R-mediated
pathways is the major determinant in several key aspects of liver
pathogenesis. Osei-Hyiaman et al reported that increases in
hepatic CB1R density and basal rates of FA synthesis were observed
in mice with DIO (23), which
further contributes to liver steatosis, dyslipidemia, insulin
resistance and leptin resistance (24), and is partially reversed by the
antagonism of or a genetic deficiency of CB1R (23,24). In this regard, the mechanisms of
the endoplasmic reticulum (ER) stress-dependent increase in
ceramide synthesis and cyclic AMP response element-binding protein
H (CREBH)-mediated Lipin 1 gene expression, were portrayed as
playing a key role in diet-induced, CB1R-mediated hepatic insulin
resistance in vivo (25,26). Furthermore, a consumption of a
high-fat diet (HFD) has been shown to induce hepatic insulin
resistance in mice through the CB1R-mediated inhibition of insulin
signaling and clearance (27).
Despite concerns regarding the neuropsychiatric side-effects of
brain-penetrant CB1R antagonists, the selective targeting of
peripheral CB1Rs is of potential value to the management of
obesity-related metabolic abnormalities without causing behavioral
effects (28,29). A previous study reported that CB1R
stimulation decreased mitochondrial biogenesis in white adipo-cytes
and impaired mitochondria in the metabolically-active tissue of
dietary obese mice fed a HFD (30). Thus, the present study aimed to
investigate whether FoxO1 plays a pivotal role in CB1R-mediated
insulin resistance through the dysregulation of mitochondrial
function in the livers of with DIO.
Materials and methods
Animals
A total of 50 male C57BL/6 mice (3–4 weeks old,
weighing 15.2±3.7 gm) were purchased from the National Laboratory
Animal Center (Taipei, Taiwan) and housed in a
temperature-controlled environment (20±2°C) under a 12-h light/dark
cycle. The mice were fed either a standard diet (STD; 13.5%
calories from fat, LabDiet 5001; LabDiet, St. Louis, MO, USA) or a
HFD (60% calories from fat, TestDiet 58G9; TestDiet, St. Louis, MO,
USA) ad libitum for 12 weeks. The HFD-fed mice were then
randomly divided into 3 subgroups, to receive once daily
intraperitoneal (i.p.) injections of the vehicle (7.7% DMSO, 4.6%
Tween-80, 87.7% saline), or 1 or 5 mg/kg body weight of the CB1R
inverse agonist, AM251, for 7 days. The mice were weighed in
conscious state by using an electric balance at the start of the
experiment, prior to the administration of AM251, and prior to
sacrifice. At the end of the 13th week, the mice were fasted for 12
h and anesthetized by CO2 inhalation prior to
decapitation. Blood samples were collected for determining the
biochemical parameters, and liver tissues were exsanguinated and
frozen immediately in liquid nitrogen and stored at −80°C for
further analysis. All animal experimental protocols were approved
by the Institutional Animal Care and Use Committee of Taipei
Veterans General Hospital (Taipei, Taiwan).
Cell culture and preparation of medium
containing a high concentration of long-chain free fatty acids
(HFFA)
Mouse AML12 hepatocyte-derived cells were obtained
from the Food Industry Research and Development Institute (Hsinchu,
Taiwan). The AML12 cells were grown in a 1:1 mixture of Dulbecco's
modified Eagle's medium (DMEM)/F12 medium (Gibco, Grand Island, NY,
USA) containing 10% fetal bovine serum (FBS), 5 µg/ml
insulin, 5 µg/ml transferrin, 5 ng/ml selenium and 40 ng/ml
dexamethasone, and maintained at 37°C in a humidified environment
with 5% CO2/95% air atmosphere. In addition, HFFA medium
was prepared according to the method described in the study by
Kohli et al (31) with
slight modifications. Briefly, HFFA medium was prepared by the
addition of 2:1 oleate/palmitate mixture to pre-warmed culture
medium (37°C), followed by the addition of fatty acid-free BSA (at
5:1 molar ratio) and then gently mixing for 8 h at room
temperature. For the ACEA medium, 1.0 mM ACEA prepared in DMSO was
serial diluted and added to the culture medium to the final
concentrations at 1.0, 0.1 or 0.01 µM.
Histopathological analysis
For hematoxylin and eosin (H&E) staining, liver
tissue was fixed in 4% paraformaldehyde, embedded in paraffin, cut
into 5-µm-thick sections, and stained with H&E, followed
by microscopic examination. For CB1R immunohistochemistry (IHC),
the slides were deparaffinized and hydrated with ethanol, then
sequentially incubated in 0.3% H2O2 to block
endogenous peroxidase activity, a specific rabbit anti-human CB1R
antibody (ALX-215-055; Enzo Life Sciences, Inc., Plymouth Meeting,
PA, USA) for 2 h at room temperature, and a biotinylated secondary
antibody (goat anti-rabbit, #31460; Thermo Fisher Scientific,
Rockford, IL, USA) and avidin-biotin complex (ABC) reagent (Zymed
Laboratories, San Francisco, CA, USA). Finally, color development
was induced by 3,3′-diaminobenzidine (DAB) for 15 min and
visualized under a light microscope (XI71, Olympus, Tokyo,
Japan).
Plasma biochemical parameters
The plasma glucose level was assayed using a glucose
analyzer (YSI 2300 STAT Plus; YSI Life Sciences, Yellow Springs,
OH, USA), and the plasma insulin level was measured using a
commercial enzyme-linked immunosorbent assay (ELISA) kit (Millipore
Corp., Billerica, MA, USA). The plasma levels of alanine
transaminase (ALT), aspartate transaminase (AST), TG, free FAs and
cholesterol were determined using colorimetric methods according to
the manufacturer's instructions. The homeostatic model assessment
of insulin resistance (HOMA-IR) index was calculated using the
following formula: fasting insulin levels (µU/ml) × fasting
glucose levels (mmol/l)/22.5.
Reverse transcription-quantitative
(real-time) polymerase chain reaction (RT-qPCR)
Total RNA was extracted from the liver tissues using
the guanidinium-phenol-chloroform extraction method, and the
concentration and integrity of the isolated RNA were determined at
OD 260/280. Total RNA (5 µg) was reverse-transcribed into
cDNA using the RevertAid™ First Strand cDNA Synthesis kit (Thermo
Fisher Scientific, Waltham, MA, USA), followed by conducting qPCR
using the SYBR system on a LightCycler 1.5 apparatus (both from
Roche Applied Science, Mannheim, Germany). The PCR reaction was
performed under the following conditions: 95°C for 10 min and then
45 cycles of 95°C for 15 sec, 57°C for 30 sec and 72°C for 30 sec.
The PCR data were normalized to GAPDH expression as an internal
control. The sequences of primers used for RT-qPCR are listed in
Table I.
 | Table ISequences of primers used for
RT-qPCR. |
Table I
Sequences of primers used for
RT-qPCR.
| Gene | Primer
sequences |
|---|
| CB1R | F:
5′-CTACTGGTGCTGTGTGTCATC-3′ |
| R:
5′-GCTGTCTTTACGGTGGAATAC-3′ |
| FoxO1 | F:
5′-AGATGAGTGCCCTGGGCAGC-3′ |
| R:
5′-GATGGACTCCATGTCACAGT-3′ |
| CPT-1 | F:
5′-TGAGTGGCGTCCTCTTTGG-3′ |
| R:
5′-CAGCGAGTAGCGCATAGTCA-3′ |
| PGC-1α | F:
5′-GACTCAGTGTCACCACCGAAA-3′ |
| R:
5′-TGAACGAGCGCATCCTT-3′ |
| TFAM | F:
5′-GGAATGTGGAGCGTGCTAAA-3′ |
| R:
5′-TGCTGGAAAAACACTTCGGAATA-3′ |
| NRF-1 | F:
5′-CGCAGCACCTTTGGAGAA-3′ |
| R:
5′-CCCGACCTGTGGAATACTTG-3′ |
| NRF-2 | F:
5′-ATGGATTTGATTGACATCCTT-3′ |
| R:
5′-CATGTTTTTCTTTGTATCTGG-3′ |
| Citrate
synthase | F:
5′-GCCATCACAGCCCTCAAC-3′ |
| R:
5′-GCAATCAGGTCCATACAGTCTTC-3′ |
| PEPCK | F:
5′-AGCCTGCTCCAGCTTTGA-3′ |
| R:
5′-CCCTAGCCTGTTCTCTGTGC-3′ |
| G6Pase | F:
5′-TGCTGTGTCTGGTAGGCAAC-3′ |
| R:
5′-AGAATCCTGGGTCTCCTTGC-3′ |
| GAPDH | F:
5′-TCACCACCATGGAGAAGGC-3′ |
| R:
5′-GCTAAGCAGTTGGTGGTGCA-3′ |
| mtDNA | F:
5′-AACTCAAAGGACTTGGCGGTACTTTATATC-3′ |
| R:
5′-GATGGCGGTATATAGGCTGAATTAGCAAGAG-3′ |
| 28S | F:
5′-GGCGGCCAAGCGTTCATAC-3′ |
| R:
5′-AGGCGTTCAGTCATAATCCCACAG-3′ |
Immunoprecipitation and western blot
analysis
The liver tissues were homogenized in ice-cold lysis
buffer [50 mM Tris-HCl (pH 7.4), 100 µM EDTA, 100 µM
EGTA, 12 mM 2-mercaptoethanol, 1% phosphatase inhibitor cocktail 2,
and protease inhibitor cocktail], followed by centrifugation at
13,000 × g for 30 min at 4°C to harvest the protein lysates. For
immunoprecipitation, an equal concentration of protein lysate was
conjugated with anti-IRS-2 antibody at 4°C for 1 h and
immunoprecipitated using Protein G PLUS-Agarose (both from Santa
Cruz Biotechnology, Inc., Santa Cruz, CA, USA) and gently shaken
for 12 h at 4°C. The protein lysates were separated using SDS-PAGE
and transferred onto PVDF membranes. The membranes were blocked
with 5% non-fat milk in TBS-T buffer for 1 h at room temperature,
and incubated overnight at 4°C with various primary antibodies
including CB1R (Enzo Life Sciences, Inc.), phosphorylated (p)-FoxO1
(#9461), FoxO1 (#2880), glutathione S-transferase (GST; #2624) (all
from Cell Signaling Technology, Inc., Beverly, MA, USA) and IRS-2
(#8299), p-Tyr (#7020), AKT (#8312), p-AKT (#7985-R), PI3K
(#71891), p-PI3K (#293115), PEPCK (#166778), G6Pase-α (#25840, all
from Santa Cruz Biotechnology, Inc.). The membranes were
subsequently incubated with secondary antibodies (#31430 or #31460;
Thermo Fisher Scientific, Rockford, IL, USA) for 1 h at room
temperature. The signals were detected using an enhanced
chemiluminescence kit (Millipore Corp.), and quantified using
ImageQuant 5.2 software, and calibrated using β-actin as an
internal control.
Mitochondrial DNA and ATP assay
The mtDNA copy number was determined by qPCR, as
previously described by Tedesco et al (32). Briefly, genomic DNA was isolated
from the liver tissue using the DNA extraction kit (Promega Corp.,
Madison, WI, USA). qPCR was conducted using the SYBR system on a
LightCycler 1.5 apparatus. The ratio of mtDNA to nuclear DNA and
mtDNA was reflected in the mitochondria concentration. The primer
sequences of mtDNA and nuclear DNA are listed in Table I. For the ATP assay, the ATP
content of the liver tissues was measured using the ATP
Bioluminescence Assay kit HS II (Roche Applied Science) according
to the manufacturer's instructions. The luminescence value was
normalized by the protein concentration and the differences among
groups were compared.
Liver lipid peroxidation, superoxide
dismutase (SOD) and GSH assays
A lipid peroxidation assay was performed by
measuring the production rate of thiobarbituric acid-reactive
substances (TBARS) and expressed as malondialdehyde (MDA)
equivalents. The amount of MDA was assessed by measuring the OD535
nm at 37°C and the results were expressed as nmol/mg protein. The
SOD and GSH levels in the liver samples were measured using the
Superoxide Dismutase Assay kit and the Glutathione Assay kit
(Cayman Chemical Co., Ann Arbor, MI, USA), respectively, according
to the manufacturer's instructions.
Gene silencing with small interfering RNA
(siRNA) against FoxO1
The FoxO1 gene was silenced using Dharmacon™ siRNA
(GE Dharmacon, Lafayette, CO, USA) according to the manufacturer's
instructions. The siRNA duplex nucleotides were designed for the
specific silencing of FoxO1 (5′-GGUGUCAGGCUAAGAGUUA-3′) or
scrambled control (5′-GGUGUCGGACUAAGAGUUA-3′). The cells were
transfected using DharmaFECT 1 transfection reagent combined with
either 100 nM FoxO1 or scrambled control siRNA duplex in DMEM/F12
culture medium without antibiotics. After 72 h, the cells were
treated with medium containing HFFA or
arachidonyl-2′-chloroethylamide (ACEA; a selective CB1R agonist)
and harvested for gene expression analysis. For other experimental
conditions, 100 µM c-AMP/500 nM dexamethasone (c-AMP/Dex)
and 10−7 M insulin were applied to evaluate the typical
physiological response of the cells and the effects on PEPCK and
G6Pase as reported previously (33).
Statistical analysis
Data are expressed as the means ± SEM of at least 3
independent measurements and compared using the Student's t-test. A
value of P<0.05 was considered to indicate a statistically
significant difference. Comparisons among groups were performed
using one-way analysis of variance (ANOVA), followed by multiple
comparison procedures used to identify significant differences
among groups. The physical parameters were analyzed using one-way
ANOVA, and subsequent Tukey's post hoc tests for multiple
comparisons were conducted.
Results
Effects of AM251 on body weight, liver
weight and plasma biochemical parameters
The HFD-fed mice exhibited a significant increase in
body weight and in the plasma levels of TG, FFAs, glucose and
insulin, which resulted in a higher HOMA-IR index value compared
with that of the STD-fed (control) mice (Table II). However, an increasing trend
in plasma cholesterol, ALT and AST levels, as well as liver weight
was observed in the HFD-fed mice. The blockade of the cannabinoid
receptor by treatment with 5 mg/kg AM251, but not 1 mg/kg,
significantly reduced body weight and suppressed the elevated
levels of TG, glucose and the HOMA-IR index in HFD-fed mice;
however, the magnitude of suppression did not reach the levels
observed in the STD-fed mice.
| Table IIEffects of AM251 on physical
parameters in HFD-fed mice. |
Table II
Effects of AM251 on physical
parameters in HFD-fed mice.
| STD | HFD | HFD + AM251 1
mg/kg | HFD + AM251 5
mg/kg |
|---|
| Body weight
(g) |
25.87±4.39a |
43.13±5.54b |
37.53±8.54b |
31.88±7.84a |
| Liver weight
(g) |
1.38±0.32a |
2.08±0.23a |
1.99±0.85a |
1.66±0.49a |
| Plasma TG
(mg/dl) |
81.73±5.64a |
129.35±12.36b |
127.37±16.35b |
102.46±9.87c |
| Plasma FFAs
(mmol/l) |
0.34±0.08a |
0.49±0.12b |
0.45±0.17b |
0.42±0.18b |
| Plasma cholesterol
(mg/dl) |
73.38±10.64a |
90.35±19.03a |
93.86±20.14a |
87.63±16.73a |
| Plasma glucose
(mmol/l) |
2.13±0.19a |
4.42±0.33b |
3.92±0.22b |
2.88±0.27c |
| Plasma insulin
(µU/ml) |
12.63±1.27a |
25.36±4.23b |
22.48±5.34b |
18.83±3.87b |
| HOMA-IR index |
1.20±0.01a |
4.98±0.06b |
3.91±0.05b |
2.41±0.05c |
| ALT (U/l) |
57.16±8.09a |
65.27±9.34a |
68.13±8.15a |
58.36±8.37a |
| AST (U/l) |
81.16±5.19a |
95.27±15.82a |
97.96±12.42a |
98.36±9.73a |
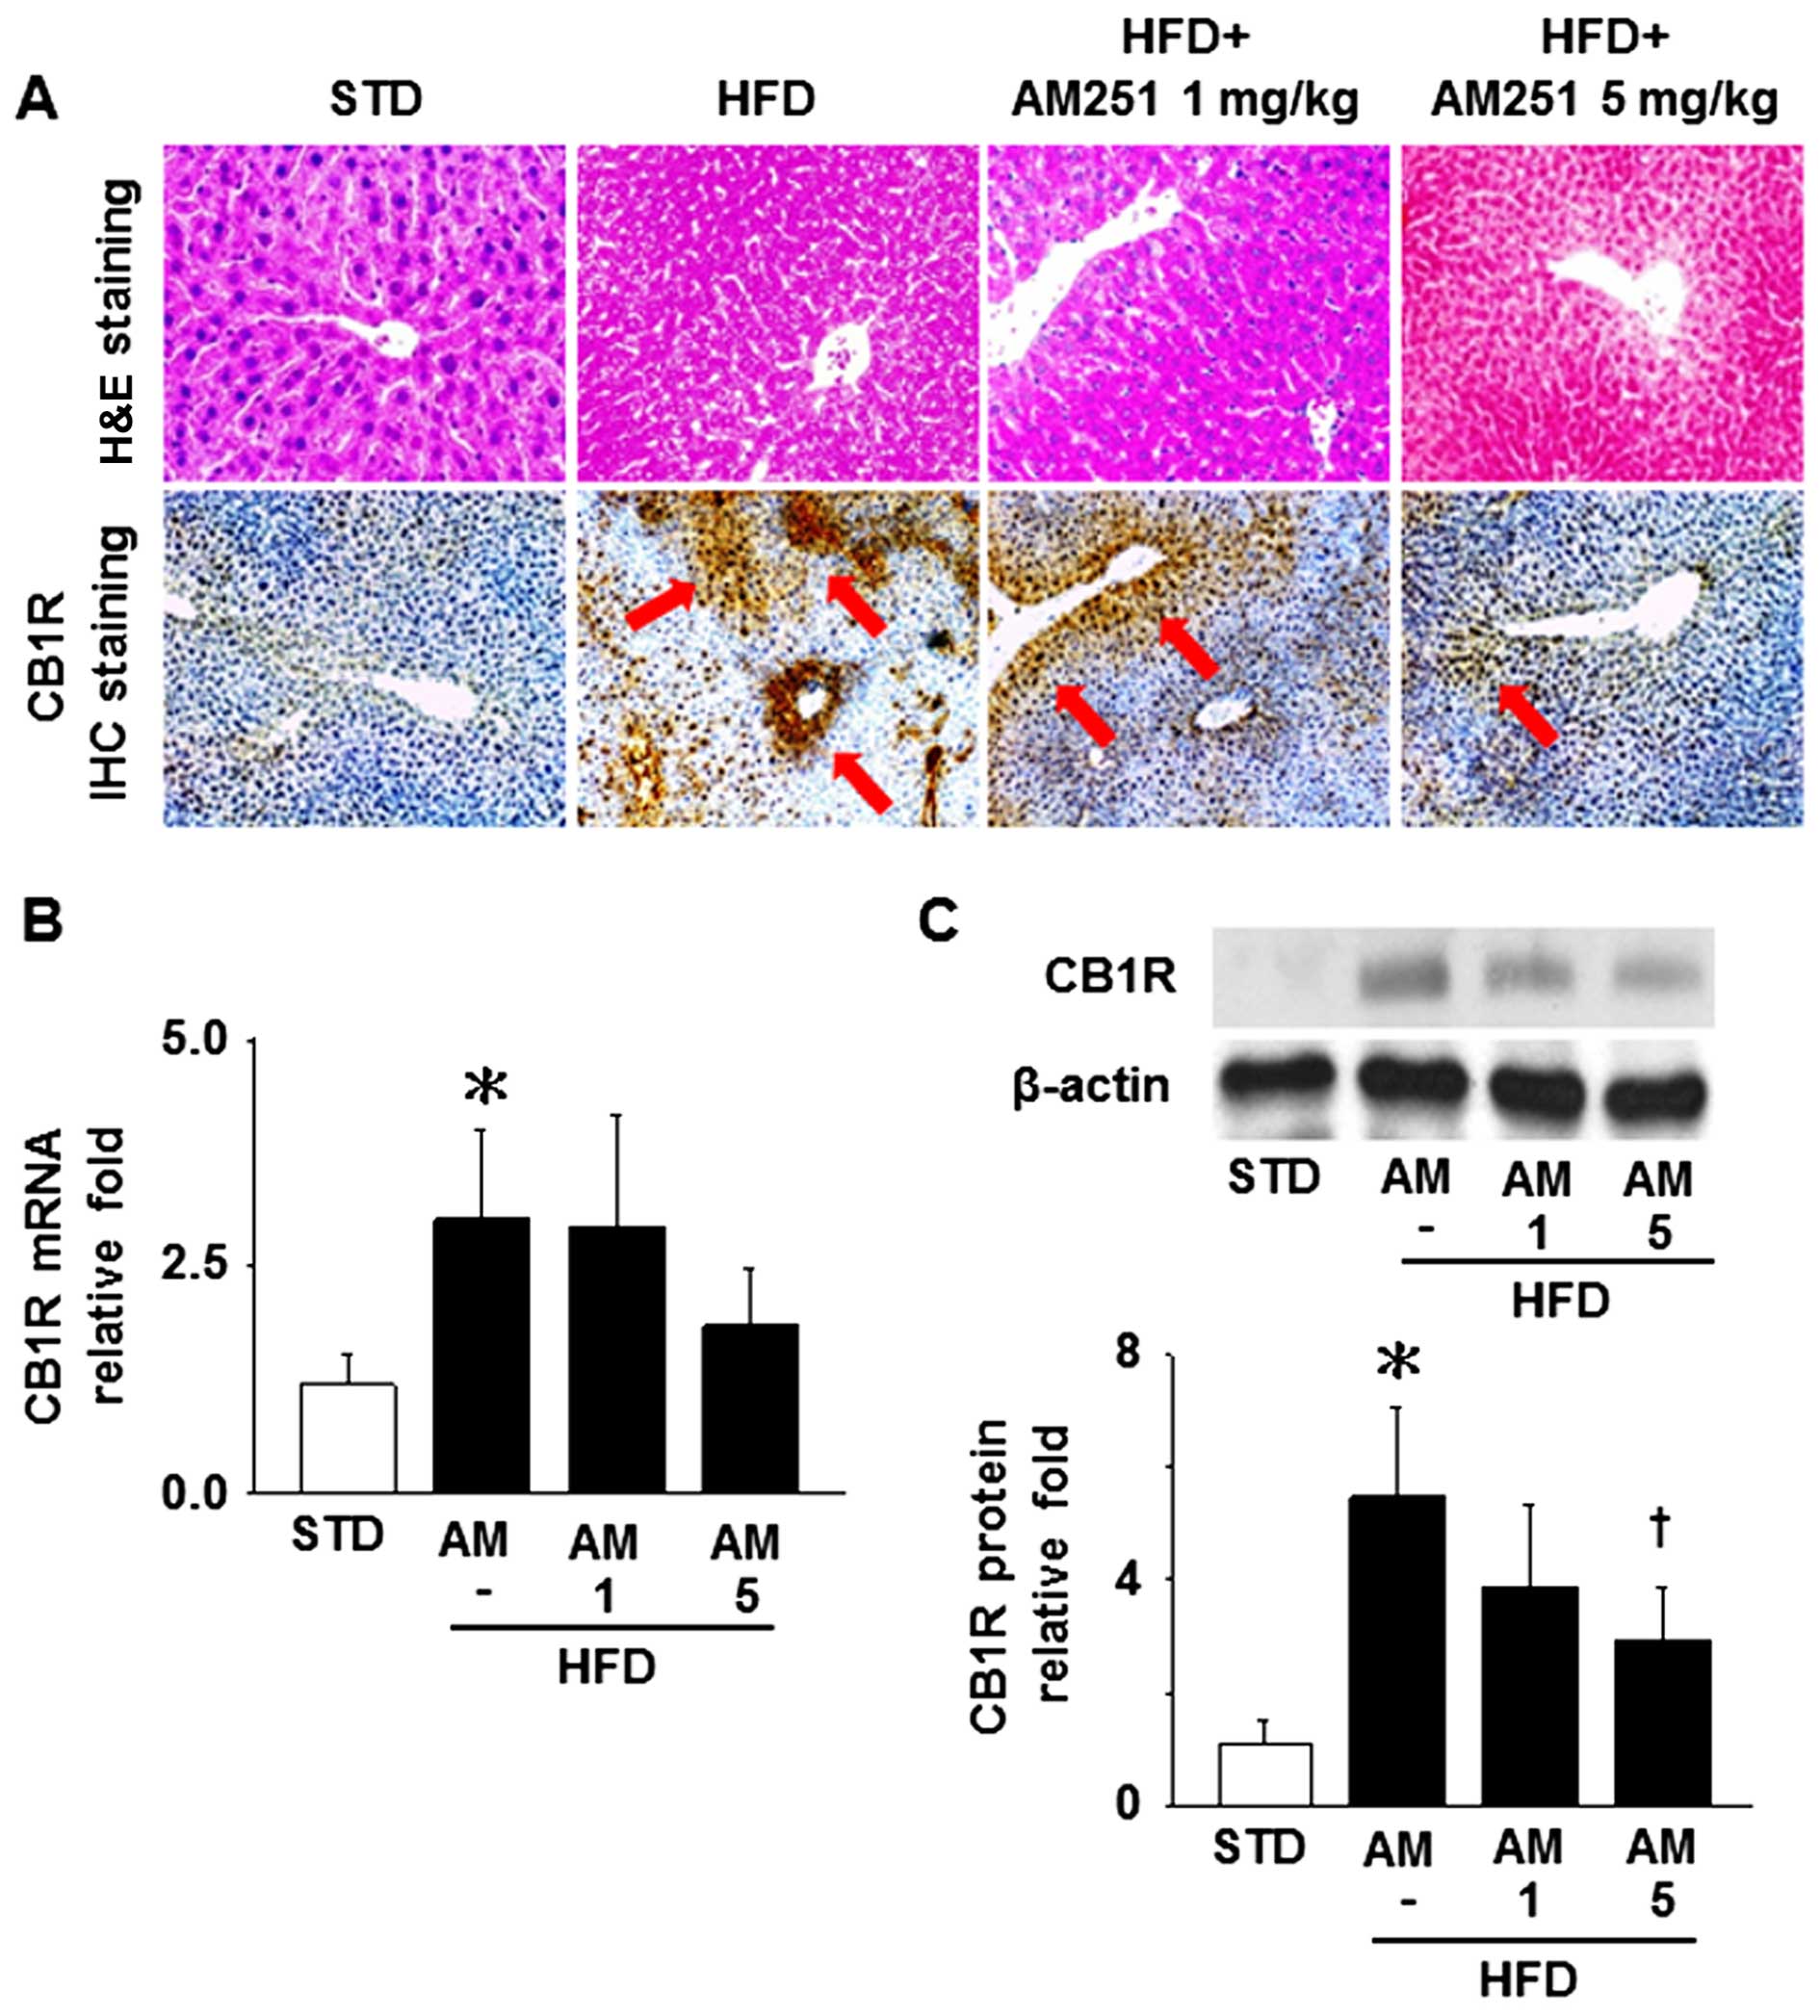
Effects of AM251 on histopathological
changes and CB1R levels in liver tissue
The results of H&E staining of the liver tissue
samples indicated that fatty degeneration and piecemeal necrosis of
hepatocytes were more obvious in the HFD-fed mice than in the
STD-fed mice, and these phenomena were reversed by treatment with 5
mg/kg AM251 (Fig. 1A, upper
panels). IHC staining revealed that the administration of 5 mg/kg
AM251 also decreased the hepatic CB1R content in the HFD-fed mice
(Fig. 1A, lower panels; arrows
depict the sites of CB1R expression). In addition, the mRNA and
protein expression levels of CB1R were significantly increased in
the liver tissues isolated from the HFD-fed mice; however, only the
protein levels were significantly decreased by treatment with AM251
at a dose of 5 mg/kg (Fig. 1B and
C).
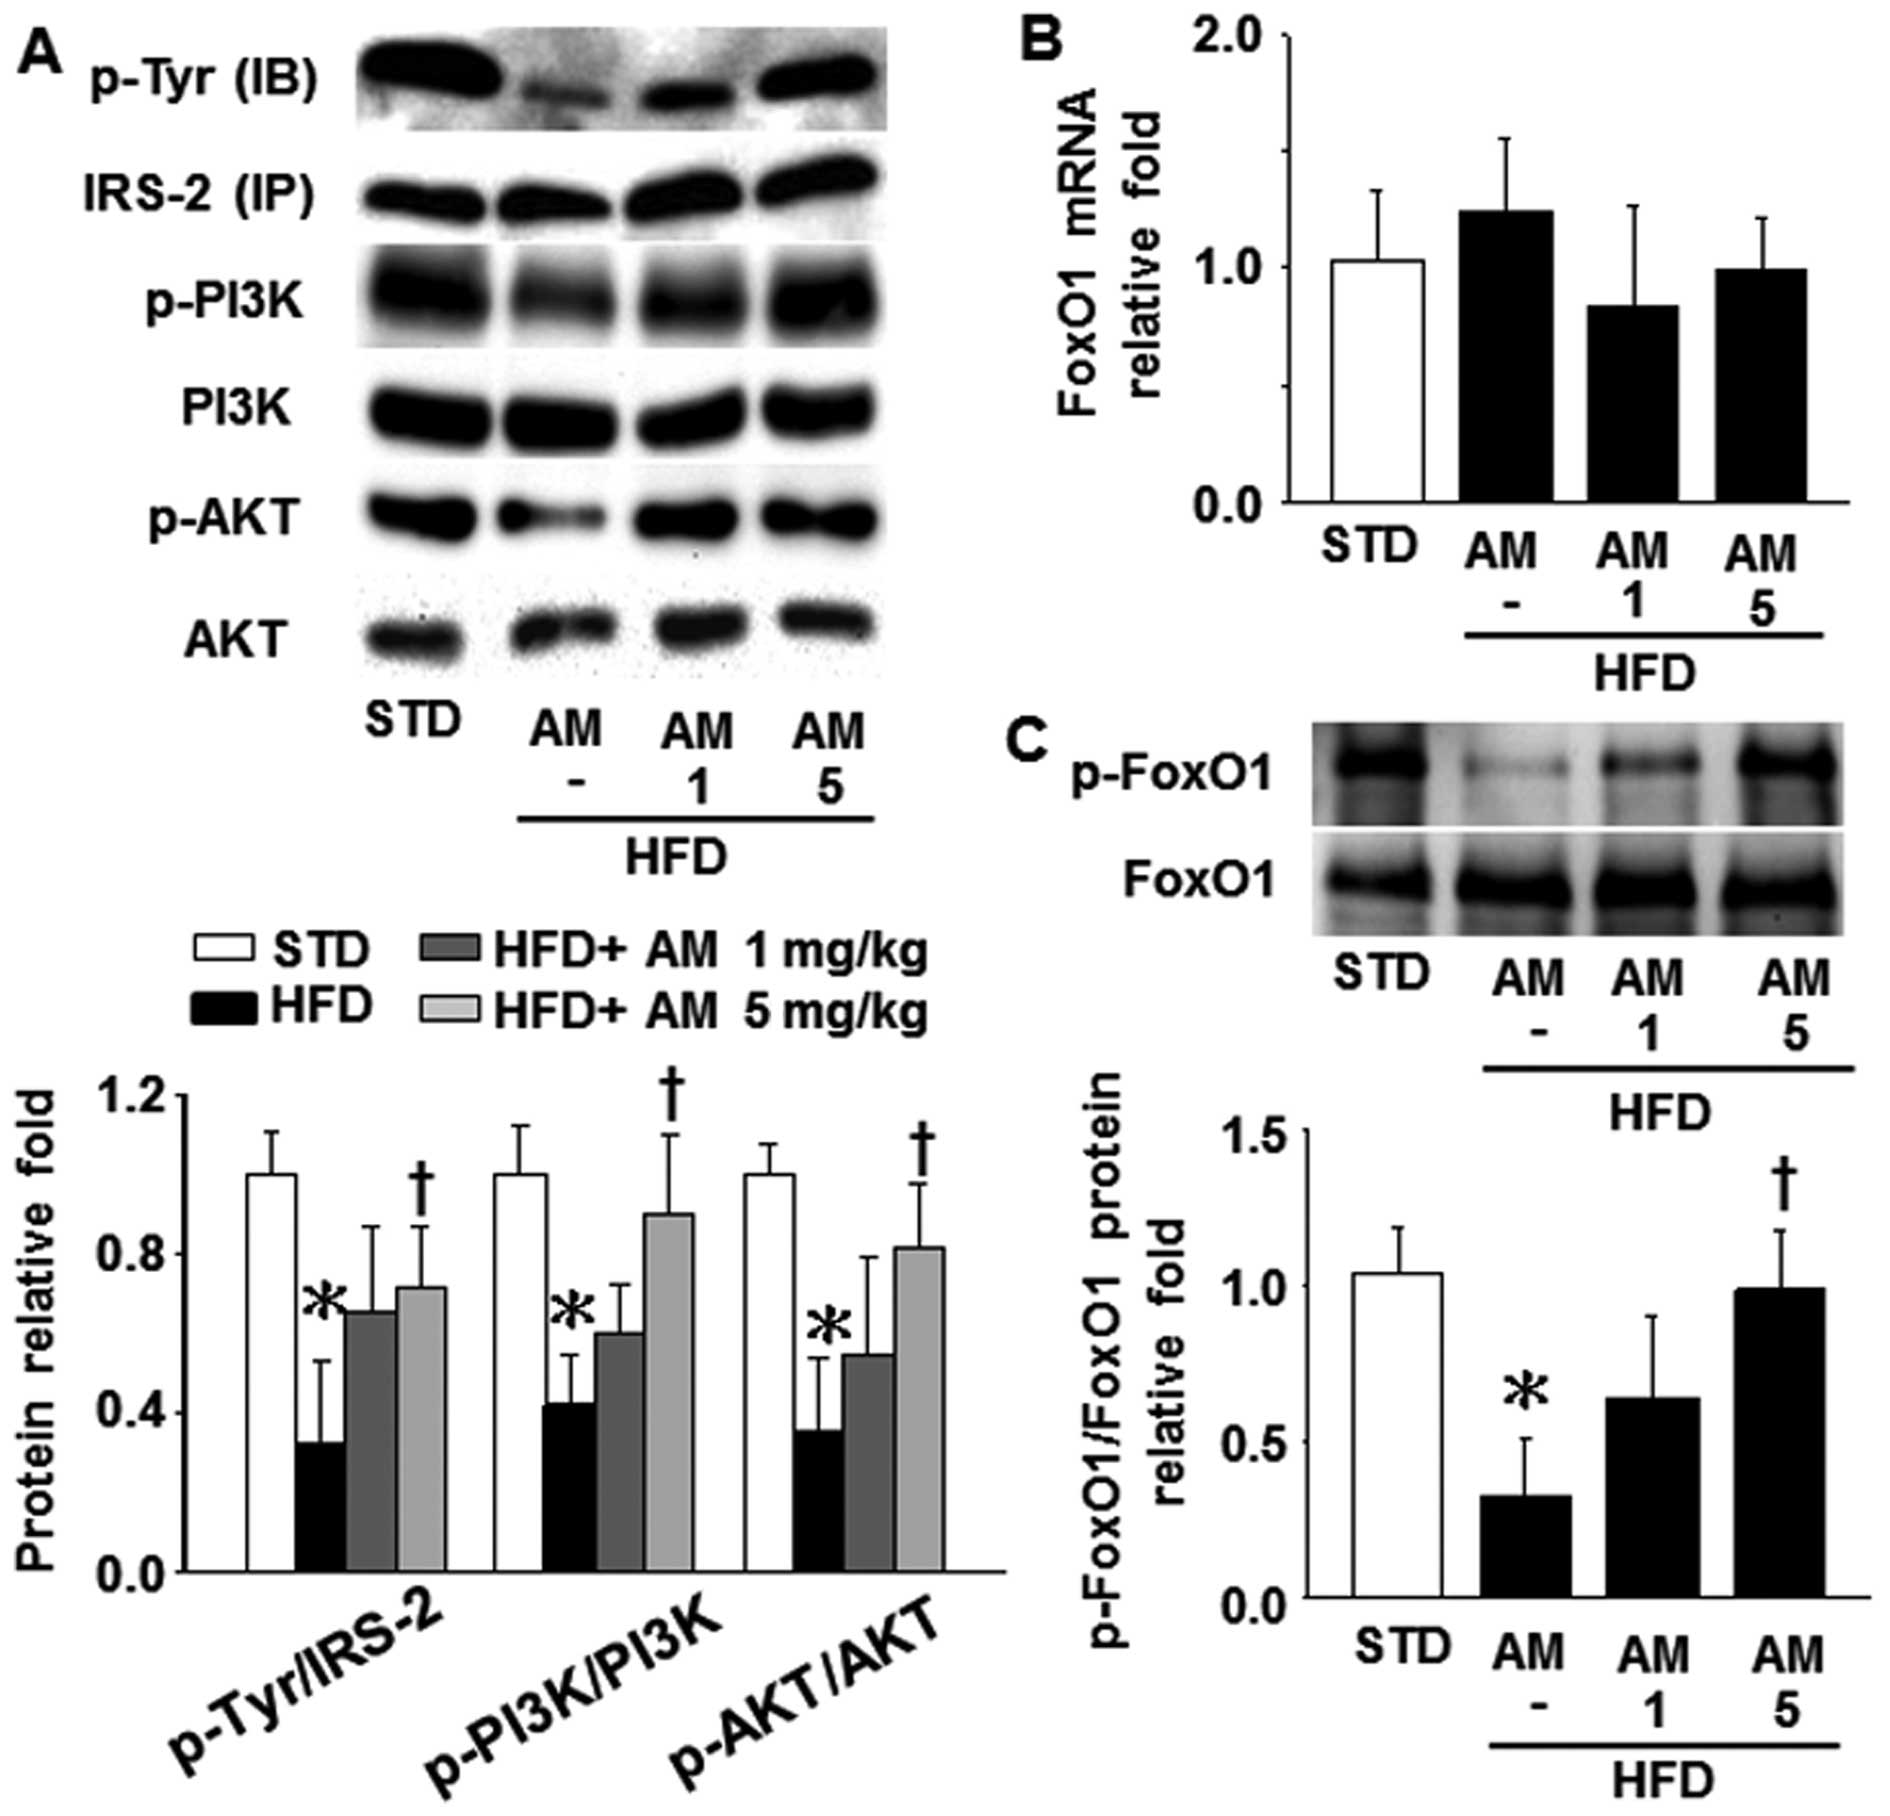
Effect of AM251 on insulin signaling and
FoxO1 activity in liver tissue
A previous study indicated that reducing FoxO1
expression in the liver using an antisense oligonucleotide-mediated
approach improved glucose tolerance and insulin resistance in obese
mice (13). Thus, in this study,
we wished to examine whether a possible association exists between
hepatic CB1R expression and FoxO1 activity in HFD-fed mice. As
shown in Fig. 2A, treatment with
5 mg/kg AM251 significantly upregulated the levels of hepatic
IRS-2, PI3K and AKT phosphorylation in the mice which had been
reduced due to a HFD. In parallel, the FoxO1 phosphorylation levels
decreased and increased in the livers of the HFD-fed mice in the
presence and absence of AM251, respectively (Fig. 2C), although the FoxO1 mRNA level
did not differ significantly among these 4 groups (STD, HFD, HFD
plus 1 mg/kg AM251 and HFD plus 5 mg/kg AM251; Fig. 2B). These results suggest that CB1R
partially influences FoxO1 activity by suppressing the insulin
signaling pathway in mice fed a HFD.
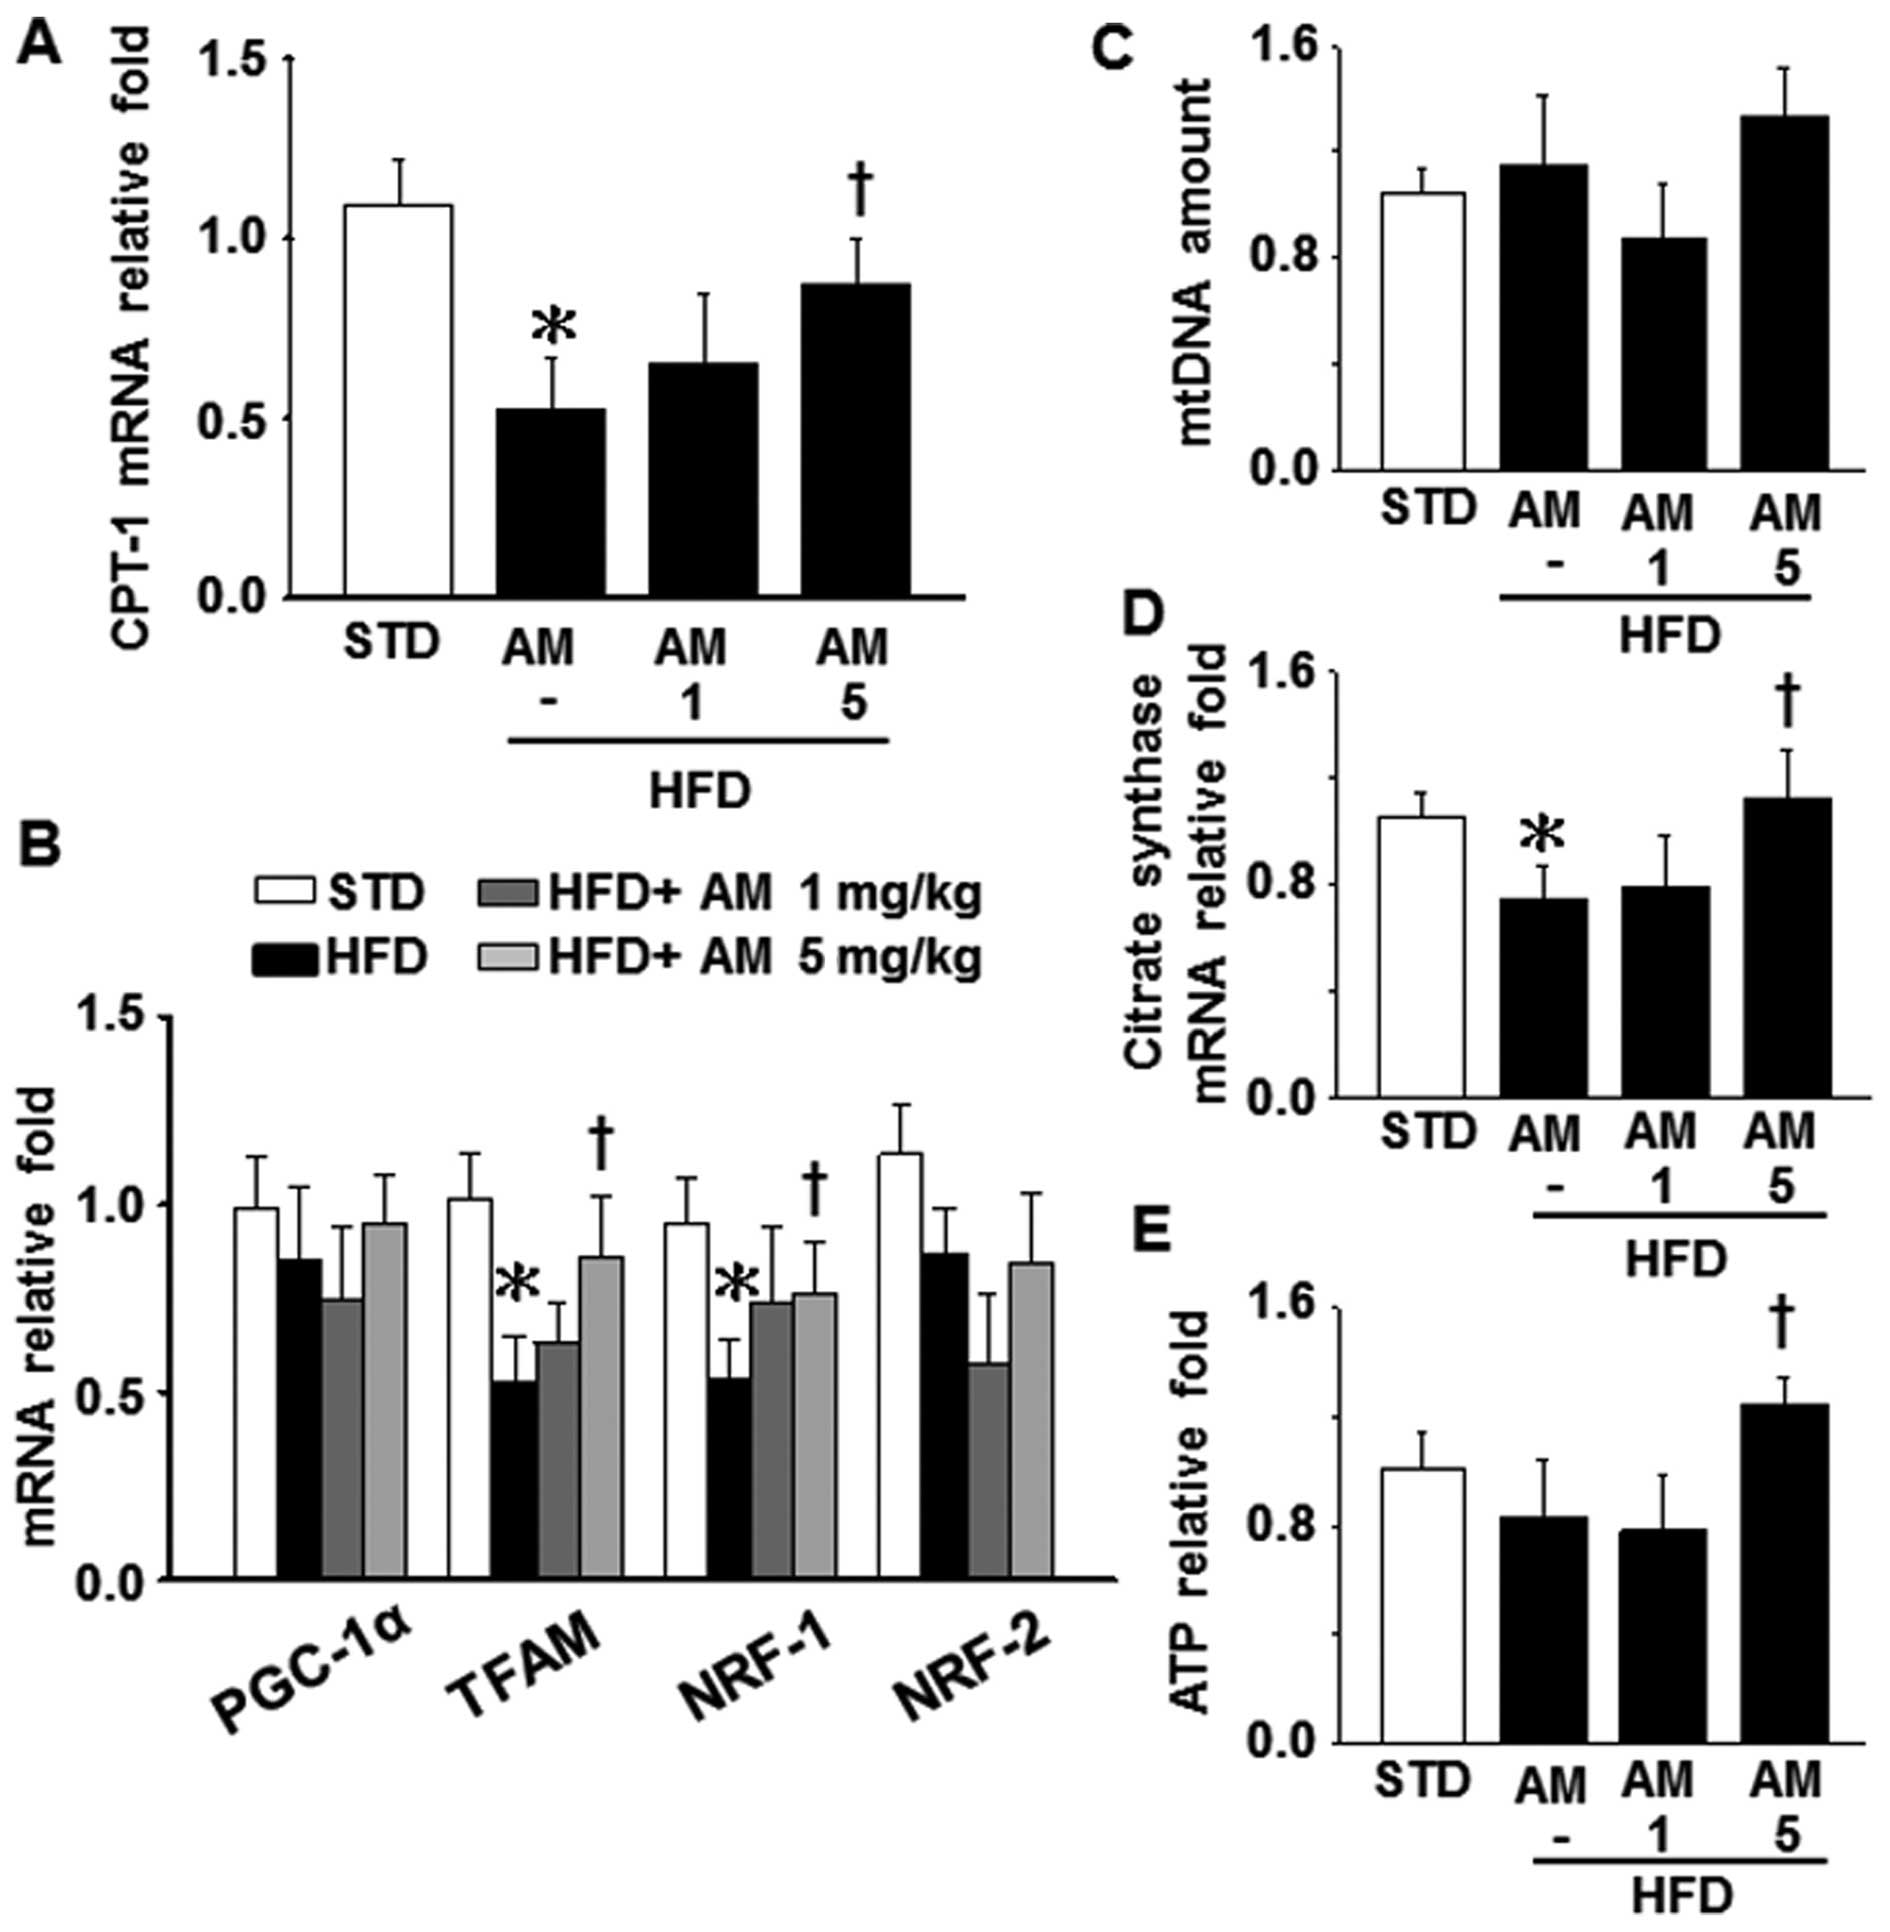
Effects of AM251 on mitochondrial
dysfunction and oxidative stress in liver tissue
Our results indicated that the mRNA levels of
carnitine palmitoyltransferase-1 (CPT-1, a mitochondrial enzyme
responsible for FA β-oxidation), mitochondrial biogenesis-related
factors, such as mitochondrial transcription factor A (TFAM) and
nuclear respiratory factor-1 (NRF-1), as well as citrate synthase
(a pace-making enzyme of the Krebs cycle) in the liver tissue were
markedly decreased in the mice fed a HFD compared to the mice fed a
STD (control); however, this effect was attenuated by treatment
with 5 mg/kg AM251 (Fig. 3A, B and
D). However, no statistically significant difference was
observed in the levels of peroxisome proliferator-activated
receptor γ co-activator-1α (PGC-1α) and NRF-2, two other factors
controlling mitochondrial biogenesis, as well as in the mtDNA copy
number, among these 4 groups (STD, HFD, HFD plus 1 mg/kg AM251 and
HFD plus 5 mg/kg AM251; Fig. 3B and
C). The hepatic ATP level in the HFD-fed mice that were
administered 5 mg/kg AM251 was higher than that in the HFD-fed mice
not administered AM251; however, the ATP level did not decrease
significantly in the untreated HFD-fed mice compared with the
STD-fed mice (Fig. 3E). In
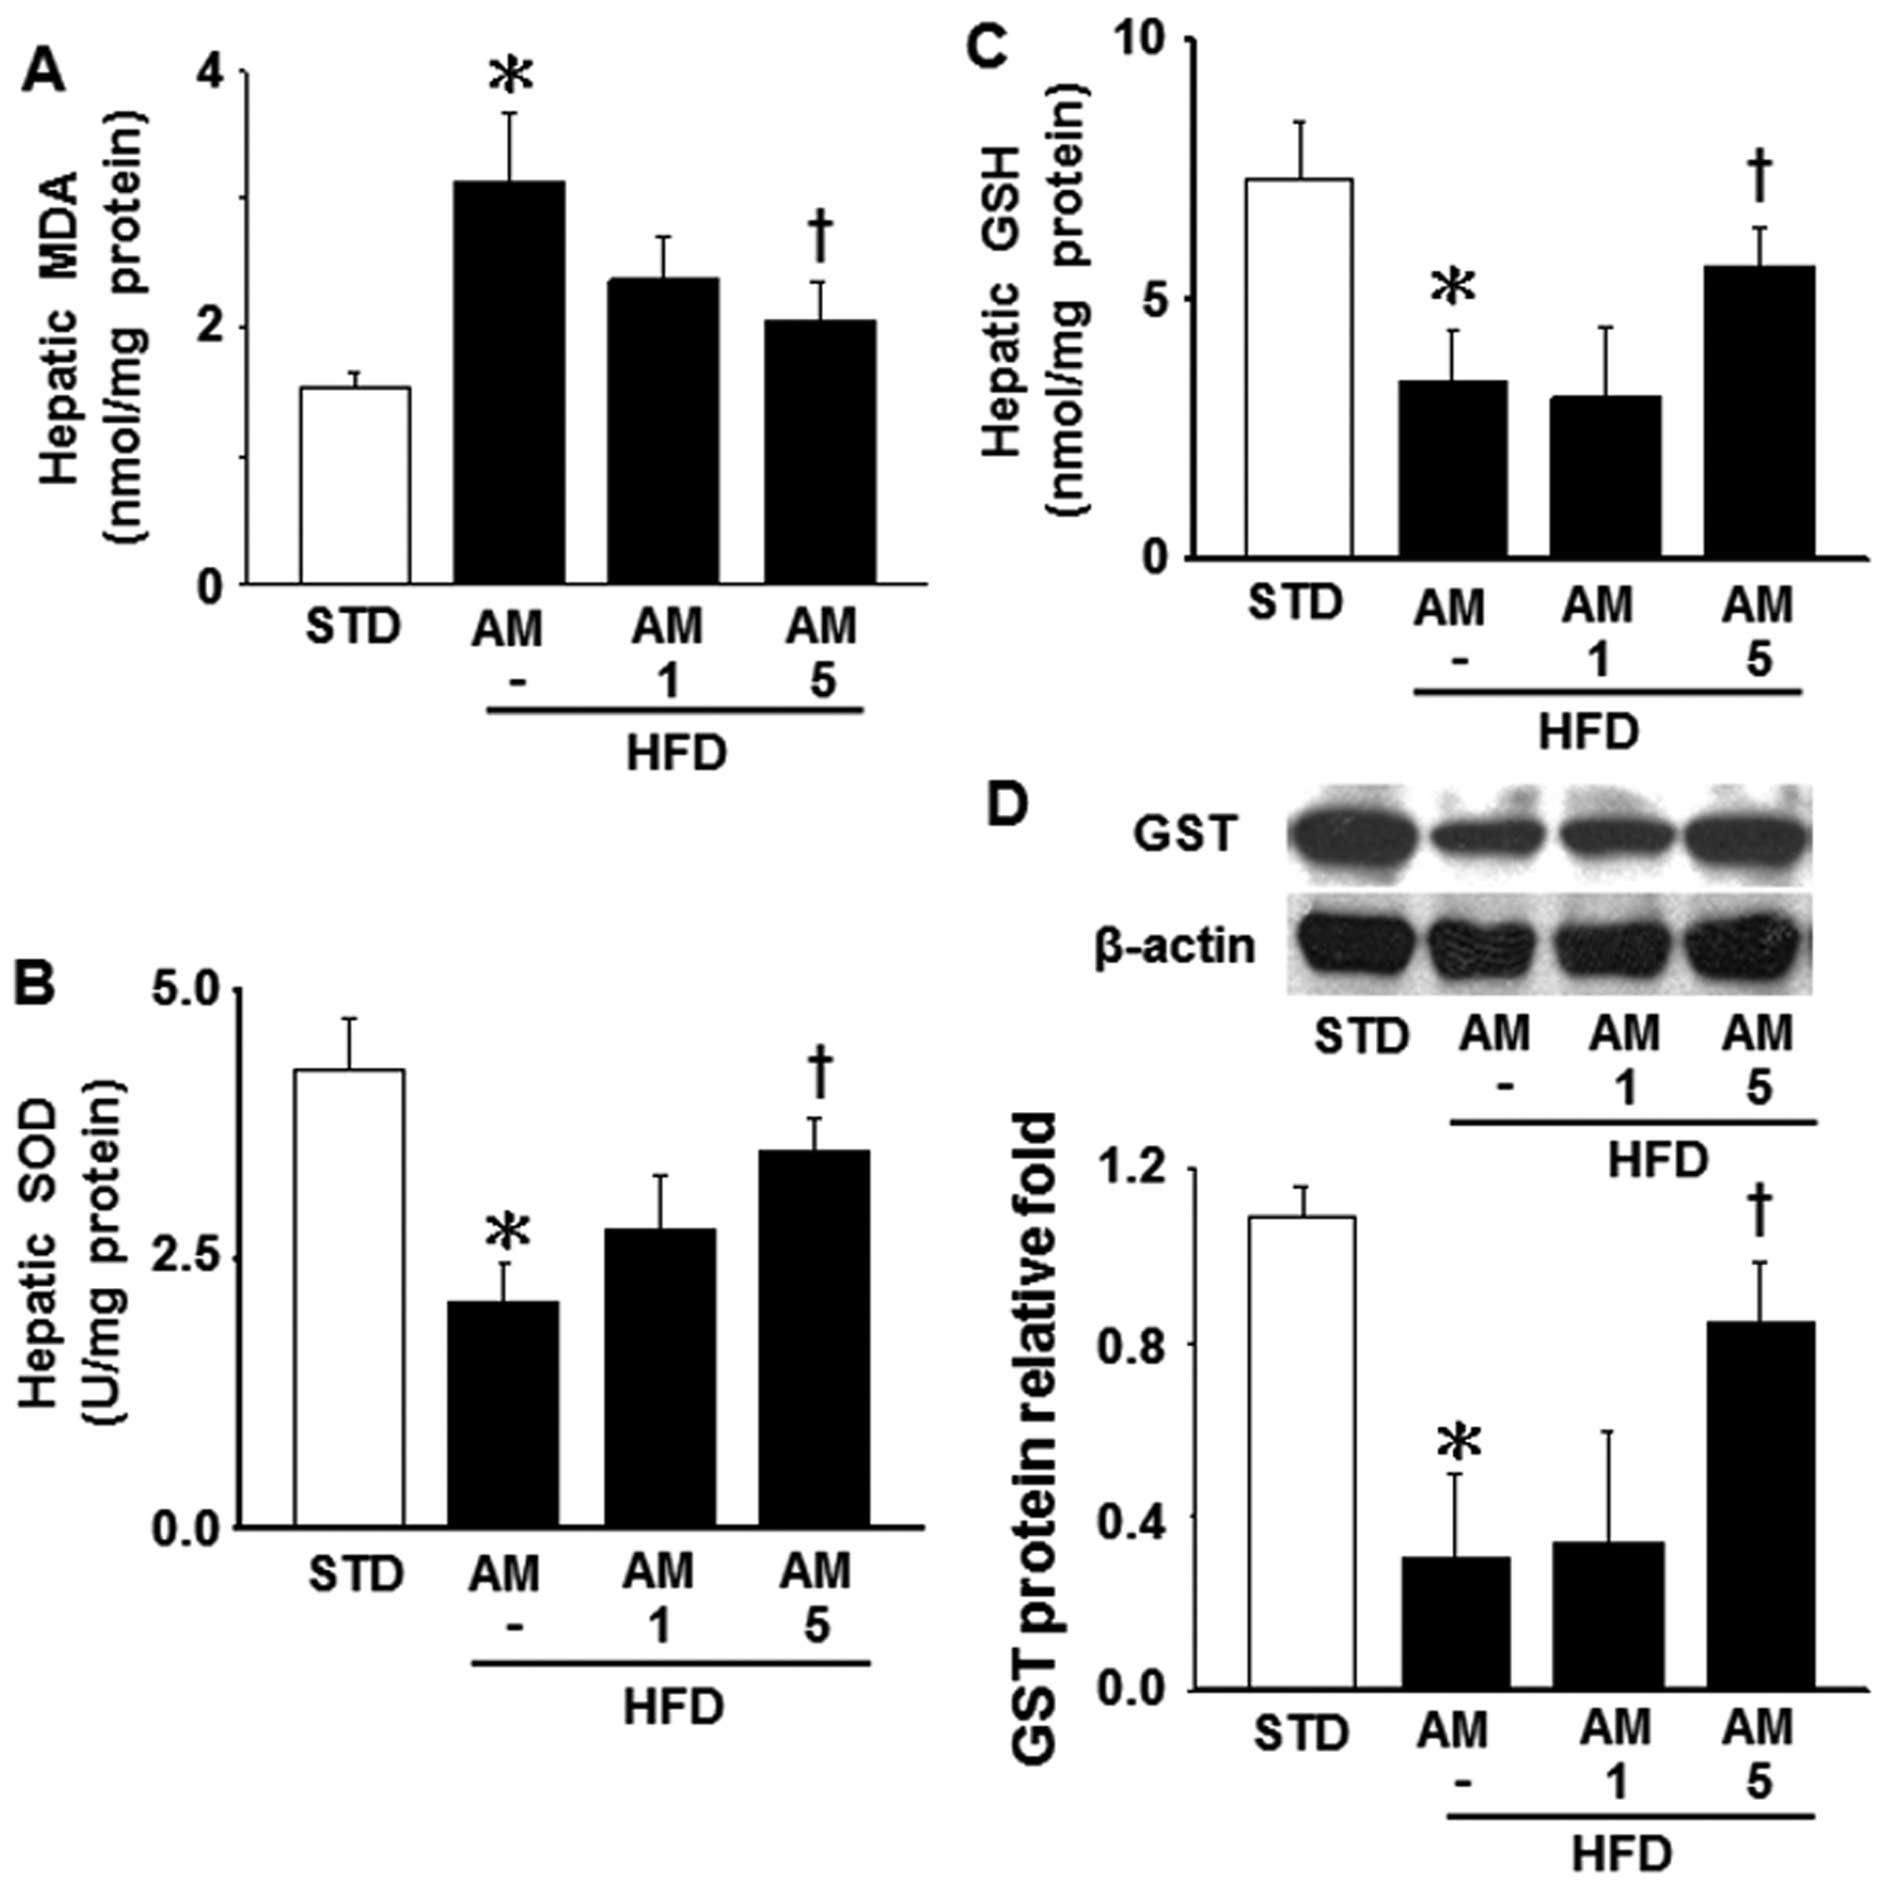
addition, the MDA level, which was measured to evaluate the
production of lipid peroxide, was significantly increased in the
HFD-fed mice compared with the STD-fed mice (Fig. 4A). The administration of AM251 at
the dose of 5 mg/kg significantly attenuated the increase in the
MDA level in the HFD-fed mice (Fig.
4A). Conversely, a HFD led to a significant decrease in hepatic
SOD and GSH activity, as well as the GST level; these effects were
attenuated by treatment with 5 mg/kg AM251 (Fig. 4B–D). These observations indicate
that AM251 attenuates obesity-induced mitochondrial dysfunction,
the decrease in SOD and GSH levels, and lipid peroxidation.
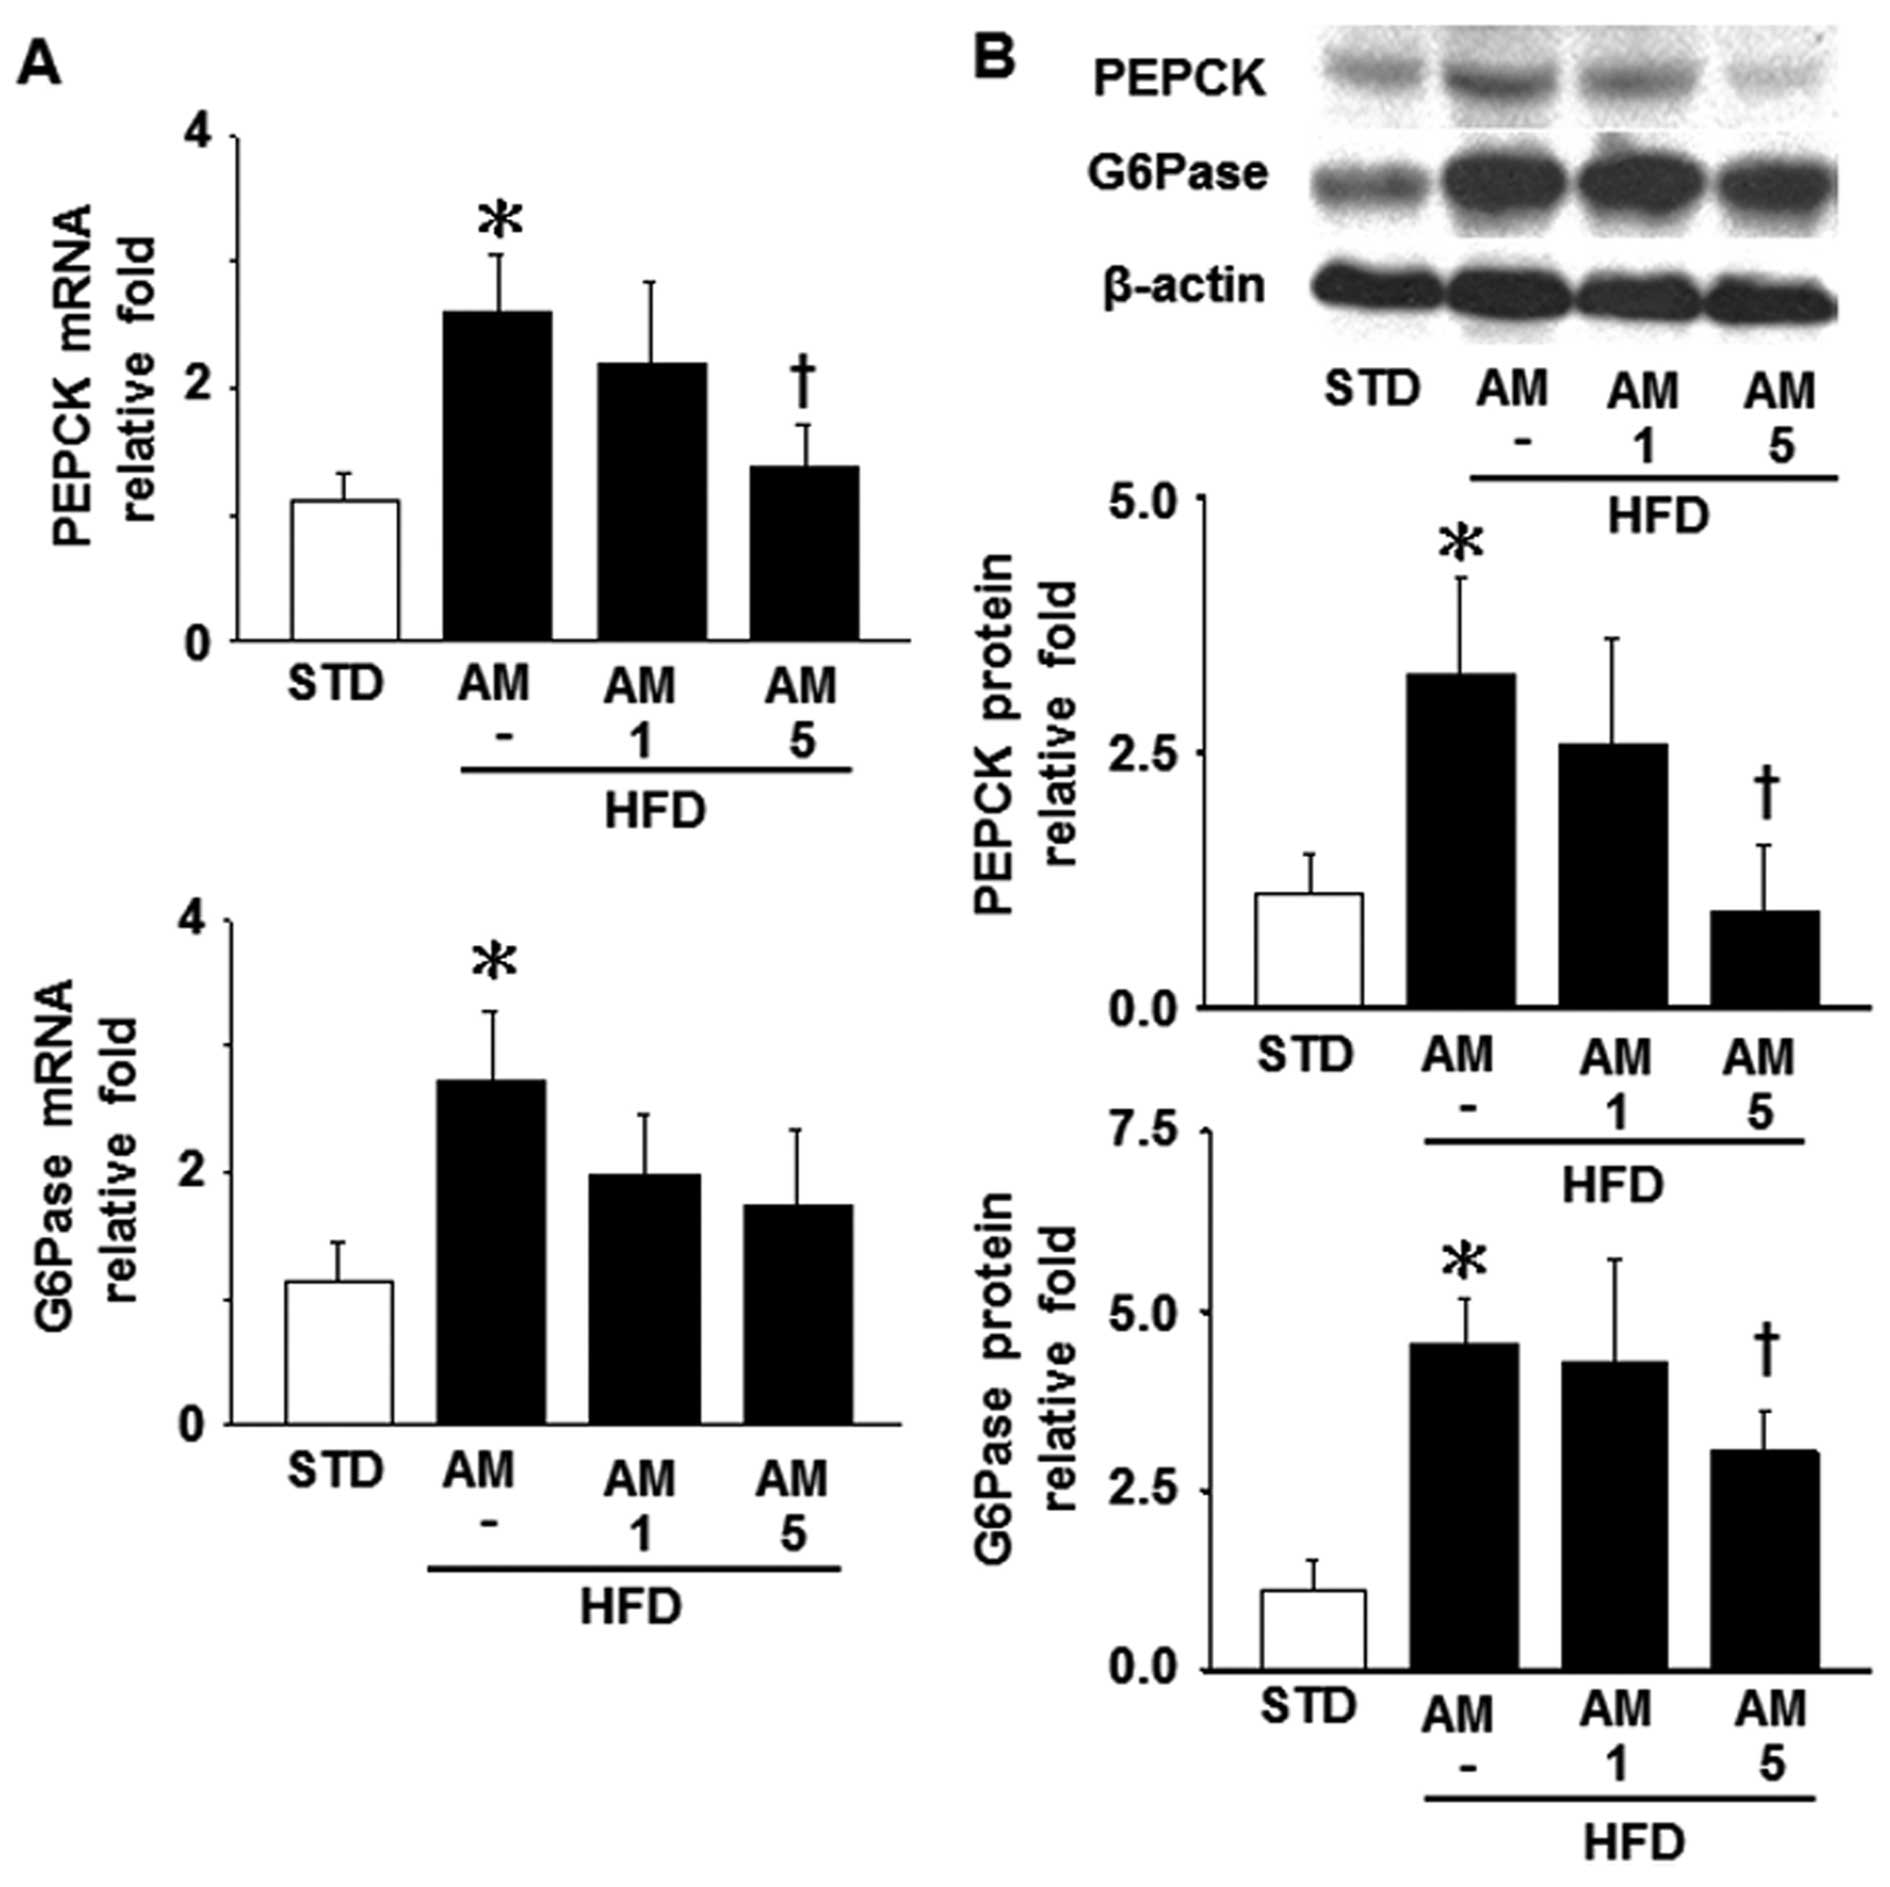
Effects of AM251 on the levels of PEPCK
and G6Pase in liver tissue
PEPCK and G6Pase are critically involved in
gluconeogenesis and they have been identified as indicators of
hepatic insulin resistance (34).
Hence, in this study, we aimed to determine whether the expression
of hepatic PEPCK and G6Pase is affected a HFD. A HFD resulted in a
marked increased in the mRNA and protein levels of PEPCK and G6Pase
compared with the STD (control mice). By contrast, the increase in
the levels of PEPCK and G6Pase was significantly abolished by
treatment with 5 mg/kg AM251 in the HFD-fed mice; however, the
G6Pase mRNA level was not significanly affected by treatment with
AM251 (Fig. 5).
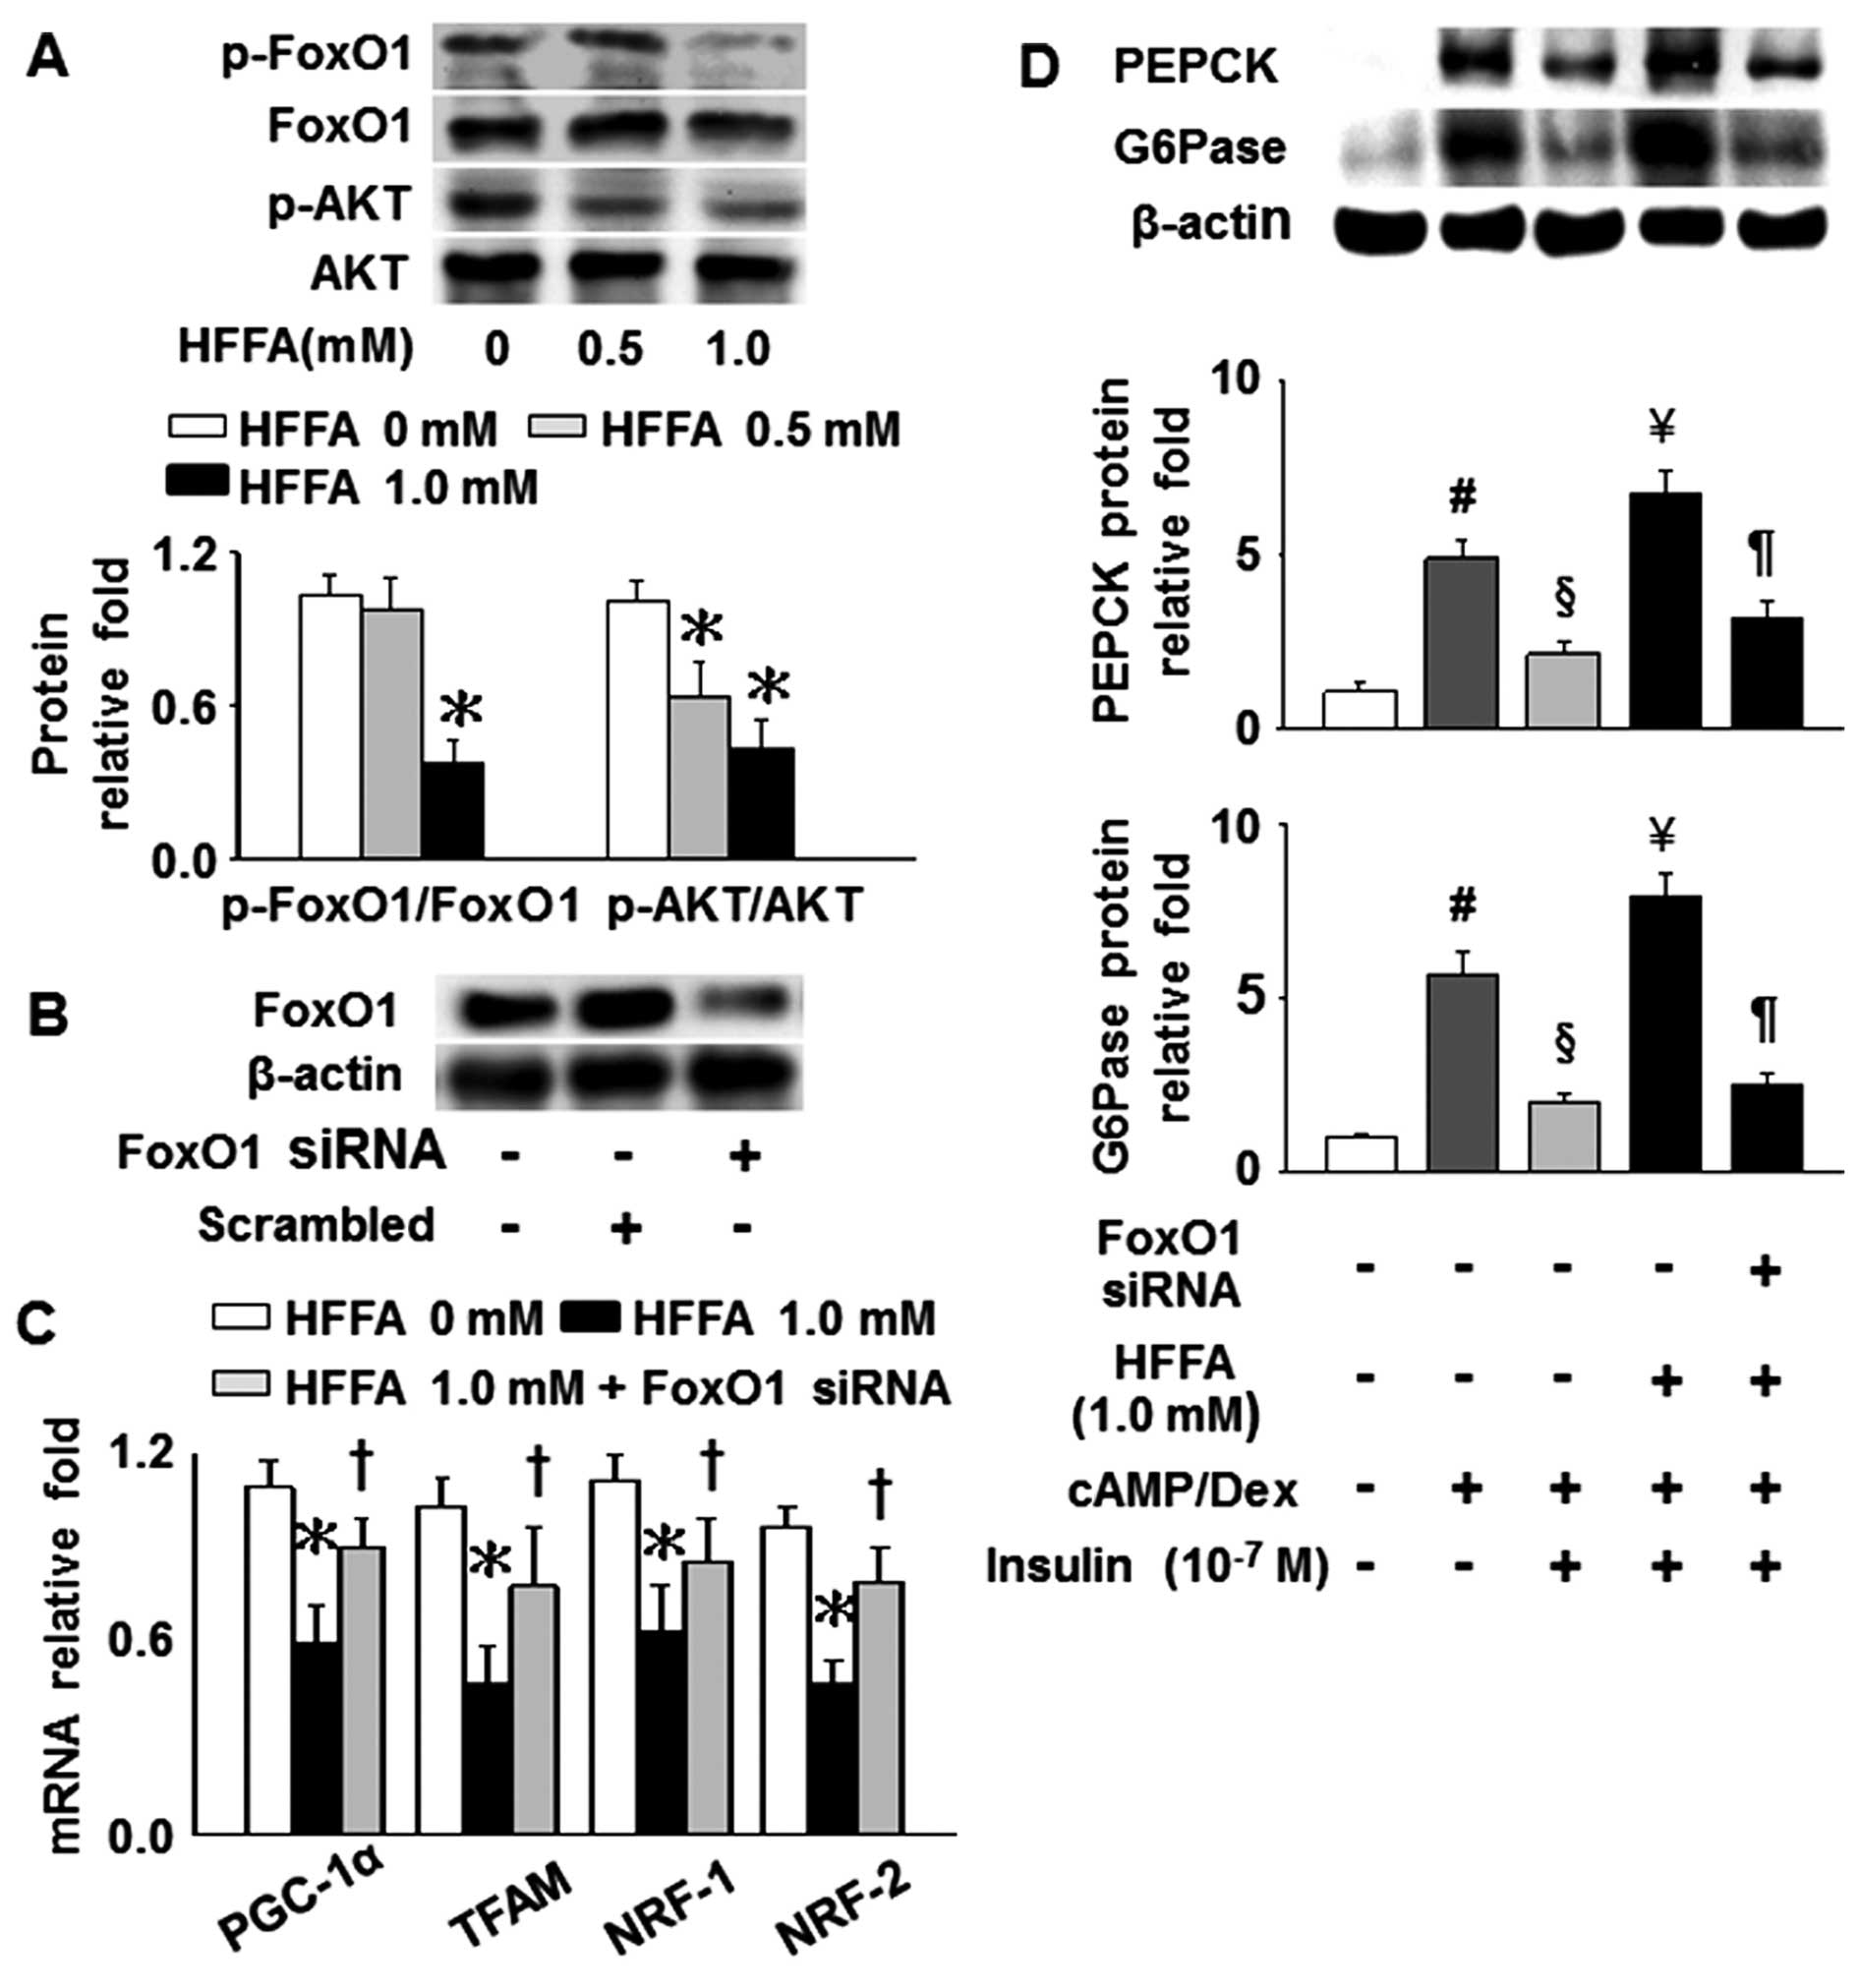
Effects of FoxO1 on mitochondrial
function, and the levels of PEPCK and G6Pase in AML12
hepatocytes
In order to mimic the elevated levels of plasma FFAs
and hepatic FoxO1 activity as observed in our HFD-fed mice, AML12
hepatocytes were cultured in HFFA-containing medium. In this way,
we aimed to further explore a series of mechanisms between CB1R and
FoxO1. The phosphorylation levels of FoxO1 and AKT were markedly
decreased in the cells cultured in 1 mM HFFA compared to the cells
cultured without HFFA (Fig. 6A).
Subsequently, we transfected the cells with siRNA against FoxO1 in
order to further verify the direct correlation between CB1R and
FoxO1 activity, which may cause mitochondrial dysfunction and
alterations in the levels of PEPCK and G6Pase due to the
stimulation of FAs. Compared to the untreated cells or the
scrambled controls, quantitative analysis of FoxO1 protein
expression revealed an approximate 70% decrease in expression in
the AML12 cells treated with 100 nM siRNA against FoxO1 (1.00±0.05,
1.05±0.07 and 0.31±0.10, respectively; Fig. 6B). Furthermore, the mRNA levels of
PGC-1α, TFAM, NRF-1 and NRF-2 were significantly decreased
following the challenge with 1 mM HFFA; however, transfection with
siRNA against FoxO1 reversed the HFFA-induced decrease in the gene
expression of the aforementioned regulators (Fig. 6C). The expression of PEPCK and
G6Pase was increased in response to cAMP/Dex, but was reduced in
response to insulin. Our results demonstrated that treatment with 1
mM HFFA abolished the insulin-induced suppression of
cAMP/Dex-mediated PEPCK and G6Pase levels. However, the silencing
of FoxO1 markedly suppressed the expression of PEPCK and G6Pase as
regards the aspects of gluconeogenesis associated with HFFA
(Fig. 6D).
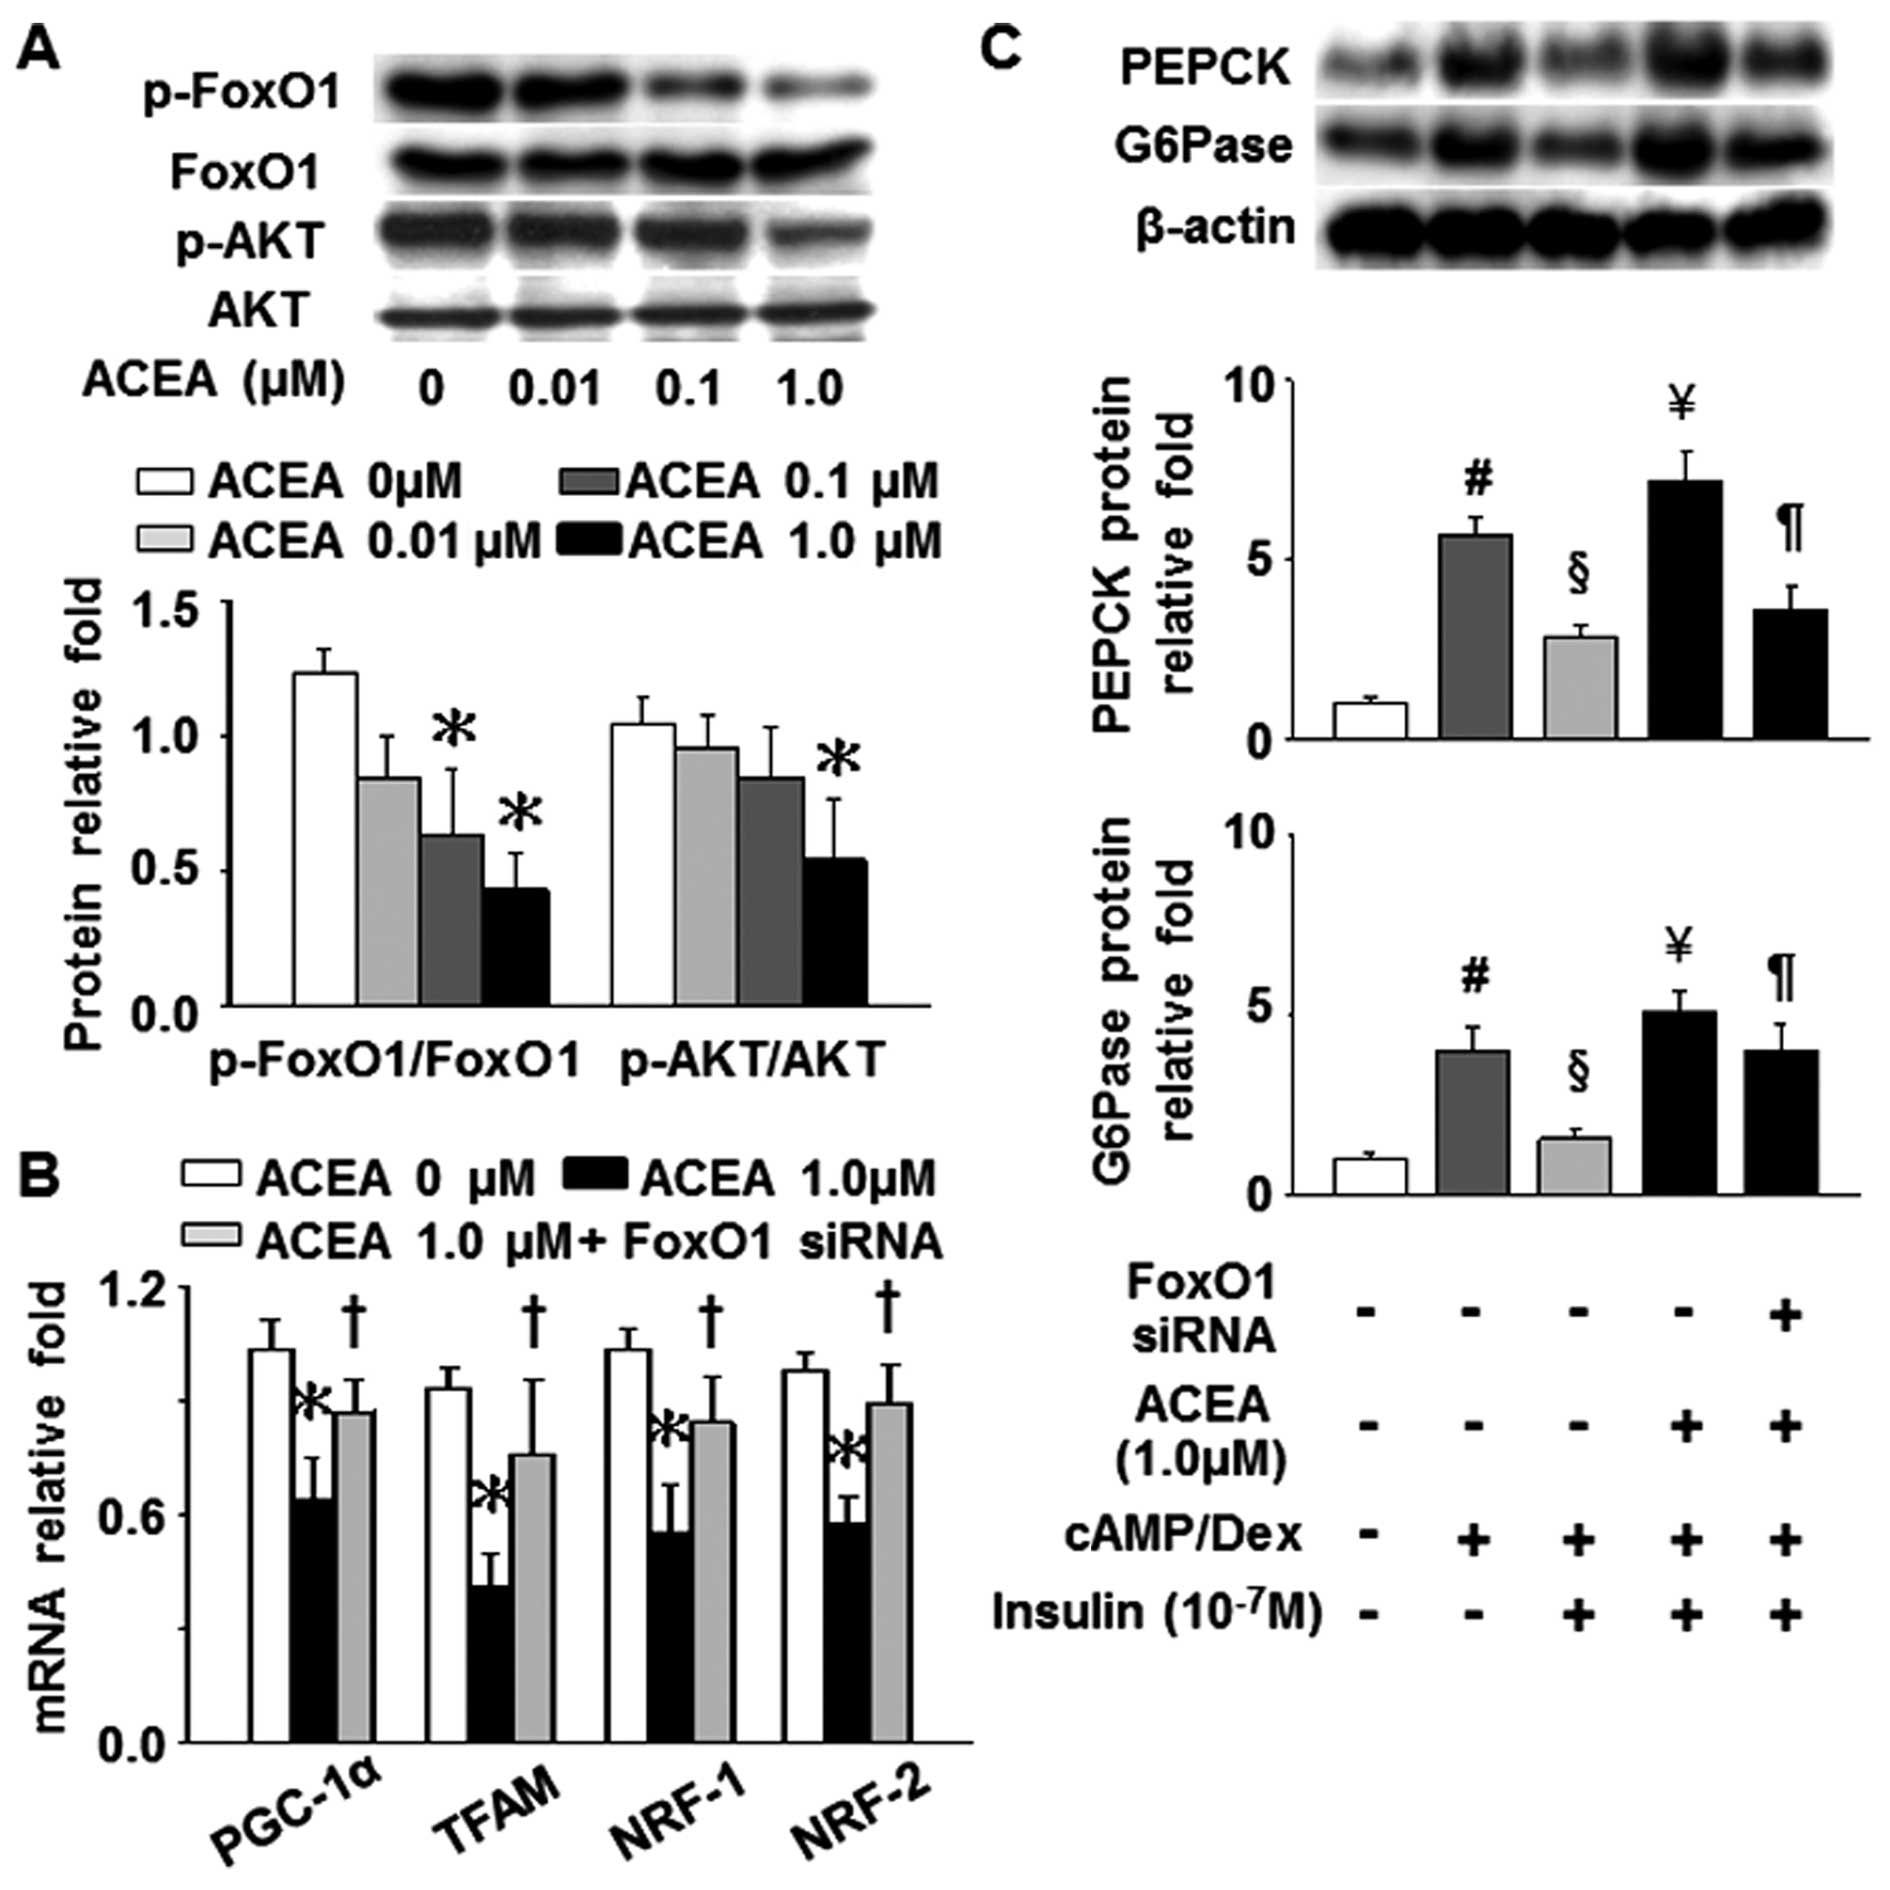
In line with the effects of HFFA on the expression
of FoxO1 and AKT, the phosphorylation levels of FoxO1 and AKT were
also markedly inhibited by treatment with 1 µM ACEA
(Fig. 7A). Furthermore, the
silencing of the FoxO1 gene significantly attenuated the
ACEA-induced decrease in the mRNA levels of PGC-1α, TFAM, NRF-1 and
NRF-2, as well as the ACEA-induced increase in PEPCK and G6Pase
levels which had been suppressed by insulin (Fig. 7B and C). Taken together, these
results demonstrate that a direct association exists between CB1R
and FoxO1 in FA-induced mitochondrial dysfunction and insulin
resistance in hepatocytes.
Discussion
Any impairment in hepatic insulin sensitivity is
rapidly reflected in glucose homeostasis and triglyceride levels.
Thus, fatty liver is considered the hepatic expression of metabolic
syndrome (35). The present study
demonstrated that the pharmacological blockade of CB1R improved
hyperglycemia in mice, which was caused by a HFD, and partially
decreased FoxO1-mediated insulin resistance by increasing the
phosphorylation of insulin signaling cascades and ameliorating
mitochondrial dysfunction in liver, indicating a high correlation
between CB1R and FoxO1 activity in NAFLD and metabolic disorders. A
HFD resulted in the upregulation of CB1R expression in the liver,
but reduced the levels of mitochondrial enzymes (CPT-1 and citrate
synthase), as well as those of mitochondrial biogenic factors (TFAM
and NRF-1), which precede NAFLD development and insulin resistance.
These changes occurred in conjunction with a decrease in glycemic
control, the loss of hepatic antioxidant capacity, increased
hepatic oxidative stress, and reduced hepatic mitochondrial
function. The results were similar to those of the studies by
Rector et al (8) and
Osei-Hyiaman et al (23).
On the other hand, a HFD led to significantly higher plasma levels
of lipids (TG and FFAs), glucose and insulin compared with a STD
(control mice), whereas elevated serum ALT and AST levels were not
clearly observed in the HFD-fed mice. This indicated that the mouse
model of DIO included only simple hepatosteatosis, and did not
exhibit further transfer to NASH, although hepatic oxidative stress
and lipid peroxidation significantly increased in the HFD-fed
mice.
High carbohydrate diets, or excessive dietary fat
leading to exaggerated FFA delivery has been shown to result in
hepatic insulin resistance (36),
diminished FA oxidation and increased DNL with TG accumulation in
hepatocytes (37). In addition,
high glucose and high FFA levels have been shown to induce marked
insulin resistance and mitochondrial dysfunction in differentiated
3T3-L1 adipocytes, which results from increased levels of
intracellular ROS and the loss of mitochondrial membrane potential
(38). Moreover, recent studies
have demonstrated that the administration of AM251 is a promising
therapeutic strategy for the treatment of NAFLD or metabolic
syndrome (39–41). Our results indicated that a
decrease in plasma TG and glucose levels, as well as in the HOMA-IR
index value occurred in HFD-fed mice following the administration
of 5 mg/kg AM251 was, but this did not significantly alter the
plasma insulin levels in these groups. Thus, we speculated that
although treatment with AM251 led to a lower plasma level of TG and
glucose, it was insufficient to restrain insulin secretion or to
enhance hepatic insulin clearance, as the plasma TG and glucose
levels in the HFD-fed mice that received AM251 remained higher than
those in the STD-control mice.
It has also been previously indicated that the
blockade of CB1R suppresses the CB1R level and increases CPT-1
expression, thus normalizing the amount of TG in the liver in obese
mice (29,42). Consistent with the findings of
these previous studies, our results indicated that a high dose of
AM251 inhibited CB1R protein expression and the mRNA levels of
CPT-1 and citrate synthase in the livers of HFD-fed mice, despite
no statistically significant change in the CB1R mRNA level of the
HFD-fed mice in the presence or absence of AM251. Mitochondria are
considered the primary quantitative source of free radicals in
mammalian liver. However, ROS can attack polyunsaturated FA and
initiate lipid peroxidation within the cells, which results in the
formation of aldehyde byproducts, such as 4-hydroxy-2-nonenal (HNE)
and MDA (43). Previous studies
have indicated that patients with NASH have impaired liver ATP
homeostasis (44), which severely
depletes mtDNA, and affects mitochondrial function (10). Conversely, increased levels of
antioxidants may play a protective role against the development of
hepatic steatosis (45,46). A master regulator of mitochondrial
biogenesis and function is the transcriptional co-activator,
PGC-1α, which coordinates the transcriptional activity of several
nuclear transcription factors, such as NRF-1 and NRF-2, and
transactivates TFAM, whereas decreased mitochondrial biogenesis has
been observed in fatty liver (47,48). PGC-1α also regulates the induction
of antioxidant defenses including SODs, catalase and glutathione
peroxidase (49). In this study,
we observed that the hepatic MDA level was significantly increased
in experimental fatty liver, indicating increased oxidative stress;
however, the defense against free radical-mediated injury includes
deactivating antioxidative capacity. By contrast, HFD-fed mice
treated with AM251 exhibited a substantial increase in the levels
of hepatic SOD, GSH and GST, although the hepatic mRNA levels of
PGC-1α and NRF-2 were not markedly reduced in the HFD-fed mice.
Thus, the CB1R antagonist may act as an antioxidant; a study
involving ethanol-treated rats described similar findings (50). In our study, the amount of mtDNA
and ATP activity in the livers of the HFD-fed mice did not
noticeably decrease compared with the STD-fed control mice, which
may suggest that our mouse model of DIO had only simple fatty
liver.
Fasting hyperglycemia is commonly observed in
patients with T2D and metabolic syndrome, indicated by a reduced
glucose uptake caused by peripheral tissues and the increased
production of glucose caused by hepatocytes resistant to insulin
(51,52). A previous study reported that the
functional inhibition of FoxO1 reduced hepatic gluconeogenic
activity (PEPCK and G6Pase) and improved fasting glycemia in
diabetic mice (19). However, to
the best of our knowledge, the mechanisms through which CB1R
overexpression leads to FoxO1-mediated insulin resistance in
obesity have not been explored to date. The present study
demonstrated that the administration of 5 mg/kg AM251 suppressed
FoxO1 activity and enhanced the phosphorylation of insulin
signaling cascades, consisting of IRS-2, PI3K and AKT, in the fatty
livers of HFD-fed mice, in response to the suppressed hepatic
protein levels of PEPCK and G6Pase. A recent study suggested that
endocannabinoids interact with hepatic CB1R to promote hepatocyte
proliferation in hepato cellular carcinoma via FoxM1 and proposed
an association between endocannabinoid/CB1R system and forkhead box
(Fox) transcription factors (53). Herein, by silencing the FoxO1 gene
using siRNA, we further provided in vitro evidence to
demonstrate that hepatic CB1R contributes to FA-induced
mitochondrial disorder and hepatic insulin resistance through FoxO1
in AML12 hepatocytes. On the other hand, it has been suggested that
enzymatic abnormalities are a more effective indicator of liver
insulin resistance than the HOMA IR index, and that participants
with hepatic insulin resistance in the highest quartile of elevated
enzymes have an increased risk of developing fatty liver (54). However, in this study, we only
used the HOMA-IR index as an index of global insulin resistance,
which did not completely represent hepatic insulin resistance.
Drugs that interfere with cannabinoid CB1R transmission suppress
food-motivated behaviors, and may be clinically useful as appetite
suppressants. However, neuropsychiatric side-effects, including
anxiety, depression and suicidal ideation, are topics of concern
(55). In a previous study, Tam
et al reported that the absence of the neurobehavioral
effects of AM6545 and JD5037, novel peripherally-restricted CB1R
antagonists, were similar to those observed with rimonabant, but
indicated that few neuropsychiatric side-effects occurred in humans
(28,29). Additionally,
1-(2,4-dichlorophenyl)-N-(piperidin-1-yl)-4-((pyrrolidine-1-sulfonamido)methyl)-5-(5-((4-(trifluoromethyl)
phenyl)ethynyl)thiophene-2-yl)-1H-pyrazole-3-carboxamide,
another potential peripherally restricted CB1R antagonist, was
discovered by Taiwanese investigators and demonstrated a
significant weight-loss efficacy in mice with DIO (56).
In conclusion, the findings of the present study
suggest the possibility that the inhibition of the anti-insulin
resistance effect of CB1R through improved mitochondrial function
in hepatic steatosis may be dependent on FoxO1.
Acknowledgments
This study was supported by grants from the Ministry
of Science and Technology, Taipei, Taiwan (NSC 100-2314-B075-028 to
L.-T.H. and NSC 102-2320-B-182-014 to T.-Y.L.).
References
|
1
|
Anstee QM, McPherson S and Day CP: How big
a problem is non-alcoholic fatty liver disease? BMJ. 343:d38972011.
View Article : Google Scholar : PubMed/NCBI
|
|
2
|
Zámbó V, Simon-Szabó L, Szelényi P,
Kereszturi E, Bánhegyi G and Csala M: Lipotoxicity in the liver.
World J Hepatol. 5:550–557. 2013.PubMed/NCBI
|
|
3
|
Crescenzo R, Bianco F, Falcone I, Coppola
P, Liverini G and Iossa S: Increased hepatic de novo lipogenesis
and mitochondrial efficiency in a model of obesity induced by diets
rich in fructose. Eur J Nutr. 52:537–545. 2013. View Article : Google Scholar
|
|
4
|
Begriche K, Igoudjil A, Pessayre D and
Fromenty B: Mitochondrial dysfunction in NASH: causes, consequences
and possible means to prevent it. Mitochondrion. 6:1–28. 2006.
View Article : Google Scholar : PubMed/NCBI
|
|
5
|
Serviddio G, Bellanti F, Vendemiale G and
Altomare E: Mitochondrial dysfunction in nonalcoholic
steatohepatitis. Expert Rev Gastroenterol Hepatol. 5:233–244. 2011.
View Article : Google Scholar : PubMed/NCBI
|
|
6
|
Mantena SK, King AL, Andringa KK,
Eccleston HB and Bailey SM: Mitochondrial dysfunction and oxidative
stress in the pathogenesis of alcohol- and obesity-induced fatty
liver diseases. Free Radic Biol Med. 44:1259–1272. 2008. View Article : Google Scholar : PubMed/NCBI
|
|
7
|
Mantena SK, Vaughn DP, Andringa KK,
Eccleston HB, King AL, Abrams GA, Doeller JE, Kraus DW,
Darley-Usmar VM and Bailey SM: High fat diet induces dysregulation
of hepatic oxygen gradients and mitochondrial function in vivo.
Biochem J. 417:183–193. 2009. View Article : Google Scholar :
|
|
8
|
Rector RS, Thyfault JP, Uptergrove GM,
Morris EM, Naples SP, Borengasser SJ, Mikus CR, Laye MJ, Laughlin
MH, Booth FW and Ibdah JA: Mitochondrial dysfunction precedes
insulin resistance and hepatic steatosis and contributes to the
natural history of non-alcoholic fatty liver disease in an obese
rodent model. J Hepatol. 52:727–736. 2010. View Article : Google Scholar : PubMed/NCBI
|
|
9
|
Marí M, Colell A, Morales A, von Montfort
C, Garcia-Ruiz C and Fernández-Checa JC: Redox control of liver
function in health and disease. Antioxid Redox Signal.
12:1295–1331. 2010. View Article : Google Scholar :
|
|
10
|
Pessayre D and Fromenty B: NASH: a
mitochondrial disease. J Hepatol. 42:928–940. 2005. View Article : Google Scholar : PubMed/NCBI
|
|
11
|
Sandri M: FOXOphagy path to inducing
stress resistance and cell survival. Nat Cell Biol. 14:786–788.
2012. View
Article : Google Scholar : PubMed/NCBI
|
|
12
|
Nakae J, Kitamura T, Silver DL and Accili
D: The forkhead transcription factor Foxo1 (Fkhr) confers insulin
sensitivity onto glucose-6-phosphatase expression. J Clin Invest.
108:1359–1367. 2001. View Article : Google Scholar : PubMed/NCBI
|
|
13
|
Samuel VT, Choi CS, Phillips TG, Romanelli
AJ, Geisler JG, Bhanot S, McKay R, Monia B, Shutter JR, Lindberg
RA, et al: Targeting foxo1 in mice using antisense oligonucleotide
improves hepatic and peripheral insulin action. Diabetes.
55:2042–2050. 2006. View Article : Google Scholar : PubMed/NCBI
|
|
14
|
Matsumoto M, Han S, Kitamura T and Accili
D: Dual role of transcription factor FoxO1 in controlling hepatic
insulin sensitivity and lipid metabolism. J Clin Invest.
116:2464–2472. 2006.PubMed/NCBI
|
|
15
|
Nakae J, Cao Y, Oki M, Orba Y, Sawa H,
Kiyonari H, Iskandar K, Suga K, Lombes M and Hayashi Y: Forkhead
transcription factor FoxO1 in adipose tissue regulates energy
storage and expenditure. Diabetes. 57:563–576. 2008. View Article : Google Scholar
|
|
16
|
Kim JJ, Li P, Huntley J, Chang JP, Arden
KC and Olefsky JM: FoxO1 haploinsufficiency protects against
high-fat diet-induced insulin resistance with enhanced peroxisome
proliferator-activated receptor gamma activation in adipose tissue.
Diabetes. 58:1275–1282. 2009. View Article : Google Scholar : PubMed/NCBI
|
|
17
|
Caro JF, Dohm LG, Pories WJ and Sinha MK:
Cellular alterations in liver, skeletal muscle, and adipose tissue
responsible for insulin resistance in obesity and type II diabetes.
Diabetes Metab Rev. 5:665–689. 1989. View Article : Google Scholar : PubMed/NCBI
|
|
18
|
Wajngot A, Chandramouli V, Schumann WC,
Ekberg K, Jones PK, Efendic S and Landau BR: Quantitative
contributions of gluconeogenesis to glucose production during
fasting in type 2 diabetes mellitus. Metabolism. 50:47–52. 2001.
View Article : Google Scholar : PubMed/NCBI
|
|
19
|
Altomonte J, Richter A, Harbaran S,
Suriawinata J, Nakae J, Thung SN, Meseck M, Accili D and Dong H:
Inhibition of Foxo1 function is associated with improved fasting
glycemia in diabetic mice. Am J Physiol Endocrinol Metab.
285:E718–E728. 2003. View Article : Google Scholar : PubMed/NCBI
|
|
20
|
Haeusler RA, Han S and Accili D: Hepatic
FoxO1 ablation exacerbates lipid abnormalities during
hyperglycemia. J Biol Chem. 285:26861–26868. 2010. View Article : Google Scholar : PubMed/NCBI
|
|
21
|
Cheng Z, Guo S, Copps K, Dong X, Kollipara
R, Rodgers JT, Depinho RA, Puigserver P and White MF: Foxo1
integrates insulin signaling with mitochondrial function in the
liver. Nat Med. 15:1307–1311. 2009. View
Article : Google Scholar : PubMed/NCBI
|
|
22
|
Howlett AC, Barth F, Bonner TI, Cabral G,
Casellas P, Devane WA, Felder CC, Herkenham M, Mackie K, Martin BR,
et al: International Union of Pharmacology. XXVII. Classification
of cannabinoid receptors. Pharmacol Rev. 54:161–202. 2002.
View Article : Google Scholar : PubMed/NCBI
|
|
23
|
Osei-Hyiaman D, DePetrillo M, Pacher P,
Liu J, Radaeva S, Bátkai S, Harvey-White J, Mackie K, Offertáler L,
Wang L and Kunos G: Endocannabinoid activation at hepatic CB1
receptors stimulates fatty acid synthesis and contributes to
diet-induced obesity. J Clin Invest. 115:1298–1305. 2005.
View Article : Google Scholar : PubMed/NCBI
|
|
24
|
Osei-Hyiaman D, Liu J, Zhou L, Godlewski
G, Harvey-White J, Jeong WI, Bátkai S, Marsicano G, Lutz B,
Buettner C and Kunos G: Hepatic CB1 receptor is required for
development of diet-induced steatosis, dyslipidemia, and insulin
and leptin resistance in mice. J Clin Invest. 118:3160–3169. 2008.
View Article : Google Scholar : PubMed/NCBI
|
|
25
|
Cinar R, Godlewski G, Liu J, Tam J,
Jourdan T, Mukhopadhyay B, Harvey-White J and Kunos G: Hepatic
cannabinoid-1 receptors mediate diet-induced insulin resistance by
increasing de novo synthesis of long-chain ceramides. Hepatology.
59:143–153. 2014. View Article : Google Scholar
|
|
26
|
Chanda D, Kim YH, Kim DK, Lee MW, Lee SY,
Park TS, Koo SH, Lee CH and Choi HS: Activation of cannabinoid
receptor type 1 (Cb1r) disrupts hepatic insulin receptor signaling
via cyclic AMP-response element-binding protein H (Crebh)-mediated
induction of Lipin1 gene. J Biol Chem. 287:38041–38049. 2012.
View Article : Google Scholar : PubMed/NCBI
|
|
27
|
Liu J, Zhou L, Xiong K, Godlewski G,
Mukhopadhyay B, Tam J, Yin S, Gao P, Shan X, Pickel J, et al:
Hepatic cannabinoid receptor-1 mediates diet-induced insulin
resistance via inhibition of insulin signaling and clearance in
mice. Gastroenterology. 142:1218–1228.e1. 2012. View Article : Google Scholar : PubMed/NCBI
|
|
28
|
Tam J, Vemuri VK, Liu J, Bátkai S,
Mukhopadhyay B, Godlewski G, Osei-Hyiaman D, Ohnuma S, Ambudkar SV,
Pickel J, et al: Peripheral CB1 cannabinoid receptor blockade
improves cardiometabolic risk in mouse models of obesity. J Clin
Invest. 120:2953–2966. 2010. View
Article : Google Scholar : PubMed/NCBI
|
|
29
|
Tam J, Cinar R, Liu J, Godlewski G, Wesley
D, Jourdan T, Szanda G, Mukhopadhyay B, Chedester L, Liow JS, et
al: Peripheral cannabinoid-1 receptor inverse agonism reduces
obesity by reversing leptin resistance. Cell Metab. 16:167–179.
2012. View Article : Google Scholar : PubMed/NCBI
|
|
30
|
Tedesco L, Valerio A, Dossena M, Cardile
A, Ragni M, Pagano C, Pagotto U, Carruba MO, Vettor R and Nisoli E:
Cannabinoid receptor stimulation impairs mitochondrial biogenesis
in mouse white adipose tissue, muscle, and liver: The role of eNOS,
p38 MAPK, and AMPK pathways. Diabetes. 59:2826–2836. 2010.
View Article : Google Scholar : PubMed/NCBI
|
|
31
|
Kohli R, Pan X, Malladi P, Wainwright MS
and Whitington PF: Mitochondrial reactive oxygen species signal
hepatocyte steatosis by regulating the phosphatidylinositol
3-kinase cell survival pathway. J Biol Chem. 282:21327–21336. 2007.
View Article : Google Scholar : PubMed/NCBI
|
|
32
|
Tedesco L, Valerio A, Cervino C, Cardile
A, Pagano C, Vettor R, Pasquali R, Carruba MO, Marsicano G, Lutz B,
et al: Cannabinoid type 1 receptor blockade promotes mitochondrial
biogenesis through endothelial nitric oxide synthase expression in
white adipocytes. Diabetes. 57:2028–2036. 2008. View Article : Google Scholar : PubMed/NCBI
|
|
33
|
Chen CC, Lee TY, Kwok CF, Hsu YP, Shih KC,
Lin YJ and Ho LT: Major urinary protein 1 interacts with
cannabinoid receptor type 1 in fatty acid-induced hepatic insulin
resistance in a mouse hepatocyte model. Biochem Biophys Res Commun.
15:1063–1068. 2015. View Article : Google Scholar
|
|
34
|
Yabaluri N and Bashyam MD: Hormonal
regulation of gluconeogenic gene transcription in the liver. J
Biosci. 35:473–484. 2010. View Article : Google Scholar : PubMed/NCBI
|
|
35
|
Medina-Santillán R, López-Velázquez JA,
Chávez-Tapia N, Torres-Villalobos G, Uribe M and Méndez-Sánchez N:
Hepatic manifestations of metabolic syndrome. Diabetes Metab Res
Rev. Mar 7–2013.Epub ahead of print. View Article : Google Scholar : PubMed/NCBI
|
|
36
|
Lottenberg AM, Afonso MS, Lavrador MS,
Machado RM and Nakandakare ER: The role of dietary fatty acids in
the pathology of metabolic syndrome. J Nutr Biochem. 23:1027–1040.
2012. View Article : Google Scholar : PubMed/NCBI
|
|
37
|
Utzschneider KM and Kahn SE: Review: The
role of insulin resistance in nonalcoholic fatty liver disease. J
Clin Endocrinol Metab. 91:4753–4761. 2006. View Article : Google Scholar : PubMed/NCBI
|
|
38
|
Gao CL, Zhu C, Zhao YP, Chen XH, Ji CB,
Zhang CM, Zhu JG, Xia ZK, Tong ML and Guo XR: Mitochondrial
dysfunction is induced by high levels of glucose and free fatty
acids in 3T3-L1 adipocytes. Mol Cell Endocrinol. 320:25–33. 2010.
View Article : Google Scholar : PubMed/NCBI
|
|
39
|
Chanda D, Kim DK, Li T, Kim YH, Koo SH,
Lee CH, Chiang JY and Choi HS: Cannabinoid receptor type 1 (CB1R)
signaling regulates hepatic gluconeogenesis via induction of
endoplasmic reticulum-bound transcription factor cAMP-responsive
element-binding protein H (CREBH) in primary hepatocytes. J Biol
Chem. 286:27971–27979. 2011. View Article : Google Scholar : PubMed/NCBI
|
|
40
|
Ruby MA, Nomura DK, Hudak CS, Barber A,
Casida JE and Krauss RM: Acute overactive endocannabinoid signaling
induces glucose intolerance, hepatic steatosis, and novel
cannabinoid receptor 1 responsive genes. PLoS One. 6:e264152011.
View Article : Google Scholar : PubMed/NCBI
|
|
41
|
Merroun I, Sánchez-González C, Martínez R,
López-Chaves C, Porres JM, Aranda P, Llopis J, Galisteo M, Zarzuelo
A, Errami M and López-Jurado M: Novel effects of the cannabinoid
inverse agonist AM 251 on parameters related to metabolic syndrome
in obese Zucker rats. Metabolism. 62:1641–1650. 2013. View Article : Google Scholar : PubMed/NCBI
|
|
42
|
Jourdan T, Demizieux L, Gresti J, Djaouti
L, Gaba L, Vergès B and Degrace P: Antagonism of peripheral hepatic
cannabinoid receptor-1 improves liver lipid metabolism in mice:
Evidence from cultured explants. Hepatology. 55:790–799. 2012.
View Article : Google Scholar
|
|
43
|
Poli G and Schaur RJ: 4-Hydroxynonenal in
the pathomechanisms of oxidative stress. IUBMB Life. 50:315–321.
2000. View Article : Google Scholar
|
|
44
|
Pérez-Carreras M, Del Hoyo P, Martín MA,
Rubio JC, Martín A, Castellano G, Colina F, Arenas J and
Solis-Herruzo JA: Defective hepatic mitochondrial respiratory chain
in patients with nonalcoholic steatohepatitis. Hepatology.
38:999–1007. 2003. View Article : Google Scholar : PubMed/NCBI
|
|
45
|
Violi F and Cangemi R: Pioglitazone,
vitamin E, or placebo for nonalcoholic steatohepatitis. N Engl J
Med. 363:1185–1186; author reply 1186. 2010. View Article : Google Scholar : PubMed/NCBI
|
|
46
|
Lavine JE, Schwimmer JB, Van Natta ML,
Molleston JP, Murray KF, Rosenthal P, Abrams SH, Scheimann AO,
Sanyal AJ, Chalasani N, et al: Nonalcoholic Steatohepatitis
Clinical Research Network: Effect of vitamin E or metformin for
treatment of nonalcoholic fatty liver disease in children and
adolescents: the TONIC randomized controlled trial. JAMA.
305:1659–1668. 2011. View Article : Google Scholar : PubMed/NCBI
|
|
47
|
Aharoni-Simon M, Hann-Obercyger M, Pen S,
Madar Z and Tirosh O: Fatty liver is associated with impaired
activity of PPARγ-coactivator 1α (PGC1α) and mitochondrial
biogenesis in mice. Lab Invest. 91:1018–1028. 2011. View Article : Google Scholar : PubMed/NCBI
|
|
48
|
Wang S, Kamat A, Pergola P, Swamy A, Tio F
and Cusi K: Metabolic factors in the development of hepatic
steatosis and altered mitochondrial gene expression in vivo.
Metabolism. 60:1090–1099. 2011. View Article : Google Scholar : PubMed/NCBI
|
|
49
|
St-Pierre J, Drori S, Uldry M, Silvaggi
JM, Rhee J, Jäger S, Handschin C, Zheng K, Lin J, Yang W, et al:
Suppression of reactive oxygen species and neurodegeneration by the
PGC-1 transcriptional coactivators. Cell. 127:397–408. 2006.
View Article : Google Scholar : PubMed/NCBI
|
|
50
|
Tsvetanova E, Kessiova M, Alexandrova A,
Petrov L, Kirkova M and Todorov S: In vivo effects of CB1 receptor
ligands on lipid peroxidation and antioxidant defense systems in
the rat brain of healthy and ethanol-treated rats. Pharmacol Rep.
58:876–883. 2006.
|
|
51
|
Klover PJ and Mooney RA: Hepatocytes:
critical for glucose homeostasis. Int J Biochem Cell Biol.
36:753–758. 2004. View Article : Google Scholar : PubMed/NCBI
|
|
52
|
Garber AJ: Obesity and type 2 diabetes:
which patients are at risk? Diabetes Obes Metab. 14:399–408. 2012.
View Article : Google Scholar
|
|
53
|
Mukhopadhyay B, Schuebel K, Mukhopadhyay
P, Cinar R, Godlewski G, Xiong K, Mackie K, Lizak M, Yuan Q,
Goldman D and Kunos G: Cannabinoid receptor 1 promotes
hepatocellular carcinoma initiation and progression through
multiple mechanisms. Hepatology. 61:1615–1626. 2015. View Article : Google Scholar : PubMed/NCBI
|
|
54
|
Sesti G, Fiorentino TV, Hribal ML,
Sciacqua A and Perticone F: Association of hepatic insulin
resistance indexes to nonalcoholic fatty liver disease and related
biomarkers. Nutr Metab Cardiovasc Dis. 23:1182–1187. 2013.
View Article : Google Scholar : PubMed/NCBI
|
|
55
|
Christensen R, Kristensen PK, Bartels EM,
Bliddal H and Astrup A: Efficacy and safety of the weight-loss drug
rimonabant: a meta-analysis of randomised trials. Lancet.
370:1706–1713. 2007. View Article : Google Scholar : PubMed/NCBI
|
|
56
|
Chang CP, Wu CH, Song JS, Chou MC, Wong
YC, Lin Y, Yeh TK, Sadani AA, Ou MH, Chen KH, et al: Discovery of
1-(2,4-dichlorophenyl)-N-(piperidin-1-yl)-4-((pyrrolidine-1-sulfonamido)
methyl)-5-(5-((4-(trifluoromethyl)phenyl)ethynyl)thiophene-2-yl)-1H-pyrazole-3-carboxamide
as a novel peripherally restricted cannabinoid-1 receptor
antagonist with significant weight-loss efficacy in diet-induced
obese mice. J Med Chem. 56:9920–9933. 2013. View Article : Google Scholar : PubMed/NCBI
|