Introduction
The incidence of non-alcoholic fatty liver disease
(NAFLD) continues to increase, mainly due to the increased
prevalence of metabolic syndrome, thus rendering NAFLD the most
common chronic liver disorder globally (1). It may affect 70-90% of the diabetic
population and up to 70% of obese individuals (1). It has also been reported to affect
up to 37% of obese children (2).
NAFLD includes a spectrum of histological findings ranging from
simple steatosis to non-alcoholic steatohepatitis (NASH), liver
cirrhosis and hepatocellular carcinoma (3). Of note, ~37% of adult patients with
simple steatosis will develop NASH, which is strongly associated
with more detrimental outcomes (4). Although there are contradictory
findings regarding the role of mitochondrial dysfunction in the
pathogenesis and progression of NAFLD, a substantial body of
evidence supports impaired mitochondrial adaptation as a crucial
component (5,6). Hepatic oxidative functions are
essential in maintaining energy and cellular homeostasis through
multiple pathways: β-oxidation, the tricarboxylic acid (TCA) cycle,
respiratory chain activity, ketogenesis, glycolysis and ATP
synthesis (7,8). Disruptions in these pathways may
lead to an impaired energy homeostasis, resulting in aberrant liver
functions (5). Although some
clinical studies have reported increased mitochondrial respiration
in patients with simple steatosis and early-stage NASH (9,10), there is a lack of in vitro
models of NAFLD demonstrating similar findings (11-13).
Despite the increasing trend to publish 3D or 2D
coculture in vitro models of NAFLD, the systematic review by
Ramos et al (13)
demonstrated that up to 60% of researchers still predominantly
favor 2D monocultures. The use of primary human hepatocytes is
ethically and economically limited; thus, primary rodent
hepatocytes and immortalized cell lines are attractive for
developing 2D in vitro models for NAFLD, evaluating cellular
metabolism and assessing potential therapeutic compounds (14). HepG2 cells have been the most
common immortalized cell line used for 2D in vitro models of
NAFLD (12). However, studies
have demonstrated that decreased mitochondrial respiration observed
in free fatty acid (FFA)-treated HepG2 cells was not optimally
associated with findings from patients diagnosed with simple
steatosis or early-stage NASH, but instead was associated more with
late stages of NASH (15-17).
In addition, studies have also shown that HepG2 cells have a
decreased ability to secrete very low-density lipoproteins, and
they exert a low expression of some nuclear receptors, affecting
lipid metabolism (18,19). On the other hand, HepaRG cells
have exhibited similar functional aspects to primary human
hepatocytes and may offer the opportunity to be used in energy
metabolism studies (20).
Therefore, it was hypothesized that in vitro models of NAFLD
using HepaRG cells may be preferable for assessing mitochondrial
respiratory changes.
The most important hallmark of NAFLD is lipid
accumulation in the liver (21).
Since oleic and palmitic acids are the most abundant FFAs in the
serum of patients with NAFLD; they are commonly used to induce
steatosis in in vitro models, usually at a ratio of 2/1
(13,22). Clinical studies have demonstrated
that patients with NAFLD have an increased capacity to mobilize
FFAs from adipose tissue to the liver, particularly when they
suffer from insulin resistance (23,24). Despite the current debates about
the sequence of events, it is well-documented that the chronic
dysregulation of lipid homeostasis in hepatocytes leads to the
increased production of toxic lipid intermediates, resulting in
altered mitochondrial functions and lipotoxic effects (oxidative
stress, insulin resistance, inflammation and hepatocyte injury)
(25,26).
The present study aimed to assess cellular energy
metabolism, particularly mitochondrial respiration and lipotoxicity
in FFA-treated HepaRG and HepG2 cells. The findings presented
herein may enable a more appropriate use of these 2D in
vitro models regarding the changes in mitochondrial respiratory
adaptations in the pathogenesis of NAFLD.
Materials and methods
Cells and cell culture
HepaRG cells (HRP101, liver cancer cells) were
purchased from Biopredic International and cultured at a density of
26,600 cells/cm2 as previously described (27). The cells were cultured in
proliferation medium [William's E Medium (Lonza Group, Ltd.)
supplemented with 5 μg/ml insulin, 50 μM
hydrocortisone, 1% L-glutamine, 1% mixture of penicillin (10,000
UI/ml), streptomycin (10 mg/ml) and 10% fetal bovine serum] for 14
days. After that, the cells were cultured in proliferation medium
supplemented with 1.5% dimethyl sulfoxide for a further 14 days.
The cells were incubated at 37°C in a 5% CO2, 95%
air-humidified atmosphere, and the medium was changed three times a
week. HepaRG cells were then trypsinized and seeded in various well
plates according to recommended densities (Biopredic International)
and allowed to attach for 24 h (in proliferation medium) before
free fatty acid treatments were applied.
HepG2 cells (ECACC85011430, liver cancer cells) were
purchased from ECACC, and cultured in Minimum Essential Medium
(Merck Life Science UK, Ltd.) supplemented with 1% non-essential
amino acids, 10% fetal bovine serum, a 1% mixture of penicillin
(10,000 UI/ml) and streptomycin (10 mg/ml) and 1% sodium pyruvate.
The cells were incubated at 37°C in a 5% CO2, 95%
air-humidified atmosphere and passaged once a week at 75%
confluency. HepG2 cells were also allowed to attach for 24 h prior
to exposure to FFAs.
Preparation of FFA treatments
Sodium oleate (OA) and sodium palmitate (PA) were
purchased from Merck & Co., Inc. As previously described
(28), 40 mM stock solutions of
OA and PA were first prepared in 0.1 M NaOH (Merck & Co.,
Inc.), followed by conjugation to bovine serum albumin (BSA) (Merck
& Co., Inc.). OA was dissolved at 40°C for 20 min and PA at
70°C for 30 min; the stock solutions were stored at −80°C for no
more than 3 months. To prepare conjugations of FFAs and BSA, 40 mM
stock solutions of OA and PA were dissolved and mixed with 20% BSA
for 1 h to yield 8-mM stock solutions (pH 7.4). They were further
dissolved in the culture medium (without fetal bovine serum) to
yield the concentrations needed to treat cells. The 8-mM stock
solutions were sterile-filtered prior to use. The molar ratio
between FFAs and BSA was 5.3, and 2.5% BSA was used as the control.
BSA is used in various studies as a control (15,28). Unless otherwise indicated, in all
the methods described below, the cells were treated with 1 mM OA/PA
(2/1) and 2 mM OA/PA (1/1) for 24 h.
Analysis of cellular metabolism in
non-permeabilized cells
The extracellular flux analyzer Seahorse XFe-96
(Agilent Technologies, Inc.) was used to measure the cellular
metabolism of non-permeabilized cells. Prior to the measurement,
the culture media containing FFAs were replaced with assay medium
[bicarbonate-free XF DMEM pH 7.4 (Agilent Technologies, Inc.)
supplemented with 4 mM L-glutamine, 1 mM pyruvate and 1 g/l
D-glucose] and the cells were incubated in a CO2-free
incubator for 1 h at 37°C. The seeding density was 20,000 cells per
well (HepaRG and HepG2 cells) and 10,000 per well (primary rat
hepatocytes) (PRH) (Data S1).
Two types of tests were used as follows:
Mito stress test: Following the measurement of basal
respiration, a mitochondrial stress test was performed by
sequential additions of 1 μM oligomycin, 1.2 μM
carbonyl cyanide-4-(trifluoromethoxy)phenylhydrazone (FCCP), and 1
μM rotenone and antimycin A. Differences between oxygen
consumption rate (OCR) values in response to respiratory modulators
were used to calculate various mitochondrial parameters (basal, and
maximum respiration, ATP-linked respiration, spare respiratory
capacity, and proton leak respiration). The Mito stress test was
performed in HepaRG, HepG2 cells and PRH.
Glycolytic rate assay: To describe changes in
glycolytic parameters, the basal acidification rate represented as
the proton efflux rate was measured, and the maximal glycolysis was
then induced by 1 μM rotenone and antimycin A followed by
the addition of 20 mM 2-deoxyglucose as a glycolysis inhibitor. The
glycolytic rate assay was performed only in HepaRG and HepG2 cells.
All calculated parameters were normalized to the total protein
concentration (BCA assay, Thermo Fisher Scientific, Inc.). Unless
stated otherwise, the materials used in both tests were purchased
from Merck & Co., Inc.
Analysis of mitochondrial respiration in
permeabilized cells
As previously described (29), cell culture media with FFAs were
replaced with mitochondrial assay solution (70 mM sucrose, 220 mM
mannitol, 10 mM KH2PO4, 5 mM
MgCl2, 2 mM HEPES, 1 mM EGTA, 0.2% BSA and 4 mM ADP, pH
adjusted with 10 M KOH to 7.4 at 37°C) before measuring the
respiratory activity in permeabilized cells using the Seahorse
XFe96 analyzer. Cellular permeabilization was performed using the
recombinant perfringolysin-O (XF-PMPR, Agilent Technologies, Inc.)
at a final concentration of 1 nM prior to measurement
(permeabilization allowed substrates to enter the cells). Complex
I-driven respiration was stimulated by the addition of 10 mM
pyruvate with 1 mM malate or 10 mM glutamate with 1 mM malate.
Complex II-driven respiration was stimulated by adding 10 mM
succinate with 10 μM rotenone. β-oxidation was stimulated by
adding 40 μM palmitoyl-carnitine (PC) with 1 mM malate.
After measuring the OCR in the basal state, 1.5 μM
oligomycin was injected, followed by the addition of 4 μM
FCCP and 1 μM antimycin A. Differences between OCR values in
response to respiratory modulators were used to calculate various
mitochondrial parameters [oxidative phosphorylation (OXPHOS, state
3), maximal respiratory capacity (MRC, state 3u) and LEAK (state
4o)] as previously described (30). The seeding density was 20,000
cells per well. Unless stated otherwise, the materials used here
were purchased from Merck & Co., Inc.
Preparation of cellular homogenates
According to a previously described protocol
(31), the cells were washed and
harvested in phosphate-buffered saline using a cell scraper (Kisker
Biotech GmbH & Co. KG). Following centrifugation (1,000 × g,
4°C, 5 min) the phosphate-buffered saline was discarded, and the
cell pellets were immediately frozen at −80°C. The following day,
on the day of the measurements, cell pellets were suspended in 20
mM hypotonic potassium phosphate buffer (pH 7.5), followed by four
circles of freeze and thaw. The lysate was made homogenous by
passing and expelling it several times through a 26 G syringe (B.
Braun).
Measurement of mitochondrial respiratory
enzyme activities
According to the previously described protocols
(31,32), freshly homogenized cells were
used to measure the activity of mitochondrial respiratory enzymes.
Citrate synthase (CS) activity was measured in an assay mixture
containing 100 mM potassium phosphate (pH 8), Triton X-100 0.1%,
0.1 mM 5,5′-dithiobis-(2-nitrobenzoic acid), 0.3 mM acetyl-CoA and
0.5 mM oxaloacetate. The activity was calculated from the linear
increase in 5,5′-dithiobis-(2-nitrobenzoic acid) absorbance at 412
nm for 10 min. Complex I was measured in an assay mixture
containing 25 mM potassium phosphate (pH 7.8), 3.5 g/l BSA, 80
μM 2,6-dichloroindophenol, 70 μM decyl-ubiquinone, 2
mM EDTA, 10 μM antimycin A and 0.2 mM nicotinamide adenine
dinucleotide (NADH). 10 μM rotenone was used to inhibit the
complex I. The activity of complex I was calculated from the linear
decrease in 2,6-dichloroindophenol absorbance at 600 nm for 5 min.
Complex II was measured in an assay mixture containing 80 mM
potassium phosphate (pH 7.8), 1g/l BSA, 60 μM
2,6-dichloroindophenol, 50 μM decyl-ubiquinone, 2 mM EDTA,
10 μM antimycin A and 20 mM succinate. 0,5 mM
thenoyltrifluoroacetone was used to inhibit the complex II. The
activity of complex II was calculated from the linear decrease in
2,6-dichloroindophenol absorbance at 600 nm for 10 min. Complex III
activity was measured in an assay mixture containing 25 mM
potassium phosphate (pH 7.6), 50 μM decyl-ubiquinol, 2 mM
EDTA, 4 mM sodium azide, 0.05% Tween-20, and 50 μM
cytochrome c. 10 μM antimycin A was used to inhibit complex
III. The activity of complex III was calculated from the linear
increase of cytochrome c absorbance at 550 nm for 10 min.
Decyl-ubiquinol was freshly prepared by dissolving decyl-ubiquinone
in acidified ethanol at pH 4, then reduced by the addition of a few
grains of sodium borohydride and vortexed till the solution became
colorless. Complex IV activity was measured in an assay mixture
containing 30 mM potassium phosphate (pH 7.4), and 50 μM
freshly reduced cytochrome c. A total of 4 mM sodium azide was used
to inhibit complex IV. The activity of complex IV was calculated
from the decrease of cytochrome c absorbance at 550 nm for 10 min.
Complex I-IV activities were normalized to CS activity. Unless
stated otherwise, the materials used here were purchased from Merck
& Co., Inc. All absorbances were quantified using Tecan
Infinite M200 (Tecan Group, Ltd.).
Transmission electron microscopy
(TEM)
The cells were prepared for TEM as previously
described (33). After washing
the cells with 0.1 M cacodylate buffer (pH 7.2, Merck & Co.,
Inc.), the cells were fixed directly on the culture flask for 3 h
at room temperature in 3% glutaraldehyde (diluted in 0.1 M
cacodylate buffer, pH 7.2; Merck & Co., Inc.). Subsequently,
the cells were washed in 0.1 M cacodylate buffer (pH 7.2) and
post-fixed in 1% osmium tetroxide for 1 h at room temperature.
After rinsing, the cells were dehydrated in graded alcohols (50,
75, 96 and 100%), then clarified in propylene oxide and embedded in
a mixture of Epon 812 and Durcupan (polymerization for 3 days at
60°C; Merck & Co., Inc.). Semi-thin sections were stained by 1%
toluidine blue (for 3 min at 60°C; Merck & Co., Inc.).
Ultrathin sections were cut using Ultrotome Nova (LKB). The
sections were collected onto formvar carbon-coated copper grids,
counterstained with uranyl acetate and lead citrate, and then
finally examined under JEOL JEM-1400Plus TEM (120 kV; JEOL, Ltd.).
Images were obtained with the integrated 8Mpix CCD camera and
processed further using the software TEM Center (Ver. 1.7.3.1537,
JEOL, Ltd.).
Lactate dehydrogenase (LDH) assay
To evaluate plasma membrane integrity, the LDH assay
kit (Diagnostic Systems GmbH) was used to quantify LDH activity in
cell culture medium and cell lysates according to the
manufacturer's instructions. LDH leakage was then calculated from
the LDH activities in the cell culture medium and the cell
lysates.
Caspase assays
To detect the activity of the effector caspase-3 and
the mitochondrial pathway initiator caspase-9, fluorescent probes
purchased from Life Sciences, Inc. were used. The substrates for
caspase-3 and -9 are Ac-DEVD-AMC (λex=360 nm, λem=465 nm) and
Ac-LEHD-AMC (λex=350 nm, λem=450 nm), respectively. Activated
caspase enzymes cleave these substrates to release fluorescent AMC,
which is then detected using a fluorescent plate reader (Tecan
Infinite M200; Tecan Group, Ltd.). The cells were lysed in lysis
buffer (50 mM HEPES, 5 mM CHAPS and 5 mM DTT) and stored at −80°C.
The cell culture medium was also collected and stored at −80°C. The
samples containing the aforementioned substrates were quantified in
assay buffer (20 mM HEPES, 0.1% CHAPS, 5 mM DTT and 2 mM EDTA).
Data were normalized to the protein concentration (BCA reducing
agent compatible assay, Thermo Fisher Scientific, Inc.). Unless
stated otherwise, the materials used here were purchased from Merck
& Co., Inc.
Measurement of reactive oxygen species
(ROS) production
CM-H2DCFDA (Invitrogen; Thermo Fisher
Scientific, Inc.) was used to evaluate the increased production of
ROS. Its acetate groups are cleaved by intracellular esterases
followed by subsequent oxidation yielding a fluorescent adduct
(λex=485 nm, and λem=535 nm) that is trapped inside the cells. In
brief, the HepaRG and HepG2 cells were incubated at room
temperature with the indicator for 30 min (10 and 40 μM,
respectively). The cells were washed with phosphate-buffered
saline, and fluorescence was quantified using a fluorescent plate
reader (Tecan Infinite M200; Tecan Group, Ltd.). Data were
normalized to the protein concentration (BCA assay, Thermo Fisher
Scientific, Inc.).
Measurement of mitochondrial membrane
potential (MMP)
MMP was quantified using the JC-1 fluorescent probe
(Invitrogen; Thermo Fisher Scientific, Inc.) as previously
described (34). JC-1 is a
membrane-permeable cationic dye that exhibits potential-dependent
accumulation in the mitochondria. At a higher MMP, it forms red
fluorescence (λex=485 nm, and λem=590 nm), and at a lower MMP, it
exhibits green fluorescence (λex=485 nm, and λem=525 nm). Briefly,
the cells were incubated at room temperature with 20 μM JC-1
probe for 30 min, and after rinsing with cell culture medium, MMP
was quantified using a fluorescent plate reader (Tecan Infinite
M200; Tecan Group, Ltd.). Data are expressed as the red/green
fluorescence ratio.
Oil Red O staining and triacylglycerol
(TAG) quantification
To visualize TAG accumulation, the cells were
stained with Oil Red O (Merck & Co., Inc.). The FFA-treated
cells were fixed with 4% paraformaldehyde for 15 min at room
temperature. Following fixation, the cells were stained with 0.5%
Oil Red O for 15 min at room temperature before being observed
under a light microscope (magnification, ×40). According to the
manufacturer's instructions, the TAG content was quantified using a
TAG assay kit (Cayman Chemical Company). In brief, the attached
cells were harvested from the cell culture plates using cell
scrappers (Kisker Biotech GmbH & Co. KG), and where
appropriate, detached cells were collected (940 × g, 4°C, 5 min)
from the culture media. Subsequently, all collected cells were
sonicated and stored at −80°C until spectrophotometric analyses.
Data were normalized to protein concentration (BCA assay, Thermo
Fisher Scientific, Inc.) or cell number.
RNA isolation and reverse
transcription-quantitative polymerase chain reaction (RT-qPCR)
Total cellular RNA was extracted using
TRIzol® reagent (Invitrogen; Thermo Fisher Scientific,
Inc.) from the FFA-treated cells. RNA was reverse transcribed using
a cDNA Reverse Transcription kit (Applied Biosystems; Thermo Fisher
Scientific, Inc.). The gene expression levels of fatty acid
translocase (CD36), diacylglycerol O-acyltransferase 2 (DGAT2),
peroxisome proliferator-activated receptor gamma coactivator
1-alpha (PPARGC1A), carnitine palmitoyltransferase 1A (CPT1A),
peroxisome proliferator-activated receptor alpha gene (PPARA),
hydroxy acyl-CoA dehydrogenase trifunctional multienzyme complex
subunit alpha (HADHA), fatty acid synthase (FASN) and acyl-CoA
dehydrogenase (LCAD) were quantified using the TaqMan Gene
Expression probes, Hs00354519_m1, Hs01045913_m1, Hs00173304_m1,
Hs00912671_m1, Hs00947536_m1, Hs00426191_m1, Hs01005622_m1 and
Hs00155630_m1, respectively. The exact primer and probe sequences
for our TaqMan Assays are proprietary; thus, the primer/probe
sequences cannot be shared. However, the manufacturer provides the
'Context Sequence', which shows the sequence information of the
probe and the amplicon of a TaqMan Assay (Table SI). Gene expression was analyzed
using the Quant Studio 6 real-time PCR system (all obtained from
Applied Biosystems; Thermo Fisher Scientific, Inc.). Data were
normalized to polyubiquitin C RNA expression. mRNA levels were
calculated using the comparative Cq method (2-ΔΔCq method)
(35).
Statistical analysis
All experiments consisted of a minimum of three
independent replicates. Statistical analysis was performed using
GraphPad Prism 9.2.0 (GraphPad Software Inc.). Data are expressed
as the mean ± SD. Following normality tests, two-way ANOVA followed
by Tukey's post hoc multiple comparison tests was used to assess
significance among groups in different cell lines. One-way ANOVA
followed by Dunnett's post hoc multiple comparison tests was used
to determine significance among groups in each cell line. A P-value
<0.05 was considered to indicate a statistically significant
difference.
Results
FFAs stimulate mitochondrial respiration
and glycolysis in HepaRG cells, but not in HepG2 cells
Given that compared to cell lines, primary
hepatocytes are considered a 'gold standard' for cellular
metabolism studies (36), the
present study began by comparing mitochondrial respiration between
PRH, and HepaRG and HepG2 cell lines following exposure to FFAs
(the isolation process of the PRH is explained in Data S1). Firstly, the preliminary data
from mitochondrial respiratory parameters calculated from OCR
demonstrated that the FFA-treated PRH had a significantly lower
basal respiration, maximal respiration, spare respiratory activity,
proton leak and ATP-linked respiration, all compared to the
FFA-treated HepaRG cells (P<0.001) (Fig. S1). On the contrary, no
significant differences were found in the calculated mitochondrial
parameters between the FFA-treated PRH and HepG2 cells. The study
by Geng et al (28)
demonstrated that the PRH and HepG2 cells had corresponding
responses, including similar mitochondrial respiration after
exposure to palmitic acid. As both the PRH and HepG2 cells
exhibited a similar response concerning mitochondrial respiratory
parameters following exposure to FFAs, the present study focused on
comparing the HepaRG and HepG2 cells, particularly since they are
both human liver cancer cells.
Although it is essential to study TAG accumulation
and lipotoxicity caused by OA, PA, or combinations, assessing
cellular metabolism to develop representative 2D in vitro
models of NAFLD is equally vital. The present study primarily
focused on evaluating the OCR and extracellular acidification rate
(ECAR) following the exposure of the HepaRG and HepG2 cells to 1 mM
OA/PA (2/1) and 2 mM OA/PA (1/1). It was established that compared
to the FFA-treated HepG2 cells, the FFA-treated HepaRG cells had a
significantly increased basal respiration (P<0.01), maximal
respiration (P<0.01), spare respiratory activity (P<0.01),
proton leak (P<0.001) and ATP-linked respiration (P<0.001)
(Fig. 1). Accordingly, compared
to the control, the mitochondrial parameters stated above were all
significantly increased in the FFA-treated HepaRG cells. By
contrast, these mitochondrial parameters were significantly
decreased in the FFA-treated HepG2 cells compared with the control
(apart from the proton leak at 1 mM) (Fig. 1).
 | Figure 1Calculated parameters of
mitochondrial respiration in non-permeabilized HepaRG and HepG2
cells following exposure to free fatty acids. (A) Illustration of
measurements that were performed, (B) basal respiration [1-4], (C)
maximal respiration [3-4], (D) spare respiratory capacity
[(3-1)-4], (E) proton leak [2-4], (F) ATP production-linked
respiration [(1-2)-4]. Data are expressed as the mean ±
SD. Statistical analyses were carried out using two- and one-way
ANOVA followed by Tukey's and Dunnett's post hoc tests,
respectively. *P<0.05, **P<0.01 and
***P<0.001. ns, not significant (n=32, B-F). OCR,
oxygen consumption rate; OA, oleate; PA, palmitate; BSA, bovine
serum albumin; Oligo, oligomycin; FCCP, carbonyl
cyanide-p-trifluoromethoxyphenylhydrazone; Rot, rotenone; A,
antimycin A. |
As glycolysis is also an essential pathway in
cellular metabolism (37), the
present study measured the basal acidification caused by
glycolysis. It was found that glycolysis parameters calculated from
ECAR demonstrated that compared to the FFA-treated HepG2 cells, the
FFA-treated HepaRG cells had significantly increased basal and
compensatory glycolysis (P<0.001; Fig. 2A-C). Subsequently, compared to
the control, the aforementioned glycolysis parameters were
significantly increased in the FFA-treated HepaRG cells
(P<0.05). By contrast, these glycolysis parameters were
significantly decreased in FFA-treated HepG2 cells compared with
control (P<0.001). The data from OCR and ECAR in both cell lines
are summarized in a bioenergetic map shown in Fig. 2D.
 | Figure 2Calculated parameters of glycolysis
and the bioenergetic map of HepaRG and HepG2 cells following
exposure to free fatty acids. (A) Illustration of measurements that
were performed, (B) basal glycolysis [1], (C) compensatory
glycolysis [2], (D) bioenergetic map in the basal state. Data are
expressed as the mean ± SD. Statistical analyses were carried out
using two- and one-way ANOVA followed by Tukey's and Dunnett's post
hoc tests, respectively. *P<0.05,
**P<0.01 and ***P<0.001. (n=32, B-D).
ECAR, extracellular cellular acidification rate, glycoPER,
glycolysis proton efflux rate, OCR, oxygen consumption rate; OA,
oleate; PA, palmitate; BSA, bovine serum albumin; 2 DG,
2-deoxy-d-glucose. |
FFAs increase complex I and II-driven
respiration, and β-oxidation in HepaRG cells, but not in HepG2
cells
Having established that FFA stimulates mitochondrial
respiration in HepaRG cells, but not in HepG2 cells, the present
study then investigated which pathway leading into the Q-junction
may be responsible for causing these outcomes. Our previously
published studies on mouse models of NASH revealed a decreased
complex II-driven respiration (38,39). Therefore, the present study
evaluated OXPHOS, MRC and LEAK respiration in the presence of
complex I-driven respiration substrates [pyruvate/malate and
glutamate/malate (Fig. S2),
complex II-driven respiration substrate (succinate), and
β-oxidation substrates (PC/malate)]. It was found that compared to
the FFA-treated HepG2 cells, the FFA-treated HepaRG cells exhibited
a significantly increased OXPHOS [apart from 1 mM OA/PA (2/1)
β-oxidation] and MRC in the presence of complex I substrates and
β-oxidation (Fig. 3).
Accordingly, in comparison to the controls, the data revealed
stimulated complex I, II and β-oxidation driven OXPHOS in the
FFA-treated HepaRG cells (P<0.05; Fig. 3B). On the other hand, the
findings confirmed significantly decreased complex I, II and
β-oxidation-driven OXPHOS in the FFA-treated HepG2 cells, all
compared to the respective controls. The data also revealed that
complex I-driven respiration (Figs.
3 and S2) and β-oxidation
caused the highest LEAK respiration [>1.8-fold in the HepaRG
cells exposed to 1 mM OA/PA (2/1)]. However, complex II-driven
respiration in the HepaRG cells exposed to 1 mM OA/PA (2/1) did not
significantly increase LEAK respiration, as shown in Fig. 3D.
 | Figure 3Calculated parameters of
substrate-driven respiration in permeabilized HepaRG and HepG2
cells following exposure to free fatty acids. (A) Illustration of
measurements that were performed. Added substrates were P/M, S and
PC/M, (B) OXPHOS [state 3, (1-4)], (C) maximal respiratory capacity
[MRC, state 3u, (3-4)], (D) LEAK respiration [state 4o,
(2-4)]. Data are expressed as the mean ±
SD. Statistical analyses were carried out using one- or two-way
ANOVA followed by Dunnett and Tukey's post hoc tests, respectively.
*P<0.05, **P<0.01 and
***P<0.001. ns, not significant (n=8). P/M,
pyruvate/malate; S, succinate; PC/M, palmitoyl-carnitine/malate;
OXPHOS, oxidative phosphorylation; OCR, oxygen consumption rate;
Oligo, oligomycin; FCCP, carbonyl
cyanide-p-trifluoromethoxyphenylhydrazone; Rot, rotenone; A,
antimycin A. |
The activity of complexes I and II is
increased in FFA-treated HepaRG cells, but not in FFA-treated HepG2
cells
As other downstream mitochondrial respiratory
enzymes and the mitochondrial content may also influence complex I,
II-driven respiration and β-oxidation (31,40), the present study measured the
activity of complexes I, II, III, IV and CS enzymes. It was
confirmed that compared to the HepG2 cells, the HepaRG cells
exhibited a 20±4% (P<0.001) greater activity of CS [a marker of
mitochondrial content (41)]
(Fig. 4A). Following treatment
of the HepaRG cells with FFAs, their CS activity significantly
decreased by 15±5% compared to the controls. By contrast, compared
to the controls, the FFA-treated HepG2 cells demonstrated a 17±5%
increase in CS activity (P<0.05). Notably, the activity of
complex I was ~7-fold higher in the control HepG2 cells than in the
control HepaRG cells (Fig. 4B).
A high complex I activity is necessary for the proliferation of
some cancer cells (42). In the
present study, overall, complex I and II activity in the
FFA-treated HepaRG cells was significantly increased (P<0.05)
[apart from complex I in 1 mM OA/PA (2/1)]. On the contrary,
compared to the controls, complex I and II activities were
significantly decreased in the FFA-treated HepG2 cells (P<0.05).
There was no significant difference in complex III activity
compared to the control groups of both cell lines. As shown in
Fig. 4D, there was no
significant difference in complex III activity between the control
and FFA-treated HepaRG cells. By contrast, compared to the
controls, complex III activity was significantly decreased in the
FFA-treated HepG2 cells (P<0.05). Of note, complex IV activity
in the HepaRG cells was ~2.3-fold higher compared to the HepG2
cells (Fig. 4E). Complex IV
plays a key role in OXPHOS, and HepaRG cells depend more on OXPHOS
than HepG2 cells (43). There
was no significant difference in complex IV activity between the
control and FFA-treated HepaRG cells. On the other hand, in the
HepG2 cells, complex IV activity in 2 mM OA/PA (1/1) was
significantly decreased compared to the controls (Fig. 4E).
 | Figure 4Activities of mitochondrial
respiratory enzymes in HepaRG and HepG2 cells following exposure to
free fatty acids. (A) CS activity, (B) CI activity, (C) CII
activity, (D) CIII activity, (E) CIV activity. Data are expressed
as the mean ± SD. Statistical analyses were carried out using two-
and one-way ANOVA followed by Tukey's and Dunnett's post hoc tests,
respectively. *P<0.05, **P<0.01 and
***P<0.001. ns, not significant; (n=4). CS, citrate
synthase; CI, complex I; CII, complex II; CIII, complex III; CIV,
complex IV; OA, oleate; PA, palmitate; BSA, bovine serum
albumin. |
Exposure to FFAs disrupts the
mitochondrial morphology of both HepaRG and HepG2 cells
Given that exposure to FFAs may be associated with
alterations in mitochondrial morphology (5), the present study used TEM to
evaluate the number, size and ultrastructure of the mitochondria
among all groups (control and FFA-treated cells). In addition, TEM
was also used to evaluate the number and size of lipid droplets. It
was found that the control HepG2 cells had fewer large mitochondria
than the control HepaRG cells (Fig.
5). Exposure to FFAs altered the number, size and
ultrastructure of the mitochondria in both HepaRG and HepG2 cells.
Compared to the controls, HepaRG cells exposed to 1 mM OA/PA (2/1)
exhibited smaller mitochondria with moderately disordered cristae.
As shown in Fig. 5A, compared to
the controls, HepaRG cells exposed to 2 mM OA/PA (1/1) also had
smaller mitochondria, but with more disorganized cristae and
dilutions of the matrix. Compared to the controls, the FFA-treated
HepG2 cells exhibited numerous smaller mitochondria with disordered
cristae and dilutions of the matrix, particularly following
exposure to 2 mM OA/PA (1/1) (Fig
5B). In addition, it was confirmed that the quantity and size
of lipid droplets increased with the concentrations of FFA in both
cell lines (Fig. 5).
 | Figure 5Transmission electron microscopy
images of HepaRG and HepG2 cells following exposure to free fatty
acids. The control HepG2 cells had fewer large mitochondria than
the control HepaRG cells. FFA exposure altered the number, size and
ultrastructure of the mitochondria in both HepaRG and HepG2 cells.
(A) Compared to the controls, HepaRG cells exposed to 1 mM OA/PA
(2/1) had smaller mitochondria with moderately disordered cristae.
Compared to the controls, the HepaRG cells exposed to 2 mM OA/PA
(1/1) also had smaller mitochondria, but with more disorganized
cristae and dilutions of the matrix. (B) Compared to the controls,
FFA-treated HepG2 cells had numerous smaller mitochondria with
disordered cristae and dilutions of the matrix, particularly
following exposure to 2 mM OA/PA (1/1). In addition, it was
confirmed that the quantity and size of lipid droplets increased
with the concentrations of FFA in both cell lines. OA, oleate; PA,
palmitate; BSA, bovine serum albumin; N, nucleus. The scale bar of
all images on the left panel of (A and B) is 2 μm. The scale
bar of all images on the right panel of (A and B) is 500 nm. |
Lipotoxicity is induced to a greater
extent in FFA-treated HepaRG cells than in FFA-treated HepG2
cells
As alterations in mitochondrial respiration and
morphology are linked to lipotoxicity (5,44,45), the present study then evaluated
the markers of cell death, mitochondrial damage and ROS production
in both cell lines following exposure to FFAs. It was found that
compared to the FFA-treated HepG2 cells, the FFA-treated HepaRG
cells exhibited a significantly increased LDH leakage, caspase-3
activity and ROS production (P<0.001), as shown in Fig. 6A-D. In addition, the data
presented in Fig. 6E revealed a
decreased MMP in FFA-treated HepaRG cells compared to FFA-treated
HepG2 cells (P<0.01). Subsequently, compared to the controls, a
significantly increased LDH leakage, caspase-3 activity, caspase-9
activity and ROS production were observed in the FFA-treated HepaRG
cells. Notably, no significant differences were observed in LDH
leakage, caspase-3 activity, MMP and ROS production (apart from ROS
production at the 2 mM concentration) in the FFA-treated HepG2
cells. Caspase-9 activity in HepG2 cells is not shown as the level
was below the detection limits.
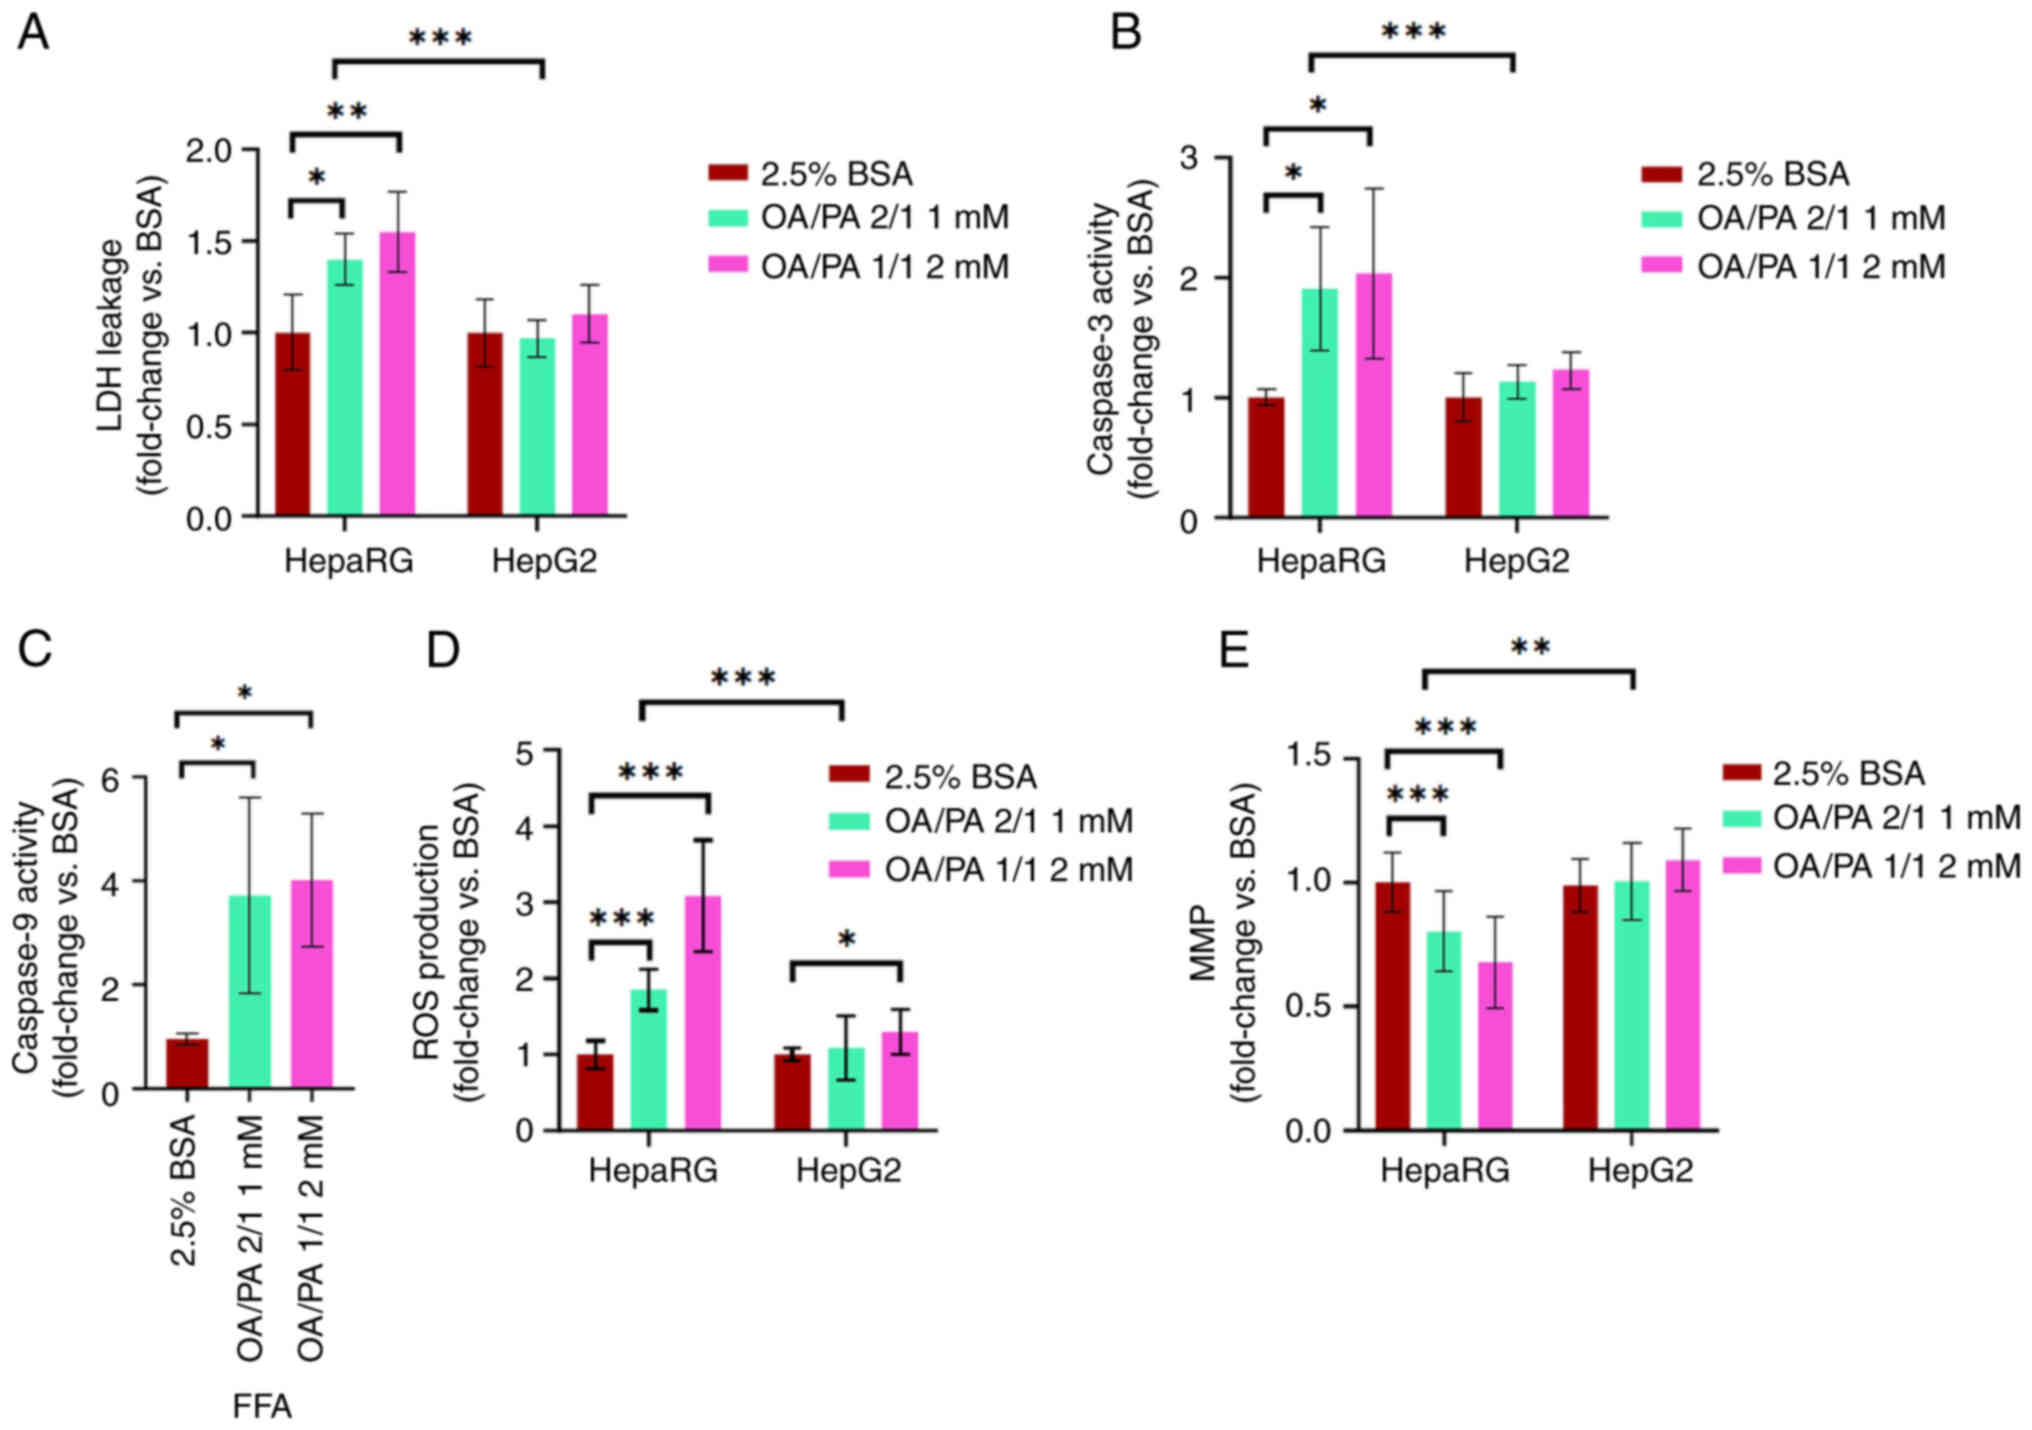 | Figure 6Lipotoxic effects of free fatty acids
on HepaRG and HepG2 cells. (A) LDH leakage, (B) caspase-3 activity,
(C) caspase-9 activity in HepaRG cells, (D) ROS production, (E)
MMP. Data are expressed as the mean ± SD. Statistical analyses were
carried out using two- and one-way ANOVA followed by Tukey's and
Dunnett's post hoc tests, respectively. *P<0.05,
**P<0.01 and ***P<0.001. (A-C) n=6 (D,
E) n=16. LDH, lactate dehydrogenase; ROS, reactive oxygen species;
MMP, mitochondrial membrane potential; OA, oleate; PA, palmitate;
BSA, bovine serum albumin. |
HepaRG cells accumulate less TAG than
HepG2 cells under the control and FFA-treated conditions
To confirm whether FFA exposure results in
intracellular lipid accumulation, TAG accumulation was visualized
and quantified in both cell lines following treatment with FFAs. It
was confirmed that both cell lines accumulated intracellular
lipids, even at a low concentration of 0.5 mM, as shown in Fig. 7A and B. However, the HepaRG cells
accumulated significantly less TAG than the HepG2 cells. Following
exposure to FFAs, the HepaRG cells accumulated 4-fold less TAG than
the HepG2 cells. To assess whether the differences in TAG
accumulation were caused by differences in FFA transport or TAG
production, the mRNA expression of the fatty acid translocase
(CD36) and the TAG synthesizing (FASN and DGAT2) genes was
measured. It was confirmed that the mRNA expression of the fatty
acid translocase (CD36), FASN and DGAT2 genes was similar in both
cell lines (Fig. 7C-E).
Subsequently, it was found that compared to other concentrations of
FFAs, the concentration that caused the highest TAG accumulation
without excessive cell death was 2 mM OA/PA (1/1) in both cell
lines (Fig. 7F and G). Although
2 mM OA led to the highest TAG accumulation in the HepaRG cells
(Fig. 7F), it was coupled with
excessive cell death (data not shown).
 | Figure 7Effects of free fatty acids on TAG
accumulation in HepaRG and HepG2 cells. (A) Lipid droplets were
stained with Oil Red O and visualized under a light microscope
(magnification, ×40). (B) TAG content in both cell lines (n=6).
Relative gene expression of (C) CD36, (D) DGAT2, and (E) FASN. (F)
TAG content of various FFAs in HepaRG cells. (G) TAG content of
various FFAs in HepG2 cells. Data are expressed as the mean ± SD.
Statistical analyses were carried out using two- and one-way ANOVA
followed by Tukey's and Dunnett's post hoc tests, respectively.
**P<0.01 and ***P<0.001. ns, not
significant. (C-E) n=6, (F, G) n=5. TAG, triacylglycerol; CD36,
fatty acid translocase gene; DGAT2, diacylglycerol
O-acyltransferase 2 gene; FASN, fatty acid synthase; OA, oleate;
PA, palmitate; BSA, bovine serum albumin. |
Genes regulating β-oxidation and
mitochondrial biogenesis are more highly expressed in HepaRG cells
than in HepG2 cells
To further assess TAG accumulation and lipid
metabolism in FFA-treated cells, the mRNA expression of genes
regulating β-oxidation and mitochondrial biogenesis was measured.
It was found that compared to the HepG2 cells, the HepaRG cells had
a higher mRNA expression of β-oxidation-regulating genes [CPT1A
(P<0.001), PPARA (P<0.05) and LCAD (P<0.001;
~10,000-fold)] and of the mitochondrial biogenesis-regulating gene
(PPARGC1; P<0.001) (Fig. 8A and
C-E). Moreover, compared to the controls, an increased mRNA
expression of HADHA (P<0.05) (Fig. 8B) and a slightly increased
expression of CPT1A (expression increased by <50%) were observed
in the FFA-treated HepaRG cells. By contrast, the mRNA expression
of HADHA and CPT1A in the FFA-treated HepG2 cells was the same as
that in the controls (apart from the CPT1A gene at 2 mM).
 | Figure 8Relative expression of β-oxidation
and mitochondrial biogenesis genes in HepaRG and HepG2 cells
following exposure to free fatty acids. (A) CPT1A, (B) HADHA, (C)
PPARA, (D) LCAD, and (E) PPARGC1A. Data are expressed as the mean ±
SD. Statistical analyses were carried out using two- and one-way
ANOVA followed by Tukey's and Dunnett's post hoc tests,
respectively. *P<0.05, **P<0.01 and
***P<0.001. ns, not significant. (A-E) n=6. CPT1A,
carnitine palmitoyltransferase 1A; HADHA, hydroxyacyl-CoA
dehydrogenase trifunctional multienzyme complex subunit alpha;
PPARA peroxisome proliferator-activated receptor alpha; LCAD,
acyl-CoA dehydrogenase; PPARGC1A, peroxisome proliferator-activated
receptor gamma coactivator 1-alpha; OA, oleate; PA, palmitate; BSA,
bovine serum albumin. |
Discussion
A greater variety and number of in vitro
models suitable for studying mitochondrial respiratory adaptations
following exposure to FFAs are required (13). The present study assessed
cellular energy metabolism, particularly mitochondrial respiration
and lipotoxicity in FFA-treated HepaRG and HepG2 cells. The
findings revealed that compared to the HepG2 cells, the HepaRG
cells were more suitable for studying mitochondrial respiratory
adaptations in the developed early model of NASH.
Mitochondria are an essential target for lipid
metabolism studies as they coordinate bioenergetic functions and
maintain cellular homeostasis by responding to changes in the
cellular environment, such as substrate flux and cellular stress
(26). There are contradictory
reports from in vitro, in vivo and clinical studies on
mitochondrial respiration in NAFLD (8,11). However, various clinical studies
have provided evidence of an augmented TCA flux, β-oxidation and
mitochondrial respiratory chain activity in patients with simple
steatosis or early-stage NASH (9,10). Although the majority of studies
using HepG2 cells have revealed a decreased mitochondrial
respiration following exposure to FFAs, the use of HepaRG cells has
not yet been fully explored (13). To that end, the present study
assessed and compared mitochondrial respiration, glycolysis,
mitochondrial morphology, ROS production, MMP, TAG accumulation,
and cell death markers in FFA-treated HepaRG and HepG2 cells. The
present study revealed that FFA-treated HepaRG cells exhibited an
increased mitochondrial respiration, glycolysis, mitochondrial
fragmentation, ROS production, TAG accumulation, cell death and
decreased MMP. The findings from the HepaRG cells are in accordance
with the majority of studies supporting an increased mitochondrial
respiration associated with a high ROS production in early-stage
NASH (8-10,46). They are also consistent with the
early-stage NASH model proposed by Feaver et al (47) which used a coculture of primary
human hepatocytes and nonparenchymal cells to show that stimulated
β-oxidation and ATP production occurred in parallel with
lipotoxicity following exposure to FFAs. On the other hand, herein,
the FFA-treated HepG2 cells exhibited a decreased mitochondrial
respiration, increased ROS production [2 mM OA/PA (1/1)],
mitochondrial fragmentation and TAG accumulation, with no change in
MMP and cell death. The findings demonstrating a decreased
mitochondrial respiration in FFA-treated HepG2 cells are in
accordance with those of previous studies, although the findings
regarding lipotoxicity are inconsistent (15,16,45,48).
The analyzed parameters in non-permeabilized cells
revealed that mitochondria in the HepaRG cells adapted to increased
lipid accumulation by stimulating basal and leak respiration, as an
attempt to reduce accumulated fats by increasing their oxidation
beyond the control of ATP synthase in coupled respiration.
Pharmacological agents uncoupling the mitochondrial respiration of
hepatocytes have been shown to reverse hepatic steatosis and
insulin resistance in a rodent model of NAFLD (49). Moreover, increased maximal
respiration, spare respiratory capacity and ATP-linked respiration
reflect the ability of FFA-treated HepaRG cells to cope with
exacerbated energy demands under acute cellular stress. At the same
time, the FFA-treated HepG2 cells and PRH (Fig. S1) may not cope with the
increased cellular energy demands due to a decreased ATP content, a
feature observed in the late stages of NASH (50). Experiments using permeabilized
cells corroborated the findings from non-permeabilized cells by
showing increased complex I, and II-driven respiration in
FFA-treated HepaRG cells. Although the activities of complexes III
and IV did not differ significantly among the groups, increased
complex I and II activity likely stimulated complex I and II-driven
respiration in FFA-treated HepaRG cells. In addition, it was also
affirmed that complex I-driven respiration and β-oxidation (PC/M)
are likely responsible for increasing ROS production as they had
the most LEAK-driven respiration compared to complex II-driven LEAK
respiration. An increased leak respiration reflects an electron
leak linked to ROS production (51). Although there are various ROS
producers within the mitochondria, complex I, III and β-oxidation
have been identified as some of the significant ROS production
sites (52,53). The stimulated β-oxidation in the
presence of PC/malate was also supported by increased expression of
the genes controlling β-oxidation in FFA-treated HepaRG cells.
Knockout studies have demonstrated that mice lacking the HADHA gene
have a decreased β-oxidation (54). By contrast, HepG2 cells exposed
to FFAs showed decreased complex I and II driven respiration,
confirmed by decreased activities of complexes I, II, III and IV
[apart from 1 mM OA/PA (2/1)]. The findings from HepG2 cells are in
accordance with those of previous studies showing decreased complex
I, II, III, and IV activities in FFA-treated HepG2 cells (16,45). In addition, analysis from ECAR
confirmed that HepG2 cells have significantly higher glycolysis
than HepaRG cells (55,56). Glycolysis was stimulated in
FFA-treated HepaRG cells, but not in FFA-treated HepG2 cells. High
glycolysis in cancer cells may also explain their increased complex
I activity, which may be necessary to maintain a favorable
NAD+/NADH ratio to drive glycolysis and cell
proliferation (42,57). Accordingly, the findings from
HepaRG cells are in accordance with those from mice on a high-fat
diet, demonstrating the concurrent stimulation of β-oxidation,
glycolysis (58) and ROS
production (59). All these
findings suggest that FFA-treated HepaRG cells displayed the
critical adaptive mechanism of 'mitochondrial flexibility'. By
contrast, FFA-treated HepG2 cells failed to show this vital
mechanism under the current conditions. A progressive loss of
'mitochondrial flexibility' has been implicated in developing and
progressing obesity-related comorbidities such as NAFLD (26).
Despite the attempts to decrease TAG accumulation by
increasing mitochondrial respiration, in the long run,
mitochondrial adaptations are insufficient to prevent lipotoxicity
(5). This occurs as the adaptive
responses also favor augmented ROS production. After all, more
electrons enter the mitochondrial respiratory chain, likely
increasing their chances of inappropriately reacting with molecular
oxygen and causing mitochondrial and cellular damage (5). On that note, various attempts have
been made to develop mitochondrial-targeted antioxidants, and some
of these compounds have shown promising results in in vitro
and in vivo NAFLD studies (60,61). An increased ROS production in
FFA-treated HepaRG cells resulted in mitochondrial damage by
increasing mitochondrial fragmentation, distorting cristae,
decreasing mitochondrial content and inducing apoptosis. Although
excessive mitochondrial fragmentation is detrimental, it is also
associated with adaptive responses as it activates fatty acid
β-oxidation and mitophagy (62).
Exposure to FFAs has been shown to be associated with increased
mitochondrial fission proteins and decreased fusion proteins in
HepG2 cells (44,45,48). For HepaRG cells, 24-h exposure to
FFAs was ideal as it allowed the authors to capture the coexistence
of physiologically incompatible processes (in the long run), such
as stimulated mitochondrial respiration and mitochondrial damage.
After all, prolonged exposure to FFAs will eventually cause severe
damage to the mitochondria and lead to a decline in mitochondrial
respiration followed by cellular demise. On the other hand, it was
surprising to observe that a significant decline in mitochondrial
respiration in FFA-treated HepG2 cells did not result in more
severe mitochondria damage and decreased cell viability. It is
possible that the methods used to evaluate cell death in the
present study may not have been as sensitive as those used in
previous studies (45,48). Of note, the study by Doczi et
al (63) demonstrated that
the viability of HepG2 cells was not decreased by the complete
inhibition of mitochondrial respiration. Nonetheless, in agreement
with the study by Amorim et al (15), the FFA-treated HepG2 cells
exhibited compensatory mitochondrial proliferation marked by the
increased expression of the PPARGC1A gene and citrate synthase
activity, secondary to excessive mitochondrial damage. The
disruptions mentioned above are a mark of lipotoxicity, a complex
process involving the deleterious effects of FFAs and
FFA-intermediates, leading to oxidative stress, inflammation,
insulin resistance, and cell death (NAFLD progression) (64).
Hepatic lipid accumulation is the hallmark of NAFLD
(21), and the present study
confirmed an associated increase in TAG accumulation with the
increased concentrations of FFAs in both cell lines. However, the
HepaRG cells had a 4-fold lower TAG content than the HepG2 cells.
The expression of FFA transporter and TAG synthesis genes was
similar in both cell lines; therefore, it could not provide a
plausible reason. On the other hand, compared to the HepG2 cells,
the HepaRG cells had a higher expression of β-oxidation regulating
genes and mitochondrial content. As previously demonstrated, LCAD
gene knockout mice develop hepatic steatosis due to decreased
β-oxidation (65). Based on the
current data, it was speculated that compared to the HepG2 cells,
the HepaRG cells could decrease their relatively low TAG content by
increasing β-oxidation, particularly since they have more
mitochondria than HepG2 cells. Finally, the difference in the TAG
content may also be explained by the difference in energy substrate
preference. As the HepG2 cells are more glycolytic (55,56), they may preferably use glucose as
the energy substrate over fatty acids. Although the present study
provided possible speculations on the differences in TAG between
these cell lines, it is worth noting that there are other plausible
reasons described in the literature that may also contribute to
this finding, namely the decreased secretion of low-density
lipoproteins, low TAG hydrolyzing enzymes and genetic mutations
(PNPLA3|148 M) observed in HepG2 cells (13).
Although the HepaRG cells provided similar findings
to clinical studies of early NASH, it is also equally essential to
highlight that 2D culture models are limited to optimally represent
the microenvironment of hepatocytes in vivo (13). Therefore, this model could be
further improved using cocultures or 3D cultures to improve its
reliability.
In conclusion, the present study demonstrated that
the HepaRG and HepG2 cells adapted differently to exposure to FFAs.
It was revealed that stimulated mitochondrial respiration was
associated with lipotoxicity in FFA-treated HepaRG cells, but not
in FFA-treated HepG2 cells. These findings suggest that the HepaRG
cells are more suitable for assessing mitochondrial respiratory
adaptations in the developed in vitro model of early-stage
NASH.
Supplementary Data
Availability of data and materials
The datasets used and/or analyzed during the
current study are available from the corresponding author on
reasonable request.
Authors' contributions
TEM, ME, PŽ, ZČ and OK were involved in the
conception and design of the study. TEM, ME, EP, PS, JM, JD, PŽ, DČ
and AB were involved in data acquisition. TEM, HL and OK were
involved in the writing of the original draft. TEM, ME, EP, HL, PS,
JM, JD, PŽ, PP, ZČ and OK were involved in review and editing the
manuscript. TEM and OK were involved in funding acquisition. TEM,
ME, EP, PS, JM, JD, PŽ, PP, DČ and AB were involved in the
investigative aspects of the study. TEM, ME, EP, PS, JM, JD, PŽ,
PP, DČ, AB, ZČ and OK were involved in the study methodology. TEM,
PP, ZČ and OK were involved in project administration. PP, ZČ and
OK supervised the study. ME, EP, HL, JD, PŽ, PP and OK were
involved in data validation. TEM, PS and OK confirm the
authenticity of all the raw data. All authors have read and
approved the final version of the manuscript.
Ethics approval and consent to
participate
The isolation of primary rat hepatocytes was
approved by the Animal-welfare Body of the Charles University
(Hradec Kralove, Czech Republic) and the Ministry of Education,
Youth and Sports (approval no. MSMT-11265/2022-3).
Patient consent for publication
Not applicable.
Competing interests
The authors declare that they have no competing
interests.
Abbreviations:
|
BSA
|
bovine serum albumin
|
|
CPT1A
|
carnitine palmitoyltransferase 1A
|
|
CS
|
citrate synthase
|
|
DGAT2
|
diacylglycerol O-acyltransferase
2
|
|
ECAR
|
extracellular acidification rate
|
|
FASN
|
fatty acid synthase
|
|
FCCP
|
carbonyl cyanide-4-(trifluoromethoxy)
phenylhydrazone
|
|
FFA
|
free fatty acid
|
|
HADHA
|
hydroxy acyl-CoA dehydrogenase
trifunctional multienzyme complex subunit alpha
|
|
LCAD
|
acyl-CoA dehydrogenase
|
|
LDH
|
lactate dehydrogenase
|
|
MMP
|
mitochondrial membrane potential
|
|
MRC
|
maximal respiratory capacity
|
|
NADH
|
nicotinamide adenine dinucleotide
|
|
NAFLD
|
non-alcoholic fatty liver disease
|
|
NASH
|
non-alcoholic steatohepatitis
|
|
OA
|
sodium oleate
|
|
OCR
|
oxygen consumption rate
|
|
OXPHOS
|
oxidative phosphorylation
|
|
PA
|
sodium palmitate
|
|
PC
|
palmitoyl-carnitine
|
|
PPARA
|
peroxisome proliferator-activated
receptor alpha gene
|
|
PPARGC1A
|
peroxisome proliferator-activated
receptor gamma coactivator 1-alpha
|
|
PRH
|
primary rat hepatocytes
|
|
ROS
|
reactive oxygen species
|
|
TAG
|
triacylglycerol
|
|
TEM
|
transmission electron microscopy
|
Acknowledgments
Not applicable.
Funding
The present study was supported by the Grant Agency of the
Charles University (GA UK no. 336221 and SVV-2023-260656) and the
INOMED project CZ.02.1.01/0.0/0.0/18_069/00100 46, funded by the
Ministry of Education, Youth and Sports of the Czech Republic and
by the European Union.
References
|
1
|
Younossi ZM, Koenig AB, Abdelatif D, Fazel
Y, Henry L and Wymer M: Global epidemiology of nonalcoholic fatty
liver disease-meta-analytic assessment of prevalence, incidence,
and outcomes. Hepatology. 64:73–84. 2016.
|
|
2
|
Anderson EL, Howe LD, Jones HE, Higgins
JPT, Lawlor DA and Fraser A: The prevalence of non-alcoholic fatty
liver disease in children and adolescents: A systematic review and
meta-analysis. PLoS One. 10:e01409082015.
|
|
3
|
Maurice J and Manousou P: Non-alcoholic
fatty liver disease. Clin Med (Lond). 18:245–250. 2018.
|
|
4
|
Chitturi S, Abeygunasekera S, Farrell GC,
Holmes-Walker J, Hui JM, Fung C, Karim R, Lin R, Samarasinghe D,
Liddle C, et al: NASH and insulin resistance: Insulin
hypersecretion and specific association with the insulin resistance
syndrome. Hepatology. 35:373–379. 2002.
|
|
5
|
Simões ICM, Fontes A, Pinton P, Zischka H
and Wieckowski MR: Mitochondria in non-alcoholic fatty liver
disease. Int J Biochem Cell Biol. 95:93–99. 2018.
|
|
6
|
Nassir F and Ibdah JA: Role of
mitochondria in nonalcoholic fatty liver disease. Int J Mol Sci.
15:8713–8742. 2014.
|
|
7
|
Lu Q, Tian X, Wu H, Huang J, Li M, Mei Z,
Zhou L, Xie H and Zheng S: Metabolic changes of hepatocytes in
NAFLD. Front Physiol. 12:7104202021.
|
|
8
|
Sunny NE, Bril F and Cusi K: Mitochondrial
adaptation in nonalcoholic fatty liver disease: Novel mechanisms
and treatment strategies. Trends Endocrinol Metabolism. 28:250–260.
2017.
|
|
9
|
Koliaki C, Szendroedi J, Kaul K, Jelenik
T, Nowotny P, Jankowiak F, Herder C, Carstensen M, Krausch M,
Knoefel WT, et al: Adaptation of hepatic mitochondrial function in
humans with non-alcoholic fatty liver is lost in steatohepatitis.
Cell Metab. 21:739–746. 2015.
|
|
10
|
Satapati S, Sunny NE, Kucejova B, Fu X, He
TT, Méndez-Lucas A, Shelton JM, Perales JC, Browning JD and Burgess
SC: Elevated TCA cycle function in the pathology of diet-induced
hepatic insulin resistance and fatty liver. J Lipid Res.
53:1080–1092. 2012.
|
|
11
|
Begriche K, Massart J, Robin MA, Bonnet F
and Fromenty B: Mitochondrial adaptations and dysfunctions in
nonalcoholic fatty liver disease. Hepatology. 58:1497–1507.
2013.
|
|
12
|
Green CJ, Parry SA, Gunn PJ, Ceresa CDL,
Rosqvist F, Piche ME and Hodson L: Studying non-alcoholic fatty
liver disease: The ins and outs of in vivo, ex vivo and in vitro
human models. Horm Mol Biol Clin Investig. 41: View Article : Google Scholar : 2018.
|
|
13
|
Ramos MJ, Bandiera L, Menolascina F and
Fallowfield JA: In vitro models for non-alcoholic fatty liver
disease: Emerging platforms and their applications. iScience.
25:1035492022.
|
|
14
|
Green CJ, Johnson D, Amin HD, Sivathondan
P, Silva MA, Wang LM, Stevanato L, McNeil CA, Miljan EA, Sinden JD,
et al: Characterization of lipid metabolism in a novel immortalized
human hepatocyte cell line. Am J Physiol Endocrinol Metab.
309:E511–E522. 2015.
|
|
15
|
Amorim R, Simões ICM, Veloso C, Carvalho
A, Simões RF, Pereira FB, Thiel T, Normann A, Morais C, Jurado AS,
et al: Exploratory data analysis of cell and mitochondrial
high-fat, high-sugar toxicity on human HepG2 cells. Nutrients.
13:17232021.
|
|
16
|
Garcia-Ruiz I, Solis-Munoz P,
Fernandez-Moreira D, Munoz-Yague T and Solis-Herruzo JA: In vitro
treatment of HepG2 cells with saturated fatty acids reproduces
mitochondrial dysfunction found in nonalcoholic steatohepatitis.
Dis Model Mech. 8:183–191. 2015.
|
|
17
|
Pérez-Carreras M, Del Hoyo P, Martín MA,
Rubio JC, Martín A, Castellano G, Colina F, Arenas J and
Solis-Herruzo JA: Defective hepatic mitochondrial respiratory chain
in patients with nonalcoholic steatohepatitis. Hepatology.
38:999–1007. 2003.
|
|
18
|
Donato MT, Tolosa L and Gómez-Lechón MJ:
Culture and functional characterization of human hepatoma HepG2
cells. Methods Mol Biol. 1250:77–93. 2015.
|
|
19
|
Gibbons GF, Khurana R, Odwell A and
Seelaender MC: Lipid balance in HepG2 cells: Active synthesis and
impaired mobilization. J Lipid Res. 35:1801–1808. 1994.
|
|
20
|
Tascher G, Burban A, Camus S, Plumel M,
Chanon S, Le Guevel R, Shevchenko V, Van Dorsselaer A, Lefai E,
Guguen-Guillouzo C and Bertile F: In-depth proteome analysis
highlights HepaRG cells as a versatile cell system surrogate for
primary human hepatocytes. Cells. 8:1922019.
|
|
21
|
Berlanga A, Guiu-Jurado E, Porras JA and
Auguet T: Molecular pathways in non-alcoholic fatty liver disease.
Clin Exp Gastroenterol. 7:221–239. 2014.
|
|
22
|
Zhou Y, Orešič M, Leivonen M,
Gopalacharyulu P, Hyysalo J, Arola J, Verrijken A, Francque S, Van
Gaal L, Hyötyläinen T and Yki-Järvinen H: Noninvasive detection of
nonalcoholic steatohepatitis using clinical markers and circulating
levels of lipids and metabolites. Clin Gastroenterol Hepatol.
14:1463–1472.e6. 2016.
|
|
23
|
Donnelly KL, Smith CI, Schwarzenberg SJ,
Jessurun J, Boldt MD and Parks EJ: Sources of fatty acids stored in
liver and secreted via lipoproteins in patients with nonalcoholic
fatty liver disease. J Clin Invest. 115:1343–1351. 2005.
|
|
24
|
Ipsen DH, Lykkesfeldt J and Tveden-Nyborg
P: Molecular mechanisms of hepatic lipid accumulation in
non-alcoholic fatty liver disease. Cell Mol Life Sci. 75:3313–3327.
2018.
|
|
25
|
Geng Y, Faber KN, de Meijer VE, Blokzijl H
and Moshage H: How does hepatic lipid accumulation lead to
lipotoxicity in non-alcoholic fatty liver disease? Hepatol Int.
15:21–35. 2021.
|
|
26
|
Tsilingiris D, Tzeravini E, Koliaki C,
Dalamaga M and Kokkinos A: The role of mitochondrial adaptation and
metabolic flexibility in the pathophysiology of obesity and insulin
resistance: An updated overview. Curr Obes Rep. 10:191–213.
2021.
|
|
27
|
Stefela A, Kaspar M, Drastik M, Holas O,
Hroch M, Smutny T, Skoda J, Hutníková M, Pandey AV, Micuda S, et
al: 3β-Isoobeticholic acid efficiently activates the farnesoid X
receptor (FXR) due to its epimerization to 3α-epimer by hepatic
metabolism. J Steroid Biochem Mol Biol. 202:1057022020.
|
|
28
|
Geng Y, Villanueva AH, Oun A, Buist-Homan
M, Blokzijl H, Faber KN, Dolga A and Moshage H: Protective effect
of metformin against palmitate-induced hepatic cell death. Biochim
Biophys Acta. 1866:1656212020.
|
|
29
|
Elkalaf M, Vaněčková K, Staňková P,
Červinková Z, Polák J and Kučera O: Measuring mitochondrial
substrate flux in recombinant Perfringolysin O-Permeabilized cells.
J Vis Exp. 13: View
Article : Google Scholar : 2021.
|
|
30
|
Iuso A, Repp B, Biagosch C, Terrile C and
Prokisch H: Assessing mitochondrial bioenergetics in isolated
mitochondria from various mouse tissues using seahorse XF96
analyzer. Methods Mol Biol. 1567:217–230. 2017.
|
|
31
|
Spinazzi M, Casarin A, Pertegato V,
Salviati L and Angelini C: Assessment of mitochondrial respiratory
chain enzymatic activities on tissues and cultured cells. Nat
Protoc. 7:1235–1246. 2012.
|
|
32
|
Elkalaf M, Tůma P, Weiszenstein M, Polák J
and Trnka J: Mitochondrial probe methyltriphenylphosphonium (TPMP)
inhibits the krebs cycle Enzyme 2-Oxoglutarate Dehydrogenase. PLoS
One. 11:e01614132016.
|
|
33
|
Cechakova L, Ondrej M, Pavlik V, Jost P,
Cizkova D, Bezrouk A, Pejchal J, Amaravadi RK, Winkler JD and Tichy
A: A potent autophagy inhibitor (Lys05) enhances the impact of
ionizing radiation on human lung cancer cells H1299. Int J Mol Sci.
20:58812019.
|
|
34
|
Kucera O, Endlicher R, Rousar T, Lotkova
H, Garnol T, Drahota Z and Cervinková Z: The effect of tert-butyl
hydroperoxide-induced oxidative stress on lean and steatotic rat
hepatocytes in vitro. Oxid Med Cell Longev. 2014:7525062014.
|
|
35
|
Livak KJ and Schmittgen TD: Analysis of
relative gene expression data using real-time quantitative PCR and
the 2(-Delta Delta C(T)) method. Methods. 25:402–408. 2001.
|
|
36
|
Nagarajan SR, Paul-Heng M, Krycer JR,
Fazakerley DJ, Sharland AF and Hoy AJ: Lipid and glucose metabolism
in hepatocyte cell lines and primary mouse hepatocytes: A
comprehensive resource for in vitro studies of hepatic metabolism.
Am J Physiol Endocrinol Metab. 316:E578–E589. 2019.
|
|
37
|
Judge A and Dodd MS: Metabolism. Essays
Biochem. 64:607–647. 2020.
|
|
38
|
Staňková P, Kučera O, Peterová E, Lotková
H, Maseko TE, Nožičková K and Červinková Z: Adaptation of
mitochondrial substrate flux in a mouse model of nonalcoholic fatty
liver disease. Int J Mol Sci. 21:11012020.
|
|
39
|
Staňková P, Kučera O, Peterová E, Elkalaf
M, Rychtrmoc D, Melek J, Podhola M, Zubáňová V and Červinková Z:
Western diet decreases the liver mitochondrial oxidative flux of
succinate: Insight from a Murine NAFLD model. Int J Mol Sci.
22:69082021.
|
|
40
|
Pfleger J: Measurements of mitochondrial
respiration in intact cells, permeabilized cells, and isolated
tissue mitochondria using the seahorse XF analyzer. Methods Mol
Biol. 2497:185–206. 2022.
|
|
41
|
Larsen S, Nielsen J, Hansen CN, Nielsen
LB, Wibrand F, Stride N, Schroder HD, Boushel R, Helge JW, Dela F
and Hey-Mogensen M: Biomarkers of mitochondrial content in skeletal
muscle of healthy young human subjects. J Physiol. 590:3349–3360.
2012.
|
|
42
|
Urra FA, Muñoz F, Lovy A and Cárdenas C:
The mitochondrial complex(I)ty of cancer. Front Oncol.
7:1182017.
|
|
43
|
Peyta L, Jarnouen K, Pinault M, Guimaraes
C, Pais de Barros JP, Chevalier S, Dumas JF, Maillot F, Hatch GM,
Loyer P and Servais S: Reduced cardiolipin content decreases
respiratory chain capacities and increases ATP synthesis yield in
the human HepaRG cells. Biochim Biophys Acta. 1857:443–453.
2016.
|
|
44
|
de Sousa IF, Migliaccio V, Lepretti M,
Paolella G, Di Gregorio I, Caputo I, Ribeiro EB and Lionetti L:
Dose- and time-dependent effects of oleate on mitochondrial
Fusion/Fission proteins and cell viability in HepG2 cells:
Comparison with palmitate effects. Int J Mol Sci. 22:98122021.
|
|
45
|
Sasi US, Sindhu G and Raghu KG:
Fructose-palmitate based high calorie induce steatosis in HepG2
cells via mitochondrial dysfunction: An in vitro approach. Toxicol
In Vitro. 68:1049522020.
|
|
46
|
Grasselli E, Baldini F, Vecchione G,
Oliveira PJ, Sardão VA, Voci A, Portincasa P and Vergani L: Excess
fructose and fatty acids trigger a model of non-alcoholic fatty
liver disease progression in vitro: Protective effect of the
flavonoid silybin. Int J Mol Med. 44:705–712. 2019.
|
|
47
|
Feaver RE, Cole BK, Lawson MJ, Hoang SA,
Marukian S, Blackman BR, Figler RA, Sanyal AJ, Wamhoff BR and Dash
A: Development of an in vitro human liver system for interrogating
nonalcoholic steatohepatitis. JCI Insight. 1:e909542016.
|
|
48
|
Longhitano L, Distefano A, Amorini AM,
Orlando L, Giallongo S, Tibullo D, Lazzarino G, Nicolosi A, Alanazi
AM, Saoca C, et al: (+)-lipoic acid reduces lipotoxicity and
regulates mitochondrial homeostasis and energy balance in an in
vitro model of liver steatosis. Int J Mol Sci. 24:144912023.
|
|
49
|
Perry RJ, Kim T, Zhang XM, Lee HY, Pesta
D, Popov VB, Zhang D, Rahimi Y, Jurczak MJ, Cline GW, et al:
Reversal of hypertriglyceridemia, fatty liver disease, and insulin
resistance by a liver-targeted mitochondrial uncoupler. Cell Metab.
18:740–748. 2013.
|
|
50
|
Serviddio G, Bellanti F, Tamborra R, Rollo
T, Romano AD, Giudetti AM, Capitanio N, Petrella A, Vendemiale G
and Altomare E: Alterations of hepatic ATP homeostasis and
respiratory chain during development of non-alcoholic
steatohepatitis in a rodent model. Eur J Clin Invest. 38:245–252.
2008.
|
|
51
|
Jastroch M, Divakaruni AS, Mookerjee S,
Treberg JR and Brand MD: Mitochondrial proton and electron leaks.
Essays Biochem. 47:53–67. 2010.
|
|
52
|
Zorov DB, Juhaszova M and Sollott SJ:
Mitochondrial reactive oxygen species (ROS) and ROS-induced ROS
release. Physiol Rev. 94:909–950. 2014.
|
|
53
|
Zhao RZ, Jiang S, Zhang L and Yu ZB:
Mitochondrial electron transport chain, ROS generation and
uncoupling (Review). Int J Mol Med. 44:3–15. 2019.
|
|
54
|
Nassir F, Arndt JJ, Johnson SA and Ibdah
JA: Regulation of mitochondrial trifunctional protein modulates
nonalcoholic fatty liver disease in mice. J Lipid Res. 59:967–973.
2018.
|
|
55
|
Kamalian L, Douglas O, Jolly CE, Snoeys J,
Simic D, Monshouwer M, Williams DP, Park BK and Chadwick AE: The
utility of HepaRG cells for bioenergetic investigation and
detection of drug-induced mitochondrial toxicity. Toxicol In Vitro.
53:136–147. 2018.
|
|
56
|
Porceddu M, Buron N, Rustin P, Fromenty B
and Borgne-Sanchez A: In vitro assessment of mitochondrial toxicity
to predict drug-induced liver injury. Methods Pharmacol Toxicol.
21:283–300. 2018.
|
|
57
|
Calabrese C, Iommarini L, Kurelac I,
Calvaruso MA, Capristo M, Lollini PL, Nanni P, Bergamini C,
Nicoletti G, Giovanni CD, et al: Respiratory complex I is essential
to induce a Warburg profile in mitochondria-defective tumor cells.
Cancer Metab. 1:112013.
|
|
58
|
Ye JH, Chao J, Chang ML, Peng WH, Cheng
HY, Liao JW and Pao LH: Pentoxifylline ameliorates non-alcoholic
fatty liver disease in hyperglycaemic and dyslipidaemic mice by
upregulating fatty acid β-oxidation. Sci Rep. 6:331022016.
|
|
59
|
Liemburg-Apers DC, Willems PH, Koopman WJ
and Grefte S: Interactions between mitochondrial reactive oxygen
species and cellular glucose metabolism. Arch Toxicol.
89:1209–1226. 2015.
|
|
60
|
Zheng Y, Wang S, Wu J and Wang Y:
Mitochondrial metabolic dysfunction and non-alcoholic fatty liver
disease: New insights from pathogenic mechanisms to clinically
targeted therapy. J Transl Med. 21:5102023.
|
|
61
|
Amorim R, Simões ICM, Teixeira J, Cagide
F, Potes Y, Soares P, Carvalho A, Tavares LC, Benfeito S, Pereira
SP, et al: Mitochondria-targeted anti-oxidant AntiOxCIN(4) improved
liver steatosis in Western diet-fed mice by preventing lipid
accumulation due to upregulation of fatty acid oxidation, quality
control mechanism and antioxidant defense systems. Redox Biol.
55:1024002022.
|
|
62
|
Chen W, Zhao H and Li Y: Mitochondrial
dynamics in health and disease: Mechanisms and potential targets.
Signal Transduct Target Ther. 8:3332023.
|
|
63
|
Doczi J, Karnok N, Bui D, Azarov V, Pallag
G, Nazarian S, Czumbel B, Seyfried TN and Chinopoulos C: Viability
of HepG2 and MCF-7 cells is not correlated with mitochondrial
bioenergetics. Sci Rep. 13:108222023.
|
|
64
|
Engin AB: What is lipotoxicity? Adv Exp
Med Biol. 960:197–220. 2017.
|
|
65
|
Zhang D, Liu ZX, Choi CS, Tian L, Kibbey
R, Dong J, Cline GW, Wood PA and Shulman GI: Mitochondrial
dysfunction due to long-chain Acyl-CoA dehydrogenase deficiency
causes hepatic steatosis and hepatic insulin resistance. Proc Natl
Acad Sci USA. 104:17075–17080. 2007.
|


