Introduction
As the most commonly occurring urological neoplasms,
renal cell carcinomas (RCCs) are almost always detected at middle
or advanced stages. Even among localized RCCs that are usually
defined as early-stage disease, 20-30% of cases metastasize within
1-2 years following surgery (1).
Nephrectomy alone is ineffective as a treatment, and systemic
therapy is therefore imperative for these advanced and metastatic
RCCs. In-depth investigation of the von Hippel-Lindau
(VHL)/hypoxia-inducible factor (HIF) hypoxia-response pathway in
RCC has led to significant progress in identifying potential
molecular drug targets (2). For
example, patients with advanced RCC are known to benefit much more
from sunitinib treatment compared with interferon-α therapy in
terms of survival and disease control (3). Although targeted therapy has now
become the standard treatment for advanced RCC, there are clear
limitations to this practice, particularly its low disease control
objective response rate. In addition, the mechanisms regulating RCC
growth remain unclear. Consequently, there is an urgent need to
investigate the mechanisms underlying tumor growth and to identify
novel treatment targets.
Approximately 70-80% of RCC cases involve clear cell
RCC (ccRCC) (4). Mutations or
heterozygous deletions of the tumor suppressor gene, VHL,
are known to occur in the majority of ccRCCs, leading to reduced
expression of VHL protein (pVHL). pVHL is able to specifically bind
to HIF and induce its ubiquitination under physiological
conditions, and also under hypoxic conditions; low expression
levels of VHL can also lead to HIF accumulation (2,5). HIF
is a nuclear transcription factor with a crucial regulatory
function in activation of downstream hypoxia-responsive genes via
promoter regions containing hypoxic response elements (HREs).
Hence, HIF accumulation activates downstream genes, including
vascular endothelial growth factor (VEGF), transforming
growth factor-α and platelet-derived growth factor, which have
important roles in tumor growth and progression (2,6).
Bcl-2/adenovirus E1B 19 kDa interacting protein 3
(BNIP3) is a mitochondrial proapoptotic protein, and an important
apoptotic regulator that belongs to the B-cell lymphoma 2 (Bcl-2)
protein family (7). As the only
members of the Bcl-2 family with promoters containing HREs, BNIP3
and BNIP3-like protein (BNIP3L) may be activated by HIF under
hypoxic conditions, and subsequently contribute to hypoxia-induced
cell death via mechanisms including apoptosis, necrosis and
autophagy (8).
The majority of RCCs are solid tumors in which
hypoxic-ischemic areas inevitably develop (9-12),
potentially leading to HIF accumulation. In addition, as VHL
inactivation occurs in the majority of ccRCCs, even without hypoxic
stimulation, HIF may still accumulate abnormally. As a gene
downstream of HIF, BNIP3 was originally anticipated to be
activated in RCC; however, a recent study demonstrated low levels
of BNIP3 expression in ccRCC, inconsistent with the high
levels of HIF observed in these cancers, suggesting that a
different mechanism may inhibit the expression of BNIP3 in
this context (13).
Only a limited number of studies have been performed
to assess the role of BNIP3 in RCC, and the mechanisms underlying
its downregulation in these tumors have yet to be elucidated. In
the present study, the expression of BNIP3 in RCC tissue
samples and cell lines was investigated. The methylation and
histone deacetylation status of BNIP3 in RCC was also
examined, and the levels of cell proliferation and apoptosis
following treatment with methylation or histone deacetylase
inhibitors were investigated in order to clarify the function of
BNIP3 in RCC, and to investigate its potential as a novel treatment
target for RCC.
Materials and methods
Tissue samples and clinical data
Samples from 30 patients, diagnosed pathologically
with ccRCC between September 2012 and March 2013, and adjacent
non-tumor samples, were provided by the Department of Urology of
West China Hospital (Chengdu, China). Samples were used according
to ethical guidelines and procedures approved by the West China
Hospital of Sichuan University Biomedical Research Ethics
Committee. After examination by a pathologist, tissue samples were
preserved immediately in liquid nitrogen. The present study
comprised 19 males and 11 females, aged 47-71 years of age (with 8
cases >65 years of age); all patients were untreated prior to
surgery. According to the staging system of the American Joint
Committee on Cancer, 5, 14, 7, and 4 tumors were stage I, II, III,
and IV, respectively.
Cell lines and general reagents
The human ccRCC cell line, 786-O, the human RCC cell
lines, ACHN, A498, and GRC-1, the normal human renal tubular
epithelial cell line, HK-2, the human prostate cancer cell lines,
PC3 and Du145, and the human colorectal cancer cell line, SW480,
were obtained from the Laboratory of Pathology, West China Medical
School, Sichuan University (Chengdu, China). Following cell
dissociation and propagation, the 786-O, A498, ACHN, and GRC-1-1
cell lines were cultured (37°C) and grown in Roswell Park Memorial
Institute (RPMI) medium using 1640 complete medium
(Gibco®; Thermo Fisher Scientific, Inc., Waltham, MA,
USA). The GRC-1 RCC line was established at the Institute of
Urology, Peking University (Beijing, China), was first reported by
Ding et al (14), and has
been subsequently used in numerous studies (15,16).
PC3 and Du145 cells were cultured (37°C) in Dulbecco’s modified
Eagle’s medium (DMEM) complete medium (Gibco®; Thermo
Fisher Scientific, Inc.), whereas HK-2 cells were cultured (37°C)
in F-12 Complete™ medium (Gibco®; Thermo Fisher
Scientific, Inc.) in microcentrifuge tubes (Eppendorf, Stevenage,
UK) in a humidified incubator in an atmosphere of 5% CO2
and 95% air.
Primer synthesis
Mature mRNA sequences were acquired from the GenBank
sequence database (http://www.ncbi.nlm.nih.gov/genbank). Polymerase chain
reaction (PCR) primers for tissue samples and culture cells were
subsequently designed using Primer5 software. The primers for
methylation-specific PCR of BNIP3 were identical with those used by
Okami et al (17) and Bacon
et al (18). The primers
used in chromatin immunoprecipitation (ChIP) assays were designed
by Shanghai Invitrogen Biotechnology Co., Ltd. (a subsidiary of
Life Technologies Corporation; Shanghai, China), with the forward
primer running from position 131,982,902 to position 131,982,882 of
the BNIP3 template, and the reverse primer running from position
131,982,354 to position 131,982,373. All primers were synthesized
by Shanghai Invitrogen Biotechnology Co., Ltd.
Reverse transcription (RT)-PCR
Total RNA was extracted from preserved tissue
samples or cultured cells using RNAiso Plus reagent (Takara
Biotechnology Co., Ltd., Dalian, China) or TRIzol reagent (Thermo
Fisher Scientific, Inc.). Purified RNA was then quantified and
assessed for purity using ultraviolet (UV) spectrophotometry. RT
was performed with reaction mixtures (made up to a total volume of
20 µl) as described in Table
I. The PCR primers used for the detection of BNIP3 were
as follows: Forward, 5′-CAGGGCTCCTGG GTAGAACT-3′ and reverse,
5′-CTACTCCGTCCAGACTCATGC-3′ (131 bp). PCR reactions were performed
according to the protocol described in Table II. PCR products were loaded onto
2% agarose gels and visualized with ethidium bromide under UV
light. As a control for cDNA synthesis, RT-PCR was also performed
using primers specific for the GAPDH gene.
 | Table IDetails of the reverse transcription
reaction mixtures. |
Table I
Details of the reverse transcription
reaction mixtures.
| Reagent | Amount
|
|---|
| Tissue samples | RCC cell lines | Cells treated with
TSA |
|---|
| Total RNA | 5 µg | 2 µg | 2 µg |
| 5X RT buffer | 4 µl | 4 µl | 4 µl |
| dNTPs (10 mM) | 2 µl | 2 µl | 2 µl |
| DTT (0.1 M) | 1 µl | 1 µl | 1 µl |
| Oligo (dT) 18 | 1 µl | 1 µl | 1 µl |
| ReverTra
Ace® | 0.8 µl | 1 µl | 1 µl |
| DEPC
ddH2O | Up to total volume
of 20 µl | Up to total volume
of 20 µl | Up to total volume
of 20 µl |
| Table IIDetails of the PCR mixtures for cell
lines and methylation-specific PCR. |
Table II
Details of the PCR mixtures for cell
lines and methylation-specific PCR.
| A, Cultured cell
lines |
|---|
| Reagent | Amount
(µl) |
|
| Taq DNA
polymerase | 0.25 |
| 10X PCR buffer | 2.5 |
| 25 mmol/l
MgCl2 | 1.5 |
| 10 mmol/l dNTP | 0.5 |
| Upstream primer
(100 µM) | 0.1 |
| Downstream primer
(100 µM) | 0.1 |
| cDNA | 1 |
|
ddH2O | Up to 25 |
B, Methylation-specific PCR
|
| Reagent | Amount
(µl) |
|
| Takara Taq
HS (5 U/µl) | 0.1 |
| 10X HS buffer
(Mg2+ plus) | 2 |
| 2.5 mmol/l
dNTP | 1.6 |
| Upstream primer
(100 µM) | 0.1 |
| Downstream primer
(100 µM) | 0.1 |
| cDNA | 3 |
|
ddH2O | Up to 20 |
RT-quantitative PCR (RT-qPCR)
RT-qPCR was performed using a PTC-200 Peltier
Thermal Cycler instrument (MJ Research, Ramsey, MN, USA) according
to the manufacturer’s protocol described in Table III. The sequences of the PCR
primers used for detecting BNIP3 were as follows:
VHL, forward primer, 5′-GGAGCCTAGTCAAGCCTGAGA-3′; reverse,
5′-CATCCGTTGATGTGCAATGCG-3′ (134 bp); HIF-1α, forward primer,
5′-ATCCATGTGACCATGAGGAAATG-3′; reverse,
5′-TCGGCTAGTTAGGGTACACTTC-3′ (125 bp); VEGF, forward primer,
5′-AGGGCAGAATCATCACGAAGT-3′; reverse, 5′-AGGGTCTCGATTGGATGGCA-3′
(75 bp); GAPDH, forward primer, 5′-GTCTTCACCACCATGGAGAA-3′;
reverse, 5′-ATCCACAGTCTTCTGGGTGG-3′ (268 bp). The GAPDH gene was
used as a positive control. The PCR conditions were as follows: One
cycle of denaturation at 95°C for 2 min, followed by 39 cycles of
95°C for 20 sec, 60°C for 30 sec, and 72°C for 30 sec. The copy
number of target genes (relative to GAPDH) from the tissue
samples was determined using the 2−ΔΔCq method (19), with ΔΔCq=ΔCqtumor
tissues(T)-ΔCqadjacent non-tumor
tissues(N)=(CqT-target-CqT-GAPDH)-(CqN-target-CqN-GAPDH),
whereas the copy number for cultured cells was determined by the
ΔCq method, with
ΔCq=CqGAPDH-Cqgene.
| Table IIIDetails of the reaction mixtures for
reverse transcription-quantitative polymerase chain reaction. |
Table III
Details of the reaction mixtures for
reverse transcription-quantitative polymerase chain reaction.
| Reagent | Amount
(µl) |
|---|
| 2X SYBR-Green
real-time PCR mix | 10 |
| Upstream primer (10
µM) | 0.4 |
| Downstream primer
(10 µM) | 0.4 |
| cDNA | 2.0 |
|
ddH2O | 7.2 |
| Total volume | 20 |
Western blotting
Total cell protein was collected from cells
following lysis in buffer (Roche Diagnostics GmbH, Mannheim,
Germany) containing leupeptin, pepstatin A, aprotinin and
phenylmethanesulfonyl fluoride (PMSF). The protein concentration
was measured using the bicinchoninic acid (BCA) protein assay
reagent kit (Beyotime Institute of Biotechnology, Haimen, China).
After mixing with SDS loading buffer (Calbiochem; now a subsidiary
of EMD/Merck Millipore, Billerica, MA, USA) and boiling for 5 min,
the protein samples were separated by SDS/PAGE gels (12%) and
transferred on to a polyvinylidene difluoride (PVDF) membrane (GE
Healthcare Life Sciences, Little Chalfont, UK). Membranes were
subsequently blocked with 15% fat-free milk powder (for BNIP3) or
5% fat-free milk powder (for VHL, HIF-1α, VEGF and GAPDH), and
separated in Tris-buffered saline containing 0.1% Tween-20 (TBST)
buffer for 90 min at room temperature. Corresponding membranes were
then incubated with primary antibodies against BNIP3 (cat. no.
B7931, 1:3,000; Sigma-Aldrich; now a brand of Merck, KGaA,
Darmstadt, Germany), VHL (cat. no. 68547, 1:1,000; CST Biological
Reagents Co., Ltd., Shanghai, China), HIF-1α (cat. no. 610959,
1:2,000; BD Biosciences, San Jose, CA, USA), VEGF (cat. no. BA0407,
1:100; Boster Biological Technology, Pleasanton, CA, USA), and
GAPDH (cat. no. KC-5G4, 1:10,000; Kangchen BioTech Co., Ltd.,
Shanghai, China) at 4°C overnight. After washing in TBST buffer,
the membranes were subsequently incubated with horseradish
peroxidase (HRP)-conjugated goat anti-mouse or rabbit IgG secondary
antibodies (cat. nos. 31430 for mouse and 31460 for rabbit,
respectively; 1:5,000; Zymed®; Thermo Fisher Scientific,
Inc.) at room temperature for 1 h. After further TBST washing, the
antigen-antibody reaction was visualized using the enhanced
chemiluminescence (ECL) assay (Roche Diagnostics GmbH), and the
blots were analyzed using a DP70 digital camera (Olympus
Corporation, Tokyo, Japan). The intensity (gray value) of each
protein sample was calculated and normalized to the internal
control, GAPDH.
Genomic DNA isolation, methylation
modification, and methylation-specific (MS)-PCR
Genomic DNA was isolated from tissue samples and
cultured cells using a Promega DNA purification kit (Promega
Corporation, Madison, WI, USA), in accordance with the
manufacturer’s protocol. After the purity and concentration of DNA
was quantified and assessed, methylated residues were modified
using a ZYMO DNA Methylation-Gold kit (Zymo Research Corp., Irvine,
CA, USA) to differentiate methylated CpGs from unmethylated CpGs.
Using this treatment, unmethylated cytosines were converted into
uracil, whereas methylated cytosine remains as cytosine.
Subsequently, MS-PCR was performed using the reaction mixtures
described in Table II. The PCR
conditions were as follows: One cycle of denaturation at 95°C for 5
min, followed by 35 cycles of 95°C for 30 sec, 64 or 58°C
(methylated or unmethylated) for 50 sec, and 72°C for 30 sec.
Primer sequences for the unmethylated reaction were as follows:
Forward, 5′-TAGGATTTGTTTTGTGTATG-3′, and reverse,
5′-ACCACATCACCCATTAACCACA-3′ (94 bp), whereas for the methylated
reaction, the following primers were used: Forward,
5′-TAGGATTCGTTTCGCGTACG-3′, and reverse,
5′-ACCGCGTCGCCCATTAACCGCG-3′ (94 bp).
Assessment of cell proliferation
following treatment with 5-aza-cytidine (5-aza-C) or TSA
Cells collected from cell culture flasks were grown
on 96-well plates (Corning Incorporated, Corning, NY, USA) at a
concentration of 5×10³ cells per well, and then
incubated with in atmosphere of 5% CO2 and 95% air.
After 24 h of incubation, the culture medium was substituted with
medium containing 2% fetal calf serum and 5 µM 5-aza-C
(Merck, KGaA) or 1.5 µM of the histone deacetylase inhibitor
(HDACI), TSA (Merck, KGaA), which was renewed every 12 h for 72 h.
Following treatment, 10 µl cholecystokinin octapeptide
(CCK-8) (Dojindo Molecular Technologies, Inc., Kumamoto, Japan) was
added to each tube, followed by incubation for 4 h. Finally, in
order to determine the levels of cell proliferation, absorbance at
450 nm was measured using a microplate reader (Bio-Rad
Laboratories, Inc., Hercules, CA, USA).
Evaluation of proliferation and apoptosis
following treatment with different concentrations of TSA
Cultured cells (786-O, ACHN, and A498) used to
evaluate proliferation were grown on 96-well plates at a
concentration of 3×10³ cells per well, whereas cells for
apoptotic evaluation were grown on 6-well plates (Corning
Incorporated) at a concentration of 1.2×10⁶ cells per
well. Subsequently, cells were incubated in an atmosphere of 5%
CO2 and 95% air for 24 h prior to renewing the media
containing 0.5, 1.0, or 2.0 µmol/l TSA, as appropriate.
Cells treated with medium without TSA were used as a negative
control, whereas medium without the cells was used as a blank
control. The cell medium was renewed every 24 h for all groups. The
proliferation of cells was evaluated at 0, 24, 48, and 72 h using
CCK-8, as described above. Apoptosis was examined at 48 h using
Annexin V-fluorescein isothiocyanate (FITC) (Dojindo Molecular
Technologies, Inc.,) and flow cytometry (Instrument: Bio-Rad
Laboratories, Inc; Software: NoveExpress™), in accordance with the
manufacturer’s protocol.
Evaluation of gene expression following
TSA treatment
Total RNA was extracted from cultured cells treated
with different concentrations of TSA for 24 h as described above,
with cells grown in medium without TSA being used as a negative
control. RT-PCR was performed with the reaction mixtures described
in Table I, whereas PCR was
performed with the reaction mixtures described in Table IV. The PCR conditions were as
follows: One cycle of denaturation at 95°C for 1 min, followed by
35 cycles of 95°C for 10 sec, 58°C for 30 sec, and 72°C for 30 sec.
PCR products were loaded onto 2% agarose gels and visualized with
ethidium bromide under ultraviolet (UV) light. As a control for
cDNA synthesis, RT-PCR was also performed using primers specific
for the GAPDH gene. RT-qPCR was performed with the reaction
mixtures described in Table III.
The RT-qPCR conditions were as follows: One cycle of denaturation
at 95°C for 1 min, followed by 40 cycles of 95°C for 10 sec, 60°C
for 30 sec, and 72°C for 30 sec. The BNIP3 primers for PCR
were as follows: Forward, 5′-ACCAACAGGGCTTCTGAAC-3′; reverse,
5′-GAGGGTGGCCGTGCGC-3′ (204 bp). GAPDH was used as an
internal control, and primers were as described above. Reactions
without the cDNA template were used as blank controls. Western
blotting for the analysis of protein expression was subsequently
performed, as described above.
| Table IVPCR reaction details for TSA treated
cells and ChIP. |
Table IV
PCR reaction details for TSA treated
cells and ChIP.
| A, Cells treated
with TSA |
|---|
| Reagent | Amount
(µl) |
|
| Taq DNA
polymerase | 0.25 |
| 10X PCR buffer | 2.5 |
| 25 mmol/l
MgCl2 | 1.5 |
| 10 mmol/l dNTP | 0.5 |
| Upstream primer (10
µM) | 0.1 |
| Downstream primer
(10 µM) | 0.1 |
| cDNA | 1 |
|
ddH2O | Up to 25 |
|
| B, ChIP | |
|
| Reagent | Amount
(µl) |
|
| Taq DNA
polymerase | 0.25 |
| 10X PCR buffer | 12.5 |
| 25 mmol/l
MgCl2 | - |
| 10 mmol/l dNTP | 1 |
| Upstream primer (10
µM) | 0.1 |
| Downstream primer
(10 µM) | 0.1 |
| cDNA | 1 |
|
ddH2O | Up to 25 |
ChIP assay
Cultured cells (786-O, ACHN, and A498) for the
evaluation of BNIP3 promoter deacetylation were grown on 100
mm cell-culture dishes (Corning Incorporated) and incubated in an
atmosphere of 5% CO2 and 95% air for 24 h. Subsequently,
the medium was renewed for medium containing 1.0 µmol/l TSA.
Cells treated with media without TSA were used as a negative
control. Cell media was renewed every 24 h for all groups. After
the cells had been treated with TSA for 48 h, commercial ChIP kits
(Beyotime Institute of Biotechnology) were used to perform the ChIP
assays. In brief, cells were fixed in formaldehyde (Sigma-Aldrich;
now a branch of Merck, KGaA) for 10 min, quenched with glycine
solution for 5 min, and washed twice with phosphate-buffered saline
(PBS) supplemented with PMSF. Subsequently, the cells were
harvested, centrifuged (4°C, 1,000 × g for 2 min), resuspended in
SDS lysis buffer and ice-bath sonicated (50W, 6 times for eight
cycles) to break up the DNA into 20-1,000 bp fragments. After
centrifugation (4°C, 14,000 × g for 5 min), 500 µl aliquots
of the supernatant (containing DNA) were diluted to 2 ml in ChIP
dilution buffer. Input samples were used as positive controls, and
collected prior to the addition of Protein A+G agarose/salmon-sperm
DNA, centrifugation (4°C, 1,000 × g for 1 min), and the
immunoprecipitates being divided into two 1 ml samples.
Anti-acetylated histone H3 polyclonal antibody (EMD/Merck
Millipore) was added to the experimental group samples, whereas
normal rabbit IgG antibodies were added to negative control
samples. All samples were mixed with Protein A+G
agarose/salmon-sperm DNA, centrifuged (4°C, 1,000 × g for 1 min),
and then washed successively using Low Salt Immune Complex Wash
buffer, High Salt Immune Complex Wash buffer, and LiCl Immune
Complex Wash buffer once, and TE buffer twice. Bound complexes were
eluted using elution buffer. DNA-protein crosslinking was reversed
by incubation with 5 M NaCl for 4 h at 65°C, and input samples were
diluted to 100 µl and incubated under the same conditions.
DNA samples were subsequently purified using a DNA purification kit
(Beyotime Institute of Biotechnology), according to the
manufacturer’s protocol. After the DNA had been purified, PCR was
performed according to the protocol described in Table IV. The PCR conditions were as
follows: One cycle of denaturation at 95°C for 1 min, followed by
35 cycles of 95°C for 10 sec, 55°C for 30 sec, and 72°C for 30 sec.
Reactions containing no DNA template were used as blank controls.
Reaction products were subjected to agarose gel electrophoresis
(2%), and analyzed under UV light, as described above. The
BNIP3 ChIP primers employed in these analyses were as
follows: 5′-AGCGGGAAATTGAGAAAGCGA-3′ (forward) and
5′-TCCATCCTGCTAGTGGGGAA-3′ (reverse; 548 bp).
Statistical analysis
Data associated with the tissue samples are
presented as the median and the inter-quartile range (IQR).
Statistically significant differences were determined using a
single-sample non-parametric test, correlation analyses were
determined by rank correlation, and P<0.05 was taken to indicate
a statistically significant value. Data from cultured cells are
presented as the mean ± standard error (SE). Unpaired t-tests were
used for determining statistically significant differences, which
were defined as P<0.05.
Results
Expression levels of BNIP3 and associated
genes in RCC tissue samples and cultured cells
RT-qPCR was used to examine the mRNA expression
levels of BNIP3 and associated genes. In tissue samples
collected from patients with ccRCC, BNIP3 and VHL
expression levels were lower in tumor tissues compared with those
in adjacent non-tumor tissues, with median relative transcript
levels of 0.30 (IQR=0.17-0.44; P<0.05) and 0.51 (IQR=0.34-0.69;
P<0.05), respectively (the relative expression level of each
gene is shown relative to levels in adjacent non-tumor control
tissue samples, which were set to 1) (Table V). However, the mRNA expression
levels of HIF1A and VEGF were higher in tumor tissues
compared with adjacent non-tumor tissues, with median relative
transcript levels of 12.30 (IQR=6.92-34.98; P<0.05) and 13.14
(IQR=9.30-24.73; P<0.05), respectively.
| Table VAssociations between renal cell
carcinoma gene expression and clinical data |
Table V
Associations between renal cell
carcinoma gene expression and clinical data
| Parameter | n | BNIP3 mRNA
| VHL mRNA
| HIF1A mRNA
| VEGF mRNA
|
|---|
| M | r | M | r | M | r | M | r |
|---|
| Sex | | | −0.33 | | −0.11 | | 0.01 | | 0.20 |
| Male | 19 | 0.22 | | 0.46 | | 13.00 | | 16.50 | |
| Female | 11 | 0.44 | | 0.51 | | 10.83 | | 11.52 | |
| Age (years) | | - | 0.03 | | −0.21 | | −0.10 | | −0.04 |
| <65 | 22 | 0.30 | | 0.51 | | 12.37 | | 13.14 | |
| ≥65 | 8 | 0.28 | | 0.33 | | 11.03 | | 14.01 | |
| Diameter of
tumor | | | −0.14 | | −0.17 | | −0.07 | | 0.23 |
| <4 cm | 7 | 0.27 | | 0.68 | | 15.03 | | 16.50 | |
| ≥4 cm | 23 | 0.34 | | 0.46 | | 10.82 | | 11.72 | |
| Clinical stage | | | 0.21 | | 0.06 | | 0.84b | | −0.37a |
| I-II | 19 | 0.22 | | 0.51 | | 7.52 | | 16.50 | |
| III-IV | 11 | 0.34 | | 0.51 | | 39.12 | | 10.90 | |
| Pathological
stage | | | 0.06 | | −0.40a | | 0.47b | | −0.09 |
| I-II | 12 | 0.30 | | 0.57 | | 6.92 | | 14.11 | |
| III-IV | 18 | 0.29 | | 0.37 | | 17.56 | | 13.04 | |
| Total | 30 | 0.30a | |
0.51* | | 12.30a | | 13.14a | |
Statistical analysis of the gene expression data,
according to the clinical characteristics of the tumors, indicated
that VHL mRNA expression was negatively correlated with
pathological tumor stage (r=−0.40; P<0.05), whereas no
significant correlations with gender, age, size of tumor, or
clinical stage were detected (P>0.05; Table V). Furthermore, the expression of
HIF1A was positively correlated with the pathological and
clinical tumor stage (r=0.84, 0.47; P<0.01); however, no
significant correlations were observed for gender, age, or the size
of tumor (P>0.05). VEGF expression was negatively
correlated with clinical tumor stage (r=−0.40; P<0.05), but
there were no significant correlations with gender, age, size of
tumor or pathological stage (P>0.05). There were no significant
correlations between BNIP3 mRNA expression levels and
gender, age, size of tumor, or clinical or pathological stage
(P>0.05). Likewise, there were there no significant correlations
among the expression levels of BNIP3, VHL,
HIF1A, and VEGF.
To explore protein expression in RCC, western blots
were performed, which revealed reduced levels of BNIP3 and VHL in
RCC tumors compared with adjacent non-tumor tissue samples
(relative expression levels, 0.56 and 0.23, respectively;
P<0.05; Fig. 1A). In contrast,
HIF-1α and VEGF were expressed at significantly higher levels in
tumor tissue samples (1.12 and 3.45, respectively; P<0.05).
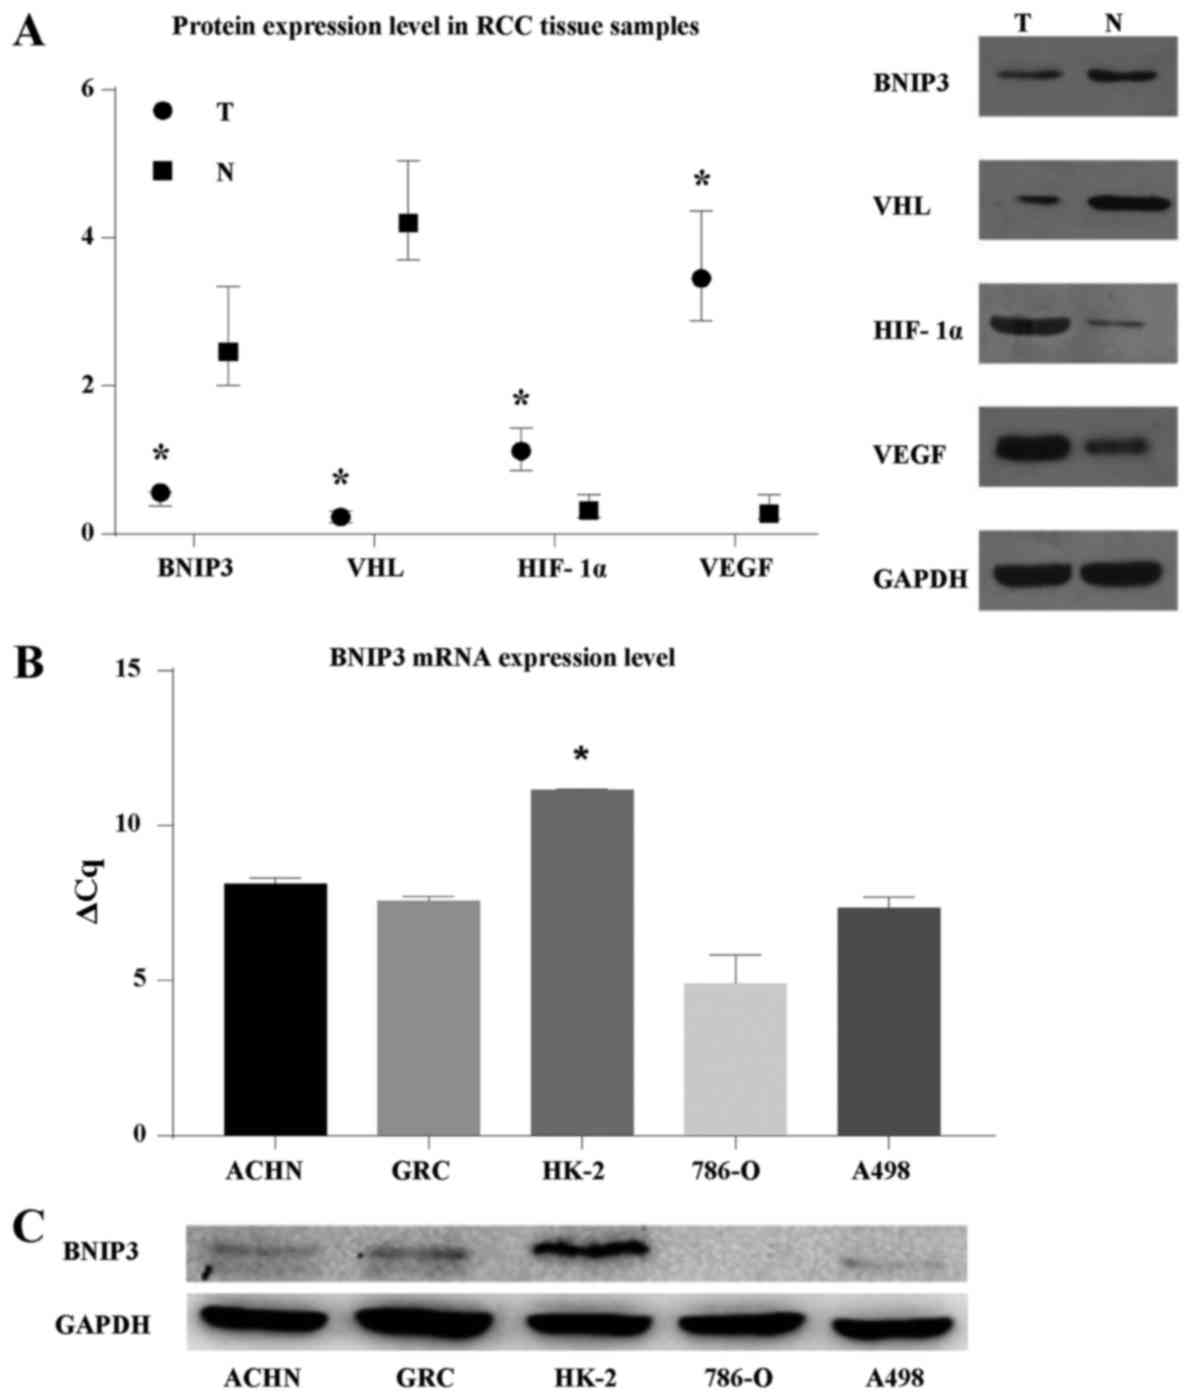 | Figure 1BNIP3 expression in ccRCC tumor
tissue samples, adjacent non-tumor tissue samples, and cell lines.
(A) Relative protein expression levels of BNIP3, VHL, HIF-1α, and
VEGF in tumor and adjacent non-tumor tissue samples from 30 cases
of ccRCC were determined by WB using the levels of GAPDH as an
internal control. Data are presented as the median and
interquartile range. T, tumor tissues; N, adjacent non-tumor
tissues. *P<0.05 compared with adjacent non-tumor
tissues. Representative examples are shown. (B) RT-qPCR,
demonstrating that BNIP3 mRNA expression was significantly
lower in 786-O, ACHN, A498 and GRC-1-1 RCC cells (particularly
786-O cells) compared with normal renal HK-2 cells. BNIP3 mRNA
expression levels were measured as percentages of that of HK-2.
*P<0.05 compared with ACHN, GRC-1-1, 786-O, A498
cells. (C) BNIP3 protein levels in 786-O, ACHN, A498, GRC-1-1, and
HK-2 cells were evaluated by WB, with GAPDH as a control. A
representative example is shown. WB, western blotting; VHL, Hippel
Lindau; HIF-1α, hypoxia-inducible factor-1α; VEGF, vascular
endothelial growth factor; ccRCC, clear cell renal cell carcinoma;
RT-qPCR, reverse transcription-quantitative polymerase chain
reaction. |
For cultured cells, RT-qPCR demonstrated that
BNIP3 expression levels were lower in all RCC cell lines
investigated (786-O, ACHN, A498, and GRC-1-1; P<0.05; Fig. 1B) when compared with the normal
human renal tubular epithelial cell line, HK-2, with relative
transcript levels of 1.5, 12, 7 and 8%, respectively. As expected,
western blots of cultured cells demonstrated reduced levels of
BNIP3 in the 786-O, ACHN, and A498 lines compared with the HK-2
cell line (Fig. 1C); these
findings were consistent with the RT-qPCR results.
Methylation status of the BNIP3 gene
promoter region in RCC
Our results indicated a reduced BNIP3
expression in RCC tissues and cells, which may have been caused by
methylation of its promoter region (17). To determine whether the promoter
region of BNIP3 was methylated, and to explore the
epigenetic regulation of this gene in RCC, MS-PCR was performed
(Fig. 2A). The human colorectal
cancer cell line, SW480, in which the BNIP3 promoter region
is methylated, was chosen as a positive control. Our analysis
failed to identify evidence of any methylation in the BNIP3
promoter region in either the HK-2 cells or the adjacent non-tumor
tissues, in addition to the 786-O, ACHN, and A498 RCC cell lines
and the patient ccRCC tumor samples, suggesting that reduced
BNIP3 expression in RCC is not likely to be due to
methylation of the BNIP3 promoter region.
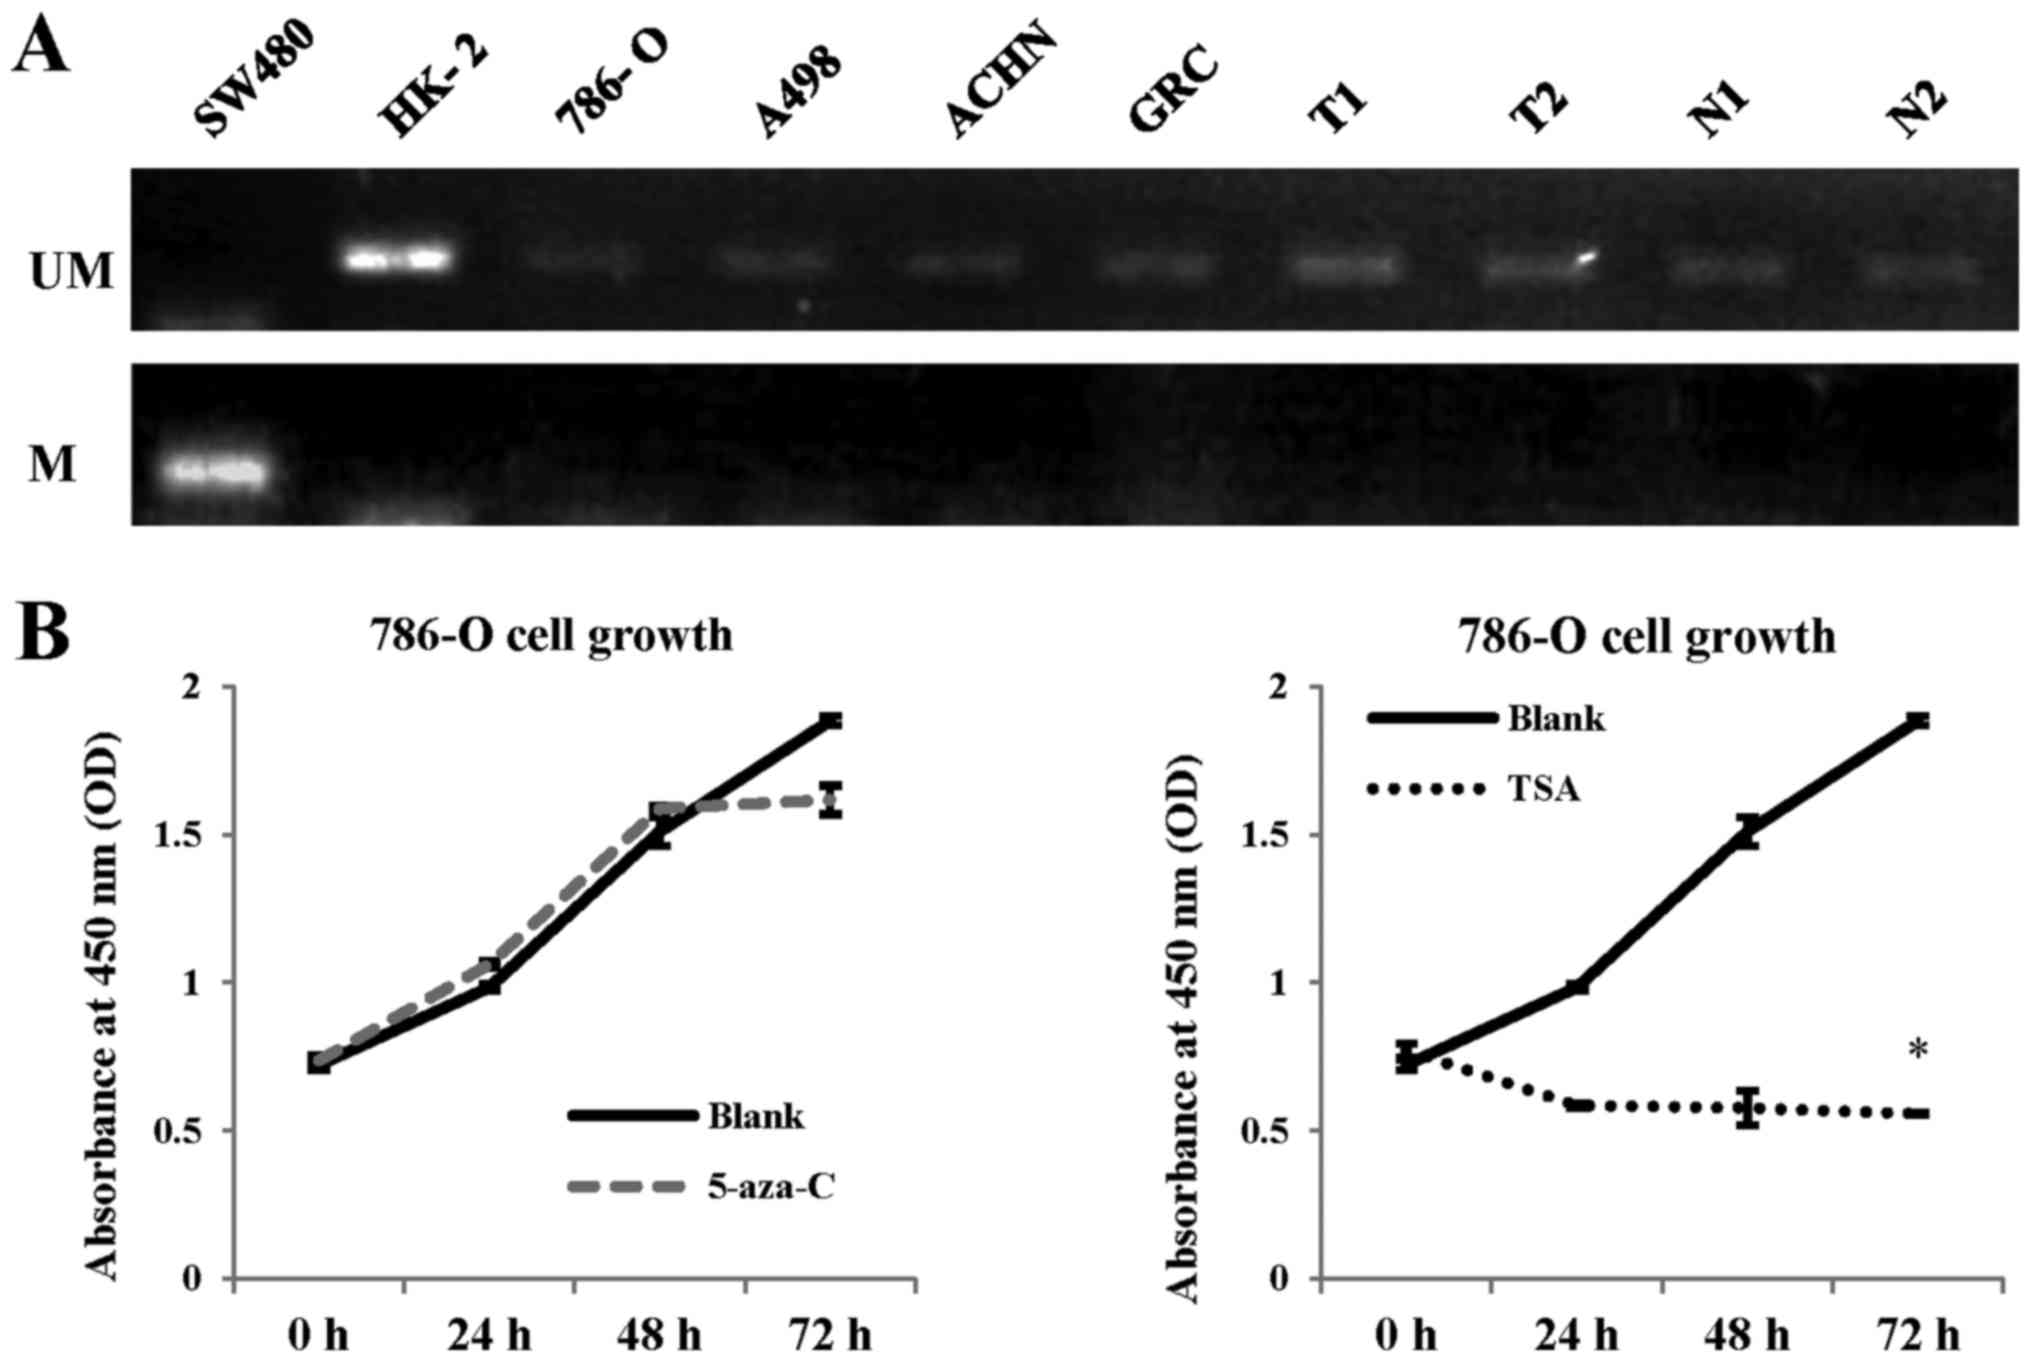 | Figure 2Methylation status of the
BNIP3 promoter in RCC cells. (A) Methylation-specific PCR
analysis of the colorectal cancer cell line, SW480, the normal
renal cell line, HK-2, the RCC cell lines, 786-O, A498, ACHN, and
GRC-1-1, and RCC tumor tissues (T) and adjacent non-tumor tissues
(N) from 30 cases with RCC. The BNIP3 promoter was
methylated in SW480 cells, which was set as a positive control. No
methylation was observed in the HK-2 cells or in the 30 samples of
RCC adjacent non-tumor tissues; this was also the case for the
786-O, A498, ACHN, and GRC-1-1 cell lines, and 30 samples of RCC
tumor tissues (two representative cases are presented here). M,
methylated; UM, unmethylated. (B) 786-O cells, which showed the
lowest expression levels of BNIP3 among the four RCC cell lines
investigated, were cultured with or without 5-aza-C or TSA for 72
h. Cells treated with no drugs were set as a blank control. Tumor
cell proliferation was examined using the Cell Counting Kit-8. No
significant differences were found between the 5-aza-C group and
the untreated group; however, TSA significantly inhibited RCC cell
growth compared with the blank group. *P<0.05
compared with the blank group. 5-aza-C, 5-aza-cytidine; TSA,
trichostatin A; RCC, renal cell carcinoma; PCR, polymerase chain
reaction. |
Subsequently, tumor cells were treated with the
demethylation inhibitor, 5-aza-C, and their proliferation was
examined. In the presence of a methylated BNIP3 promoter
region in RCC cells, treatment with 5-aza-C would be expected to
induce the upregulation of BNIP3, and the consequential
promotion of apoptosis. The cell line 786-O, which exhibited low
BNIP3 expression, was chosen for the 5-aza-C treatment
experiments. The findings of this experiment revealed that there
were no significant differences in proliferation following
demethylation treatment, consistent with the results of MS-PCR
(Fig. 2B).
As previously published studies have reported that
certain tumors with reduced BNIP3 expression exhibit histone
deacetylation (18,20), RCC cells were also treated with
trichostatin A (TSA), a type of histone deacetylase inhibitor
(HDACI). Treatment with TSA inhibited the growth of tumor cells by
70.4% after 72 h treatment
(|ATSA-ABlank|/ABlank; P<0.05;
Fig. 2B). This led us to
hypothesize that the inhibition of deacetylation might activate
BNIP3 expression.
Treatment with an HDACI suppresses tumor
proliferation and promotes apoptosis
To test our hypothesis that BNIP3 expression
might be activated by inhibiting deacetylation, the proliferation
levels of 786-O, A498, and ACHN cells were examined following
treatment with different concentrations of TSA (0.5, 1.0, and 2.0
µmol/l) (Fig. 3A). The
absorbance values at 450 nm of TSA-treated cells were significantly
lower compared with those of the controls (P<0.05); however, no
significant differences were detected among different cell lines
(P>0.05), and no concentration-dependence inhibition effects of
TSA upon cell proliferation were observed.
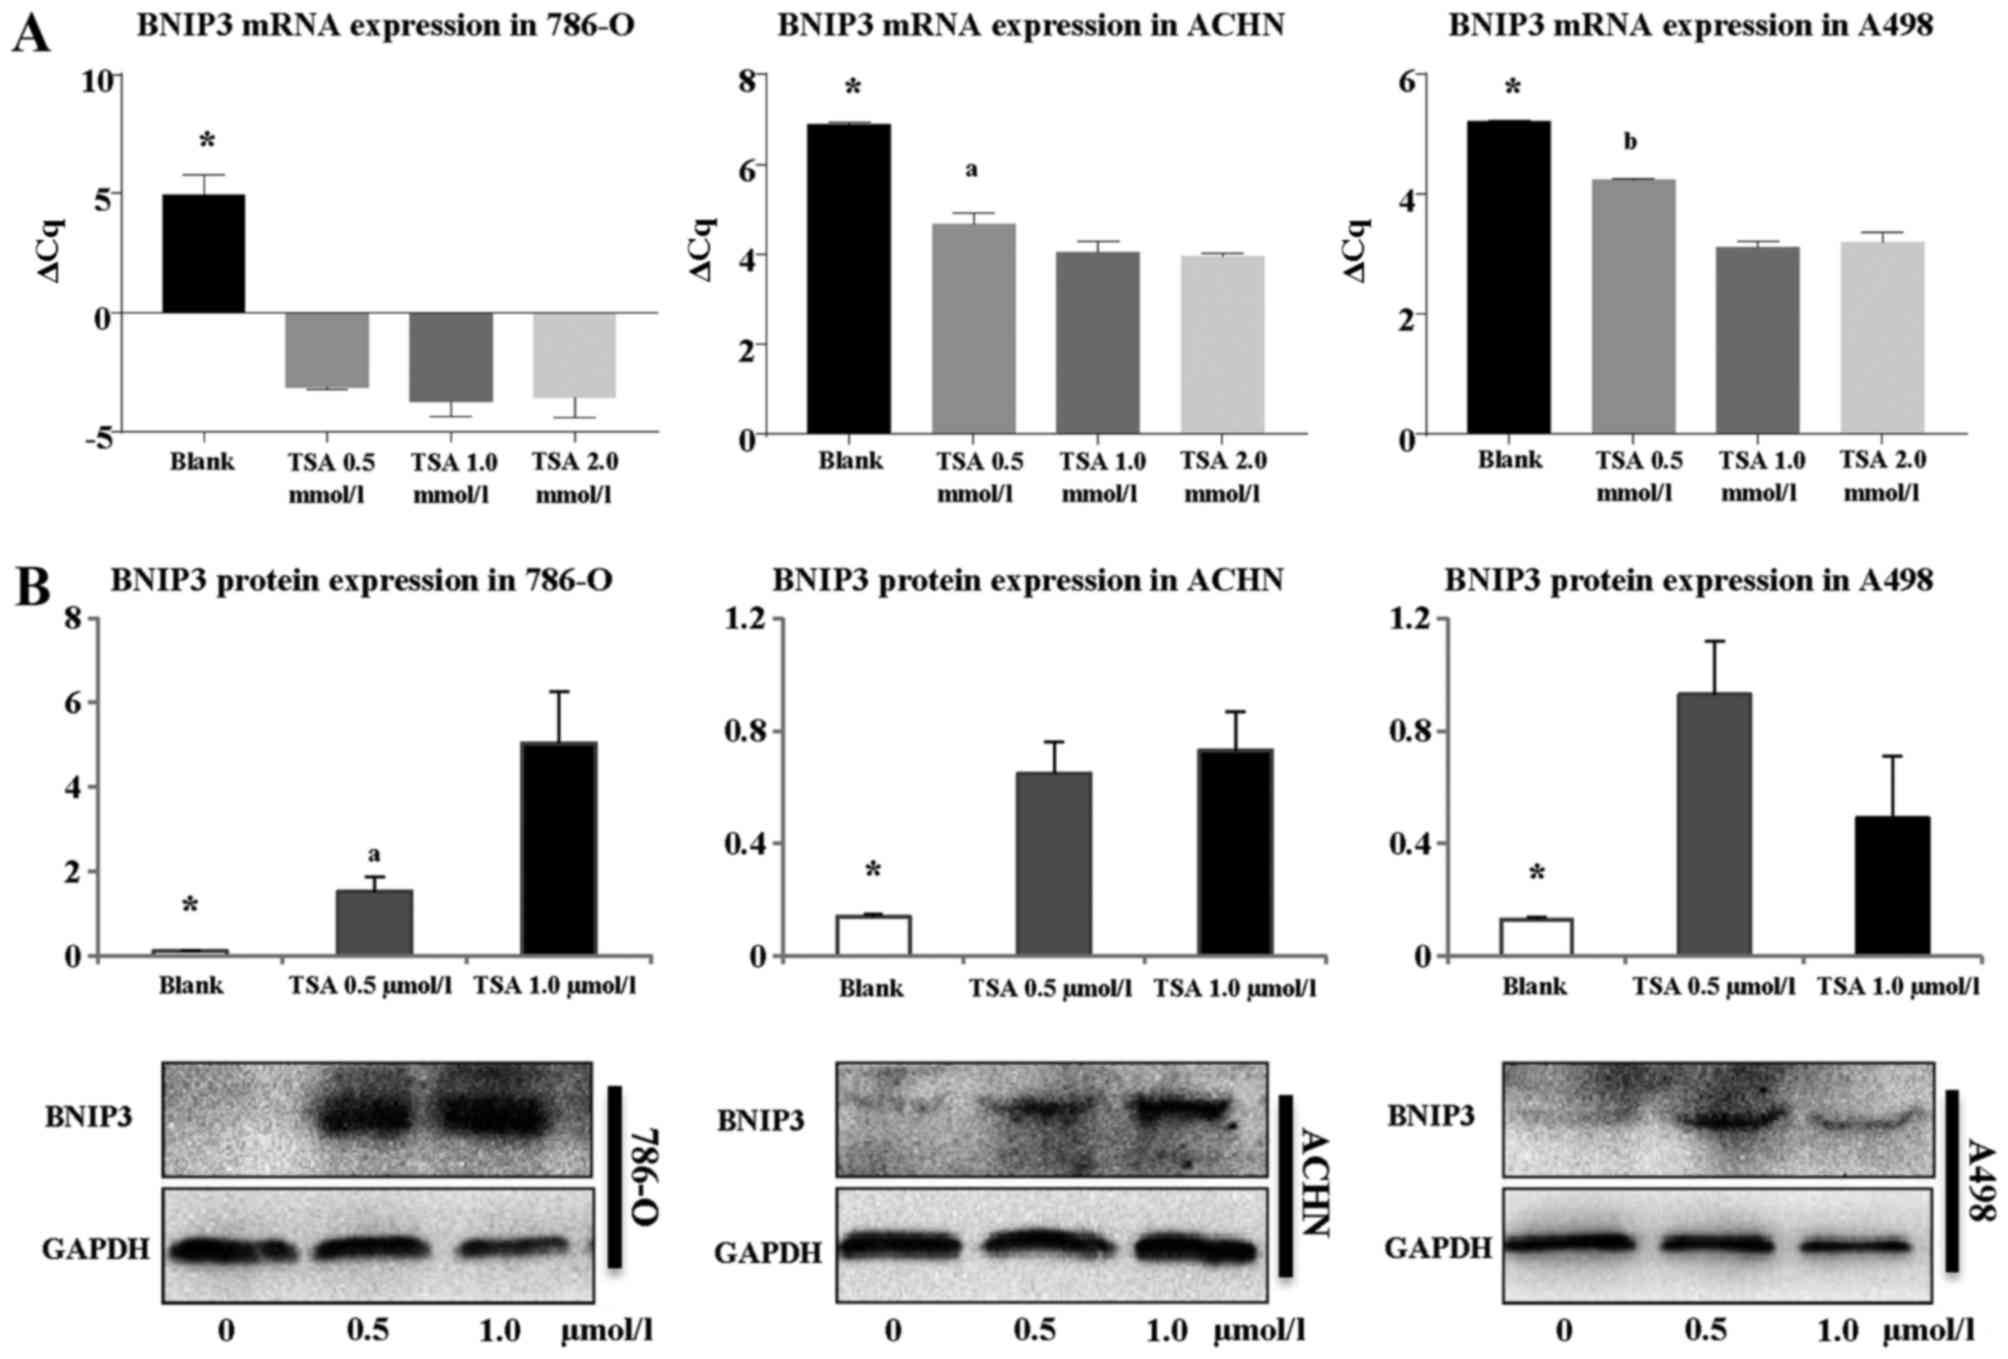
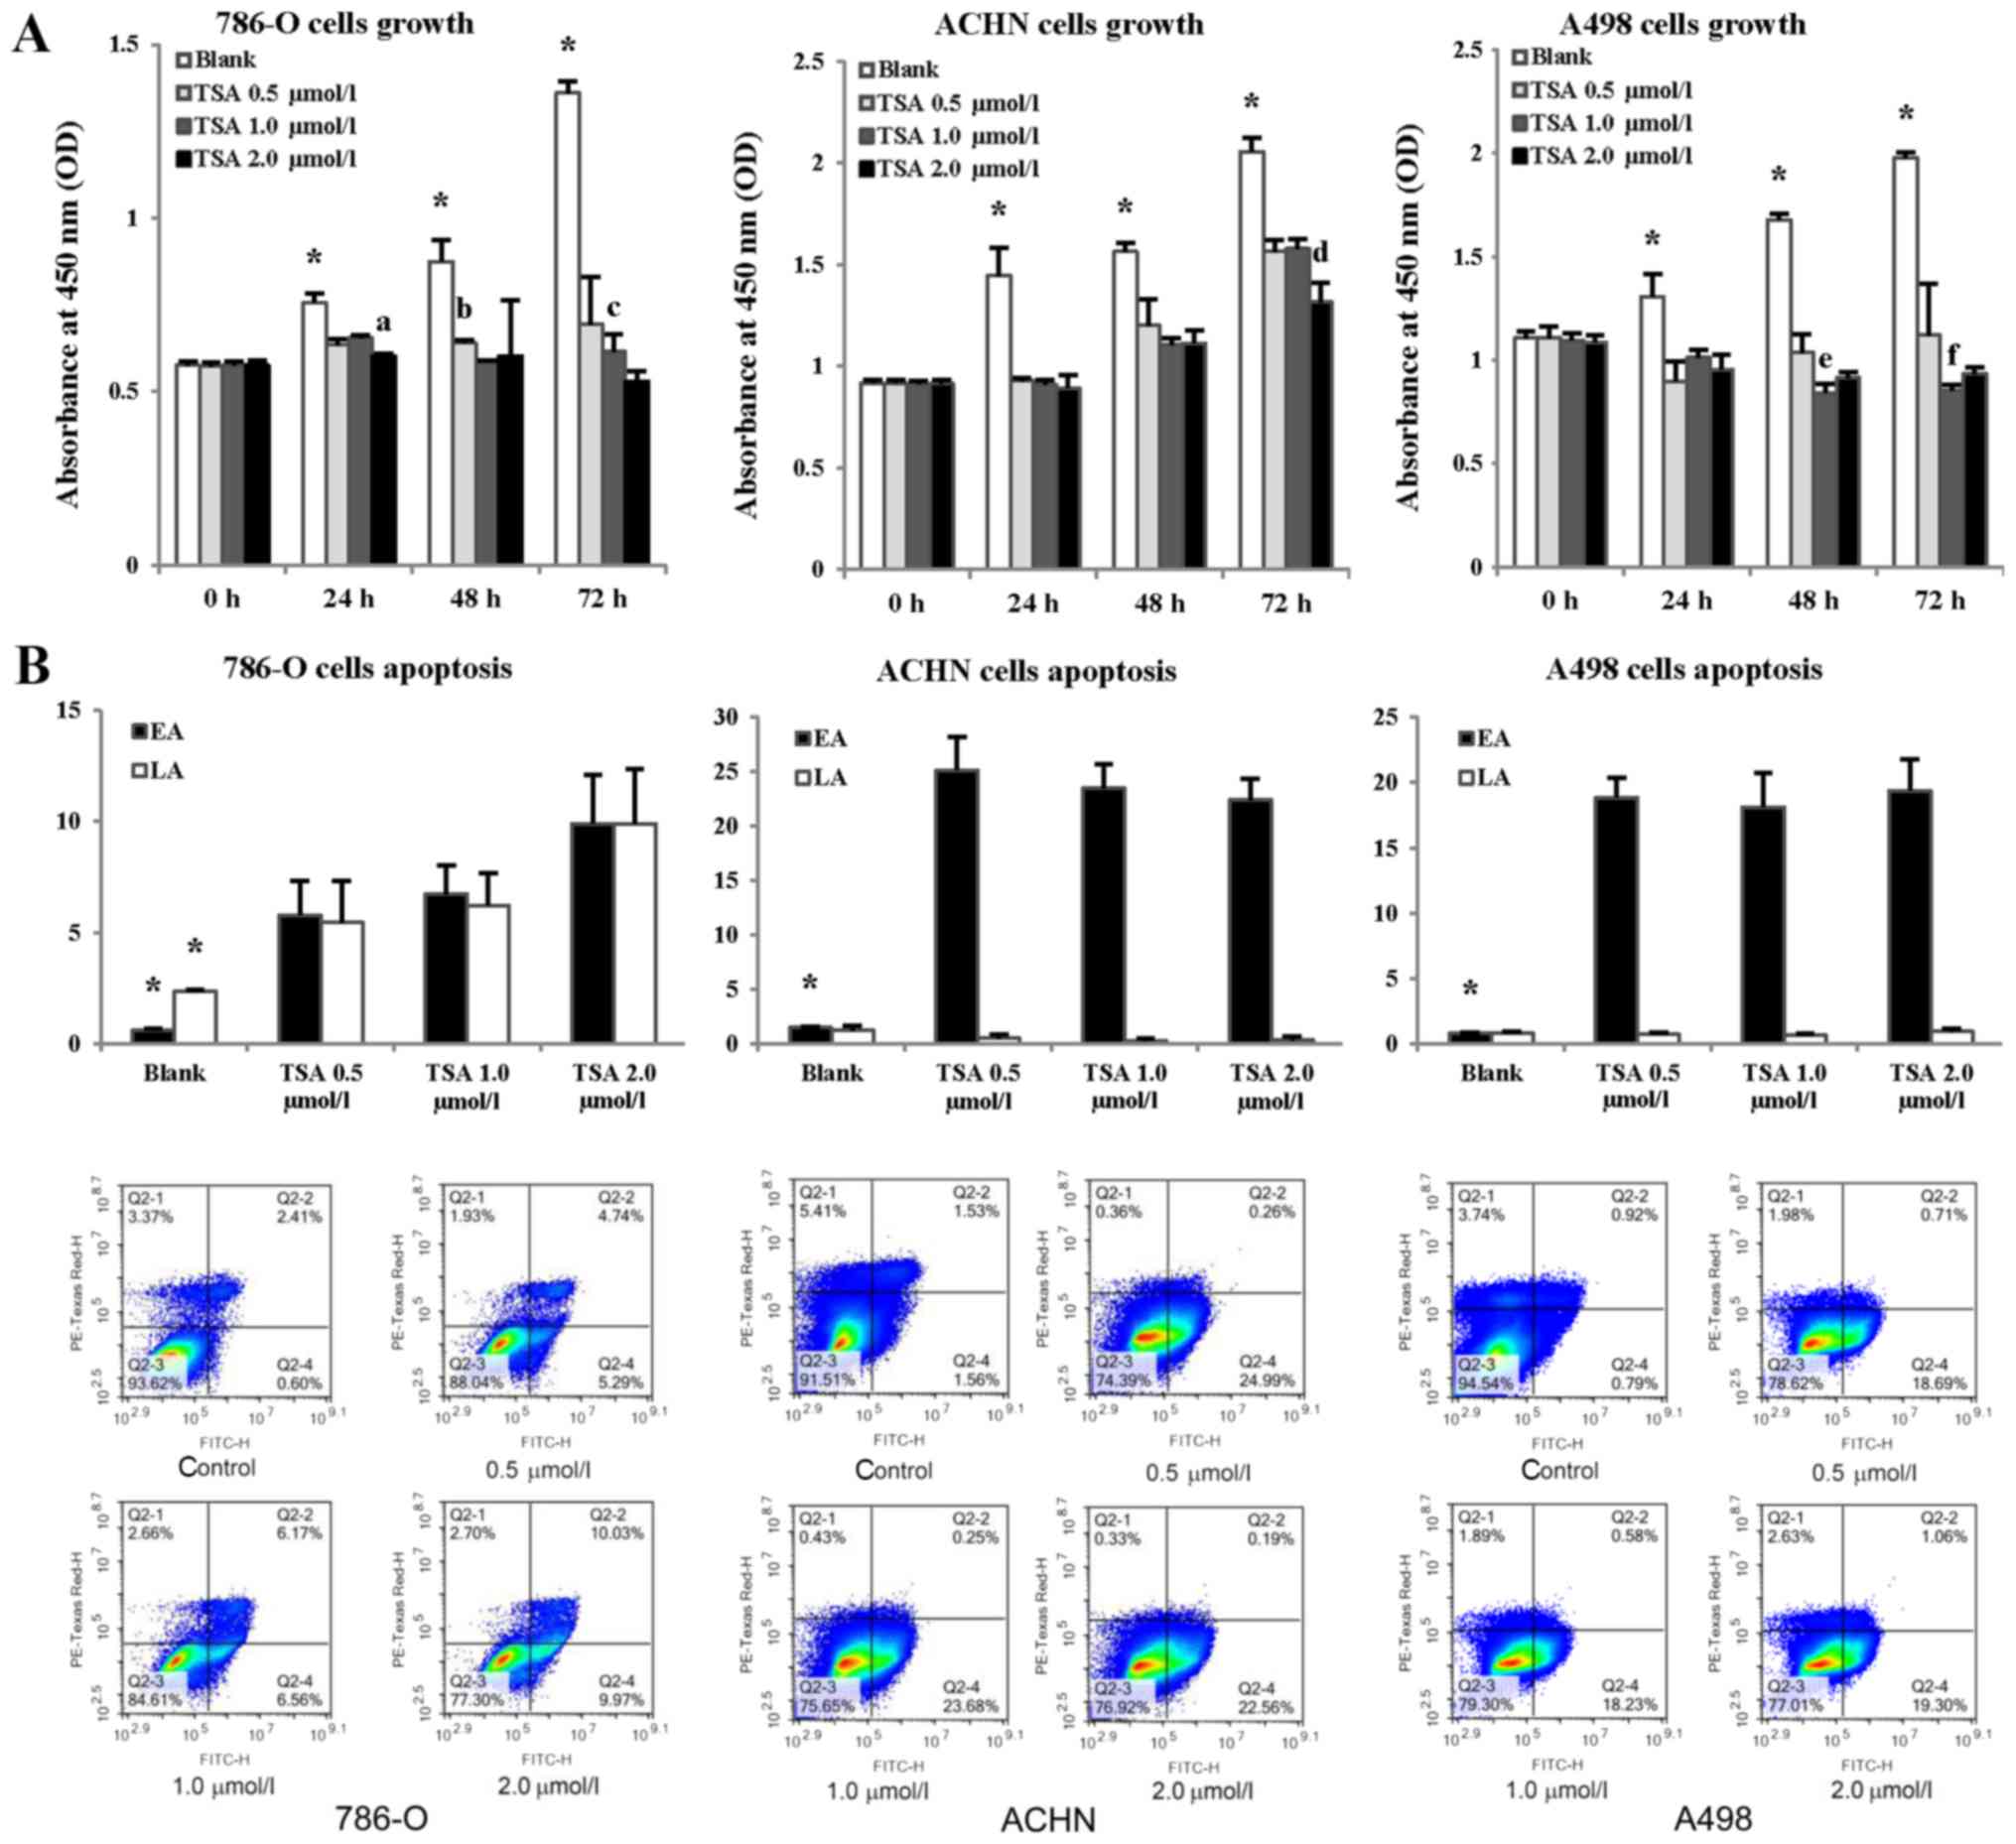 | Figure 3Evaluation of RCC cell proliferation
and apoptosis following treatment with TSA. (A) 786-O, ACHN, and
A498 cells were treated with different concentrations of TSA (0.5,
1.0, and 2.0 µmol/l). Untreated cells were used as the
control group (blank), and cell proliferation was evaluated using
Cell Counting Kit-8 assay every 24 h for 72 h.
*P<0.05 compared with each TSA-treated group;
aP<0.05 compared with TSA 0.5 and 1.0 µmol/l
treatment groups for 786-O after 24 h treatment;
bP<0.05 compared with the TSA 1.0 µmol/l
treatment group for 786-O after 48 h treatment;
cP<0.05 compared with the TSA 2.0 µmol/l
treatment group for 786-O after 72 h treatment;
dP<0.05 compared with the TSA 0.5 and 1.0
µmol/l treatment groups for ACHN after 72 h treatment;
eP<0.05 compared with the TSA 0.5 and 2.0
µmol/l treatment groups for A498 after 48 h treatment;
fP<0.05 compared with the TSA 2.0 µmol/l
treatment group for A498 after 72 h treatment. (B) Three cells
lines were treated with TSA at different concentrations, and
untreated cells were used as controls (blank). Apoptosis was
evaluated using Annexin V-FITC flow cytometric analysis, with
concentration of cells for flow cytometry was 2×10⁵/ml.
FITC-H binds to Annexin V, an increase of which indicates elevated
EA, whereas PE-Texas Red H binds propidium iodide, an increase of
which indicates elevated LA. Histograms show the apoptotic status
of RCC cells. *P<0.05 compared with each TSA
treatment group. Representative flow cytometric scatter plots are
presented under the histograms. Each quarter in the coordinate
system represents a different cell status, and the proportional
change in each quarter reflects the effect of TSA treatment on
cells. Q2-1, cells that have sustained mechanical injury; Q2-2,
late apoptotic and necrotic cells; Q2-3, normal cells; Q2-4, early
apoptotic cells. EA, early apoptosis; LA, late apoptosis; RCC,
renal cell carcinoma; TSA, trichostatin A; FITC, fluorescein
isothiocyanate. |
Apoptosis was also examined in cultured cells
exposed to HDACI by using Annexin V-FITC flow cytometric analysis
(Fig. 3B). As shown in Fig. 3B, after TSA-treatment for 48 h,
levels of early apoptotic (EA) cells were significantly increased
(P<0.05), with no significant differences noted among cultured
cells or in response to different concentrations of TSA. Levels of
late apoptotic (LA) and necrotic 786-O cells were significantly
increased (P<0.05). Consequently, it appears that the inhibition
of deacetylation may suppress tumor growth, and promote
apoptosis.
Treatment with TSA leads to the
upregulation of BNIP3 expression
As our results indicated that HDACI caused RCC cell
death, whether TSA treatment could activate BNIP3 expression
was subsequently investigated. Therefore, RT-qPCR on cultured cells
treated with TSA at different concentrations (0.5, 1.0, and 2.0
µmol/l) was performed (Fig.
4A). After treatment for 24 h, BNIP3 mRNA expression
markedly increased in all three RCC cell lines (786-O, A498, and
ACHN; P<0.05). In 786-O cells, expression levels for each TSA
concentration (0.5, 1.0 and 2.0 µmol/l) were determined to
be 247, 395, and 366 times higher compared with the controls
(P<0.05), although no significant differences were observed
among cells treated with each TSA concentration (P>0.05).
However, for the other two cell lines (A498 and ACHN), the
increases in expression were less pronounced compared with those
observed in the 786-O cell line. For the cell lines ACHN and A498,
significant differences were identified between cells treated with
0.5 and 1.0, and 0.5 and 2.0 µmol/l TSA (P<0.05),
although no significant differences were identified between cells
treated with 1.0 and 2.0 µmol/l TSA (P>0.05).
Western blotting was also performed to explore BNIP3
protein expression following treatment with TSA (Fig. 4B). BNIP3 protein was hardly
expressed at all in the 786-O, A498, or ACHN cells prior to
treatment. However, following the addition of TSA (0.5 or 1.0
µmol/l) for 48 h, BNIP3 protein expression markedly
increased (P<0.05), with the most pronounced increase observed
for 786-O cells, consistent with the RT-qPCR results. Although the
difference in BNIP3 expression recorded for 786-O cells treated
with either 0.5 or 1.0 µmol/l TSA was statistically
significant (P<0.05), this was not the case for the other two
cell lines investigated (ACHN and A498 cells; P>0.05). Taken
together, the results of the RT-qPCR and western blotting
experiments indicated that TSA treatment activated BNIP3 expression
in RCC.
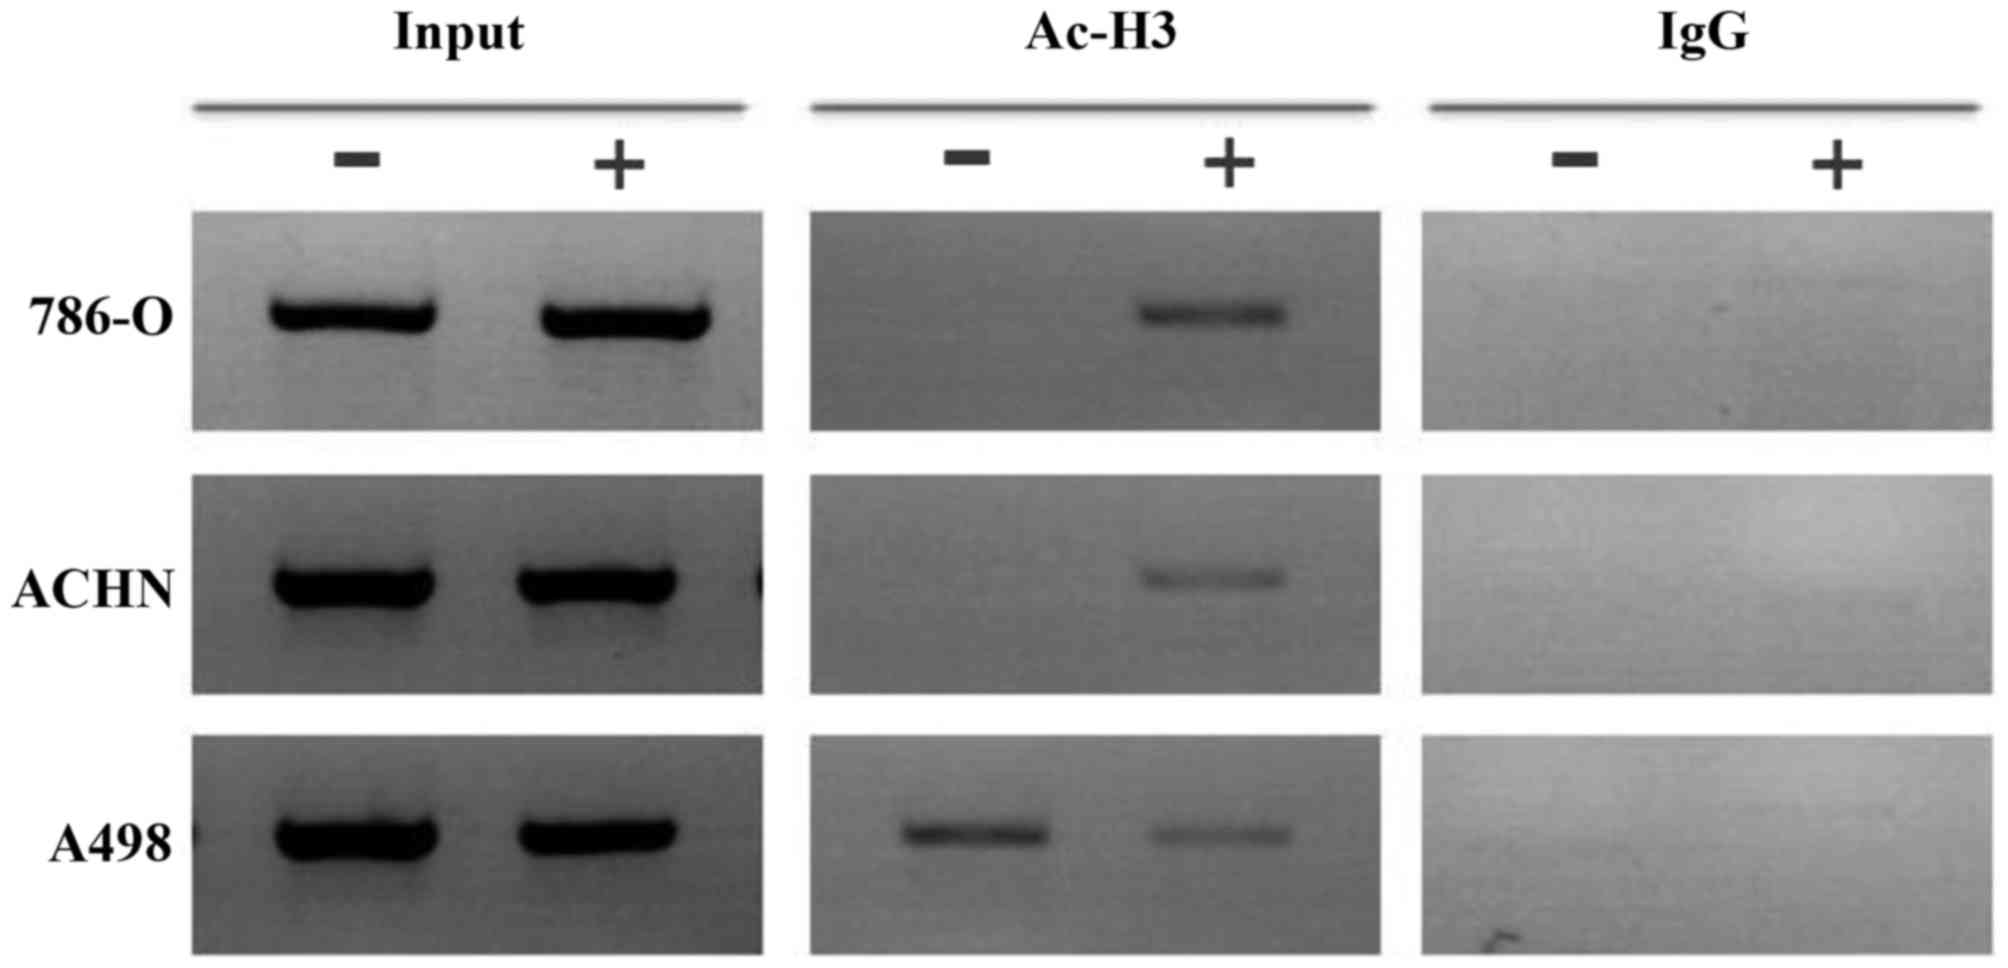
Histone deacetylation of the BNIP3
promoter region in RCC cells
As our results indicated that HDACI treatment led to
an increase in BNIP3 expression and the induction of apoptosis in
RCC cells, subsequently the histone deacetylation status of the
BNIP3 promoter region in RCC cells was determined, as this
could have provided an explanation for the effects of TSA. ChIP
assays demonstrated that histone H3 was deacetylated in the
BNIP3 promoter region in 786-O and ACHN cells, and that
histone H3 became acetylated after 48 h treatment with TSA (1.0
µmol/l, Fig. 5). However,
there was no change in histone H3 acetylation in the A498 cells
following treatment with TSA.
Discussion
The BNIP3 protein exhibits homology with the BH3
domain of B-cell lymphoma 2 (Bcl-2) protein, and is an atypical
member of the BH3-only subfamily (21). The mechanisms that connect
mitophagy with apoptosis are complicated, and these include
synergistic, antagonistic, and stimulatory effects; BNIP3 also
connects mitophagy with apoptosis, thus affecting the ultimate fate
of cells (22-26). BNIP3 is able to induce
mitochondrial autophagy in response to environmental changes to
promote cell survival; however, under seriously detrimental
environmental conditions, excessive mitochondrial autophagy is
induced, leading to apoptosis (27) (Fig.
6). The expression of BNIP3 in different tumors has been shown
to be inconsistent, as high expression levels of BNIP3 have been
reported in numerous other tumor types, including prostate cancer,
spongioblastoma, endometrial carcinoma, cervical cancer, invasive
breast cancer and lung cancer, to cite a few examples (28). Furthermore, low levels of BNIP3
expression have been observed in pancreatic cancer, gastric
carcinoma, colorectal cancer and ccRCC (28). Either BNIP3 activation or silencing
has been shown to promote tumor invasion, delay cell death, and
subsequently lead to poor prognosis in different types of tumor
(14,29-32).
However, the regulatory mechanism of BNIP3 in ccRCC has yet to be
elucidated.
 | Figure 6Mechanistic aspects of the
VHL-HIF-BNIP3 signaling pathway. Step A: The binding of HIF-α to
VHL and to the E3 ligase complex causes HIF-α to be ubiquitinated
and marked for degradation by the cell’s proteasomal complex. Step
B: In a hypoxic environment, HIF-α cannot bind the VHL protein, and
consequently cannot be degraded. Step C: Aberrant functioning of
VHL also leads to an accumulation of HIFα. Step D: HIF-α levels
rise in the cell, allowing the protein to bind with HIFβ. The
HIF-α/β heterocomplex may be translocated to the nucleus and bind
to specific HREs. Step E: HREs activates downstream genes,
including VEGF, PDGF, TGFα, and several others, which have
important roles in tumor growth and progression. BNIP3 can also be
activated by HREs. Step F: Structure of the BNIP3 protein: NH2,
N-terminal domain; BH3, Bcl-2 homology domain 3; CD, conserved
domain; TM, transmembrane domain; CT, COOH-terminal domain; Step G:
BNIP3 can induce mitochondrial autophagy in response to
environmental changes to promote cell survival. Step H: Under
seriously detrimental environmental conditions, excessive
mitochondrial autophagy is induced, leading to apoptosis. Step K:
BNIP3-induced cell death is also activated under conditions of
extreme hypoxia, acidosis and NO. Ub, ubiquitin; HRE,
hypoxia-response element; VHL, Hippel-Lindau; HIF-1(α/β),
hypoxia-inducible factor-1(α/β); VEGF, vascular endothelial growth
factor; PDGF, platelet-derived growth factor; TGFα, transforming
growth factor α. |
As a hypoxia-responsive gene downstream of HIF,
BNIP3 was originally considered to be overexpressed in response to
HIF upregulation; however, according to a study which examined 104
RCC tumor samples and 48 adjacent non-tumor tissue samples, the
lower levels of BNIP3 expression in tumor tissues was not
accompanied by high expression levels of HIF-1α and VEGF in ccRCC
(13). The present study revealed
that the expression of BNIP3 and VHL in tumor tissues was lower
compared with adjacent non-tumor tissues, whereas the expression of
HIF-1α and VEGF was higher in tumor tissues at the mRNA and protein
levels. Furthermore, low levels of BNIP3 expression were also
observed in RCC cell lines. These results suggest that the BNIP3
pathway may be blocked in a certain way, although the hypoxia/HIF-1
pathway remains intact, and HIF-1 continues to be normally
activated in RCC.
As previously described, BNIP3 silencing might
facilitate tumor survival. According to a study by Erkan et
al (32), the loss of BNIP3
expression contributes to chemoresistance and poor prognosis in
pancreatic cancer. In another study, Okami et al (17) described the contribution of BNIP3
silencing to the aggressive nature of pancreatic cancer. A reduced
expression of BNIP3 has also been reported in cases of
chemotherapy-resistant colon cancer (33,34).
In the present study, no association was identified between BNIP3
expression level and any of the pathological parameters examined in
patients with RCC. This may be due to the relatively low number of
samples included in this study, and additional studies featuring a
larger number of samples will be required to obtained more
conclusive results. In addition, VHL expression was also shown to
be negatively correlated with the tumor pathological stage, whereas
that of HIF-1α exhibited the opposite correlation, suggesting that
the HIF-1 pathway may have a role in the progression of RCC. VEGF
acts downstream of HIF-1; however, our study demonstrated a
negative correlation between VEGF and clinical parameters, a
finding which was not consistent with the results of previous
studies (13,35). Again, a larger sample size is
required in order to confirm these findings.
Epigenetic regulation, a modulation of gene
expression that does not rely on changes in the DNA sequence, can
be stably inherited in proliferating cells. DNA methylation and
histone deacetylation are two epigenetic mechanisms with crucial
roles in tumorigenesis and tumor progression. Hypermethylation
always occurs at CpG islands, which were originally defined as
regions of DNA with a G+C ratio >0.5 and an observed vs.
expected frequency of CpGs, which was shown to be >0.6 (36). The majority of CpG islands are
associated with promoter regions of housekeeping or tissue-specific
genes (37), and CpG
hypermethylation contributes to the functional inactivation of
genes involved in growth regulation (38) and DNA repair (39). The modification of histones leads
to alterations in the interactions between DNA and histones, thus
influencing chromatin tension and, subsequently, the regulation of
transcription. Deacetylation is the most important mechanism
involved in histone modification, which leads to the inhibition or
silencing of genes, including tumor suppressor genes.
DNA methylation is a proven mechanism of BNIP3
downregulation in tumors. In a previous study, Murai and coworkers
demonstrated that BNIP3 was methylated in 65.6% of colorectal
cancer tissues, although it was not methylated in adjacent normal
tissue samples (15,40). Similarly, Cleven et al
(41) also demonstrated the
occurrence of BNIP3 methylation in 52.8% of colorectal
cancer cells, and that treatment with 5-aza-C restored the
expression of BNIP3 and led to increased apoptosis and
autophagy, with enhanced sensitivity to chemotherapy. In another
study, Okami et al (17)
and Abe et al (42)
observed methylation of the BNIP3 promoter in pancreatic
cancer. In the current study, no methylation was detected in the
BNIP3 promoter region of either RCC tissues or cell lines.
In addition, treatment with 5-aza-C did not induce any changes in
RCC cell proliferation. These data suggest that the downregulation
of BNIP3 in RCC is not induced by methylation, but, instead, is a
consequence of histone deacetylation.
Murai et al (20) and Bacon et al (18) treated colorectal cancer cells with
the HDACI, TSA, leading to BNIP3 upregulation; Murai et al
(40) also identified histone
acetylation of the BNIP3 promoter region. In the present
study, the mRNA and protein expression levels of BNIP3 were
increased following treatment of the RCC 786-O, ACHN, and A498 cell
lines with TSA, and ChIP assays demonstrated histone deacetylation
in the BNIP3 promoter region of 786-O and ACHN RCC cells,
with the acetylation status restored following TSA treatment.
Therefore, it may be concluded that histone deacetylation is a
primary cause of BNIP3 inactivation in RCC.
However, A498 RCC cells did not exhibit histone
deacetylation in the BNIP3 promoter, and treatment with TSA
led to an increase in BNIP3 expression with no changes detected in
the BNIP3 promoter. Bacon et al (18) previously found that BNIP3 was
upregulated following either 5-aza-C or TSA treatment in certain
types of colorectal cancer cells, which had no initial methylation
or histone deacetylation in the BNIP3 promoter region. This
observation suggests that other mechanisms, and not only histone
deacetylation, are involved in the inactivation of BNIP3 in
RCC.
As a HDACI, TSA is known to reverse the deacetylated
status of histones (43), which
could possibly play a role in the mechanisms described above. The
growth inhibition and apoptosis induction characteristics of TSA
have also been established in several types of tumor cells
(44). Similarly to BNIP3, the
expression of numerous other genes, including p27 (45), increased following TSA treatment in
RCC, which leads to the promotion of cell apoptosis. Along with the
increased expression of several genes, TSA is able to activate a
range of signaling pathways, including the c-Jun N-terminal kinase
(JNK) signaling pathway (46), to
promote cell apoptosis, or it can suppress pathways, such as the
Wnt/beta catenin signaling pathway (47). However, the mechanisms according to
which these pathways interact, both with each other and with BNIP3,
have yet to be elucidated, and further studies are therefore
required.
In the present study, no concentration-dependent
effects for TSA treatment on cell proliferation and apoptosis were
observed, possibly since the concentrations that were selected for
comparison were too high, and the difference between the selected
concentrations was relatively small. Additionally, no significant
differences in the expression levels of BNIP3 mRNA were
observed when comparisons were made between groups treated with 1.0
or 2.0 µmol/l TSA. Hence, in subsequent Western blotting
experiments, the TSA 0.5 and 1.0 µmol/l treatment groups
were selected for comparison, and only the 1.0 µmol/l TSA
treatment group was selected for the ChIP assay as the largest
effects were observed in this group in our initial experiments.
Since the advent of molecular-targeted drugs,
significant progress has been made in terms of renal cancer
treatment. Agents acting on targets in the VHL-HIF hypoxia-response
gene pathway have increased the rate of disease control to almost
80%; however, according to the Response Evaluation Criteria In
Solid Tumors (RECIST), targeted therapies mostly lead to stable
disease, with low objective response rates (48). As a gene downstream of HIF,
BNIP3 encodes a mitochondrial pro-apoptotic protein which
has an important role in the biological behavior of renal carcinoma
cells. Research geared towards the development of new methods for
restoring BNIP3 expression and promoting its effects in causing RCC
tumor cell death may provide novel options for RCC treatment;
however, the demonstration of the mechanism of BNIP3 inactivation
in RCC in the present study was restricted to in vitro
experiments, and our findings require further confirmation in an
animal model. In addition, as a broad-spectrum HDAC, TSA is able to
induce tumor cell apoptosis in several different ways. The specific
blocking and restoration of BNIP3 expression are now required to
further explore the role of BNIP3 in the molecular pathogenesis of
RCC.
In conclusion, in the present study low levels of
expression of the pro-apoptosis gene, BNIP3, were
demonstrated in RCC cells with VHL inactivation and HIF
upregulation, and BNIP3 promoter methylation did not
contribute to BNIP3 suppression. TSA treatment was
demonstrated to restore the acetylated status of the BNIP3
gene, increase BNIP3 expression at both the mRNA and protein
levels, inhibit cell proliferation, and induce RCC cell death,
thereby indicating that deacetylation of the promoter region
histone appears to be a mechanism of BNIP3 inactivation, and
that BNIP3 could be a potential new target for RCC treatment.
Acknowledgments
We would like to thank Professor Qiao Zhou, Dr Miao
Xu, Dr Mengni Zhang and Dr Junya Tan for their support with
techniques and equipment.
Funding
This study was supported by the National Natural
Science Foundation of China (no. 81672552), the Basic Applied Plan
of Sichuan Provincial Science and Technology Department (no.
2014JY0085), and the 1.3.5 project for disciplines of excellence,
West China Hospital, Sichuan University (no. ZY2016104).
Availability of data and materials
The datasets described in the study are available
from the corresponding author on reasonable request.
Authors’ contribution
XL designed the study, guided experiments, carried
out analysis and reviewed the manuscript. YS contributed to the
study design, performed experiments with cell lines, collected and
analyzed data, and wrote the manuscript. ZL contributed to the
study design, performed experiments (sample collection and cell
lines) and wrote the manuscript. JBL and TL contributed to the
study design, performed experiments of cell lines and reviewed the
manuscript. HW and LH contributed to the study design, collected
samples, performed experiments with tissue sample and reviewed the
manuscript. JYL, QW, HZ, and GH contributed to the study design,
helped with sample collection and the preparation of cell lines,
analyzed data and reviewed the manuscript.
Ethics approval and consent to
participate
This research was approved by the West China
Hospital of Sichuan University Biomedical Research Ethics Committee
(Chengdu, China), and informed consent was obtained from each
patient.
Patient consent for publication
Not applicable.
Competing interests
The authors declare that they have no competing
interests.
References
|
1
|
Subramanian VS, Stephenson AJ, Goldfarb
DA, Fergany AF, Novick AC and Krishnamurthi V: Utility of
preoperative renal artery embolization for management of renal
tumors with inferior vena caval thrombi. Urology. 74:154–159. 2009.
View Article : Google Scholar : PubMed/NCBI
|
|
2
|
Clark PE: The role of VHL in clear-cell
renal cell carcinoma and its relation to targeted therapy. Kidney
Int. 76:939–945. 2009. View Article : Google Scholar : PubMed/NCBI
|
|
3
|
Motzer RJ, Hutson TE, Tomczak P,
Michaelson MD, Bukowski RM, Rixe O, Oudard S, Negrier S, Szczylik
C, Kim ST, et al: Sunitinib versus interferon alfa in metastatic
renal-cell carcinoma. N Engl J Med. 356:115–124. 2007. View Article : Google Scholar : PubMed/NCBI
|
|
4
|
Bultitude MF: Campbell-Walsh Urology. 10th
edition. BJU International; New York, NY: 2012
|
|
5
|
Guo K, Searfoss G, Krolikowski D, Pagnoni
M, Franks C, Clark K, Yu KT, Jaye M and Ivashchenko Y: Hypoxia
induces the expression of the pro-apoptotic gene BNIP3. Cell Death
Differ. 8:367–376. 2001. View Article : Google Scholar : PubMed/NCBI
|
|
6
|
Gunaratnam L, Morley M, Franovic A, de
Paulsen N, Mekhail K, Parolin DA, Nakamura E, Lorimer IA and Lee S:
Hypoxia inducible factor activates the transforming growth
factor-alpha/epidermal growth factor receptor growth stimulatory
pathway in VHL(−/−) renal cell carcinoma cells. J Biol Chem.
278:44966–44974. 2003. View Article : Google Scholar : PubMed/NCBI
|
|
7
|
Yasuda M, Theodorakis P, Subramanian T and
Chinnadurai G: Adenovirus E1B-19K/BCL-2 interacting protein BNIP3
contains a BH3 domain and a mitochondrial targeting sequence. J
Biol Chem. 273:12415–12421. 1998. View Article : Google Scholar : PubMed/NCBI
|
|
8
|
Kothari S, Cizeau J, McMillan-Ward E,
Israels SJ, Bailes M, Ens K, Kirshenbaum LA and Gibson SB: BNIP3
plays a role in hypoxic cell death in human epithelial cells that
is inhibited by growth factors EGF and IGF. Oncogene. 22:4734–4744.
2003. View Article : Google Scholar : PubMed/NCBI
|
|
9
|
Höckel M and Vaupel P: Tumor hypoxia:
Definitions and current clinical, biologic, and molecular aspects.
J Natl Cancer Inst. 93:266–276. 2001. View Article : Google Scholar : PubMed/NCBI
|
|
10
|
Vaupel P, Kelleher DK and Höckel M: Oxygen
status of malignant tumors: Pathogenesis of hypoxia and
significance for tumor therapy. Semin Oncol. 28(Suppl 8): 29–35.
2001. View Article : Google Scholar : PubMed/NCBI
|
|
11
|
Matak D, Brodaczewska KK, Lipiec M,
Szymanski Ł, Szczylik C and Czarnecka AM: Colony, hanging drop, and
methylcellulose three dimensional hypoxic growth optimization of
renal cell carcinoma cell lines. Cytotechnology. 69:565–578. 2017.
View Article : Google Scholar : PubMed/NCBI
|
|
12
|
Parks SK, Cormerais Y and Pouysségur J:
Hypoxia and cellular metabolism in tumour pathophysiology. J
Physiol. 595:2439–2450. 2017. View Article : Google Scholar : PubMed/NCBI
|
|
13
|
Luo L, Xiong ZB, Zeng H, Chen N, Chen XQ,
Zhang P and Li X: Expression of BNIP3 and its correlations to
HIF-1alpha and VEGF in clear cell renal cell carcinoma. Sichuan Da
Xue Xue Bao Yi Xue Ban. 43:79–82. 2012.In Chinese. PubMed/NCBI
|
|
14
|
Ding Y, Yu L, Li M, Liu L and Zhong H:
Establishment and biological characteristics of human renal
granular cell carcinoma cell line (GRC-1). Chin J Urol. 16:3–6.
1995.In Chinese.
|
|
15
|
Jiang Z, Liu X, Chang K, Liu X and Xiong
J: Allyl isothiocyanate inhibits the proliferation of renal
carcinoma cell line GRC-1 by inducing an imbalance between Bcl2 and
Bax. Med Sci Monit. 22:4283–4288. 2016. View Article : Google Scholar : PubMed/NCBI
|
|
16
|
Sun X, Lou L, Zhong K and Wan L:
MicroRNA-451 regulates chemoresistance in renal cell carcinoma by
targeting ATF-2 gene. Exp Biol Med (Maywood). Jan 1–2017.Epub ahead
of print. View Article : Google Scholar
|
|
17
|
Okami J, Simeone DM and Logsdon CD:
Silencing of the hypoxia-inducible cell death protein BNIP3 in
pancreatic cancer. Cancer Res. 64:5338–5346. 2004. View Article : Google Scholar : PubMed/NCBI
|
|
18
|
Bacon AL, Fox S, Turley H and Harris AL:
Selective silencing of the hypoxia-inducible factor 1 target gene
BNIP3 by histone deacetylation and methylation in colorectal
cancer. Oncogene. 26:132–141. 2007. View Article : Google Scholar
|
|
19
|
Livak KJ and Schmittgen TD: Analysis of
relative gene expression data using real-time quantitative PCR and
the 2(−Delta Delta C(T)) Method. Methods. 25:402–408. 2001.
View Article : Google Scholar
|
|
20
|
Murai M, Toyota M, Suzuki H, Satoh A,
Sasaki Y, Akino K, Ueno M, Takahashi F, Kusano M, Mita H, et al:
Aberrant methylation and silencing of the BNIP3 gene in colorectal
and gastric cancer. Clin Cancer Res. 11:1021–1027. 2005.PubMed/NCBI
|
|
21
|
Chinnadurai G, Vijayalingam S and Gibson
SB: BNIP3 subfamily BH3-only proteins: Mitochondrial stress sensors
in normal and pathological functions. Oncogene. 27(Suppl 1):
S114–S127. 2008. View Article : Google Scholar
|
|
22
|
Ryter SW, Mizumura K and Choi AM: The
impact of autophagy on cell death modalities. Int J Cell Biol.
2014.502676:2014.
|
|
23
|
Jing K and Lim K: Why is autophagy
important in human diseases? Exp Mol Med. 44:69–72. 2012.
View Article : Google Scholar : PubMed/NCBI
|
|
24
|
Gump JM and Thorburn A: Autophagy and
apoptosis: What is the connection? Trends Cell Biol. 21:387–392.
2011. View Article : Google Scholar : PubMed/NCBI
|
|
25
|
Su M, Mei Y and Sinha S: Role of the
Crosstalk between Autophagy and Apoptosis in Cancer. J Oncol.
2013.102735:2013.
|
|
26
|
Mariño G, Niso-Santano M, Baehrecke EH and
Kroemer G: Self-consumption: The interplay of autophagy and
apoptosis. Nat Rev Mol Cell Biol. 15:81–94. 2014. View Article : Google Scholar : PubMed/NCBI
|
|
27
|
Azad MB and Gibson SB: Role of BNIP3 in
proliferation and hypoxia-induced autophagy: Implications for
personalized cancer therapies. Ann N Y Acad Sci. 1210:8–16. 2010.
View Article : Google Scholar : PubMed/NCBI
|
|
28
|
Burton TR and Gibson SB: The role of Bcl-2
family member BNIP3 in cell death and disease: NIPping at the heels
of cell death. Cell Death Differ. 16:515–523. 2009. View Article : Google Scholar : PubMed/NCBI
|
|
29
|
Giatromanolaki A, Koukourakis MI, Gatter
KC, Harris AL and Sivridis E: BNIP3 expression in endometrial
cancer relates to active hypoxia inducible factor 1alpha pathway
and prognosis. J Clin Pathol. 61:217–220. 2008. View Article : Google Scholar
|
|
30
|
Giatromanolaki A, Koukourakis MI, Sowter
HM, Sivridis E, Gibson S, Gatter KC and Harris AL: BNIP3 expression
is linked with hypoxia-regulated protein expression and with poor
prognosis in non small cell lung cancer. Clin Cancer Res.
10:5566–5571. 2004. View Article : Google Scholar : PubMed/NCBI
|
|
31
|
Lukashova-v Zangen I, Kneitz S, Monoranu
CM, Rutkowski S, Hinkes B, Vince GH, Huang B and Roggendorf W:
Ependymoma gene expression profiles associated with histological
subtype, proliferation, and patient survival. Acta Neuropathol.
113:325–337. 2007. View Article : Google Scholar : PubMed/NCBI
|
|
32
|
Erkan M, Kleeff J, Esposito I, Giese T,
Ketterer K, Büchler MW, Giese NA and Friess H: Loss of BNIP3
expression is a late event in pancreatic cancer contributing to
chemoresistance and worsened prognosis. Oncogene. 24:4421–4432.
2005. View Article : Google Scholar : PubMed/NCBI
|
|
33
|
Tang H, Liu YJ, Liu M and Li X:
Establishment and gene analysis of an oxaliplatin-resistant colon
cancer cell line THC8307/L-OHP. Anticancer Drugs. 18:633–639. 2007.
View Article : Google Scholar : PubMed/NCBI
|
|
34
|
de Angelis PM, Fjell B, Kravik KL, Haug T,
Tunheim SH, Reichelt W, Beigi M, Clausen OP, Galteland E and Stokke
T: Molecular characterizations of derivatives of HCT116 colorectal
cancer cells that are resistant to the chemotherapeutic agent
5-fluorouracil. Int J Oncol. 24:1279–1288. 2004.PubMed/NCBI
|
|
35
|
Jacobsen J, Grankvist K, Rasmuson T, Bergh
A, Landberg G and Ljungberg B: Expression of vascular endothelial
growth factor protein in human renal cell carcinoma. BJU Int.
93:297–302. 2004. View Article : Google Scholar : PubMed/NCBI
|
|
36
|
Gardiner-Garden M and Frommer M: CpG
islands in vertebrate genomes. J Mol Biol. 196:261–282. 1987.
View Article : Google Scholar : PubMed/NCBI
|
|
37
|
Bird AP: CpG-rich islands and the function
of DNA methylation. Nature. 321:209–213. 1986. View Article : Google Scholar : PubMed/NCBI
|
|
38
|
Graff JR, Herman JG, Myöhänen S, Baylin SB
and Vertino PM: Mapping patterns of CpG island methylation in
normal and neoplastic cells implicates both upstream and downstream
regions in de novo methylation. J Biol Chem. 272:22322–22329. 1997.
View Article : Google Scholar : PubMed/NCBI
|
|
39
|
Herman JG, Umar A, Polyak K, Graff JR,
Ahuja N, Issa JP, Markowitz S, Willson JK, Hamilton SR, Kinzler KW,
et al: Incidence and functional consequences of hMLH1 promoter
hypermethylation in colorectal carcinoma. Proc Natl Acad Sci USA.
95:6870–6875. 1998. View Article : Google Scholar : PubMed/NCBI
|
|
40
|
Murai M, Toyota M, Satoh A, Suzuki H,
Akino K, Mita H, Sasaki Y, Ishida T, Shen L, Garcia-Manero G, et
al: Aberrant DNA methylation associated with silencing BNIP3 gene
expression in haematopoietic tumours. Br J Cancer. 92:1165–1172.
2005. View Article : Google Scholar : PubMed/NCBI
|
|
41
|
Cleven AHG, Spiertz A, Wouters B, van
Engeland M and De Bruine A: Stromal expression of RIF 2A correlates
with BNIP3 promoter hypermethylation and overall patient survival
in colorectal carcinomas. Cell Oncol. 29:1272007.
|
|
42
|
Abe T, Toyota M, Suzuki H, Murai M, Akino
K, Ueno M, Nojima M, Yawata A, Miyakawa H, Suga T, et al:
Upregulation of BNIP3 by 5-aza-2′-deoxycytidine sensitizes
pancreatic cancer cells to hypoxia-mediated cell death. J
Gastroenterol. 40:504–510. 2005. View Article : Google Scholar : PubMed/NCBI
|
|
43
|
Eckschlager T, Plch J, Stiborova M and
Hrabeta J: Histone Deacetylase Inhibitors as Anticancer Drugs. Int
J Mol Sci. 18:pii: E1414. 2017. View Article : Google Scholar : PubMed/NCBI
|
|
44
|
Park KC, Heo JH, Jeon JY, Choi HJ, Jo AR,
Kim SW, Kwon HJ, Hong SJ and Han KS: The novel histone deacetylase
inhibitor, N-hydroxy-7-(2-naphthylthio) hepatonomide, exhibits
potent antitumor activity due to cytochrome-c-release-mediated
apoptosis in renal cell carcinoma cells. BMC Cancer. 15:192015.
View Article : Google Scholar : PubMed/NCBI
|
|
45
|
Park WH, Jung CW, Park JO, Kim K, Kim WS,
Im YH, Lee MH, Kang WK and Park K: Trichostatin inhibits the growth
of ACHN renal cell carcinoma cells via cell cycle arrest in
association with p27, or apoptosis. Int J Oncol. 22:1129–1134.
2003.PubMed/NCBI
|
|
46
|
Nagata Y and Todokoro K: Requirement of
activation of JNK and p38 for environmental stress-induced
erythroid differentiation and apoptosis and of inhibition of ERK
for apoptosis. Blood. 94:853–863. 1999.PubMed/NCBI
|
|
47
|
Yang Q, Wang Y, Pan X, Ye J, Gan S, Qu F,
Chen L, Chu C, Gao Y and Cui X: Frizzled 8 promotes the cell
proliferation and metastasis of renal cell carcinoma. Oncotarget.
8:78989–79002. 2017.PubMed/NCBI
|
|
48
|
Santos N, Wenger JB, Havre P, Liu Y, Dagan
R, Imanirad I, Ivey AM, Zlotecki RA, Algood CB, Gilbert SM, et al:
Combination therapy for renal cell cancer: What are possible
options? Oncology. 81:220–229. 2011. View Article : Google Scholar : PubMed/NCBI
|