Introduction
Breast cancer (BRC) is the leading type of cancer
affecting women and can be divided into 5 subtypes as follows:
Human epidermal growth factor receptor 2 (HER2), luminal A, luminal
B, basal-like and normal-like (1,2).
Based on DNA copy number and genome-wide analyses, patients with
BRC can be separated into low- and high-risk disease progression
groups to avoid unnecessary treatment (3). However, these classification systems
do not cover all the pathological heterogeneities of BRC. Thus, the
development of more effective diagnostic strategies and novel
therapeutic markers is continually required. Among several markers,
epigenetic alterations (histone modifications, DNA
methylation/demethylation and miRNA regulation) in BRC are
recognized as important pathways for BRC proliferation and
metastasis (4,5).
The histone methyltransferase, euchromatic
histone-lysine N-methyltransferase 2 (EHMT2) mono- and
di-methylates lysine 9 on histone H3 to form heterochromatic
regions, leading to gene suppression in cancer (6). In BRC, EHMT2 regulates BRC metastasis
via MSK1 regulation (7) and is
involved in BRC proliferation via the regulation of ferroxidase
hephaestin (8), nuclear factor
(NF)-κB (9) and Sox2 protein
stability (10). In addition,
EHMT2 is associated with a poor prognosis in esophageal squamous
cell carcinoma and melanoma (11,12).
However, the prognostic characteristics and molecular functions of
EHMT2 in BRC are not yet fully understood.
Heat shock protein family D (Hsp60) member 1
(HSPD1), drives T-cell and B-cell activation and positively
regulates the production of a number of interferons and
interleukins. In cancer, HSPD1 is involved in mitochondrial
dysfunction and the downregulation of HSPD1 induces cancer cell
apoptosis (13,14). Furthermore, several heat shock
proteins, such as HSP60, HSP70 and HSP90, have prognostic
significance in several types of cancer (15). Thus, the regulation of HSPD1 in BRC
is an attractive therapeutic target for BRC treatment.
In this study, we gathered RNA-seq data from BRC
tissues (n=1,222) and normal tissues (n=113) derived from The
Cancer Genome Atlas (TCGA) and identified EHMT2 overexpression and
its prognostic value using multiple patient cohorts (n=1,644).
Furthermore, phosphor array and immunocytochemical analyses
revealed that alterations in HSPD1 expression levels and cell
localization due to EHMT2 knockdown induced cell apoptosis.
Moreover, in multiple patient cohorts, a positive association
between EHMT2 and HSPD1 was observed, suggesting that
EHMT2 may be a novel therapeutic and prognostic marker for BRC
treatment.
Materials and methods
Cell culture and reagents
The human BRC cell lines, MCF7 and MDA-MB-231, were
cultured in DMEM supplemented with 10% fetal bovine serum (FBS) and
1% penicillin/streptomycin in a humidified 5% CO2
atmosphere at 37˚C according to the manufacturer’s instructions
(16). BIX01294 (an EHMT2
inhibitor) was purchased from Abcam (ab141407; Cambridge, MA, USA).
The MDA-MB-231 cells were treated with 9 µM BIX01294 for 24
h. DMSO was used for the control treatments.
Public datasets of BRC patients,
including TCGA data
In total, 3 cohorts (n=1,644) of patients with BRC,
including the TCGA data, were used in this study. mRNA expression
(RNA-seq) data were obtained from the cBioPortal website (n=817,
TCGA cohort, http://www.cbioportal.org). We downloaded mRNA
quantification data (RSEM format), to which log2 transformation and
quantile normalization were applied. For comparative analysis in
expression of methyltransferases between tumor and normal, we used
a TCGA dataset with provisional version (n=1,222 in tumor and n=113
in normal samples). To assess the association between BRC patient
clusters and molecular/histological subtypes, another version of
TCGA dataset (n=817, TCGA cohort) providing clinicopatholical data
was used (17). We also obtained
gene expression datasets of patients with BRC from the University
of North Carolina Lineberger Comprehensive Cancer Center (n=500,
UNC500 cohort) and the Koo Foundation SYS Cancer Center (GSE20685,
n=327, KFSYSCC cohort), which are freely available from the NCBI
GEO database. Among the cohorts, gene expression data from the
UNC500 cohort were generated by combining 4 subpatient cohorts,
including GSE18229, GSE20624, GSE2741 and GSE6128. All gene
expression data used in this study contained information on patient
survival and follow-up times, which was used to estimate the
prognostic relevance of a gene expression signature.
Recurrence-free survival was defined as the time from surgery to
the first confirmed relapse. Metastasis-free survival was used as
the time from surgery to the metastasis to distant organ. The
baseline characteristics of the 3 BRC patient cohorts for verifying
the prognostic relevance of EHMT2 are presented in Table I.
 | Table IBaseline characteristics of the
breast cancer patient cohorts. |
Table I
Baseline characteristics of the
breast cancer patient cohorts.
| UNC500 | KFSYSCC | TCGA |
|---|
| Variables | cohort | cohort | cohort |
| Patients (n) | 500 | 327 | 817 |
| Age (years) | | | |
| Median | 55 | 46 | 59 |
| Range | 24-93 | 24-84 | 26-90 |
| Histology (%) | | | |
| Infiltrating
ductal | | | 599 (73.3) |
| Carcinoma | | | |
| Infiltrating
lobular | | | 143 (17.5) |
| Carcinoma | | | |
| Mucinous
carcinoma | | | 14 (1.7) |
| Medullary
carcinoma | | | 5 (0.6) |
| Metaplastic
carcinoma | | | 3 (0.4) |
| Others | | | 54 (6.6) |
| NA | 500 (100) | 327 (100) | |
| T
classification | | | |
| T1 | | 101 (30.9) | 219 (26.8) |
| T2 | | 188 (57.5) | 459 (56.2) |
| T3 | | 26 (8) | 105 (12.9) |
| T4 | | 12 (3.7) | 34 (4.2) |
| NA | 500 (100) | | |
| N
classification | | | |
| N0 | 182 (36.4) | 137 (41.9) | 382 (46.8) |
| N1 | 189 (37.8) | 87 (26.6) | 278 (34) |
| N2 | 26 (5.2) | 63 (19.3) | 85 (10.4) |
| N3 | 0 (0) | 40 (12.2) | 58 (7.1) |
| NA | 103 (20.6) | | 14 (1.7) |
| AJCC stage | | | |
| I | | | 140 (17.1) |
| II | | | 461 (56.4) |
| III | | | 184 (22.5) |
| IV | | | 13 (1.6) |
| NA | 500 (100) | 327 (100) | 19 (2.3) |
| ER | | | |
| Positive | 243 (48.6) | 206 (63) | 593 (72.6) |
| Negative | 243 (48.6) | 121 (37) | 174 (21.3) |
| NA | 14 (2.8) | | 50 (6.1) |
| PR | | | |
| Positive | | 258 (78.9) | 522 (63.9) |
| Negative | | 69 (21.1) | 251 (30.7) |
| NA | 500 (100) | | 44 (5.4) |
| HER2 | | | |
| Positive | 78 (15.6) | 78 (23.9) | 121 (14.8) |
| Negative | 369 (73.8) | 249 (76.1) | 417 (51) |
| NA | 53 (10.6) | | 279 (34.1) |
| Adjuvant
chemotherapy | | | |
| Yes | | 268 (82) | 40 (4.9) |
| No | | 54 (16.5) | 12 (1.5) |
| NA | 500 (100) | 5 (1.5) | 765 (93.6) |
| Death, n | 91 | 83 | 120 |
| Median
follow-up | 30.5 | 97.2 | 28.9 |
| (month) | | | |
Immunohistochemical staining
The EnVision+ kit/HRP kit (Dako, Carpinteria, CA,
USA) was used for immunohisto-chemical staining. Paraffin-embedded
sections of breast tumor specimens were processed in a microwave
(90˚C) with an antigen-retrieval solution (pH 9, S2367; Dako) and
treated with a peroxidase-blocking reagent followed by a
protein-blocking reagent (K130, X0909; Dako). Tissue sections were
incubated (4°C, 12 h) with a rabbit anti-EHMT2 antibody (1/500
dilution) (CSB-PA007497GA01HU; Cusabio, Houston, TX, USA), followed
by incubation (room temperature, 1 h) with an HRP-conjugated
secondary antibody (K4002; Dako). Immunoreactivity was visualized
with a chromogenic substrate (Liquid DAB Chromogen; Dako). Finally,
tissue specimens were stained (room temperature) with Mayer’s
hematoxylin solution (Hematoxylin QS; Vector Laboratories) for 20
sec to discriminate the nucleus from the cytoplasm. Human BRC
tissues were purchased from Biochain Institute Inc. (T8235731-2;
Newark, CA, USA)
Immunofluorescence
Immunofluorescence was performed according to
previously described methods (18,19).
Cells grown on a 4-well chamber slide (Nalge Nunc, Rochester, NY,
USA) were washed 2 times with PBS, fixed with 100% methanol for 5
min at −20°C. The cells were covered with PBS containing 5% bovine
serum albumin for 1 h at room temperature to block non-specific
hybridization and then incubated with rabbit anti-HSPD1 antibody
(#12165S; Cell Signaling Technology) at a 1:1,000 dilution ratio.
After being washed with PBS, the cells were stained with an Alexa
Fluor 488-conjugated anti-rabbit secondary antibody (1:5000
dilution ration) (A11008; Thermo Fisher Scientific, Waltham, MA,
USA). Nuclei were counter-stained with
4′,6′-diamidino-2-phenylindole dihydrochloride (DAPI) (H-1200;
Vector Laboratories, Burlingame, CA, USA).
Semi-quantitative RT-PCR
Total RNA was isolated from the indicated cell lines
using a Qiagen RNeasy Mini kit according to previously described
methods (20,21). RNA aliquots of 1 µg were
then reverse transcribed using the iScript™ cDNA synthesis kit
(Bio-Rad Laboratories, Inc., Hercules, CA, USA) according to
standard protocols. For semi-quantitative RT-PCR, cDNA was used as
the template for PCR, performed using AccuPower®
HotStart PCR PreMix (Bioneer, Daejeon, South Korea). For
semi-quantitative RT-PCR, PCR reactions were performed using the
SimpliAmp Thermal Cycler [annealing temperature 58°C, 35 cycles
(EHMT2), 30 cycles (ACTB, HSP60)] (Applied Biosystems, Foster City,
CA, USA) following the manufacturer’s instructions. The PCR primers
used were as follows: EHMT2 (forward, 5′-GAGAACATCTGC CTGCACTG-3′
and reverse, 5′-GTTGACAGCATGGAGG TCAC-3′), HSPD1 (forward,
5′-GTCTTCAGGTTGTGGCAG TC-3′ and reverse,
5′-GGCATCGTCTTTGGTCACAA-3′) and ACTB (forward,
5′-ACTCTTCCAGCCTTCCTTCC-3′ and reverse,
5′-CAATGCCAGGGTACATGGTG-3′). Gel condition (1% agarose gel) and
Safe DNA stain for visualization method (Safe-01-01; Bioland,
Scientific LLC, Paramount, CA USA) were used, and then the ATTO
E-graph system (AE-9000N; ATTO, Tokyo, Japan) was used for
observation.
3D culture
To perform the spheroid culturing of the MCF7 cells,
ultra-low attachment microplates were used (cat. no. 4515; Corning
Inc., Corning, NY, UYSA). Following EHMT2 knockdown,
1×10⁴ cells were loaded onto a spheroid culture plate,
grown for 3 days, and then observed under a microscope(Ti-S; Nikon,
Tokyo, Japan), as previously described (22).
siRNA transfection
siRNA duplexes against EHMT2 (siEHMT2;
5′-GCAAAUAUUUCACCUGCCATT-3′ and 5′-UGGCAGGUGAAAUAUUUGCTT-3′) were
purchased from ST Pharm Co. Ltd. (Seoul, Korea), and siRNA duplexes
against HSPD1 (siHSPD1; 5′-GUGUUGAAGGAUCUUUGAUTT-3′ and
5′-AUCAAAGAUCCUUCAACACTT-3′) were purchased from Bioneer (Daejeon,
Korea). Negative control siRNA (siCont; 5′-AUGAACGUGAAUUGCUCAATT-3′
and 5′-UUGAGCAAUUCACGUUCACTT-3′) was used for the control
treatments. The siRNAs (100 nM) were transfected into the cancer
cell lines using RNAiMax (Thermo Fisher Scientific, Inc.) for 72
h.
Western blot analysis
The cells were washed once with PBS and then lysed
in cold lysis buffer (50 mM Tris-HCl, pH 7.4, 150 mM NaCl, 1%
Triton X-100, 0.1% SDS, 1 mM EDTA, 1 mM Na3VO4, 1 mM NaF and 1X
protease inhibitor cocktail). Cell lysates were centrifuged at
14,000 × g for 15 min at 4°C and then boiled in 5X sample buffer
following protein determination (BSA, #23208; Thermo Fisher
Scientific, Inc.). The protein samples were subjected to western
blot analysis. For western blot analysis, nitrocellulose membranes
(#1620145; Bio-Rad Laboratories, Inc.) and blocking reagent (5%
skim milk, 1 h, room temperature), precasting gel (#456-1094;
Bio-Rad Laboratories, Inc.) were used with the indicated antibodies
at a 1:1,000 or 1:500 dilution ratio. The samples were stained with
anti-HSPD1 (#12165S), poly(ADP-ribose) polymerase (PARP; #9542S)
and caspase-3 (#9662S) antibodies from Cell Signaling Technology,
Inc. (Danvers, MA, USA), EHMT2 (CSB-PA007497GA01HU) antibodies from
Cusabio and ACTB (SC-47778) antibodies from Santa Cruz
Biotechnology, Inc. (Santa Cruz, CA, USA), at 4°C (overnight).
Secondary antibodies (rabbit; SC-2357, mouse; SC-2031, Santa Cruz
Biotechnology, Inc.) were incubated at room temperature, 1 h, and
ECL solution (#170-5060; Bio-Rad Laboratories, Inc.) was used for
visualization.
Cell growth assay
Following treatment, the cells were washed twice
with PBS and fixed with cold 100% methanol for 5 min at −20°C.
After being washed twice with PBS, the cells were stained with 0.1%
crystal violet solution (C0775; Sigma-Aldrich; Merck KGaA,
Darmstadt, Germany) for 5 min at room temperature. The cells were
then washed 5 times with distilled water and observed under a
microscope (Ti-S; Nikon). The results were analyzed using ImageJ
software (version 1.8.0).
Statistical analysis
To divide the BRC patients into 2 groups based on
EHMT2 gene expression, we applied the median gene expression
value in each cohort as the cut-off. The Kaplan-Meier method was
used to calculate the time to death, metastasis, or recurrence and
differences between the times were assessed using log-rank
statistics. A hierarchical clustering algorithm was applied using
the centered correlation coefficient as the measure of similarity
and complete linkage clustering. To estimate the independent
utility of the signature, we performed multivariate Cox regression
analysis combined with known clinicopathological risk factors. A
backward-forward step procedure (function step, R package
stats) was carried out to optimize the multivariate model with the
most informative variables. For comparing the ratio of molecular or
histological factors between the subpatient groups, we applied
Fisher’s exact (2 categories) or χ2 tests (3 or more
categories). To assess the associations between mRNA expression and
the prognostic subgroups divided by the signature, we performed
point-biserial correlation tests (function cor.test, R
package stats)on the expression data and BRC patient subgroups. To
estimate the significance of gene expression differences between
the patient subgroups, we performed a two-sample t-test for each
gene. All statistical tests were carried out using R language
environment (ver. 3.5.1).
Gene set enrichment and upstream regulator analyses
were performed using Ingenuity Pathway Analysis (IPA, Ingenuity
Systems, www.ingenuity.com). Gene set enrichment
analysis was carried out to identify the most significant gene sets
associated with the disease process, molecular and cellular
functions, and physiological and developmental conditions. The
significances of over-represented gene sets were estimated by
Fisher’s exact test. To explore the associations between genes in
the gene set associated with EHMT2, we performed upstream
regulator analysis searching for known targets of each regulator in
the dataset and compared their direction of change to the expected
change based on previously published literature provided by IPA
knowledgebase.
Results
Overexpression of EHMT2 in BRC
To identify histone methyltransferase
overexpression, we gathered RNA-seq data on normal (113 samples)
and BRC (1,222 samples) tissues from the TCGA portal and analyzed
the expression levels of 61 histone methyltransferase and
demethylase proteins, revealing an upregulated EHMT2 expression in
BRC tissues compared with that in normal tissues (Fig. 1A and B). Moreover,
immunohistochemical analysis with the BRC tissue microarray
revealed a high EHMT2 expression in BRC tissues compared with that
in normal breast tissue (Fig. 1C).
Taken together, these results indicated that EHMT2 was
overexpressed in BRC.
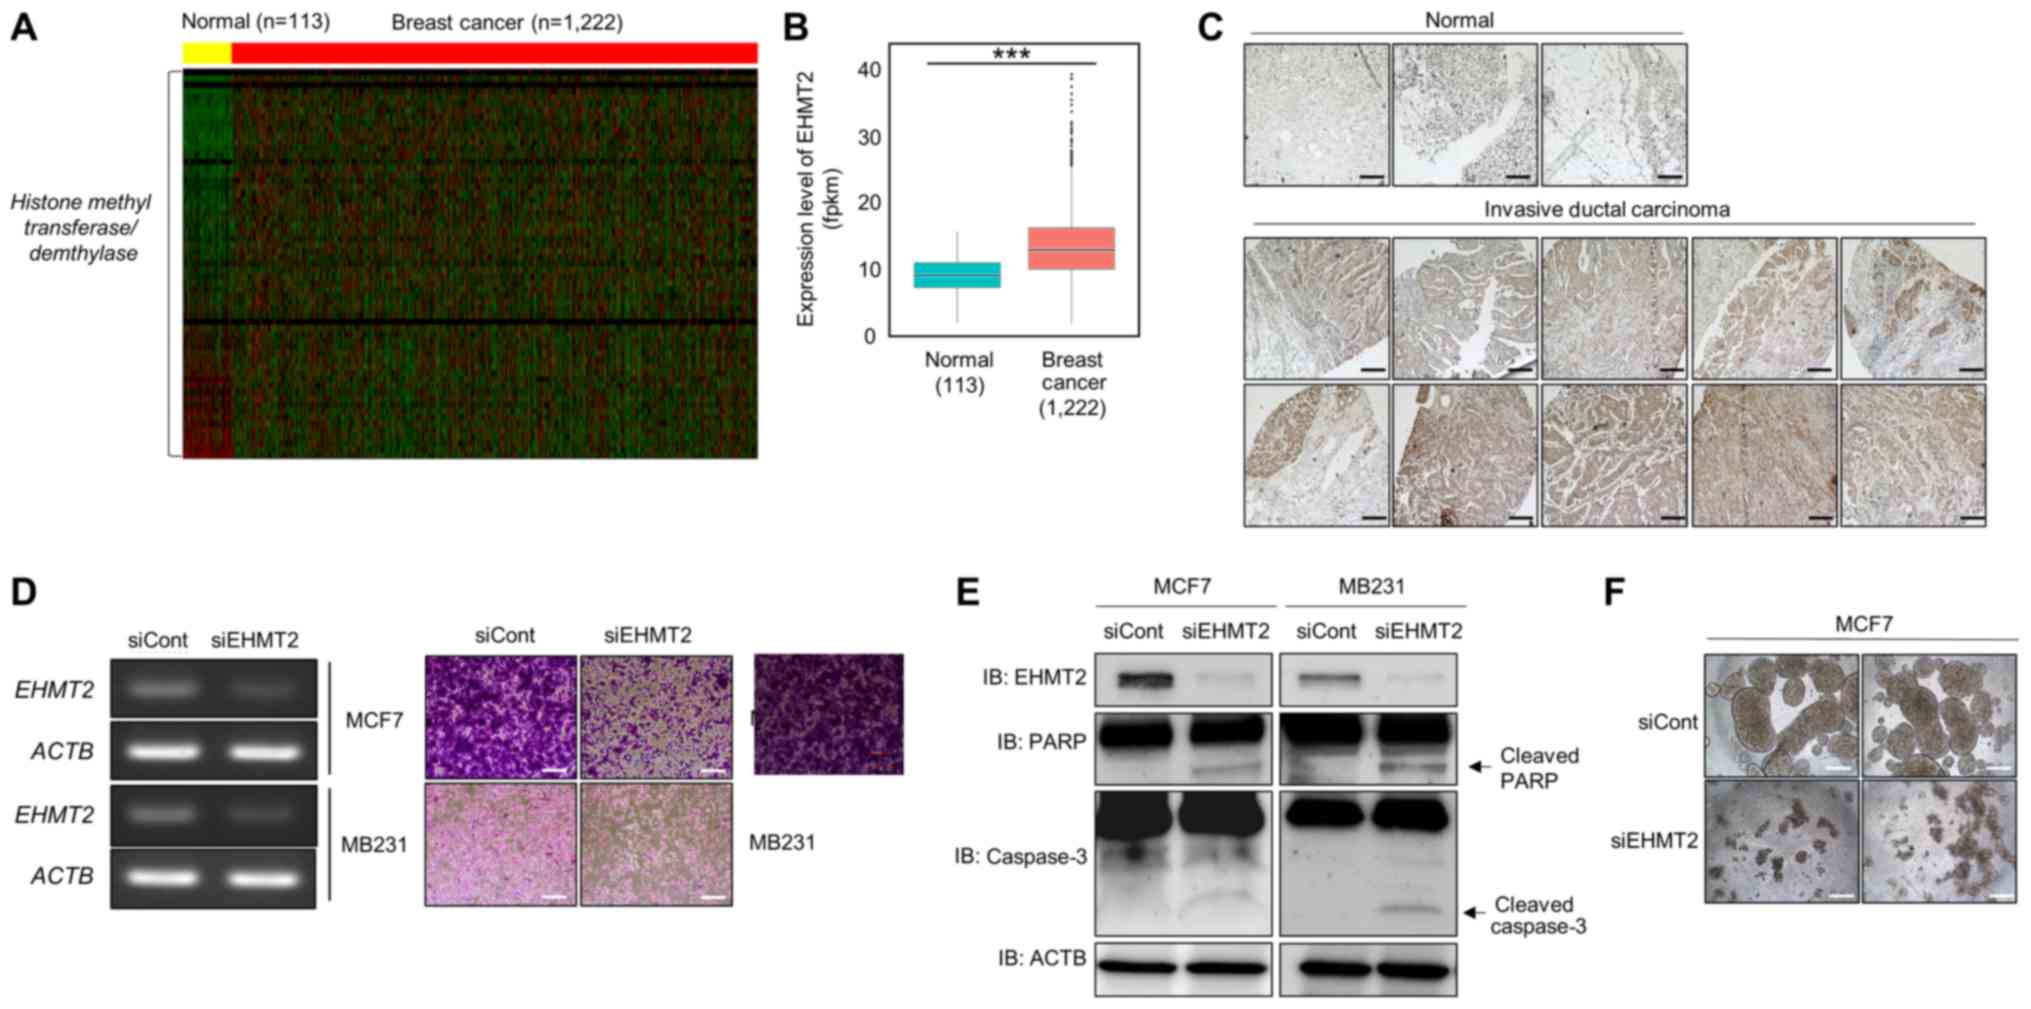 | Figure 1EHMT2 is overexpressed in breast
cancer (BRC). (A) Heatmap of gene expression related to histone
methylation/demethylation in the in silico histone
methyltransferase/demethylase panel, sorted by fold change in the
BRC/normal FPKM value. In the heatmap, yellow indicates normal
liver samples, while red indicates BRC samples in TCGA. The
threshold was set to a 2.0-fold-change. (B) Expression levels of
EHMT2 in BRC using normal and BRC samples. P-values were
calculated using Wilcoxon’s tests
(***P<0.001). (C)
Immunohistochemical analysis of EHMT2 in a BRC tissue microarray.
Breast cancer tissues were purchased from BioChain. Scale bar, 200
µm. (D) Cell growth assay. After knocking down EHMT2 for 72
h, RT-qPCR analysis of EHMT2 was performed. Actin (ACTB) was used
as the internal control (left panel). Cell fixation with 100%
methanol and cell staining with crystal violet was performed. Scale
bar, 100 µm (right panel); siRNA duplexes against EHMT2
(siEHMT2; 5′-GCAAAUAUUUCACCUGCCATT-3′, 5′-UGGCAGGUGAAAUAUUUGCTT-3′)
were purchased from ST Pharm. Negative control siRNA was also used
(siCont; 5′-AUGAACGUGAAUUGCUCAATT-3′, 5′-UUGAGCAAUUCACGUUCACTT-3′).
(E) Western blot analysis of EHMT2, PARP, caspase-3 and β-catenin.
ACTB was used as the internal control. (F) Spheroid formation. MCF7
cells treated with siEHMT2 and siCont were loaded onto a spheroid
plate and incubated for 96 h. The cells were imaged under a
microscope. Scale bar, 500 µm. |
To identify the connection between EHMT2 and cell
growth, we performed a cell growth assay following transfection
with siEHMT2; siCont served as the negative control. EHMT2
expression was significantly decreased by transfection with siEHMT2
(Fig. 1D, left panel), and in the
growth assay, the number of cells was suppressed by EHMT2 knockdown
(Fig. 1D, right panel). In
addition, we detected cleaved caspase-3 and PARP expression
following transfection with siEHMT2 in BRC cell lines by western
blot analysis. Our results suggested that the overexpression of
EHMT2 may promote cell proliferation via inhibiting cell apoptosis,
as the knockdown of EHMT2 increased the levels of cleave PARP and
caspase-3 (Fig. 1E). Subsequently,
to assess whether EHMT2 affects cell aggregation, we performed 3D
culturing, a biomimetic system for cancer cell growth, and observed
inhibited cell aggregation in the EHMT2 knockdown group compared
with that in MCF7 cells transfected with siCont (Fig. 1F). Thus, EHMT2 plays important
roles in the survival and proliferation of BRC cell lines.
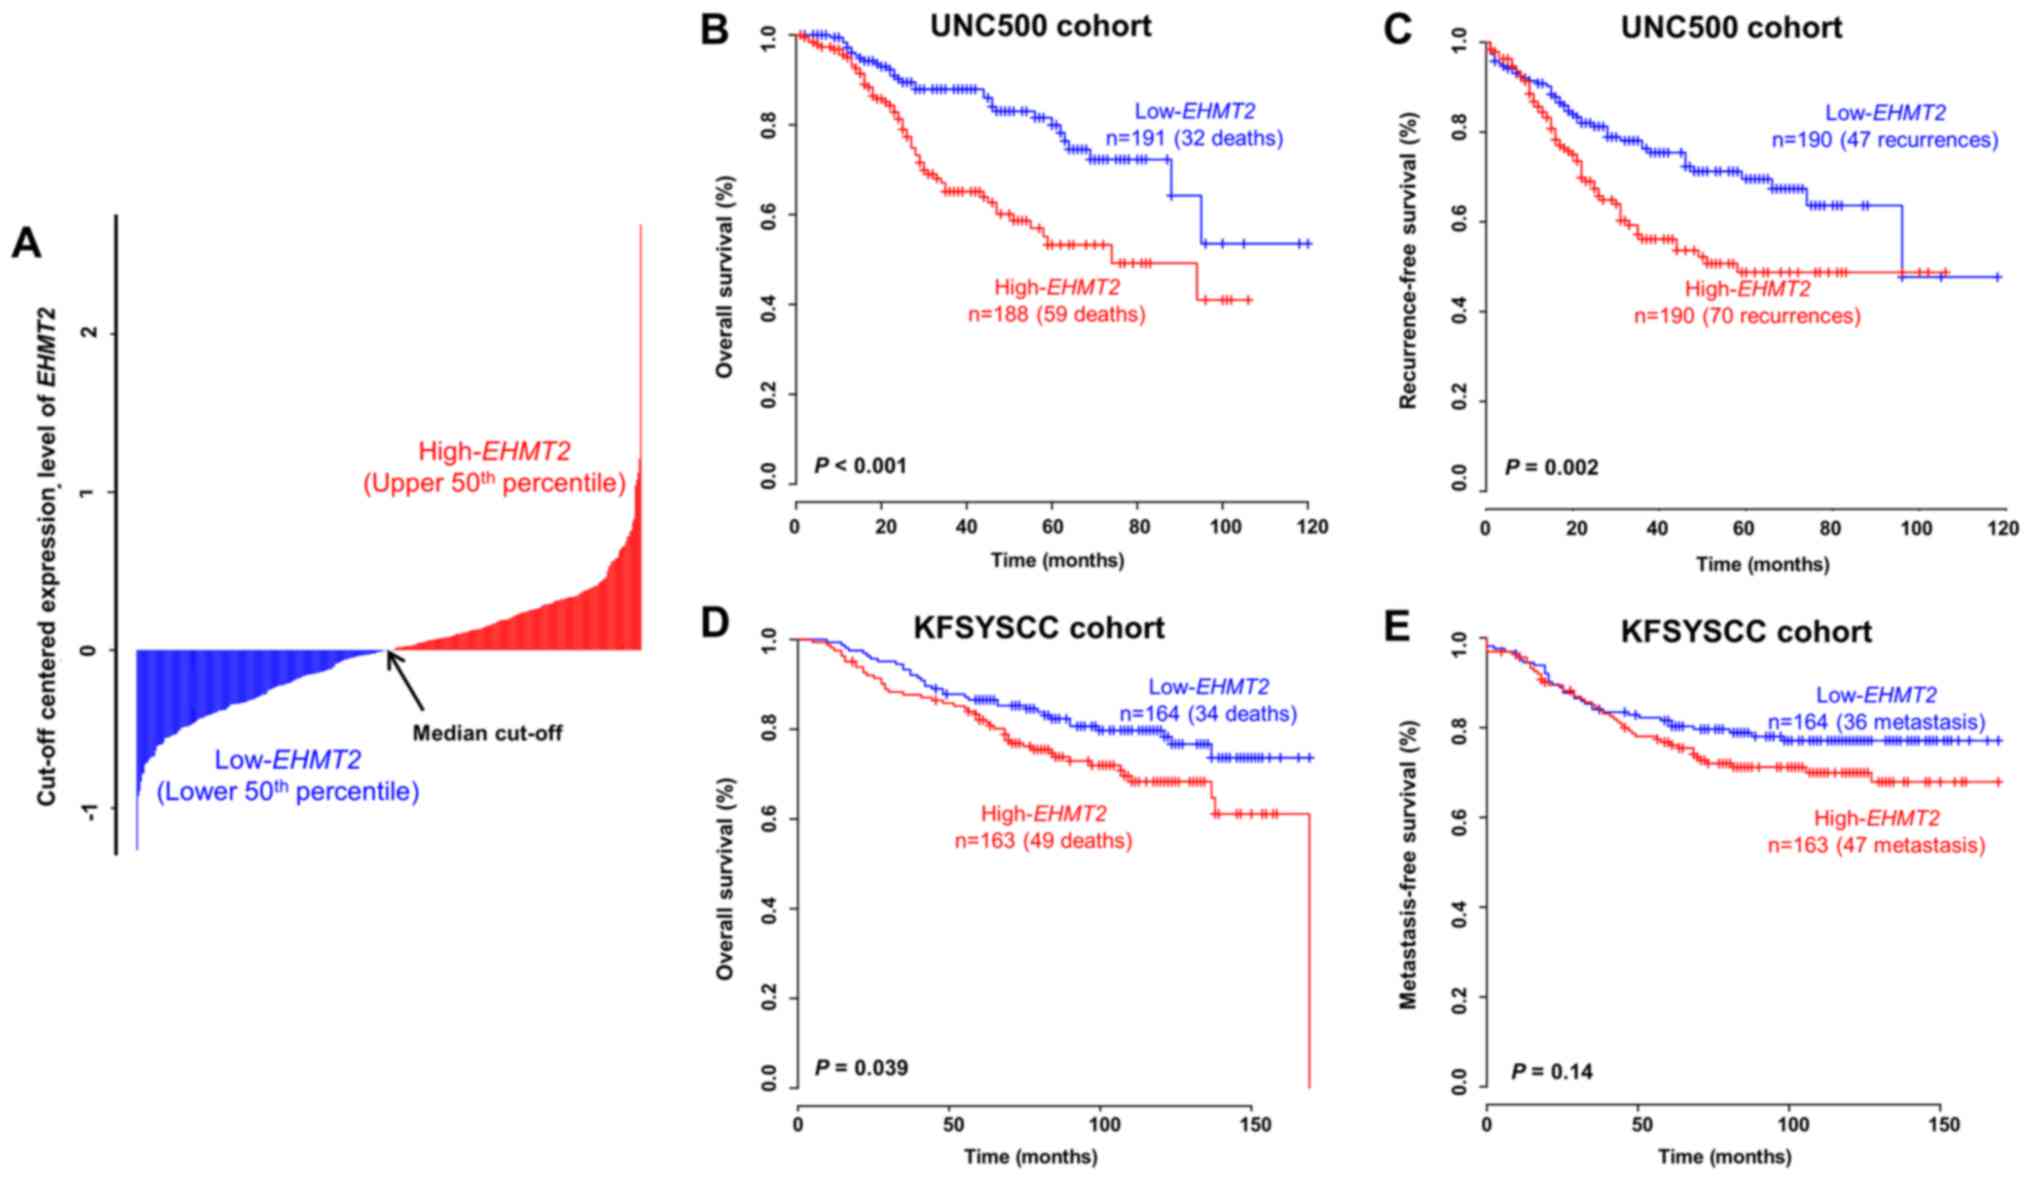
Prognostic value of EHMT2 in patients
with BRC
To determine whether EHMT2 has prognostic
value in BRC, we analyzed gene expression data obtained from
independent BRC patient cohorts. When dividing patients in the
UNC500 cohort into 2 groups based on the median threshold of
EHMT2 expression, the overall survival rate was
significantly lower in the high-EHMT2 subgroup than in the
low-EHMT2 subgroup (log-rank test, P<0.001; Fig. 2A and B). When estimating
recurrence-free survival with the same cut-off value, the
recurrence rate in the high-EHMT2 subgroup was also
significantly higher than that in the low-EHMT2 subgroup
(log-rank test, P=0.002; Fig. 2C).
By applying the same procedure to the KFSYSCC cohort, a consistent
statistical significance in the prediction of overall survival was
obtained (log-rank test, P=0.039; Fig.
2D). Since metastasis-free survival data were available for the
KFSYSCC cohort, we also applied the same cut-off value to those
data and assessed its prognostic value. When estimating
metastasis-free survival using EHMT2 expression in the
KFSYSCC cohort, however, we did not found a significant difference
between the 2 groups, but rather a tendency towards correctly
classifying high-risk BRC patients by EHMT2 expression
(Fig. 2E), indicating a limitation
of using a single gene as a diagnostic tool. Although we also
performed a survival analysis to estimate the prognostic value of
EHMT2 in patients with BRC from the TCGA cohort, no
significant differences in survival were obtained (data not shown).
This result may have been due to a limitation of the TCGA cohort,
in which the sample composition was inadequate for a prognostic
prognosis (23), although many
samples were included in the cohort.
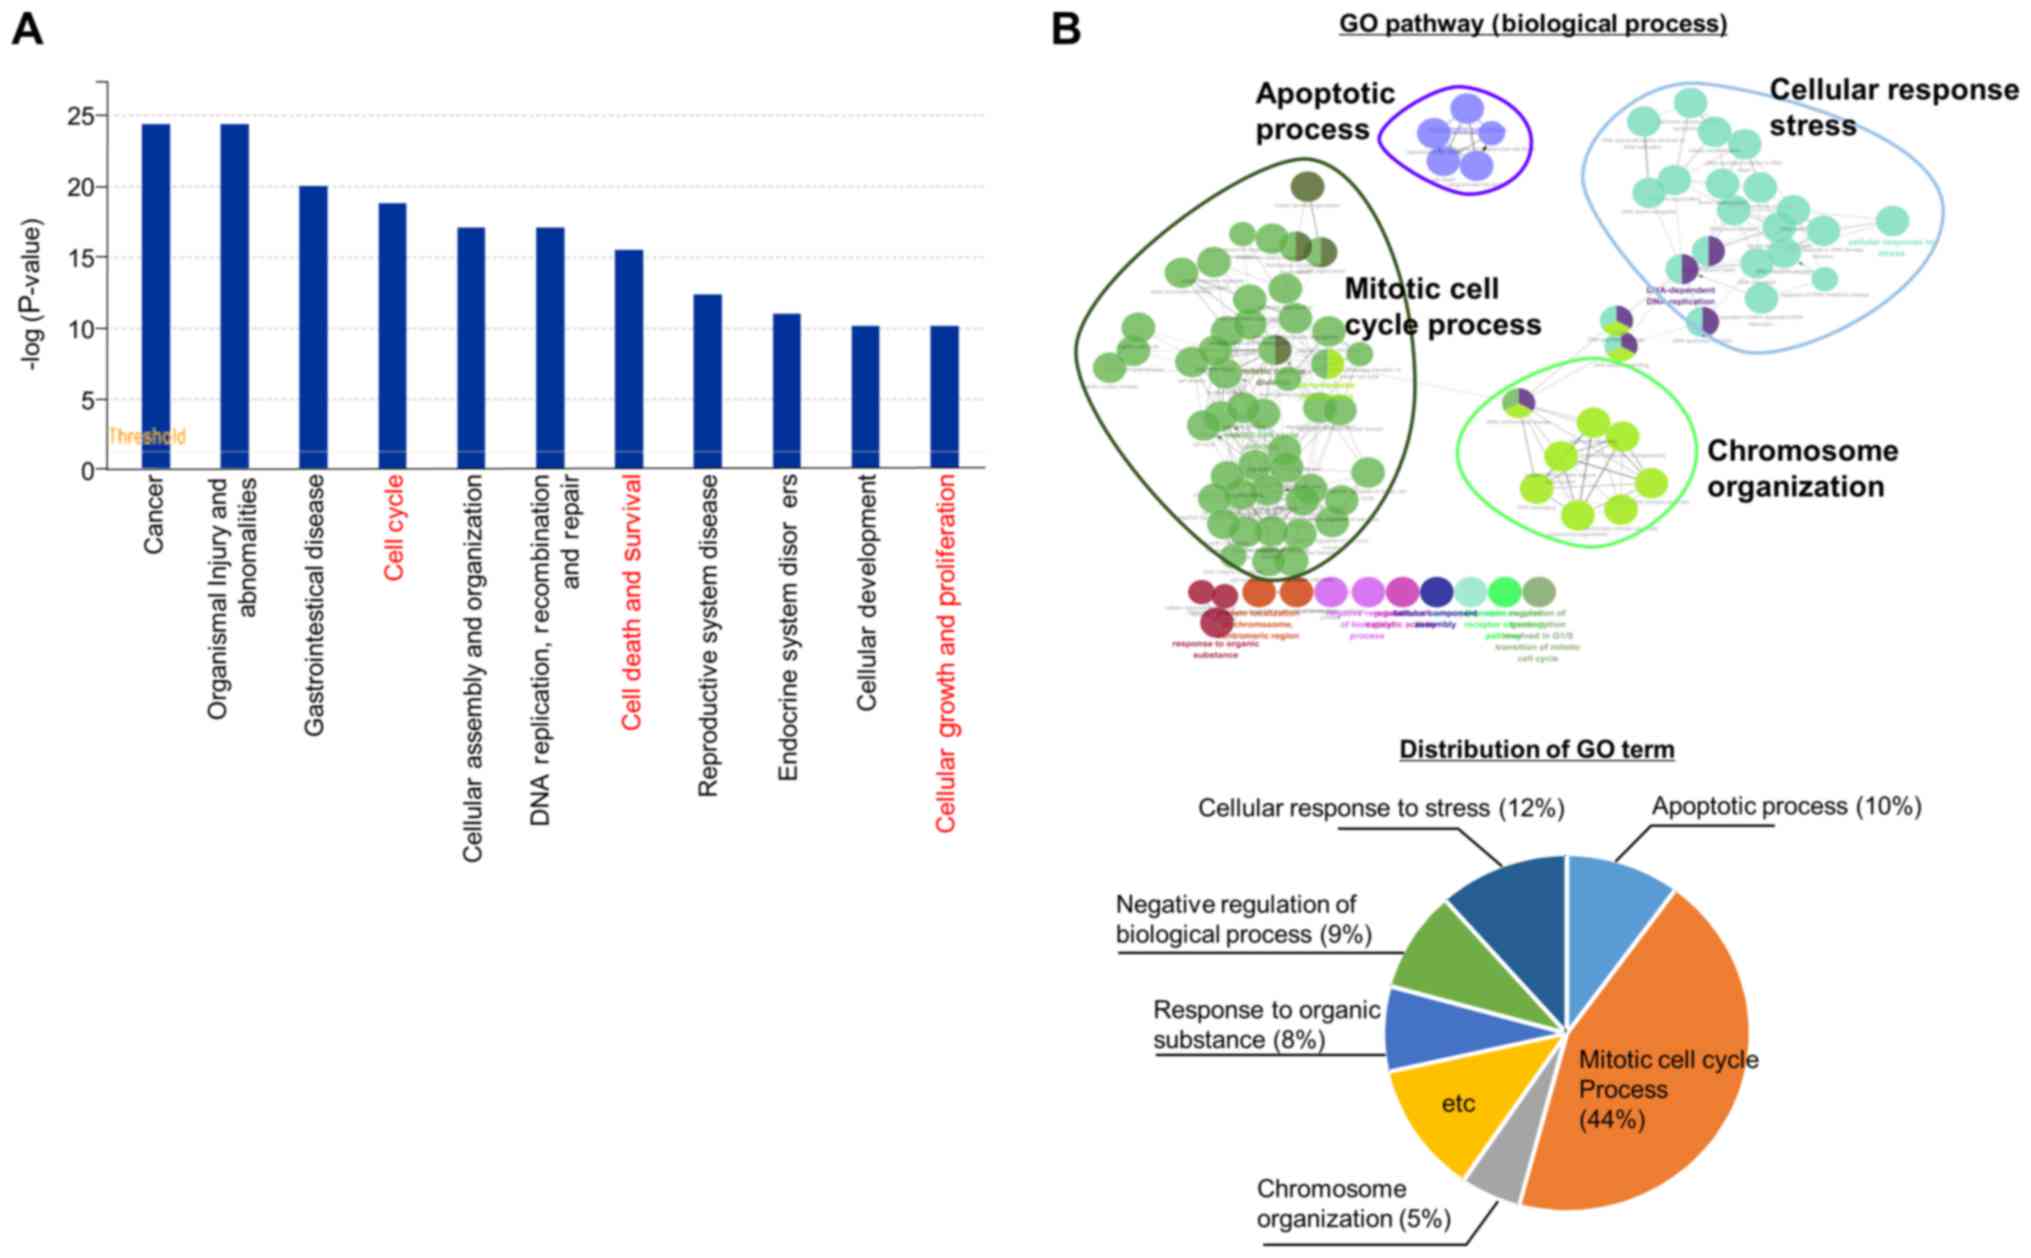
EHMT2-related genes involved in the cell
apoptotic process
We then performed RNA-seq analysis following the
knockdown of EHMT2 to investigate EHMT2-related cellular pathways,
identifying 1,765 differentially expressed genes (DEGs; 911
downregulated and 854 upregulated). Functional enrichment analysis
using IPA software revealed that the cell cycle, cell death and
survival, cellular growth and proliferation pathways were
significantly enriched (Fig. 3A).
Moreover, a network-based analysis of GO terms (biological
processes) revealed that the mitotic cell cycle process (44%),
cellular response to stress process (12%) and apoptotic process
(10%) were represented using ClueGO (plugged into Cytoscape)
(Fig. 3B). Thus, as shown in
Fig. 3, genes regulated by EHMT2
are involved in cell proliferation processes, such as cell
apoptosis, the cell cycle and cellular response to stress, implying
that EHMT2 can be a molecular target for BRC therapy.
HSPD1 expression is regulated by
EHMT2
To assess the signaling pathways involved in
EHMT2-related cancer progression, we performed western blot
analysis using a human phospho-kinase array kit (ARY003B) purchased
from R&D Systems Inc. (Minneapolis, MN, USA). We observed the
same control spot intensities between the siCont and siEHMT2
groups; however, the intensity of HSPD1 expression was
significantly decreased in the EHMT2 knockdown group compared to
that in the siCont group (Fig.
4A). In addition, the expression levels of HSPD1 were increased
in the BRC samples, as similar to EHMT2 expression (Fig. 4B). Furthermore, RNA-seq and RT-PCR
analyses revealed that HSPD1 expression was decreased following
transfection with siEHMT2 at the transcriptional level (Fig. 4C and D, upper panel). We also
confirmed the downregulation of HSPD1 expression by EHMT2 knockdown
using western blot analysis (Fig.
4D, lower panel).
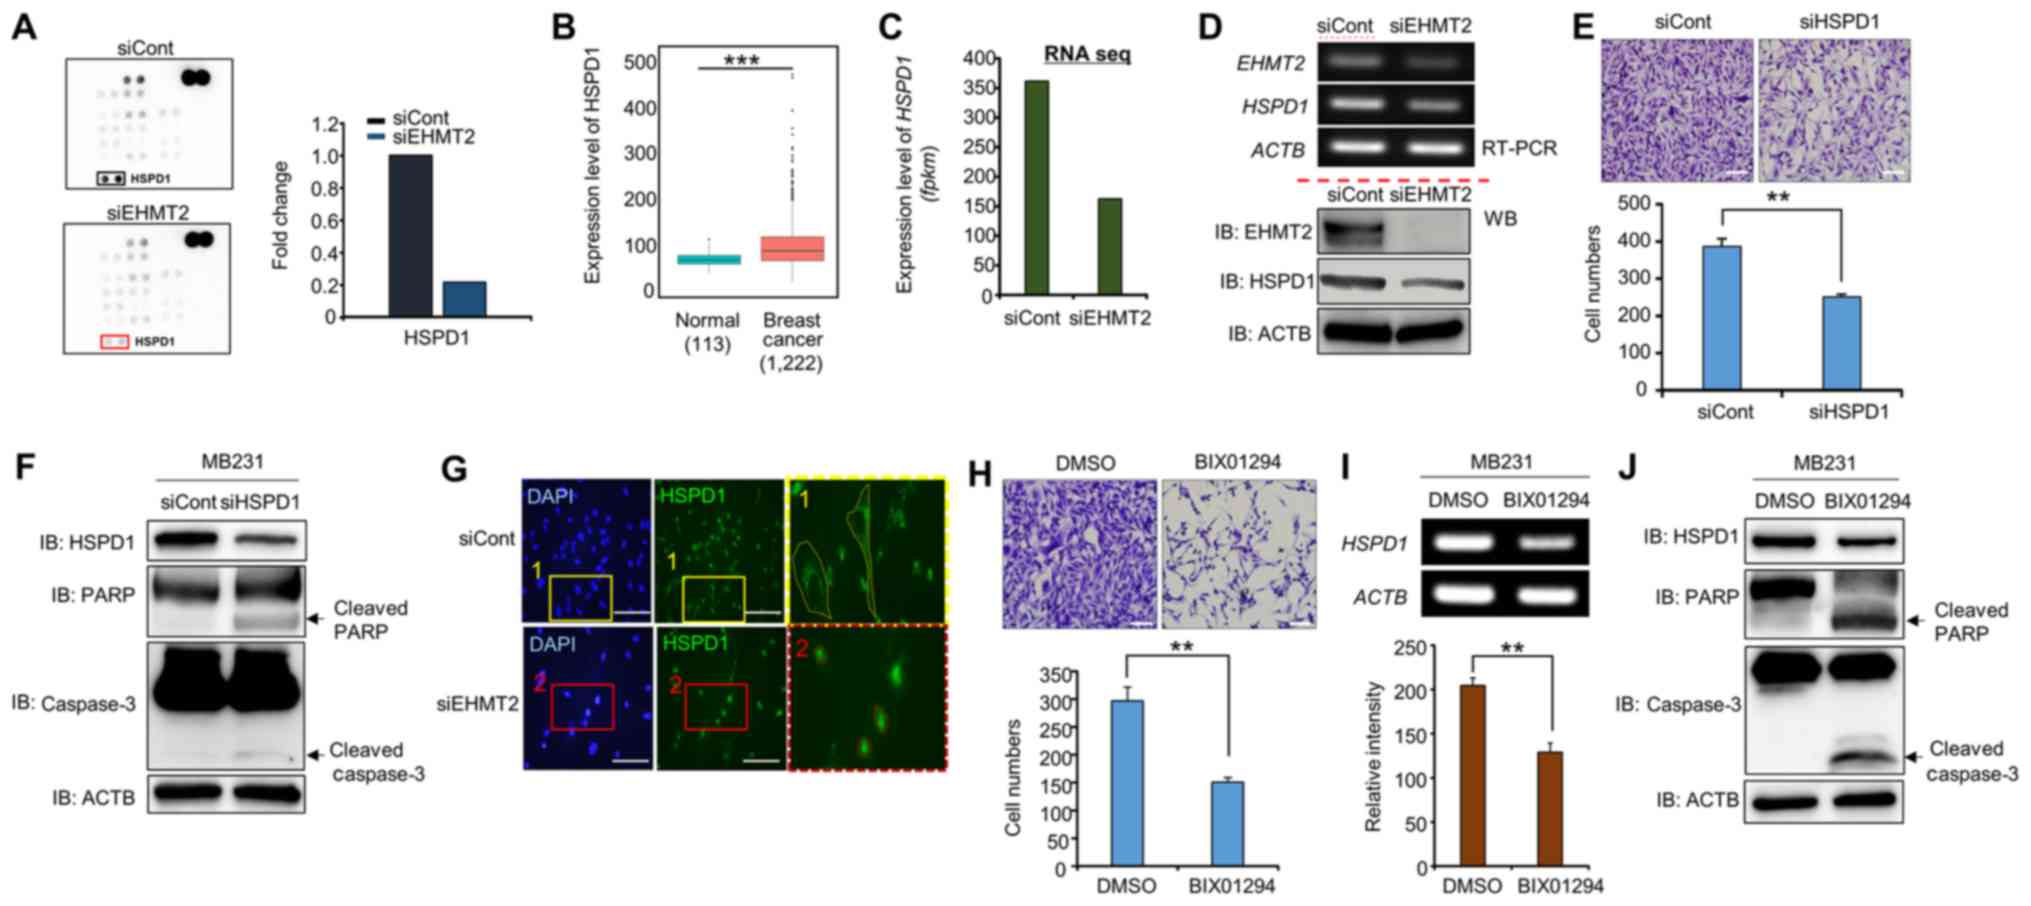 | Figure 4EHMT2 controls the expression and
subcellular localization of HSPD1. (A) Phosphor array with the
lysates of cells in which EHMT2 was knocked down. The phosphor
array (ARY003B) was purchased from R&D Biosystems.
Approximately 200 µg of cell lysate was used. (B and C)
Expression levels of HSPD1 in breast cancer samples (TCGA);
P-values were calculated using Wilcoxon’s tests
(***P<0.001) (B) and RNA-seq results (C). (D) RT-qPCR
analysis of HSPD1 after EHMT2 knockdown in MDA-MB-231 cell lines.
ACTB was used as the internal control (top panel). Western blot
analysis was performed using the indicated antibodies (bottom
panel). (E) Cell growth assay. After knocking down HSPD1 for 72 h,
the cells were fixed with 100% methanol and stained with crystal
violet. Scale bar, 200 μm (top panel); P-values were calculated
using Student’s t-tests (**P<0.01) (bottom panel).
(F) Western blot analysis after HSPD1 knockdown using anti-HSPD1,
anti-PARP, anti-caspase3 and anti-β-catenin antibodies. ACTB was
used as the internal control in MB231 cells. (G) Immunocytochemical
analysis of HSPD1. MB231 cells treated with siCont or siEHMT2 were
fixed with 100% methanol and stained with anti-HSPD1 (Alexa Fluor
488, green) and DAPI (blue). Scale bar, 200 µm. (H) Cell
growth assay. After MB231 cells were treated with BIX01294 for 24
h, the cells were fixed with 100% methanol and stained with crystal
violet. Scale bar, 200 μm (top panel); P-values were calculated
using Student’s t-tests (**P<0.01). (I) RT-qPCR
analysis of HSPD1 after treatment with BIX01294. ACTB was used as
the internal control (top panel), and the signal intensities
corresponding to HSPD1 were quantified using ImageJ software
(bottom panel). The P-values were calculated using Student’s t-test
(**P<0.01). (J) Western blot analysis after treatment
with BIX01294 using anti-HSPD1, anti-PARP, anti-caspase3 and
anti-β-catenin antibodies. ACTB was used as the internal control in
MB231 cells. |
HSPD1 is a molecular chaperone that assists with
protein folding, tracking and degradation and is associated with
the enhancement of tumor cell survival via the intrinsic apoptotic
pathway (13). Thus, to assess
whether HSPD1 knockdown induces the apoptosis of BRC cells, we
performed cell growth analysis following transfection with siHSPD1.
The cell numbers in the siHSPD1-transfected group were
significantly decreased compared with those in the siCont group
(Fig. 4E). Moreover, the levels of
cleaved PARP and caspase-3 were clearly detected in the siHSPD1
group (Fig. 4F). Thus, the
downregulation of HSPD1 expression by EHMT2 knockdown activated the
cell apoptotic pathway.
The subcellular localization of HSPD1 is associated
with protein functions, such as pro-apoptosis and anti-apoptosis,
in cancer (24). As is clearly
shown in Fig. 4G, HSPD1 was
localized to a cytoplasmic area in the siCont group, while this
cytoplasmic HSPD1 localization was markdly absent in the siEHMT2
group. Taken together, these results suggest that HSPD1
re-localization and HSPD1 expression downregulated by EHMT2
knockdown induces cell apoptosis via an HSPD1-related
anti-apoptosis pathway. In other words, EHMT2 overexpression
promotes BRC cell proliferation, as reflected by the elevated
expression of HSPD1.
BIX01294 suppresses HSPD1 expression and
the induction of cell apoptosis
BIX01294 is a specific inhibitor that downregulates
EHMT2 activity (25,26). To confirm whether BIX01294
treatment affects HSPD1 expression and cell survival in BRC cell
lines, we performed cell growth and biochemical analyses following
BIX01294 treatment. The cell numbers in the BIX01294-treated group
were significantly decreased compared to those in the siCont group,
and HSPD1 expression was also downregulated by BIX01294 treatment
similar to the siEHMT2 treatment group (Fig. 4H and I). In addition, the levels of
cleaved PARP and caspase-3 were clearly detected in the EHMT2
knockdown group (Fig. 4J). Taken
together, these results suggest that the development of
EHMT2-specific inhibitors is crucial for BRC therapy.
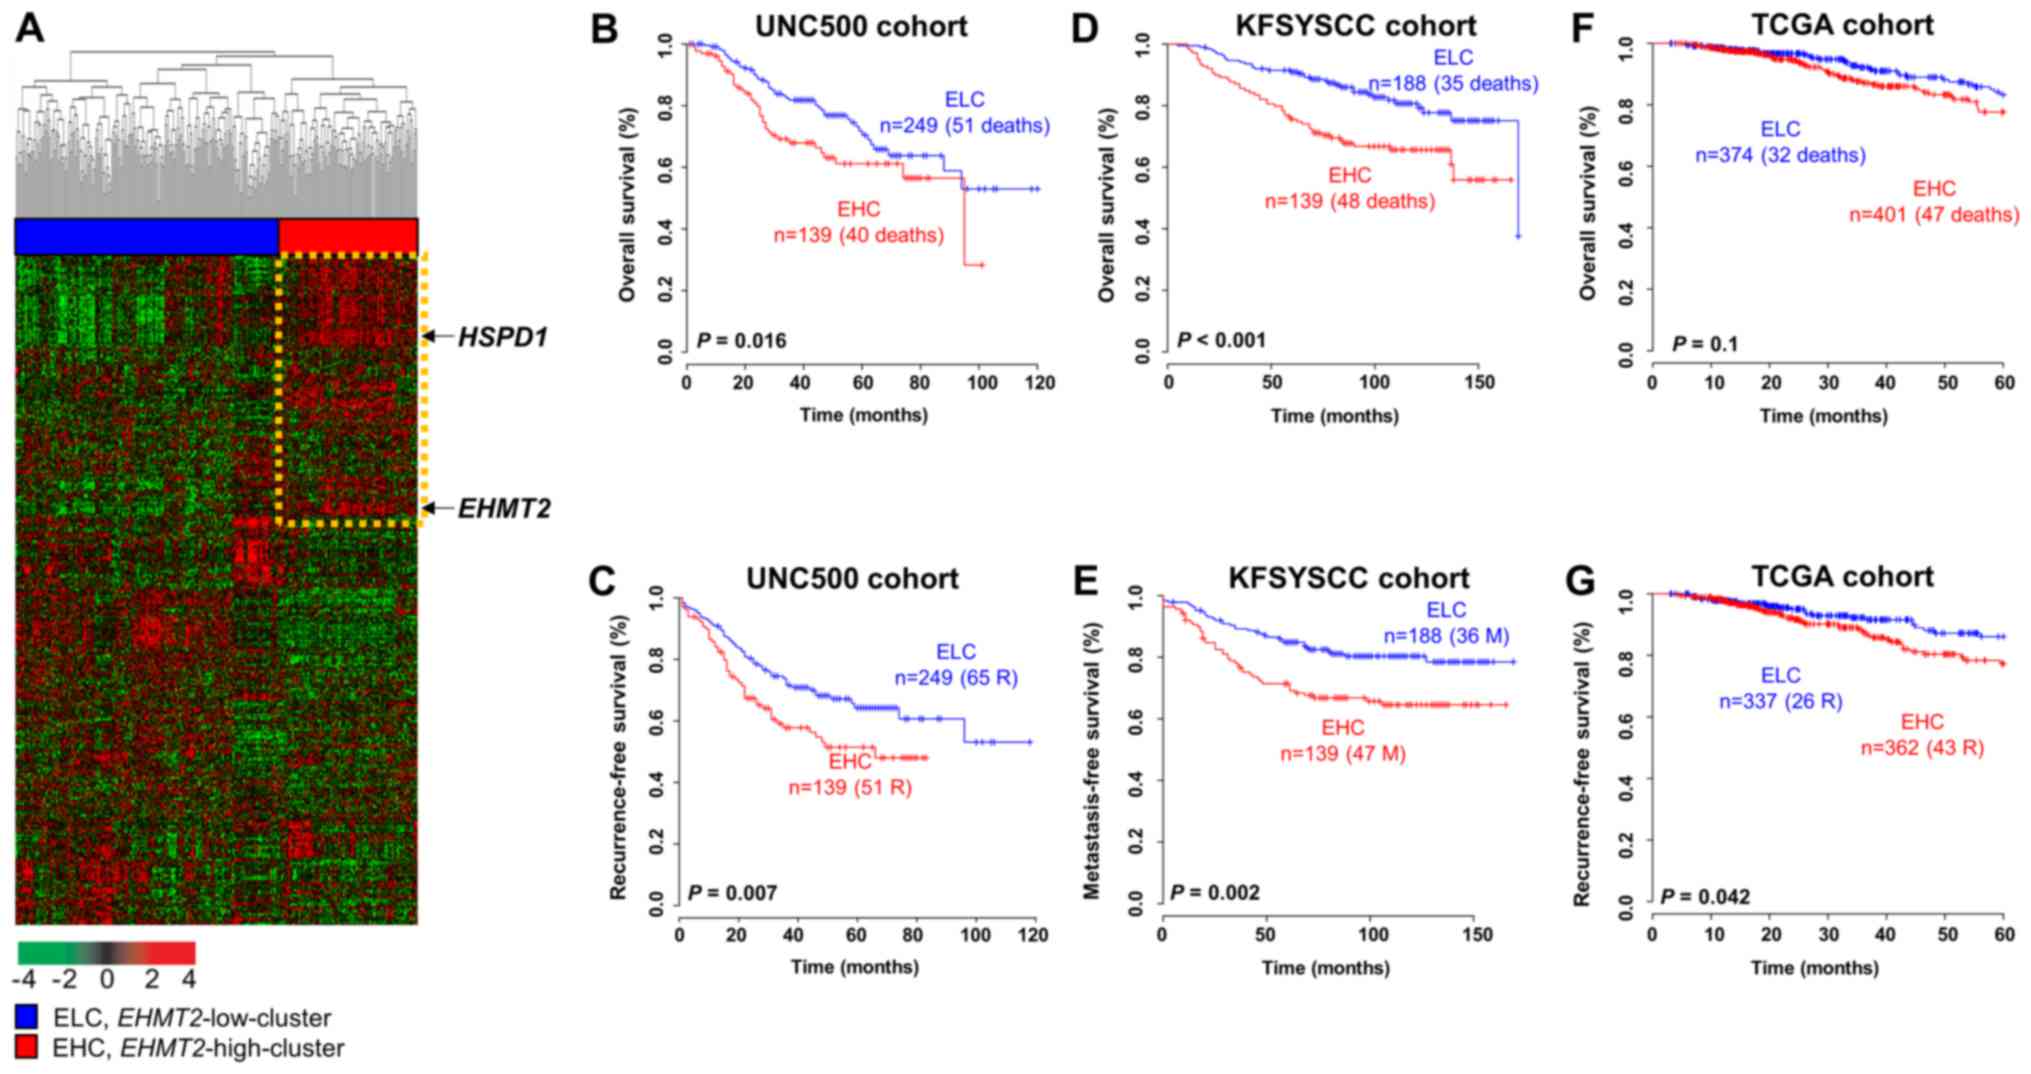
Prognostic relevance of EHMT2 regulatory
genes
To explore genes regulated by EHMT2 activity, we
selected genes that were differentially expressed between the
siCont- and siEHMT2-treated MCF7 cell lines. A total of 1,765 genes
exhibiting at least a 2-fold difference in expression were
observed. We defined a signature consisting of these genes that
interacts with EHMT2, named the EHMT2 signature, and sought to
verify its prognostic relevance in BRC. When applying the EHMT2
signature to gene expression data from the UNIC500 cohort, 1,410
common gene features were observed. Based on hierarchical
clustering analysis of the expression patterns of the signature in
the UNC500 cohort, we divided the BRC samples into 2 subgroups as
follows: an EHMT2-high cluster (EHC) subgroup and an EHMT2-low
cluster (ELC) subgroup (Fig. 5A).
The overall survival rate of the patients in the EHC group was
significantly lower than that of the patients in the ELC group
(log-rank test, P=0.016; Fig. 5B),
and the recurrence rate in the EHC subgroup was significantly
higher than that in the ELC subgroup (log-rank test, P=0.007;
Fig. 5C). To validate the
observations in the UNC500 cohort, we analyzed gene expression data
from the KFSYSCC cohort. Using the same procedure employed with the
UNC500 cohort, the patients in the KFSYSCC cohort were divided into
2 subgroups (EHC and ELC) by hierarchical clustering analysis using
the 1,604 genes that overlapped the EHMT2 signature (data not
shown). The overall and metastasis-free survival rates of each
group were estimated. Kaplan-Meier analysis revealed that the EHMT2
signature was a significant predictor of overall and
metastasis-free survival of patients with BRC in the KFSYSCC cohort
(log-rank tests, P<0.001 and P=0.002 for overall and
metastasis-free survival, respectively; Fig. 5D and E). When applying the same
clustering algorithms and Kaplan-Meier analysis to the TCGA cohort
with the 1,644 overlapping genes, a clear tendency towards
classifying high-risk patients with BRC for overall survival was
observed, although statistical significance was not achieved
(log-rank test, P=0.1; Fig. 5F).
However, the recurrence rate of the EHC subgroup classified by the
EHMT2 signature was significantly higher than that of the ELC
subgroup in the TCGA cohort (log-rank test, P=0.042; Fig. 5G).
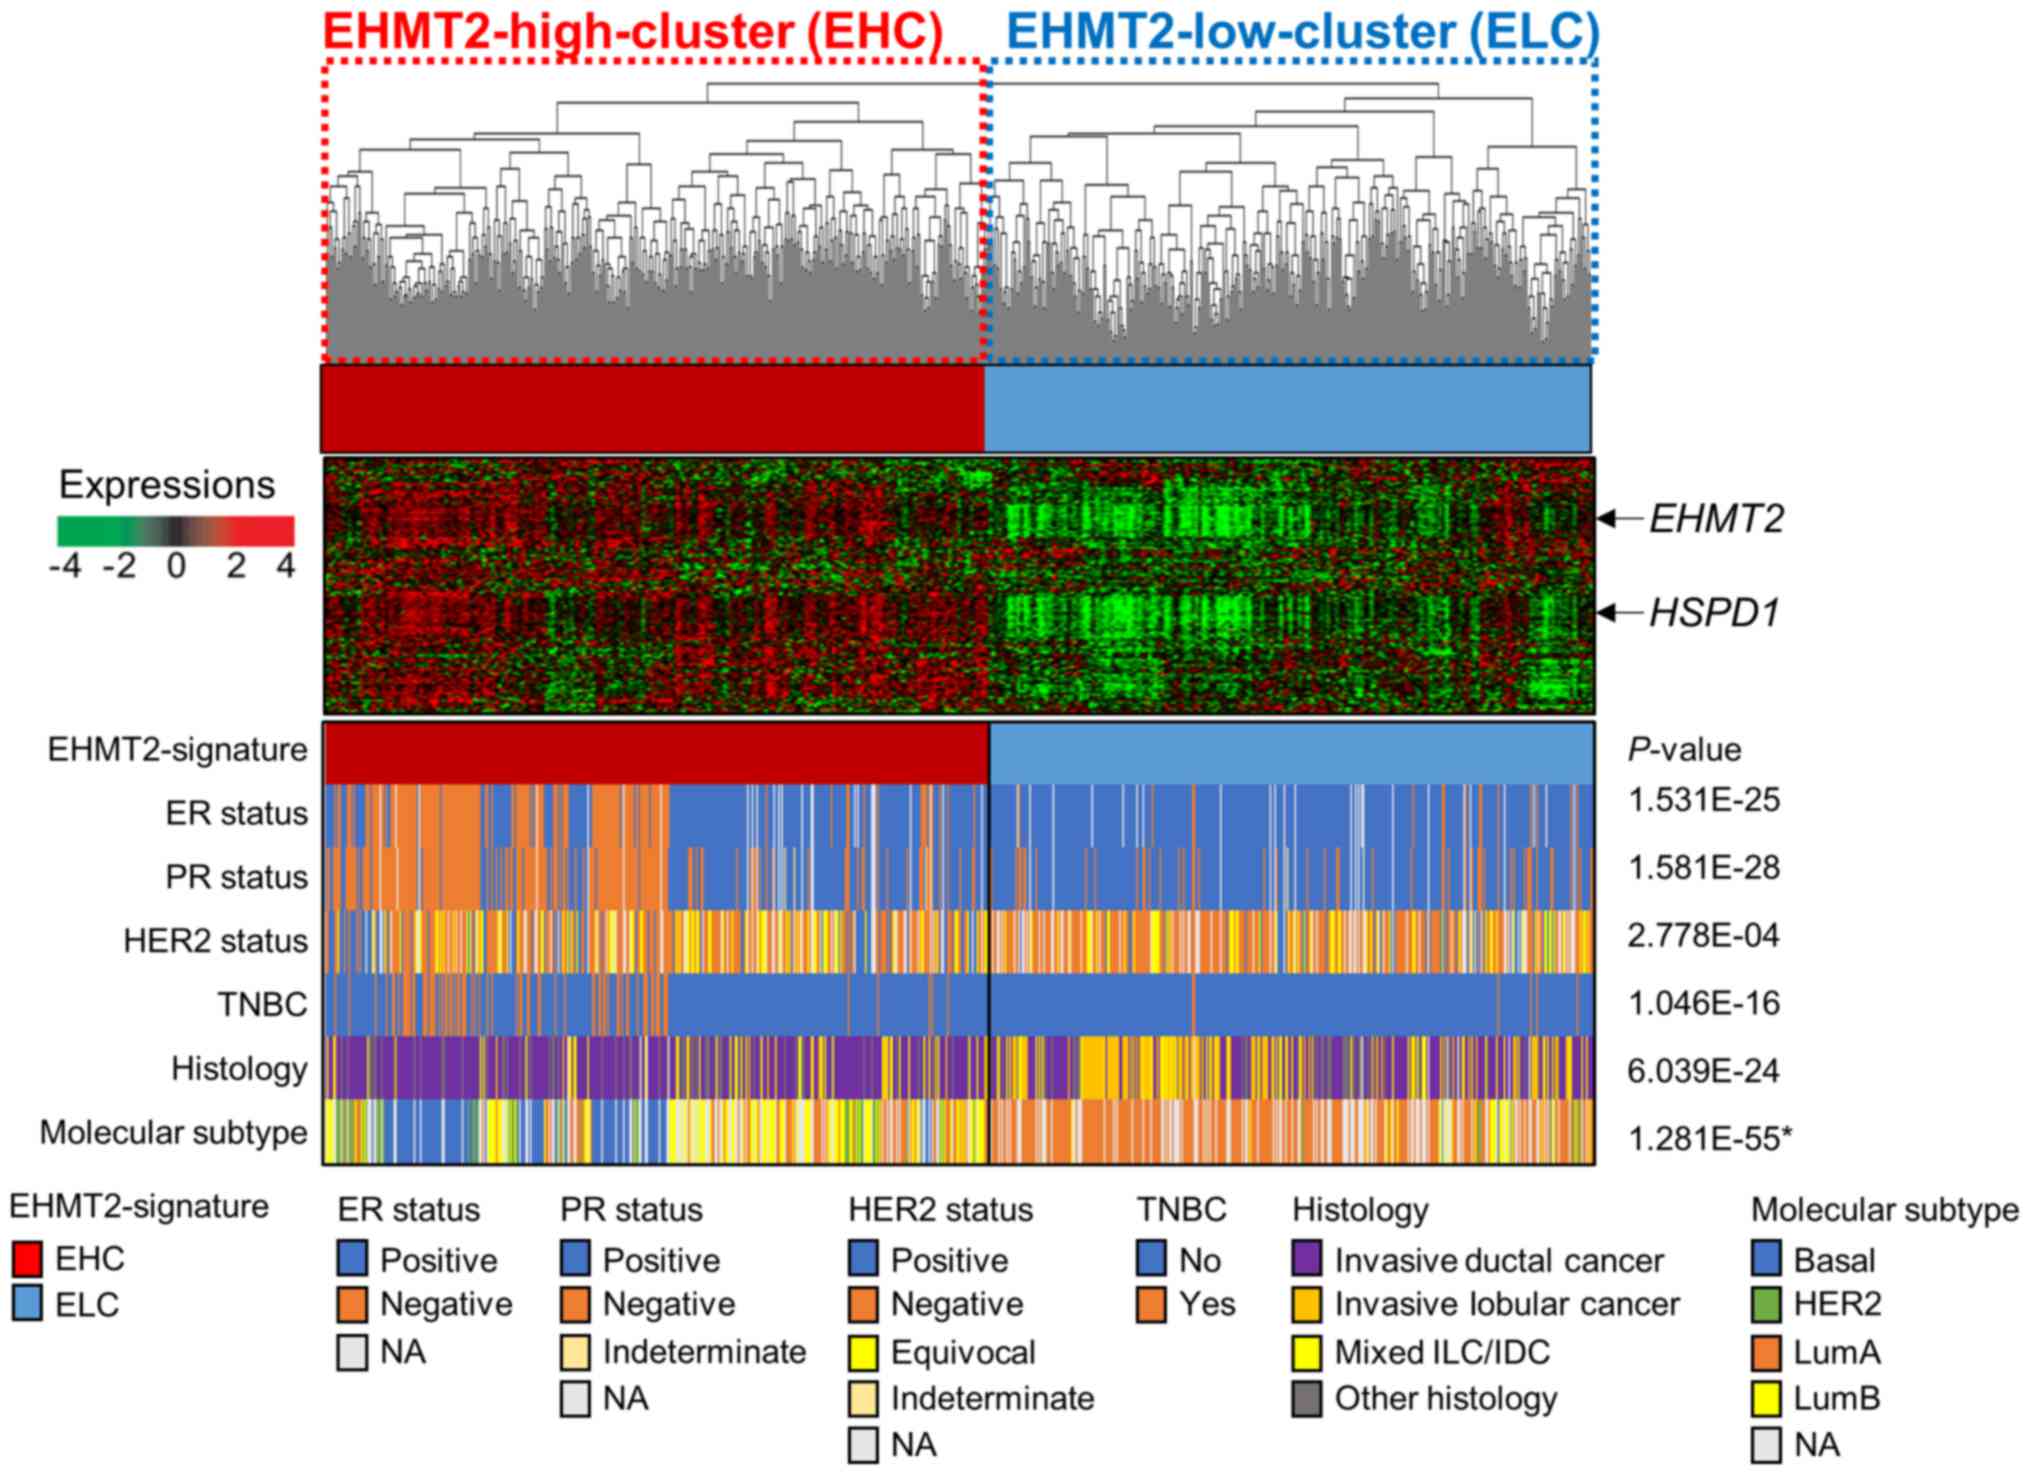
As the EHMT2 signature exhibited limited
prognostic value in the TCGA cohort, we explored associations
between the signature and known molecular and histological subtypes
of BRC. We stratified the BRC samples from the TCGA cohort into the
EHC and ELC subgroups by the EHMT2 signature and examined
EHMT2 signature-associated molecular and histological
subtypes (Fig. 6). When comparing
the ER, PR and HER2 status between the EHC and ELC subgroups, the
number of patients with BRC with a negative status of each marker
was significantly higher in the EHC subgroup than in the ELC
subgroup (Fisher’s exact tests, both P<0.001, Fig. 6). Regarding the patients with
triple negative BRC (TNBC), their frequency in the EHC subgroup was
much higher than that in the ELC subgroup (Fisher’s exact test,
P<0.001, Fig. 6), consistent
with the poor prognosis of patients in the EHC subgroup (Fig. 6). The exploration of histological
subtypes across EHMT2 signature-based subgroups revealed
that many patients with invasive lobular cancer were present in the
ELC subgroup, whereas most of the patients in the EHC subgroup had
invasive ductal cancer (Fisher’s exact test, P<0.001, Fig. 6). The comparisons of known
molecular subtypes of BRC with the EHMT2 signature revealed
that many BRC samples of the LumA subtype (77.3%, 235 out of 304)
were classified into the ELC subgroup, whereas the vast majority of
BRC samples of the Basal subtype were stratified into the EHC
subgroup (99%, 106 out of 107). The difference in molecular
subtypes between the EHC and ELC subgroups was statistically
significant (χ2 test, P<0.001, Fig. 6). Taken together, these results
suggest that the EHMT2 signature well reflects distinct
molecular and histological subtypes of BRC and has predictive
ability for classifying high-risk BRC patients, such as patients
with TNBC.
To determine the prognostic independence of the
newly identified EHMT2 signature, we combined clinical data from 2
cohorts (UNC500 and KFSYSCC cohorts) in which the EHMT2
signature displayed distinct predictive value regarding overall
survival. We then applied Cox regression analyses to our signature
and known clinicopathological risk factors. In the univariate
analysis, significant prognostic indicators of BRC overall survival
contained the node, ER and HER2 status along with the EHMT2
signature (Table II). When the
multivariate test was performed on the combined cohort, the
EHMT2 signature retained its statistical significance for
overall BRC patient survival even after a variable selection
procedure was applied (HR =1.423, 95% CI: 1.018-1.988, P=0.039;
Table II), demonstrating the
prognostic relevance of the EHMT2 signature as an
independent risk factor for BRC.
| Table IIUnivariate and multivariate Cox
regression analysis of overall survival in breast cancer (combined
with the UNC500 and KFSYSCC cohorts). |
Table II
Univariate and multivariate Cox
regression analysis of overall survival in breast cancer (combined
with the UNC500 and KFSYSCC cohorts).
| Variable | Univariate
| Multivariate
|
|---|
| n | HR (95% CI) | P-value | n | HR (95% CI) | P-value |
|---|
| Age (>35 years
or not) | 706 | 1.149
(0.624-2.117) | 0.655 | 706 | | |
| Node status
(positive or negative) | 706 | 1.766
(1.276-2.443) | <0.001 | | 1.795
(1.296-2.487) | <0.001 |
| ER status (positive
or negative) | 706 | 0.493
(0.364-0.668) | <0.001 | | 0.59
(0.421-0.826) | 0.002 |
| HER2 status
(positive or negative) | 706 | 1.471
(1.054-2.052) | 0.023 | | | |
| EHMT2 signature
(LEC vs. HECa) | 706 | 1.726
(1.281-2.326) | <0.001 | | 1.423
(1.018-1.988) | 0.039 |
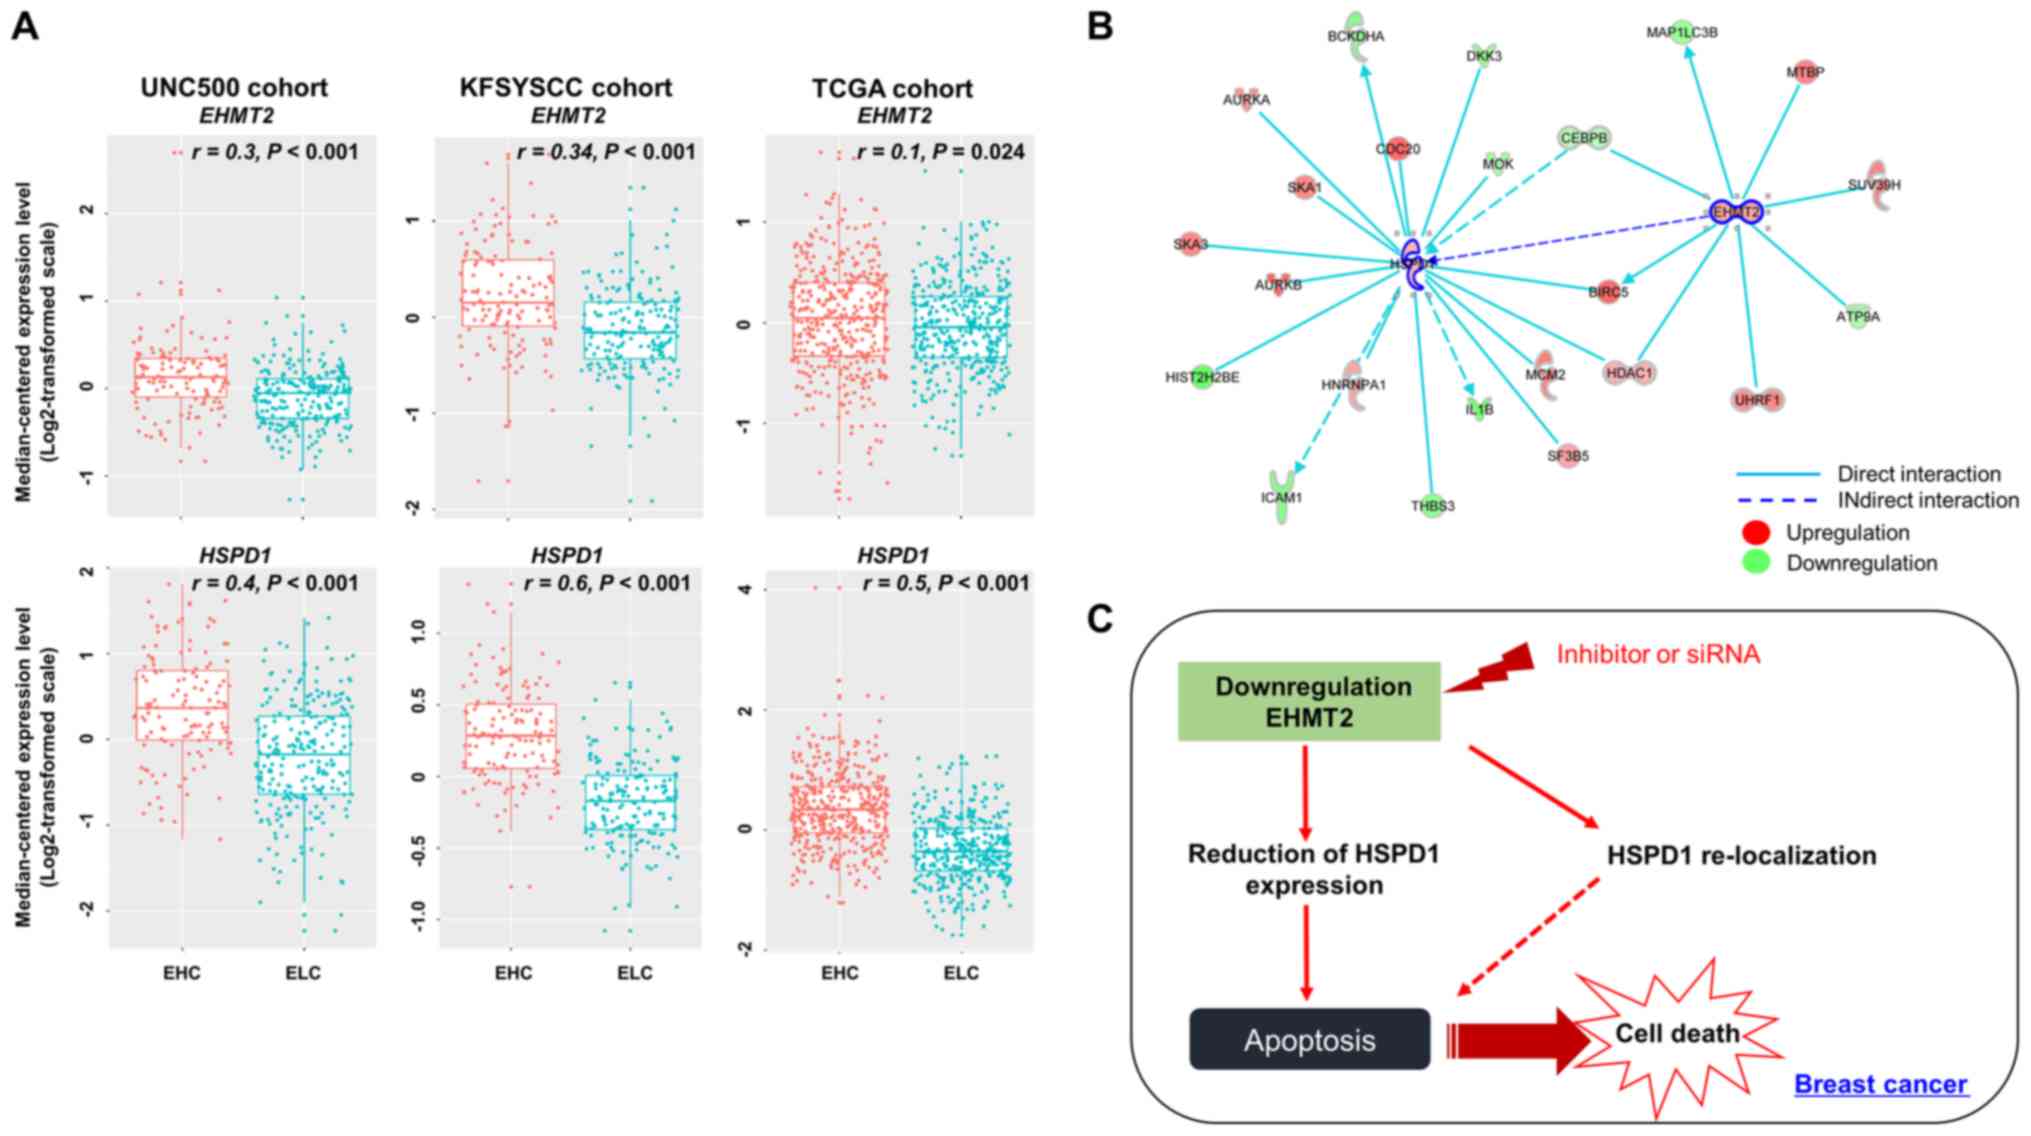
Activated regulators in the prognostic
EHMT2 regulatory gene network
To confirm the alteration in HSPD1 expression
by EHMT2 activity, we compared their expression levels in
the clinical sample subgroups (EHC and ELC). The EHMT2 and
HSPD1 expression levels in the EHC subgroup were
significantly higher than those in the ELC subgroup of the UNC500
cohort. The expression levels of the two genes strongly correlated
with the EHC and ELC subpatient groups (Fig. 7A). When comparing the expression
levels of EHMT2 and HSPD1 in the KFSYSCC cohort, we
also observed significant differences between the EHC and ELC
subgroups and significant positive correlations with these
subgroups. Finally, in the TCGA cohort, a moderate correlation was
observed between EHMT2 expression and the patient subgroups
divided by the EHMT2 signature (r=0.1). However, the
correlation still retained statistical significance (P<0.001 by
polyserial correlation test), and significant differences in
expression between the EHC and ELC subgroups were observed
(P<0.001 by a two-sample t-test; Fig. 7A). HSPD1 expression in the
EHC subgroup was significantly higher than that in the ELC
subgroup, and HSPD1 expression levels profoundly correlated
with the EHC and ELC subpatient groups in the TCGA cohort (Fig. 7A). Finally, gene-to-gene network
analysis revealed that EHMT2 formed a gene network hub in
which HSPD1 was indirectly regulated by EHMT2
(Fig. 7B).
Discussion
EHMT2 is a histone methyltransferase that
specifically methylates histone H3 lysine 9 (H3K9), which is a
suppressor of gene expression at the transcriptional level.
Therefore, eliminating EHMT2 expression reduces the status of H3K9
methylation, and the heterochromatin structure is subsequently
altered to the open chromatin formation for gene induction
(6). In this study, the results of
RNA-seq analysis after EHMT2 knockdown revealed that upregulated
genes were implicated as being putative direct targets of EHMT2.
However, we observed that EHMT2 knockdown and treatment with a
specific inhibitor (BIX01294) induced the downregulation of HSPD1
in BRC cells (Fig. 4D and I). In
addition, a cohort analysis revealed statistically positive
correlations between EHMT2 and HSPD1 expression (Fig. 7A). Thus, we demonstrated that HSPD1
expression was indirectly regulated by EHMT2, and an unknown target
regulated by EHMT2 modulates the downregulation of HSPD1. To
identify HSPD1 regulation as a direct target of EHMT2, we performed
gene network analysis using IPA software with RNA-seq data
resulting from EHMT2 knockdown, revealing upstream regulators of
HSPD1 (Fig. 7B). However, a
ChIP-assay or ChIP-seq analysis is necessary to identify the direct
upstream regulators of HSPD1 regulated by EHMT2.
HSPD1 expression is critically involved in several
types of cancer; for example, its expression is up-regulated in
colorectal, cervical, Hodgkin lymphoma, and prostate cancer
(13). In addition, low HSPD1
expression has been identified as a risk factor in recurrent
bladder cancer (7). Although the
expression level of HSPD1 in cancer is an important factor in cell
survival and apoptosis, the localization of HSPD1 between the
cytoplasm and mitochondria is also associated with both
pro-apoptotic and pro-survival functions in cancer (14,24,25).
In this stuyd, we observed the cytoplasmic localization of HSPD1 in
the siCont group; however, in the siEHMT2 group, HSPD1 localization
in the cytoplasmic region was clearly absent and was instead
concentrated in the endoplasmic reticulum (ER) region (Fig. 4G). Arya et al demonstrated
that ER-specific HSPD1 localization correlated with cell apoptosis
via the reduction of XIAP expression (24). In this study, we demonstrated that
EHMT2 overexpression mediated the localization of HSPD1 as well as
its expression, which affected the proliferation of BRC. Regarding
re-localization, Cho et al reported that methylation of
HSP70 by SETD1A changes its location from the cytoplasm to the
nucleus (27). Thus, it is
suggested that the direct methylation of HSPD1 by EHMT2 may affect
its localization. However, additional experiments need to be
conducted to confirm the HSPD1 methylation by EHMT2.
Based on the expression of EHMT2, in this
study, we investigated its association with BRC patient survival.
When dichotomizing the patients with BRC into two risk-predictive
subgroups based on EHMT2 expression, many high-risk patients
were correctly classified into the high-EHMT2 subgroup
(Fig. 2B-E), indicating that
EHMT2 has predictive value as a prognostic marker. Although
limitations of EHMT2 as a single gene biomarker were
observed in a few patient cohorts, an EHMT2 signature
consisting of EHMT2 and its associated genes revealed
significantly better predictive ability for heterogeneous clinical
behaviors in patients with BRC (Fig.
5). In addition, when exploring patient subgroups divided by
the EHMT2 signature and clinicopathological factors, the
high-risk subgroup classified by the EHMT2 signature (i.e.,
high-EHMT2 cluster) had strong associations with invasive
ductal carcinoma, basal, or TNBC subtypes, which are typical
characteristics of patients BRC with poor prognoses (Fig. 6). Thus, it is suggested that
EHMT2 has a distinct predictive value for the prognosis of
BRC and that the EHMT2 signature is compatible with the clinical
and molecular features of BRC.
Although many patient cohorts comprising >1,000
BRC samples were analyzed in this study and although a prognostic
value of EHMT2 and its associated genes was confirmed, there
are several limitations to our study. First, recurrence-free
survival is an important prognostic factor in BRC, and the KFSYSCC
cohort contained data on this statistic; however, we could not
estimate an association between the EHMT2 signature and the
recurrence-free survival of BRC as too few recurrence events
occurred in this cohort. Second, the available clinical and
pathological variables varied among the cohorts, which lowered the
confidence of the multivariate analysis involving the EHMT2
signature. Third, although the EHMT2 signature showed
significant prognostic relevance, an excessive number of genes
(1,765 genes) were involved in the signature, making the direct
application of this signature to the generation of a diagnostic
panel for BRC patient classification impractical. The construction
of a diagnostic panel consisting of a small number of genes from
the EHMT2 signature and its validation in larger independent
clinical cohorts are critically required in future
investigations.
In conclusion, in this study, we found that EHMT2
expression was upregulated in BRC tissues and cell lines, which
indirectly controlled HSPD1 expression and its localization, thus
inhibiting cell apoptosis (Fig.
7C). Moreover, in our cohort study, we identified EHMT2 as a
novel prognostic marker, implicating its potential as a therapeutic
and prognostic marker for BRC treatment. In future studies, we aim
to perform ChiP-seq analysis to identify the direct target genes of
EHMT2. We will then attempt to clarify the ‘mode of action’ in
HSPD1 regulation in BRC. In addition, we will develop a screening
system for the identification of an EHMT2 inhibitor and will
perform a pre-clinical study.
Abbreviations:
|
BRC
|
breast cancer
|
|
H3K9
|
histone H3 lysine 9
|
|
TCGA
|
The Cancer Genome Atlas
|
|
FBS
|
fetal bovine serum
|
|
DAPI
|
4′,6′-diamidino-2-phenylindole
dihydrochloride
|
|
IPA
|
Ingenuity Pathway Analysis
|
|
siCont
|
siRNA Control
|
|
DEGs
|
differentially expressed genes
|
|
GO term
|
Gene Ontology term
|
|
ER
|
estrogen receptor
|
|
PR
|
progesterone receptor
|
|
EHC
|
EHMT2-high cluster
|
|
ELC
|
EHMT2-low cluster
|
|
TNBC
|
triple-negative breast cancer
|
|
LumA
|
luminal A
|
Acknowledgments
Not applicable.
Funding
This study was supported by a grant from the
National Research Foundation of Korea (NRF) grant funded by the
Ministry of Science, ICT and Future Planning (NRF-2017R1A2B4003757
and NRF-2018M3A9H3023077), the Technology Innovation Program (No.
10063334) funded by the Ministry of Trade, Industry and Energy (MI,
Korea), and the KRIBB Research Initiative Program.
Availability of data and materials
All data that are not included in this study are
available from the corresponding author on reasonable request.
Authors’ contributions
DSK, MYS, HSC, CRJ, RH and SKK were involved in the
conception and design of the study. KK and TYR were involved in the
development of the methodology. JWR, JHO, MYS, JHL, JKM and SKK
were involved in the analysis and interpretation of the data (e.g.,
statistical analysis, biostatistics, computational analysis). KK,
TYR, JHL, CRJ, RH, SKK, DSK, MYS and HSC were involved in the
writing, reviewing and/or revision of the manuscript. CRJ was
responsible for administrative, technical or material support. DSK,
MYS, RH and HSC supervised the study. All authors have read and
approved the final manuscript.
Ethics approval and consent to
participate
Not applicable.
Patient consent for publication
Not applicable.
Competing interests
The authors declare no conflict of interest.
References
|
1
|
Perou CM, Sørlie T, Eisen MB, van de Rijn
M, Jeffrey SS, Rees CA, Pollack JR, Ross DT, Johnsen H, Akslen LA,
et al: Molecular portraits of human breast tumours. Nature.
406:747–752. 2000. View
Article : Google Scholar : PubMed/NCBI
|
|
2
|
Sørlie T, Perou CM, Tibshirani R, Aas T,
Geisler S, Johnsen H, Hastie T, Eisen MB, van de Rijn M, Jeffrey
SS, et al: Gene expression patterns of breast carcinomas
distinguish tumor subclasses with clinical implications. Proc Natl
Acad Sci USA. 98:10869–10874. 2001. View Article : Google Scholar : PubMed/NCBI
|
|
3
|
Pasculli B, Barbano R and Parrella P:
Epigenetics of breast cancer: Biology and clinical implication in
the era of precision medicine. Semin Cancer Biol. 51:22–35. 2018.
View Article : Google Scholar : PubMed/NCBI
|
|
4
|
Jovanovic J, Rønneberg JA, Tost J and
Kristensen V: The epigenetics of breast cancer. Mol Oncol.
4:242–254. 2010. View Article : Google Scholar : PubMed/NCBI
|
|
5
|
Messier TL, Gordon JA, Boyd JR, Tye CE,
Browne G, Stein JL, Lian JB and Stein GS: Histone H3 lysine 4
acetylation and methylation dynamics define breast cancer subtypes.
Oncotarget. 7:5094–5109. 2016. View Article : Google Scholar : PubMed/NCBI
|
|
6
|
Tachibana M, Sugimoto K, Fukushima T and
Shinkai Y: Set domain-containing protein, G9a, is a novel
lysine-preferring mammalian histone methyltransferase with
hyperactivity and specific selectivity to lysines 9 and 27 of
histone H3. J Biol Chem. 276:25309–25317. 2001. View Article : Google Scholar : PubMed/NCBI
|
|
7
|
Kim K, Son MY, Jung CR, Kim DS and Cho HS:
EHMT2 is a metastasis regulator in breast cancer. Biochem Biophys
Res Commun. 496:758–762. 2018. View Article : Google Scholar : PubMed/NCBI
|
|
8
|
Wang YF, Zhang J, Su Y, Shen YY, Jiang DX,
Hou YY, Geng MY, Ding J and Chen Y: G9a regulates breast cancer
growth by modulating iron homeostasis through the repression of
ferroxidase hephaestin. Nat Commun. 8:2742017. View Article : Google Scholar : PubMed/NCBI
|
|
9
|
Park SE, Yi HJ, Suh N, Park YY, Koh JY,
Jeong SY, Cho DH, Kim CS and Hwang JJ: Inhibition of EHMT2/G9a
epigenetically increases the transcription of Beclin-1 via an
increase in ROS and activation of NF-κB. Oncotarget. 7:39796–39808.
2016.PubMed/NCBI
|
|
10
|
Lee JY, Lee SH, Heo SH, Kim KS, Kim C, Kim
DK, Ko JJ and Park KS: Novel Function of Lysine Methyltransferase
G9a in the Regulation of Sox2 Protein Stability. PLoS One.
10:e01411182015. View Article : Google Scholar : PubMed/NCBI
|
|
11
|
Miura S, Maesawa C, Shibazaki M, Yasuhira
S, Kasai S, Tsunoda K, Maeda F, Takahashi K, Akasaka T and Masuda
T: Immunohistochemistry for histone h3 lysine 9 methyltransferase
and demethylase proteins in human melanomas. Am J Dermatopathol.
36:211–216. 2014. View Article : Google Scholar : PubMed/NCBI
|
|
12
|
Zhong X, Chen X, Guan X, Zhang H, Ma Y,
Zhang S, Wang E, Zhang L and Han Y: Overexpression of G9a and MCM7
in oesophageal squamous cell carcinoma is associated with poor
prognosis. Histopathology. 66:192–200. 2015. View Article : Google Scholar
|
|
13
|
Chandra D, Choy G and Tang DG: Cytosolic
accumulation of HSP60 during apoptosis with or without apparent
mitochondrial release: Evidence that its pro-apoptotic or
pro-survival functions involve differential interactions with
caspase-3. J Biol Chem. 282:31289–31301. 2007. View Article : Google Scholar : PubMed/NCBI
|
|
14
|
Ghosh JC, Dohi T, Kang BH and Altieri DC:
Hsp60 regulation of tumor cell apoptosis. J Biol Chem.
283:5188–5194. 2008. View Article : Google Scholar
|
|
15
|
Kaigorodova EV and Bogatyuk MV: Heat shock
proteins as prognostic markers of cancer. Curr Cancer Drug Targets.
14:713–726. 2014. View Article : Google Scholar : PubMed/NCBI
|
|
16
|
Lee JH, Cho HS, Lee JJ, Jun SY, Ahn JH,
Min JS, Yoon JY, Choi MH, Jeon SJ, Lim JH, et al: Plasma glutamate
carboxypeptidase is a negative regulator in liver cancer
metastasis. Oncotarget. 7:79774–79786. 2016. View Article : Google Scholar : PubMed/NCBI
|
|
17
|
Ciriello G, Gatza ML, Beck AH, Wilkerson
MD, Rhie SK, Pastore A, Zhang H, McLellan M, Yau C, Kandoth C, et
al TCGA Research Network: Comprehensive Molecular Portraits of
Invasive Lobular Breast Cancer. Cell. 163:506–519. 2015. View Article : Google Scholar : PubMed/NCBI
|
|
18
|
Jung KB, Lee H, Son YS, Lee JH, Cho HS,
Lee MO, Oh JH, Lee J, Kim S, Jung CR, et al: In vitro and in vivo
imaging and tracking of intestinal organoids from human induced
pluripotent stem cells. FASEB J. 32:111–122. 2018. View Article : Google Scholar
|
|
19
|
Jung KB, Lee H, Son YS, Lee MO, Kim YD, Oh
SJ, Kwon O, Cho S, Cho HS, Kim DS, et al: Interleukin-2 induces the
in vitro maturation of human pluripotent stem cell-derived
intestinal organoids. Nat Commun. 9:30392018. View Article : Google Scholar : PubMed/NCBI
|
|
20
|
Kim DS, Ryu JW, Son MY, Oh JH, Chung KS,
Lee S, Lee JJ, Ahn JH, Min JS, Ahn J, et al: A liver-specific gene
expression panel predicts the differentiation status of in vitro
hepatocyte models. Hepatology. 66:1662–1674. 2017. View Article : Google Scholar : PubMed/NCBI
|
|
21
|
Son MY, Jung CR, Kim DS and Cho HS:
Comparative in silico profiling of epigenetic modifiers in human
tissues. Mol Biol Rep. 45:309–314. 2018. View Article : Google Scholar : PubMed/NCBI
|
|
22
|
Ryu JW, Kim SK, Son MY, Jeon SJ, Oh JH,
Lim JH, Cho S, Jung CR, Hamamoto R, Kim DS, et al: Novel prognostic
marker PRMT1 regulates cell growth via downregulation of CDKN1A in
HCC. Oncotarget. 8:115444–115455. 2017. View Article : Google Scholar
|
|
23
|
Liu J, Lichtenberg T, Hoadley KA, Poisson
LM, Lazar AJ, Cherniack AD, Kovatich AJ, Benz CC, Levine DA, Lee
AV, et al Cancer Genome Atlas Research Network: An Integrated TCGA
Pan-Cancer Clinical Data Resource to Drive High-Quality Survival
Outcome Analytics. Cell. 173:400–416.e11. 2018. View Article : Google Scholar : PubMed/NCBI
|
|
24
|
Arya RK, Singh A, Yadav NK, Cheruvu SH,
Hossain Z, Meena S, Maheshwari S, Singh AK, Shahab U, Sharma C, et
al: Anti-breast tumor activity of Eclipta extract in-vitro and
in-vivo: Novel evidence of endoplasmic reticulum specific
localization of Hsp60 during apoptosis. Sci Rep. 5:184572015.
View Article : Google Scholar : PubMed/NCBI
|
|
25
|
Chang Y, Zhang X, Horton JR, Upadhyay AK,
Spannhoff A, Liu J, Snyder JP, Bedford MT and Cheng X: Structural
basis for G9a-like protein lysine methyltransferase inhibition by
BIX-01294. Nat Struct Mol Biol. 16:312–317. 2009. View Article : Google Scholar : PubMed/NCBI
|
|
26
|
Lebret T, Watson RW, Molinié V, O’Neill A,
Gabriel C, Fitzpatrick JM and Botto H: Heat shock proteins HSP27,
HSP60, HSP70, and HSP90: Expression in bladder carcinoma. Cancer.
98:970–977. 2003. View Article : Google Scholar : PubMed/NCBI
|
|
27
|
Cho HS, Shimazu T, Toyokawa G, Daigo Y,
Maehara Y, Hayami S, Ito A, Masuda K, Ikawa N, Field HI, et al:
Enhanced HSP70 lysine methylation promotes proliferation of cancer
cells through activation of Aurora kinase B. Nat Commun.
3:10722012. View Article : Google Scholar : PubMed/NCBI
|