Introduction
In recent years, a novel type of cancer
immunotherapy has been developed using specific monoclonal
antibodies targeting immune checkpoint molecules, such as cytotoxic
T-lymphocyte-associated antigen-4 (CTLA-4) and the programmed
death-1 (PD-1)/PD-ligand 1 (PD-L1). This type of therapy has been
applied in a number of clinical trials (1-5) and
shows promising clinical benefits even for patients with
advanced-stage disease or metastatic cancer. These accomplishments
have triggered a resurgence of cancer immunotherapy and have
introduced a paradigm shift in cancer treatment (6).
With regard to the immune checkpoint blockade for
PD-1/PD-L1 in clinical trials, a positive PD-L1 expression, a high
mutation burden and a high microsatellite instability (MSI) status
are considered to be possible biomarkers for clinical responder
prediction and good prognosis in melanoma, non-small cell lung
cancer and colon cancer patients treated with PD-1/PD-L1 inhibitors
(3,7-10).
Additionally, tumor-infiltrating lymphocyte (TIL) or
CD8+ T-cells as tumor microenvironment (TME) factors
have become more important parameters for a good antitumor response
and the prognosis of cancer patients (11-13).
As for the immunological parameters associated with
TME, Rooney et al demonstrated that the cytolytic activity
of the local immune infiltrate, such as perforin and granzyme was
associated with MHC class I-associated neoantigens and mutations of
antigen presentation-related genes (14). On the other hand, Ock et al
classified solid tumors into specific immune types based on PD-L1
and CD8 gene expression data derived from the Cancer Genome Atlas
(TCGA) database (15).
These researchers demonstrated that TCGA-derived
large-scale RNA-sequencing data constitute an appropriate model
that can be used to assess the TME, as the contamination of stromal
cells surrounding the tumor would proportionally influence the TME
gene expression profiles in an unbiased manner. In our previous
gene expression profiling (GEP) studies in the project High-tech
Omics-based Patient Evaluation (HOPE), which began in 2014 at
Shizuoka Cancer Center (Shizuoka, Japan) (16,17),
the upregulated specific gene expression associated with TIL or
tumor macrophages was verified (18) partly because all tumor specimens
were obtained promptly from freshly surgically resected tumors. On
the other hand, frozen tumor specimens were analyzed in the TCGA
study (14,15).
In the current study, we classified tumors
registered in the HOPE project into 4 categories based on the
expression level of the PD-L1 and CD8B genes according to Ock et
al (15), and the association
with the immune response-associated gene panel was investigated
among 4 immune-type categories for the purpose of the appropriate
evaluation of immunological status.
Materials and methods
Study design
The Shizuoka Cancer Center launched project HOPE in
2014, which is based on multiomics analyses, including whole exome
sequencing (WES) and GEP. Ethical approval for the HOPE study was
obtained from the institutional review board at the Shizuoka Cancer
Center (authorization no. 25-33). Written informed consent was
obtained from all patients enrolled in the study. All experiments
using clinical samples were carried out in accordance with the
Ethical Guidelines for Human Genome and Genetic Analysis
Research.
Clinical specimens
Tumor tissue samples with weights of ≥0.1 g were
dissected from surgical specimens, along with samples of
surrounding normal tissue. The areas from which tumor samples were
dissected were visually assessed as containing ≥50% tumor
content.
RNA isolation and GEP analysis
The method of RNA isolation was described previously
(17). Briefly, total RNA was
extracted using the miRNeasy Mini kit (Qiagen, Hilden, Germany)
according to the manufacturer's instructions. RNA samples were
quantified using a NanoDrop spectrophotometer (Thermo Fisher
Scientific, Waltham, MA, USA) and their quality was assessed using
an Agilent 2100 Bioanalyzer (Agilent Technologies, Santa Clara, CA,
USA). RNA samples with an RNA integrity number ≥6.0 were used for
microarray analysis. Labeled samples were hybridized to the
SurePrint G3 Human Gene Expression 8×60 K v2 Microarray (Agilent
Technologies). Hybridization signals were detected using a DNA
Microarray Scanner (Agilent Technologies). Microarray analysis was
performed in accordance with the MIAME guidelines (19).
DNA isolation and WES analysis
The method of DNA isolation was described previously
(17). Briefly, DNA was extracted
from tissue and blood samples using a QIAamp kit (Qiagen) and
subjected to WES on the Ion Proton System (Thermo Fisher
Scientific). For data analysis, single-nucleotide variants (SNVs)
with quality scores <30 or depth of coverage <20 were
discarded. Somatic mutations were identified by comparing the data
from tumor and corresponding blood samples. Driver mutations in 138
Vogelstein driver genes (20) were
defined as those identified as pathogenic in the ClinVar database.
SNVs of the total exonic mutations for each sequenced tumor
included nonsynonymous, synonymous, and indels/frameshift
mutations.
Establishment of the immune
response-associated gene panel
The content of the immune response-associated gene
panel has been previously described (18). In total, 174 immune
response-associated genes [67 antigen-presenting cell
(APC)-associated and T-cell-associated genes, 34 cytokine- and
metabolism-associated genes, 48 tumor necrosis factor (TNF) and TNF
receptor superfamily genes and 25 regulatory T-cell-associated
genes] were selected and used for GEP analysis (data not
shown).
Association of TME immune category with
immune or cancer signal pathways
Cancer patients of each TME category were profiled
for immune and cancer signaling pathways using
immune-response-associated and Vogelstein driver gene expression
data, respectively, by means of Ingenuity Pathway Analysis (IPA)
software (version Summer 2017; Qiagen).
Statistical analysis
The ratio of the expression intensity between the
tumor tissue and surrounding normal tissue was calculated from
normalized values. A ratio of >2.0 was rated as positive for
gene expression. The ratio of log2-transformed values of
the PD-L1 and CD8B genes was plotted on the vertical and horizontal
axis, respectively (Fig. 1B).
Based on the expression levels of the PD-L1 and CD8B genes, we
classified all 1,734 tumors enrolled in the HOPE project into 4
immune types as follows: type A, PD-L1+
CD8B+; type B, PD-L1+ CD8−; type
C, PD-L1−CD8B−; and type D,
PD-L1−CD8B+. The upregulated genes in
expression derived from the 174 immune response-associated gene
panel between TME immune type A and other types were identified
using the volcano plot method. Comparing the proportion of
categorical variables in each immune-type category was performed
using Pearson's Chi-square test and the unpaired two-tailed t-test.
Values of P<0.05 were considered significant. Data analysis was
performed using GeneSpring GX software version 13.1.1 (Agilent
Technologies) and Microsoft Excel.
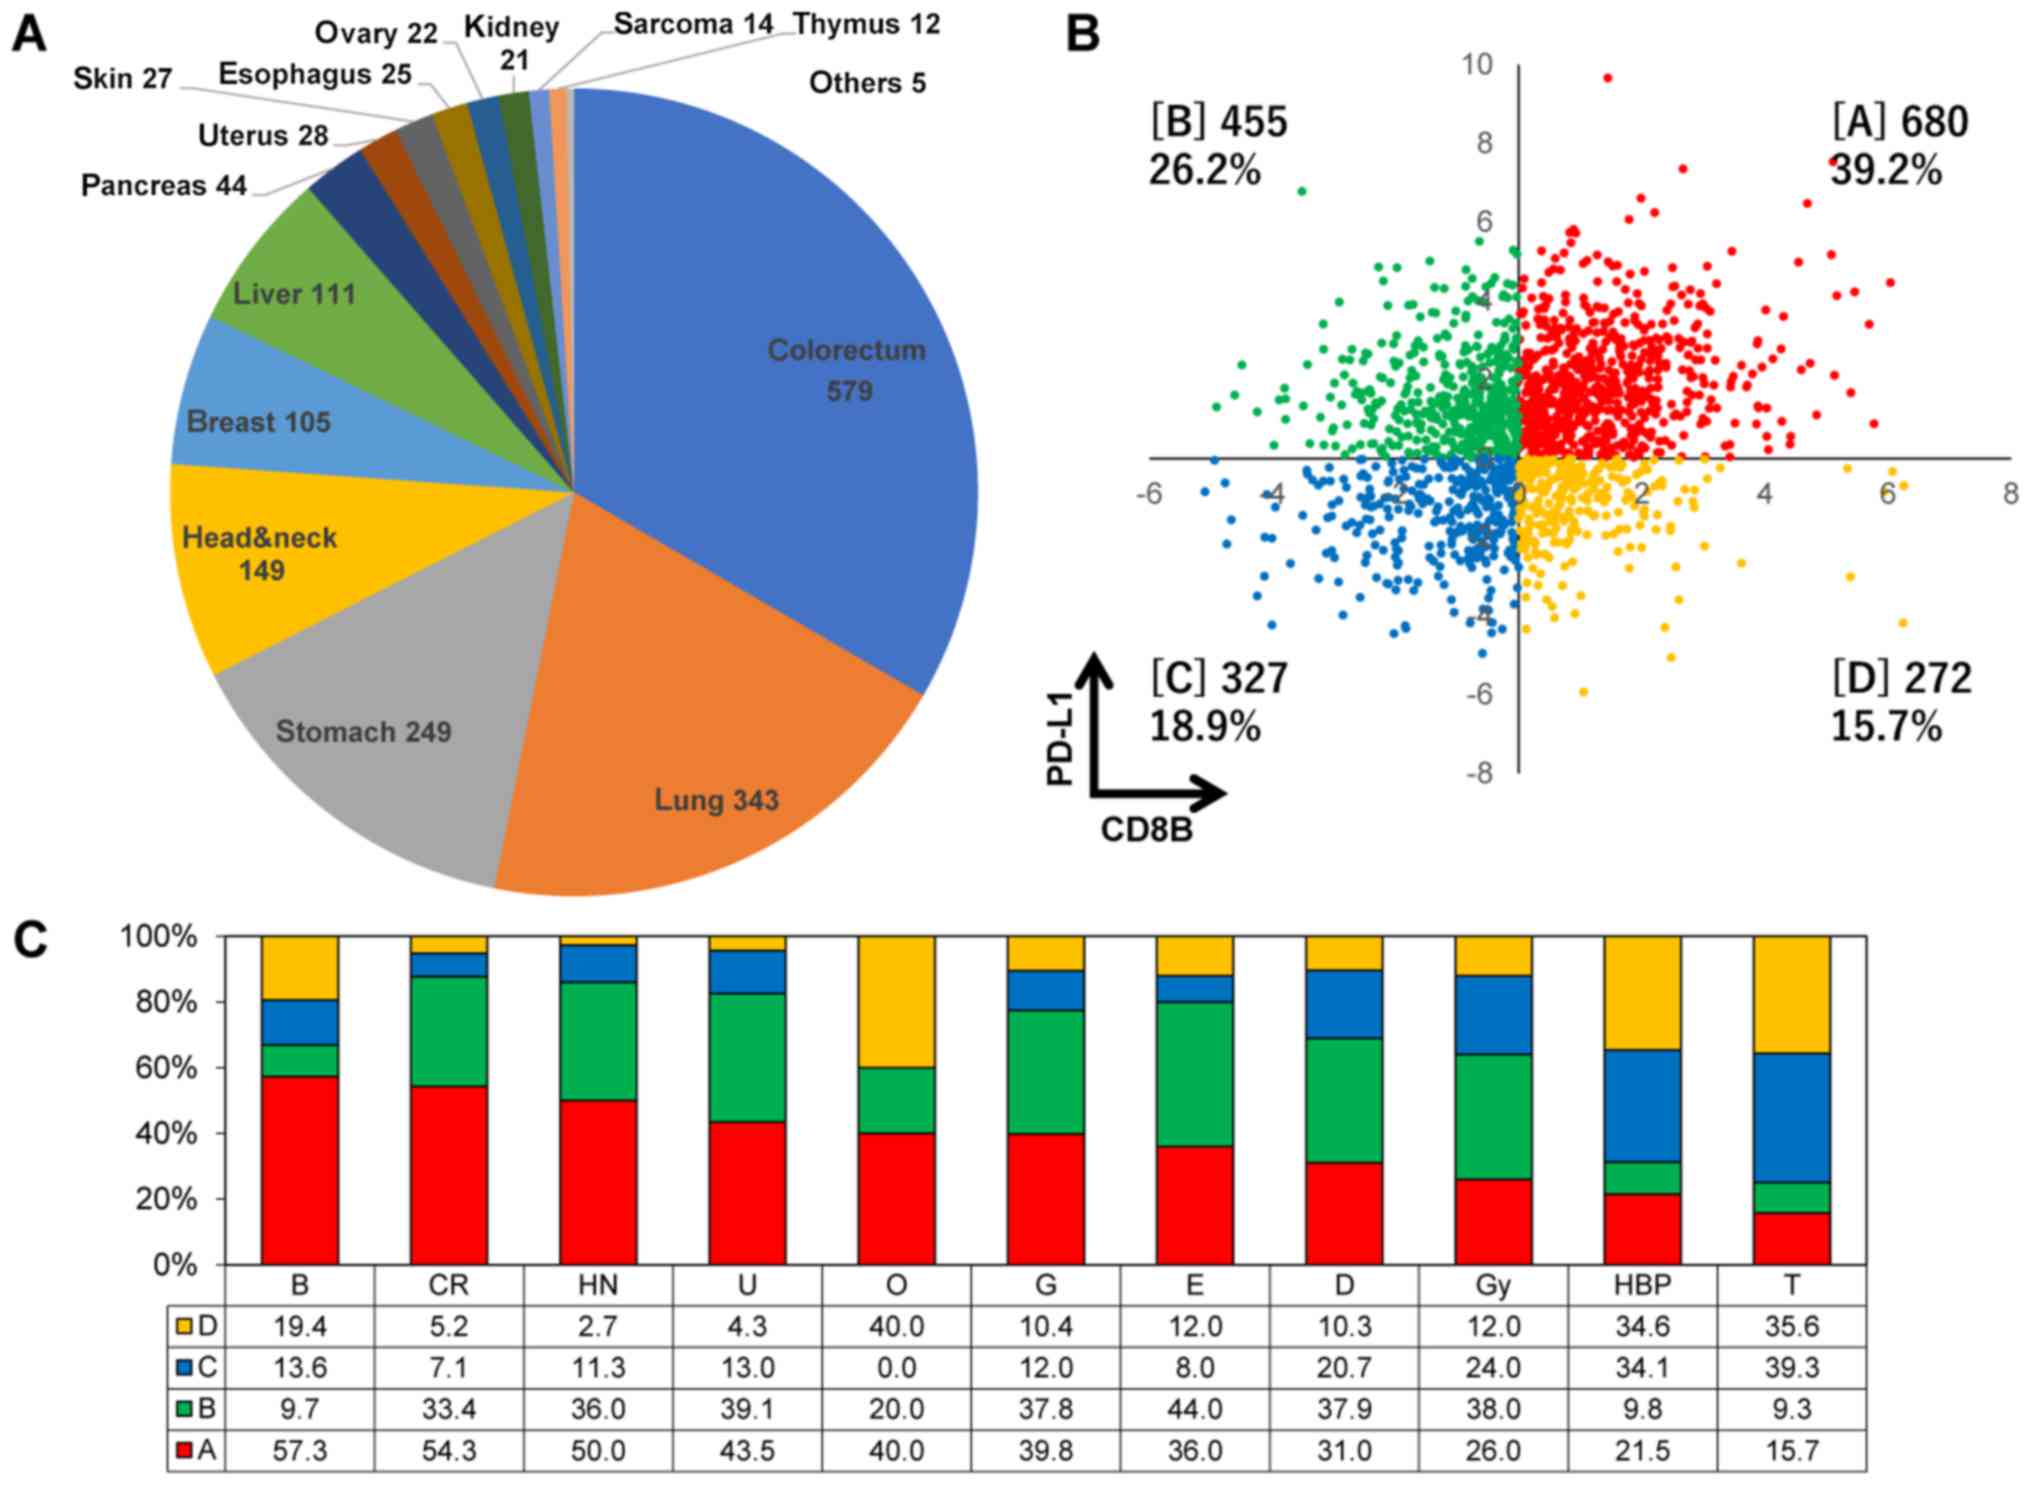 | Figure 1The classification of TME immune-type
categories in various cancers registered in project HOPE. (A) The
organ distribution of 1,734 tumors derived from 17 different types
registered in project HOPE. (B) The proportion of TME immune types
A, B, C and D based on the expression levels of both the PD-L1 and
CD8B genes. Types A, B, C and D are indicated in square brackets.
(C) The proportions of each immune type in various cancer types. B,
breast; CR, colorectal; HN, head and neck; U, kidney; O, bone; G,
stomach; E, esophagus; D, skin; Gy, uterus and ovary; HBP, liver
and pancreas; and T, lung. Each value represents the proportion in
percentage of each immune type. TME, tumor microenvironment; HOPE,
High-tech Omics-based Patient Evaluation. |
Results
Histological distribution and TME immune
type classification of cancer patients enrolled in the HOPE
project
GEP was accomplished in 1,734 pairs (without
metastasis) of tumors and adjacent normal tissues derived from 17
different cancer types. Colon-rectum, lung, stomach and head and
neck cancers accounted for >60% of the total cases (Fig. 1A). The proportion of TME immune
types A, B, C and D were 39.2, 26.2, 18.9 and 15.7%, respectively
(Fig. 1B). The proportion of type
A was >50% in breast, colon-rectum and head and neck cancers,
while it was low in lung, liver and pancreatic cancers (Fig. 1C). On the other hand, the
proportion of types C and D was higher in liver, pancreas and lung
cancers. No clinicopathological factors, such as age, sex, smoking
habit or clinical stage, was associated with immune type categories
(data not shown).
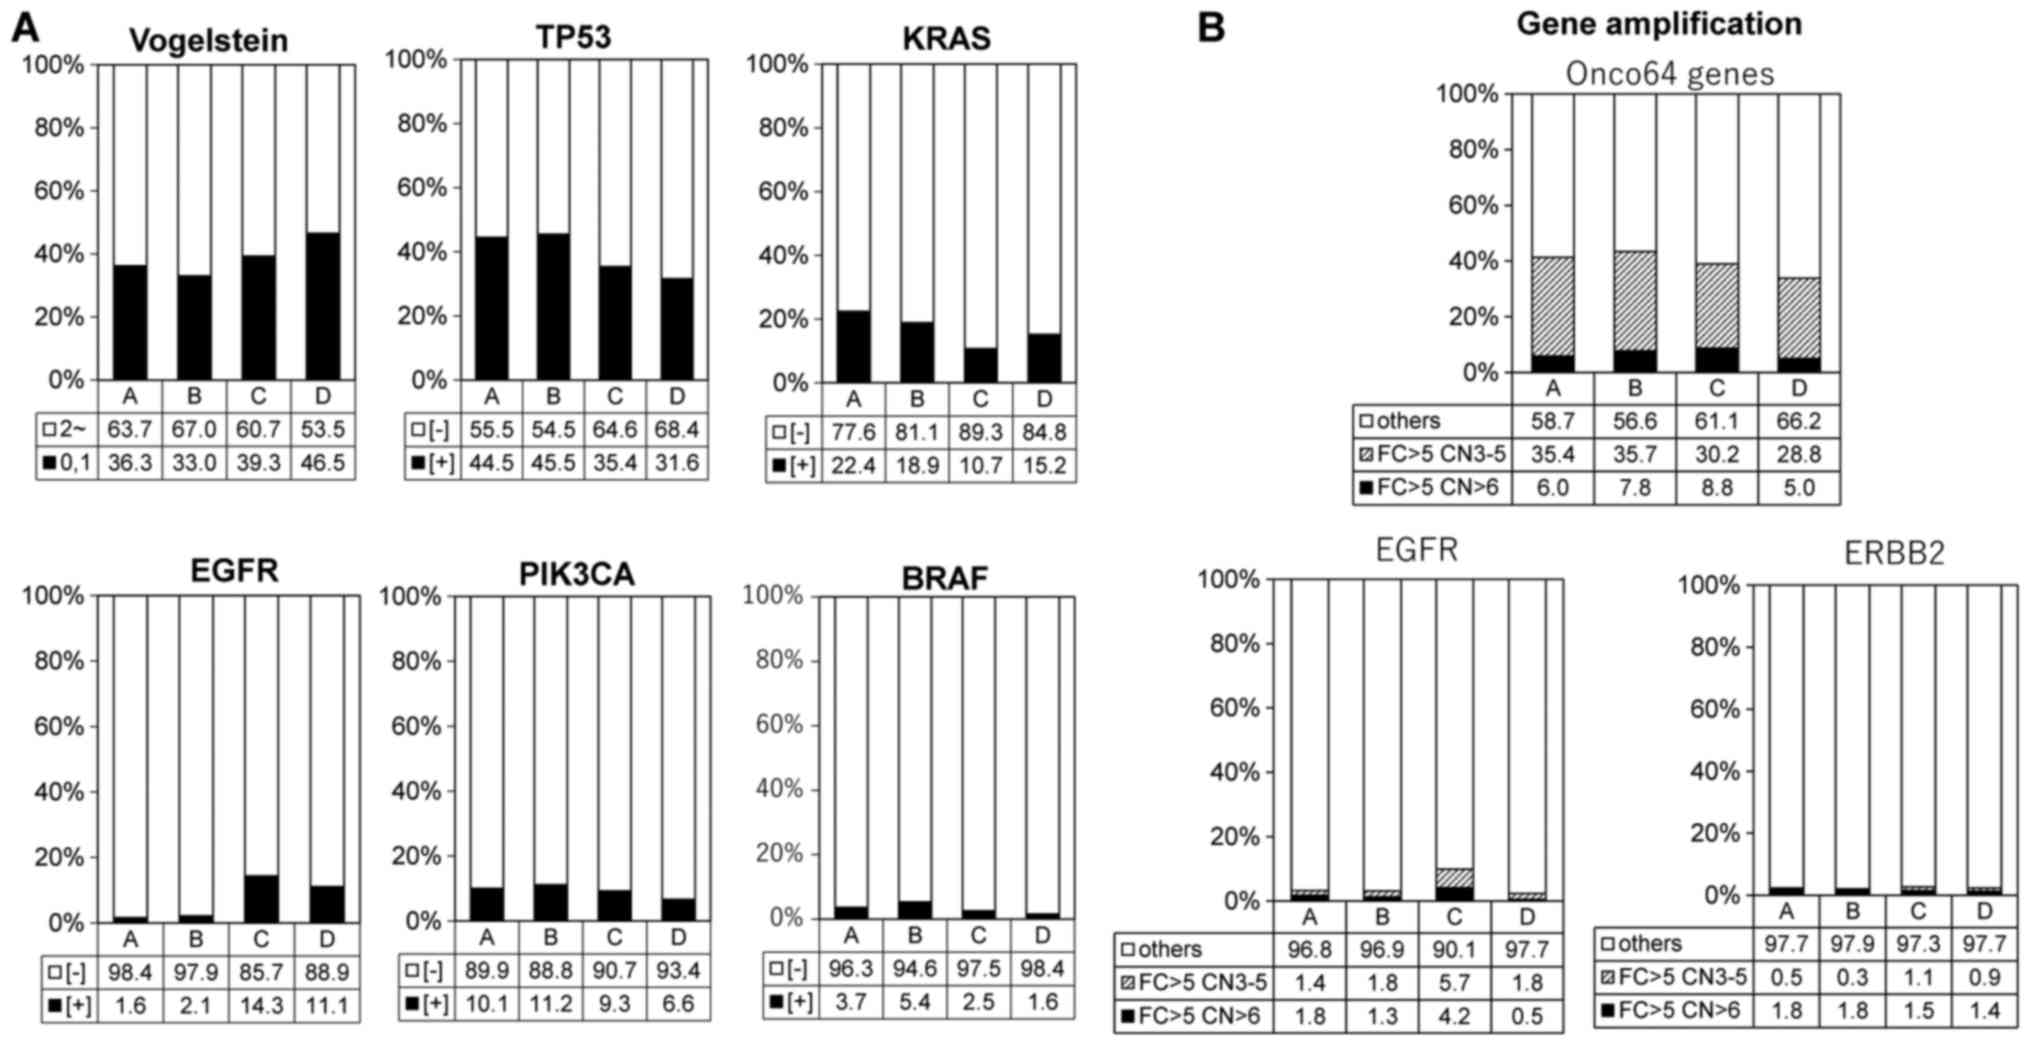
Association of Vogelstein driver gene
mutations and gene amplifications with TME immune types
We focused on somatic SNVs obtained by WES analysis
and Vogelstein driver gene mutation profiling was investigated. The
proportion of all Vogelstein driver gene mutations and TP53, KRAS,
EGFR, PIK3CA, BRAF mutations were calculated in each TME immune
type. The frequency of Vogelstein driver gene mutation had a
tendency to be higher in types C and D (Fig. 2A and Table I), and so did the frequency of EGFR
mutations. On the other hand, the frequency of TP53 and KRAS
mutations was higher in type A compared with the other types.
Moreover, all 64 gene amplifications, which have been reported
previously as a gene list with a >5-fold change in expression
and >6 copy numbers (17), had
no significant effect on the TME immune types. However, EGFR
amplification exhibited a tendency to be higher in type C, similar
to the EGFR mutation frequency (Fig.
2B and Table I).
 | Table IComparison of immunological and
genetic features between TME type A and others. |
Table I
Comparison of immunological and
genetic features between TME type A and others.
| Group | Type A
n=706 | Others (type B, C,
D)
n=1,138 | P-value |
|---|
| Genetic
mutations | | | |
| Vogelstein | 256 (36.3%) | 441 (38.8%) | P=0.174 |
| TP53 | 314 (44.5%) | 438 (38.5%) | P<0.01 |
| KRAS | 158 (22.4%) | 174 (15.3%) | P<0.001 |
| EGFR | 11 (1.6%) | 96 (8.4%) | P<0.001 |
| PIK3CA | 71 (10.1%) | 106 (9.3%) | P=0.498 |
| BRAF | 26 (3.7%) | 39 (3.4%) | P=0.709 |
| SNV no.a | 157.8 | 110.3 | P=0.112 |
| Gene
amplificationb | | | |
| All 64 genes | 33 (6.0%) | 64 (7.4%) | P=0.178 |
| EGFR | 10 (1.8%) | 17 (2.0%) | P=0.096 |
| HER2 | 10 (1.8%) | 14 (1.6%) | P=0.858 |
| Immune cell
subpopulation | | | |
|
PD-1+TIM3+ | 206 (30.3%) | 26 (2.5%) | P<0.001 |
| FAS
ligand+CD69+ | 155 (22.8%) | 20 (1.9%) | P<0.001 |
|
CD11c+CD83+HLA-DR+ | 147 (21.6%) | 41 (3.9%) | P<0.001 |
|
CD16+NCR1+ | 83 (12.2%) | 41 (3.9%) | P<0.001 |
|
CSF1R+MSR1+ | 86 (12.7%) | 69 (6.6%) | P<0.001 |
| Cytokine and enzyme
(FC >2) | | | |
| IFNG | 481 (68.1%) | 253 (22.2%) | P<0.001 |
| TNFA | 247 (34.9%) | 163 (14.3%) | P<0.001 |
| IL12 | 175 (24.8%) | 200 (17.6%) | P<0.001 |
| VEGFA | 349 (49.4%) | 394 (34.7%) | P<0.001 |
| TGFB1 | 255 (36.1%) | 238 (20.9%) | P<0.001 |
| IL6 | 307 (43.4%) | 300 (26.4%) | P<0.001 |
| IL10 | 112 (15.8%) | 67 (5.9%) | P<0.001 |
| GZMB | 535 (76.0%) | 354 (31.4%) | P<0.001 |
| PRF | 290 (41.2%) | 89 (7.9%) | P<0.001 |
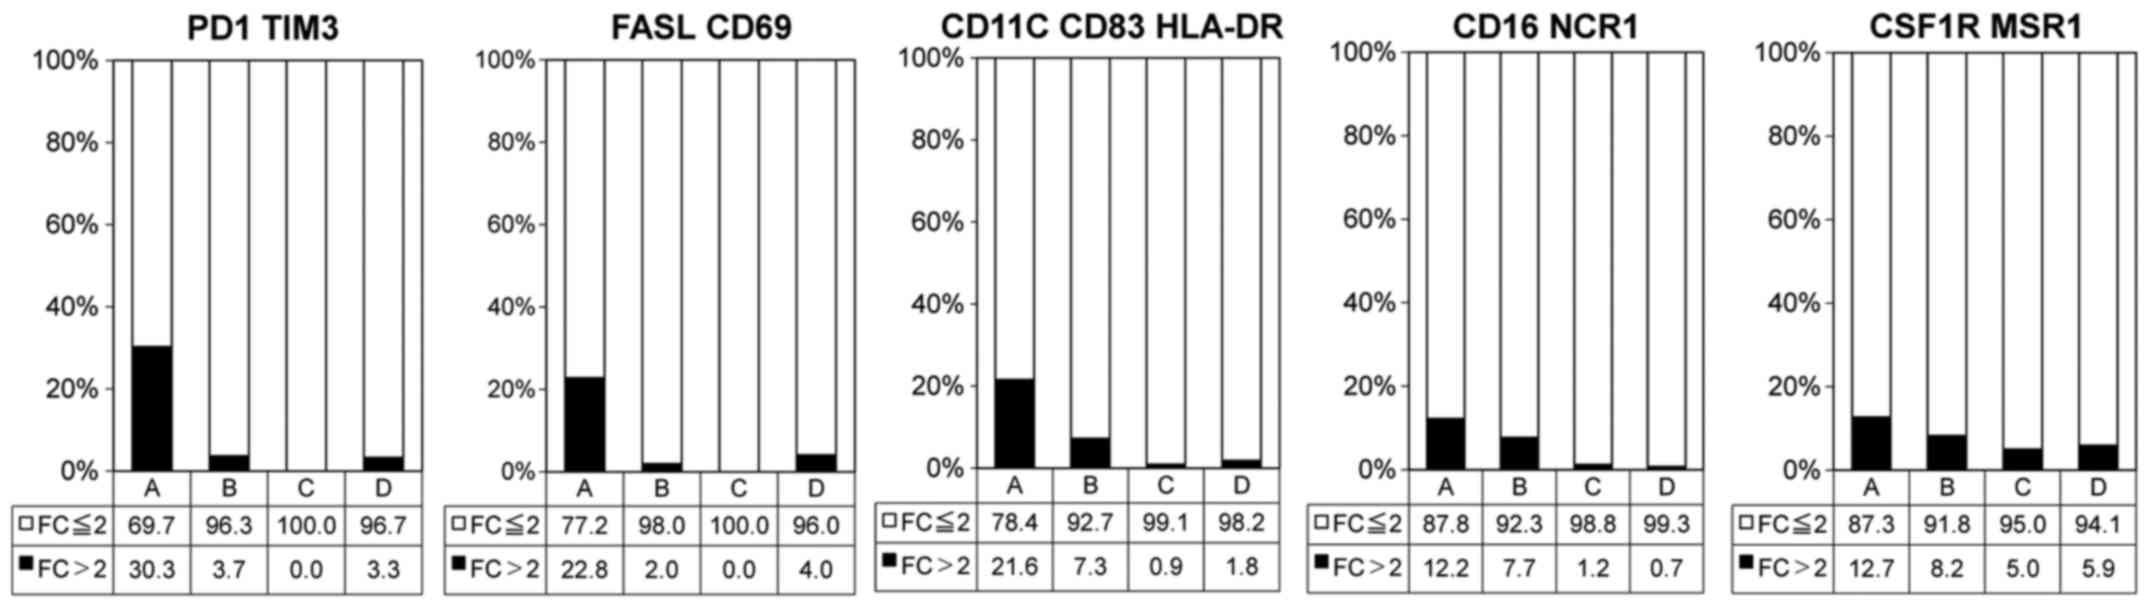
Association of immunological cell surface
markers with TME immune types
The frequencies of exhausted T-cells
(PD-1+TIM3+), activated effector T-cells (FAS
ligand+CD69+) and mature dendritic cells
(DCs; CD11c+CD83+HLA-DR+) were
significantly higher in types A (Fig.
3 and Table I). Additionally,
the frequencies of activated natural killer (NK) cells
(CD16+NCR1+) and macrophages
(CSF1R+MSR1+) exhibited a tendency to be
higher in type A (Fig. 3 and
Table I).
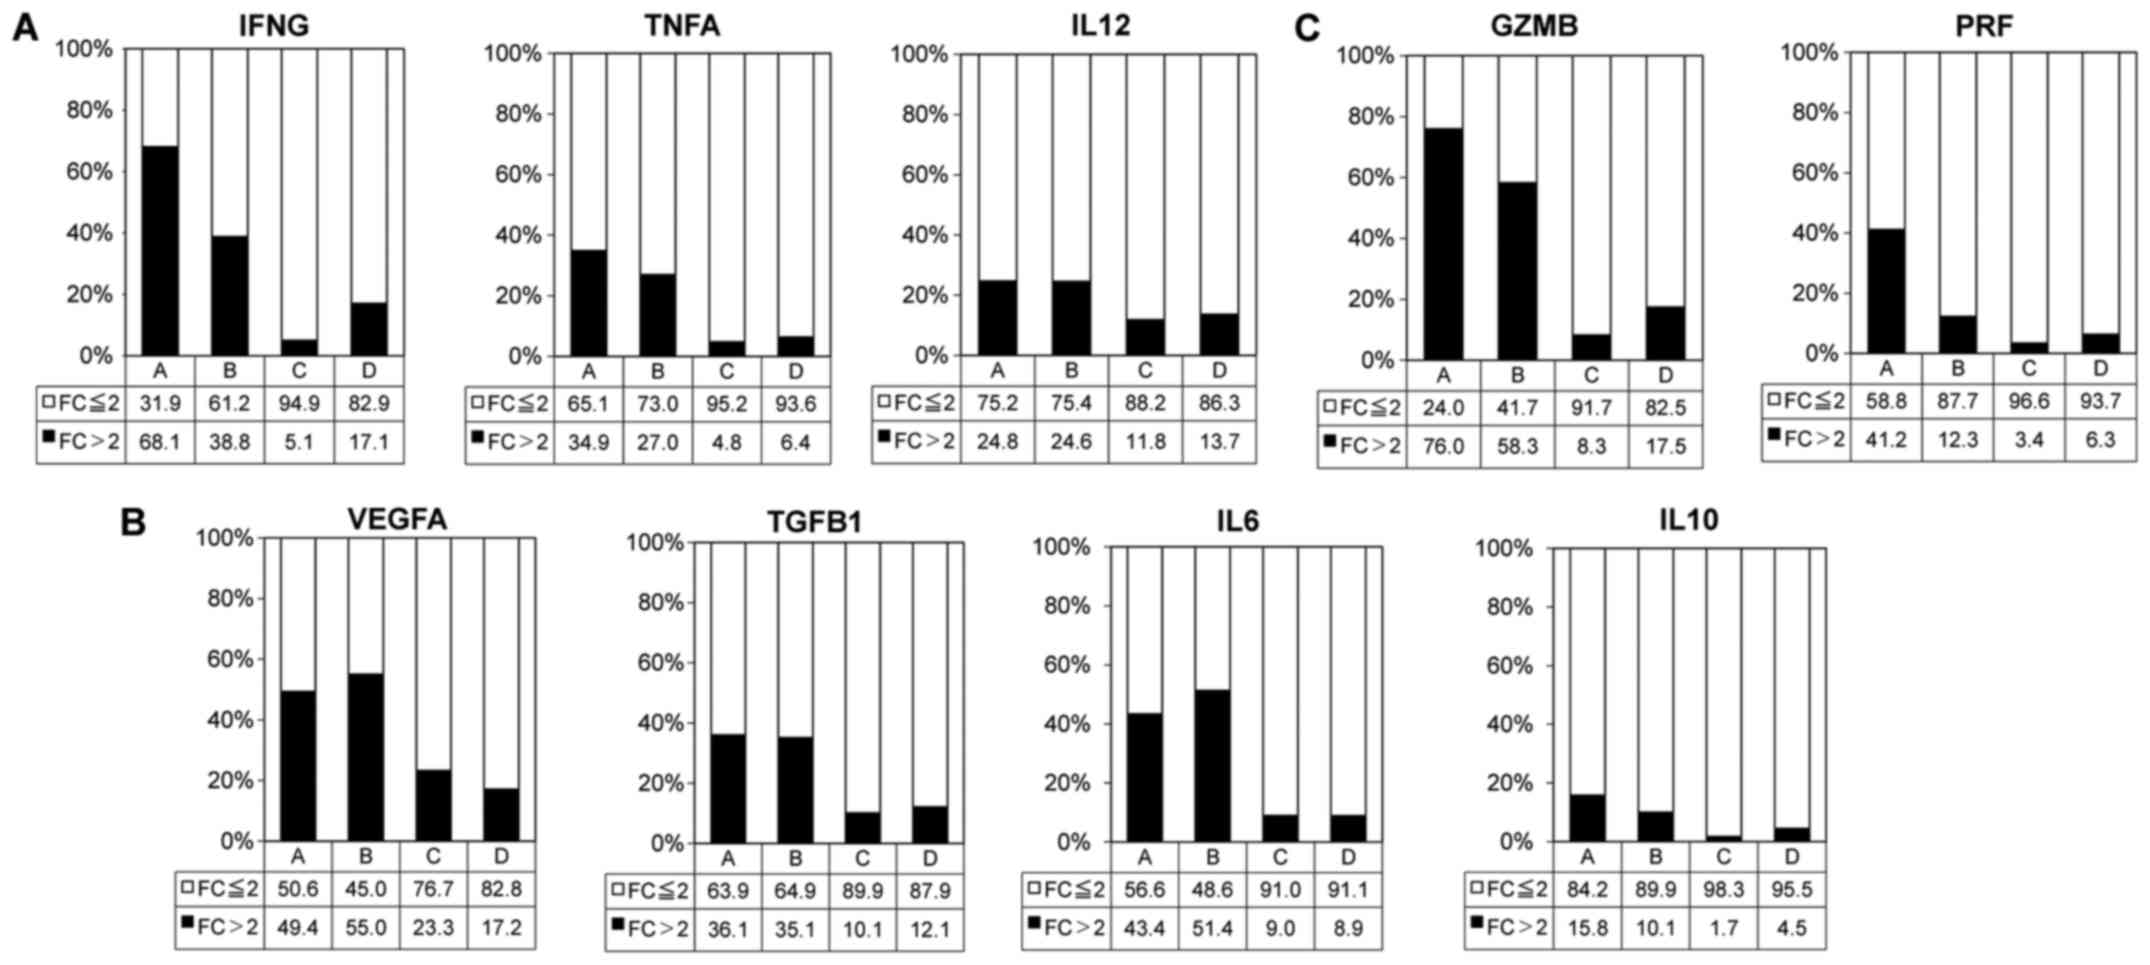
Association of cytolysis and helper
T-cell-related cytokines with TME immune types
The frequencies of tumors positive for
immuno-activation cytokine (IFNG, TNFA and IL12),
immuno-suppressive cytokine (VEGFA, TGFB1, IL6 and IL10) and
cytolytic factor (GZMB and PRF1) gene expressions were high in
types A (Fig. 4 and Table I). In particular, the IFNG and GZMB
gene expression rate was >50% in type A.
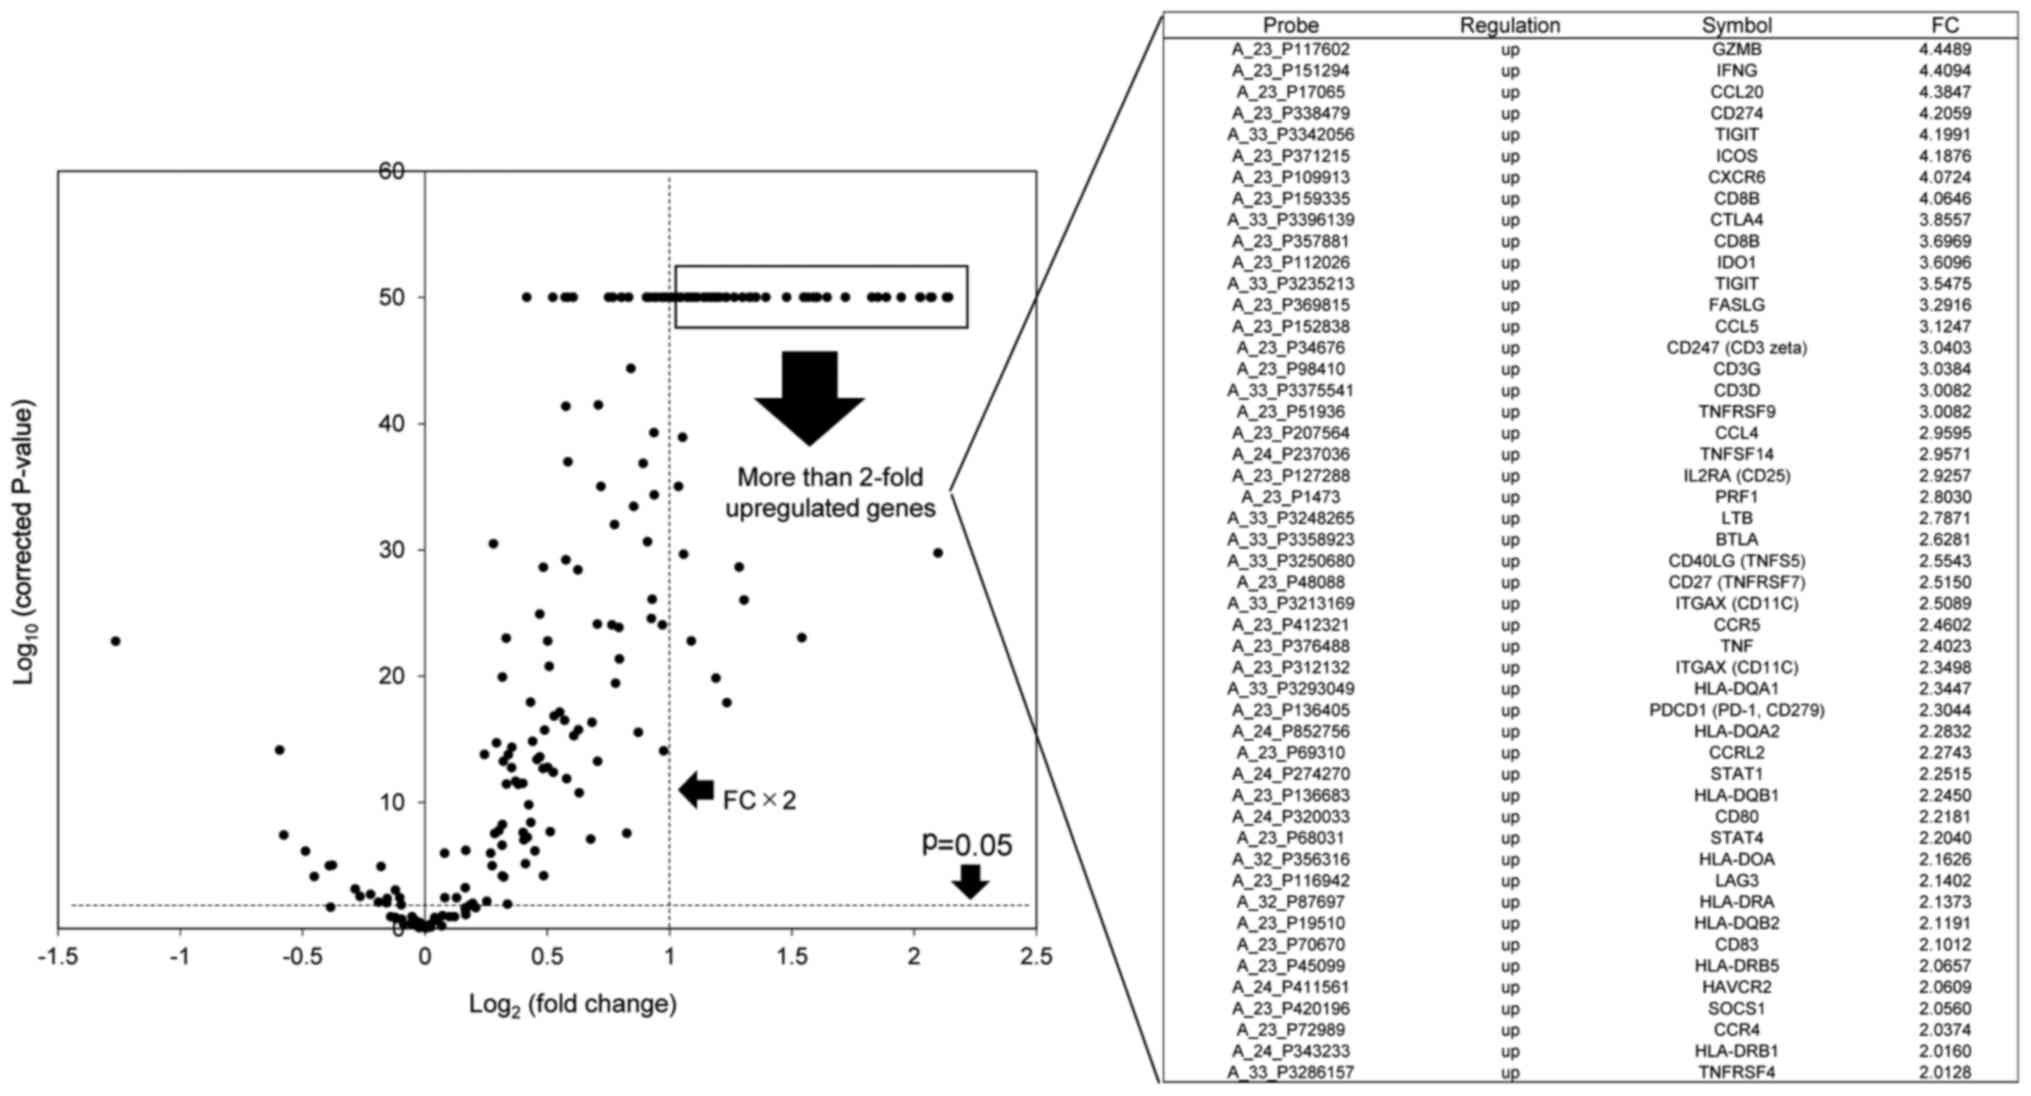
The identification of upregulated immune
response-associated genes in TME immune type A compared with other
types
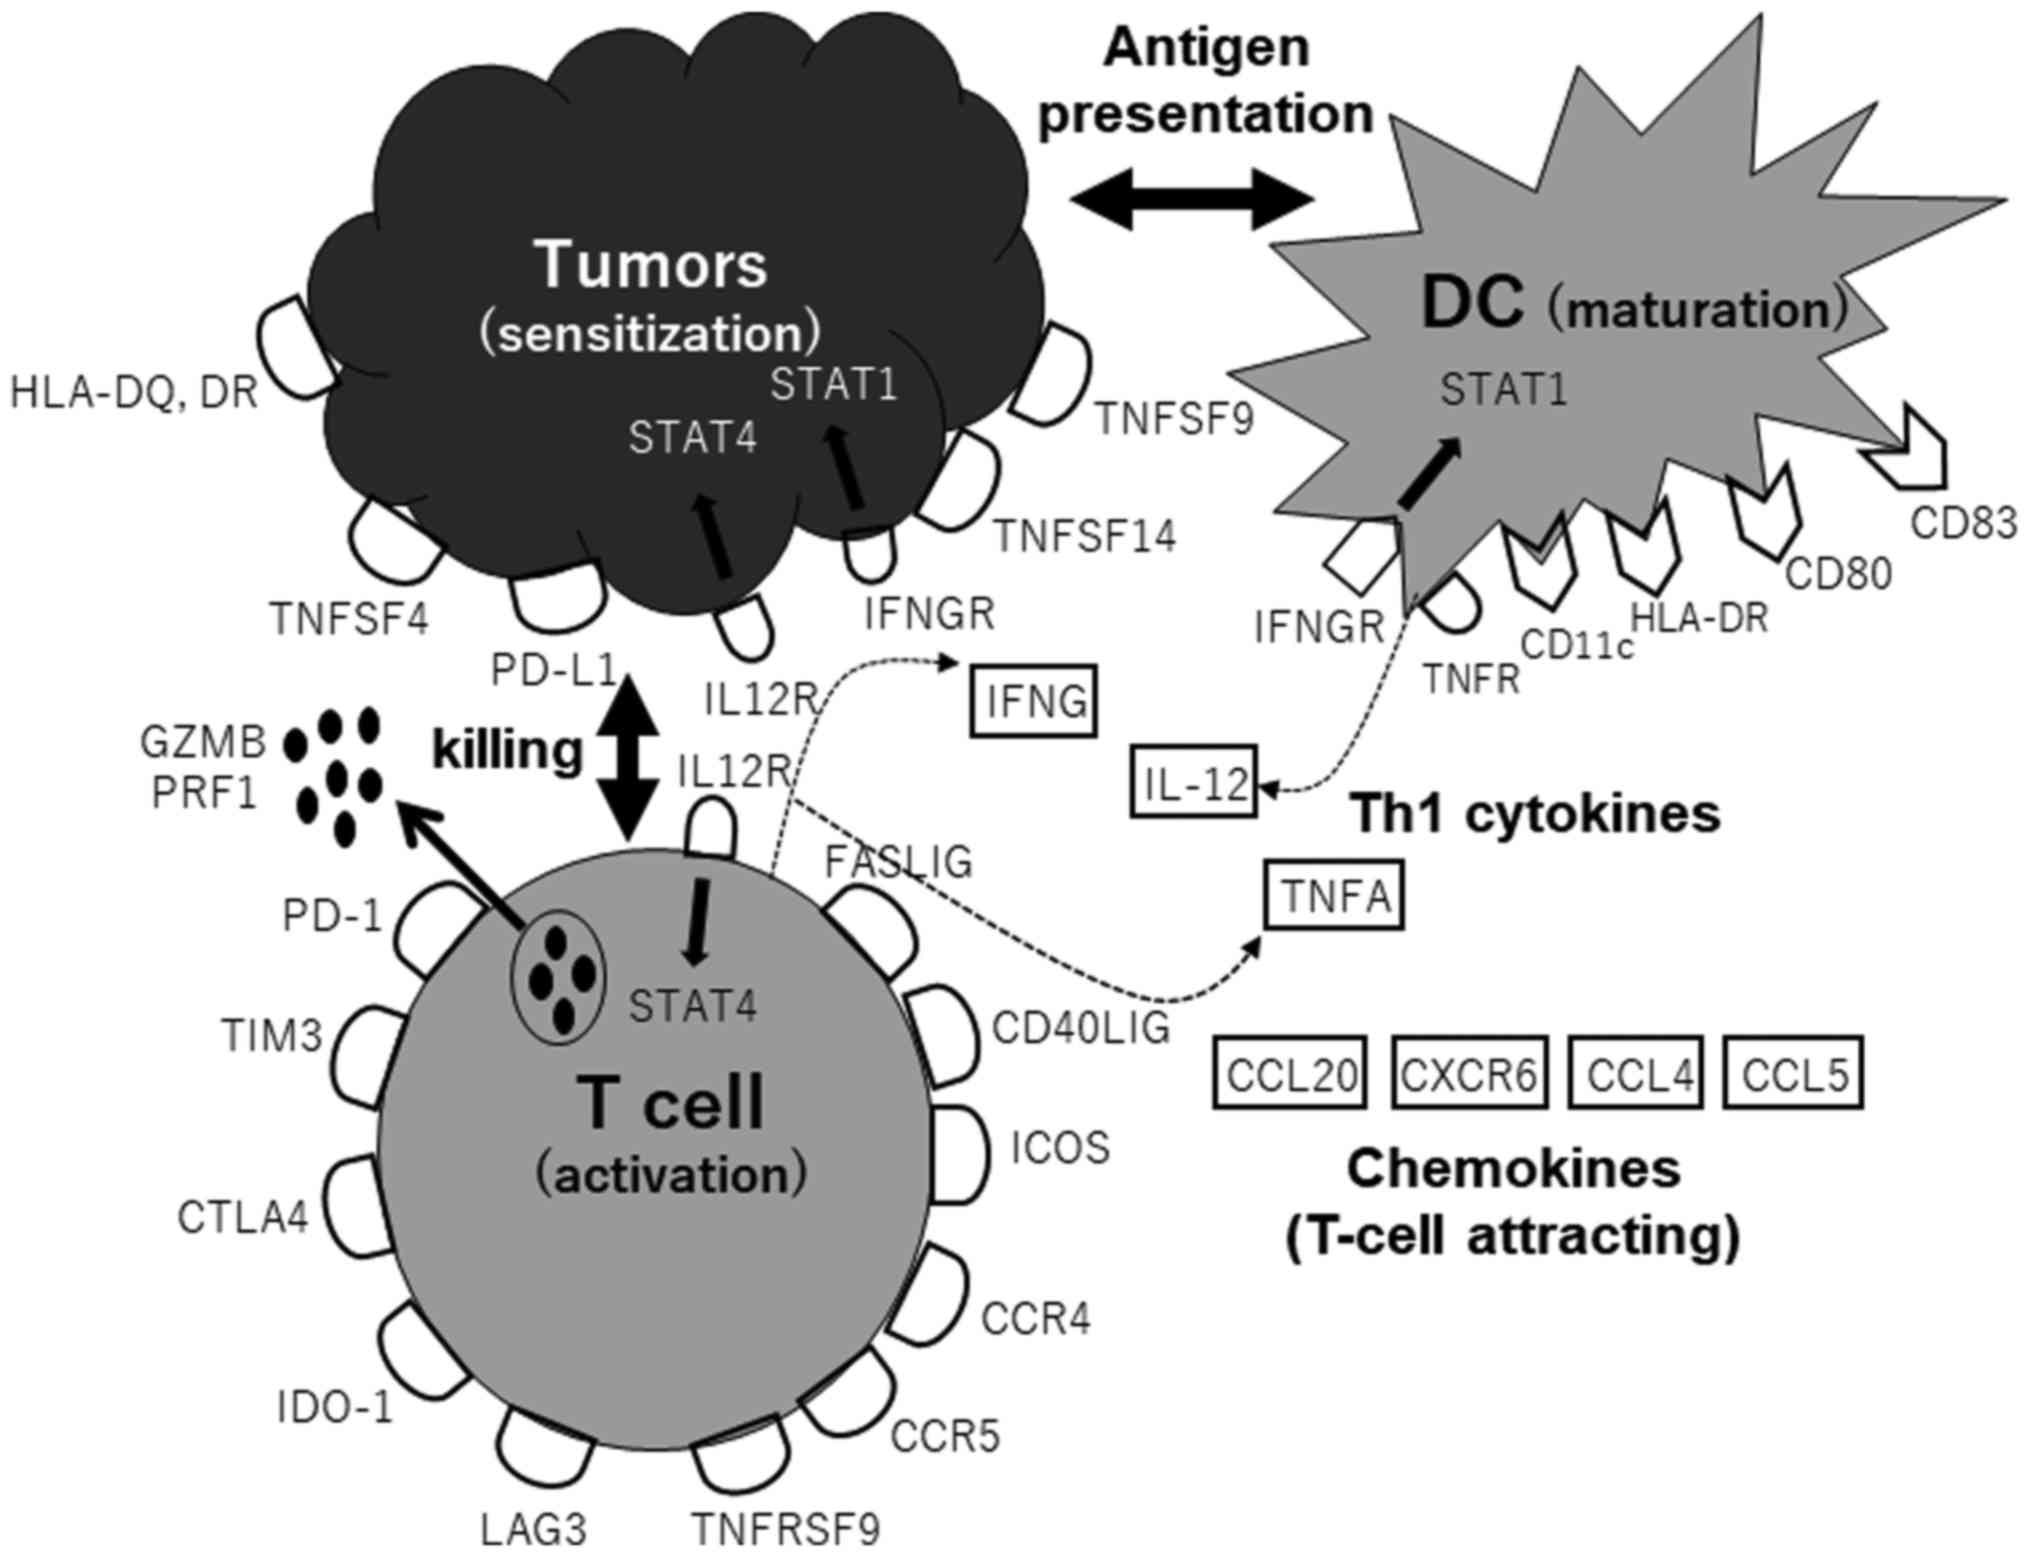
A total of 46 upregulated immune response-associated
genes with a >2-fold change in expression were identified using
the volcano plot (Fig. 5). These
genes belonged to Th1 pathway-activating gene population, such as
T-cell effector activation (FASLIG, CD40LIG, TNFSF4, TNFSF9 and
TNFSF14), CTL killing (GZMB and PRF1), T-cell attraction (CCL20,
CXCR6, CCL4 and CCL5), DC maturation and Th1 cytokines (IFNG, IL12,
TNFA and STAT4) (Fig. 6).
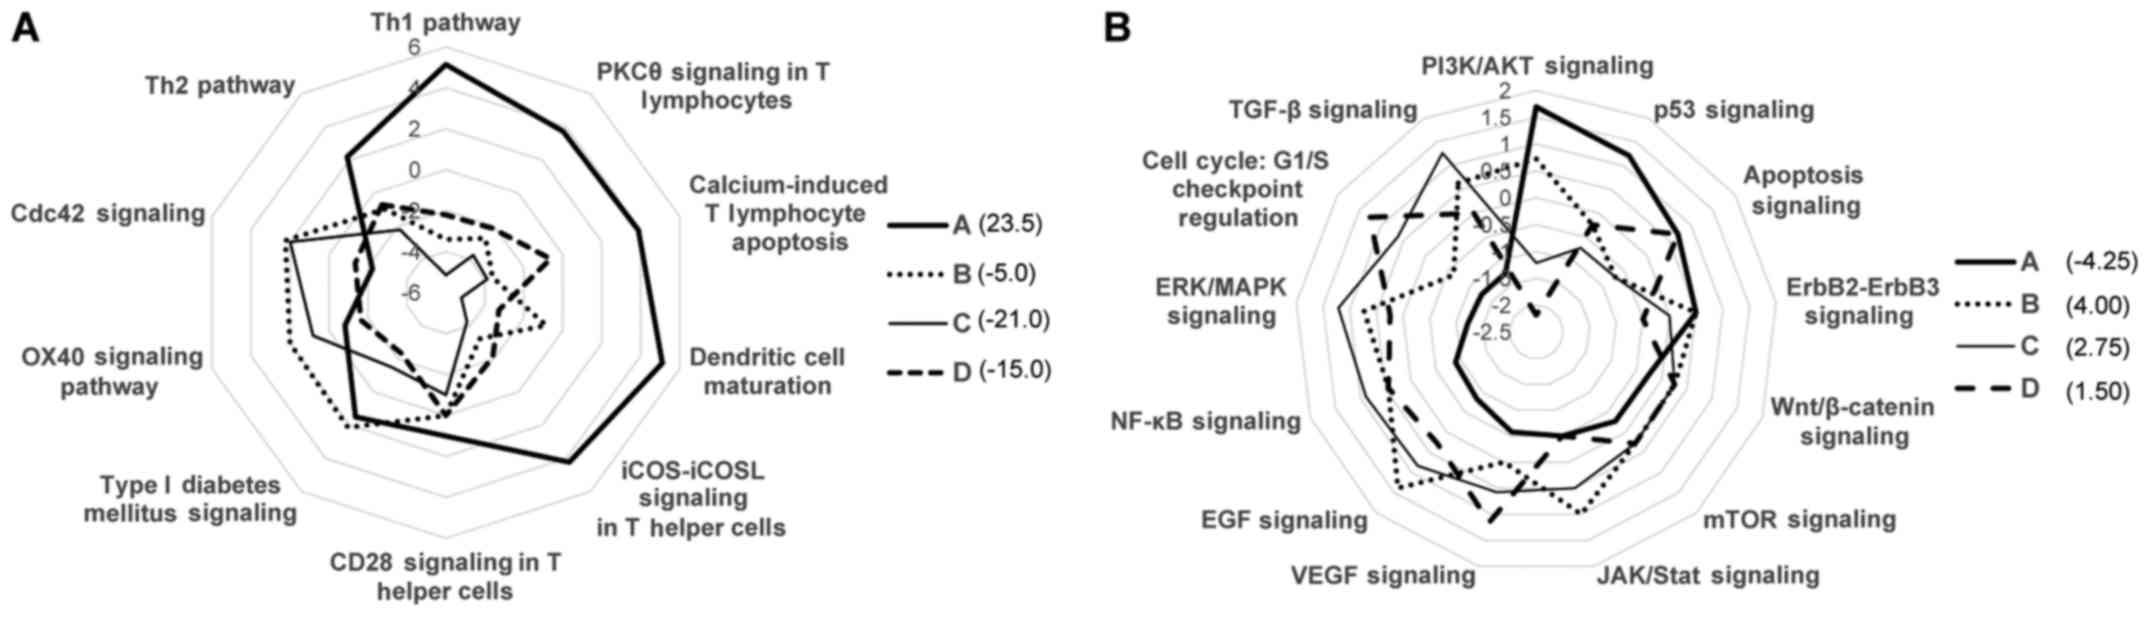
Association of TME immune types with
immune or cancer signaling pathways
Based on the expression data of a panel of 174
immune response-associated genes, the immune pathway-specific
characterization of each TME immune type was performed using IPA
software in the radar chart. Immune type A was associated with the
Th1 and T-cell activation (PKC, calcium and ICOS) pathway and
dendritic cell maturation signaling. On the other hand, type C
exhibited a downregulation in T-cell activation signaling, although
the Cdc42 and OX40 (NF-κB) signaling pathways were activated
(Fig. 7A). Moreover, radar chart
analysis based on the Vogelstein driver gene expression data
revealed that type C was activated with cancer signaling pathways,
such as TGF-β, ERK/MAPK, NF-κB, EGF, VEGF and JAK/STAT signaling,
and was suppressed with T-cell activation signaling (PI3K and p53
and apoptosis pathways). However, these tendencies were reversed in
the type A group (Fig. 7B). In
terms of calculated Z scores, type A exhibited the highest score of
the immuno-activation signaling pathway and the lowest score of the
cancer pathway signaling.
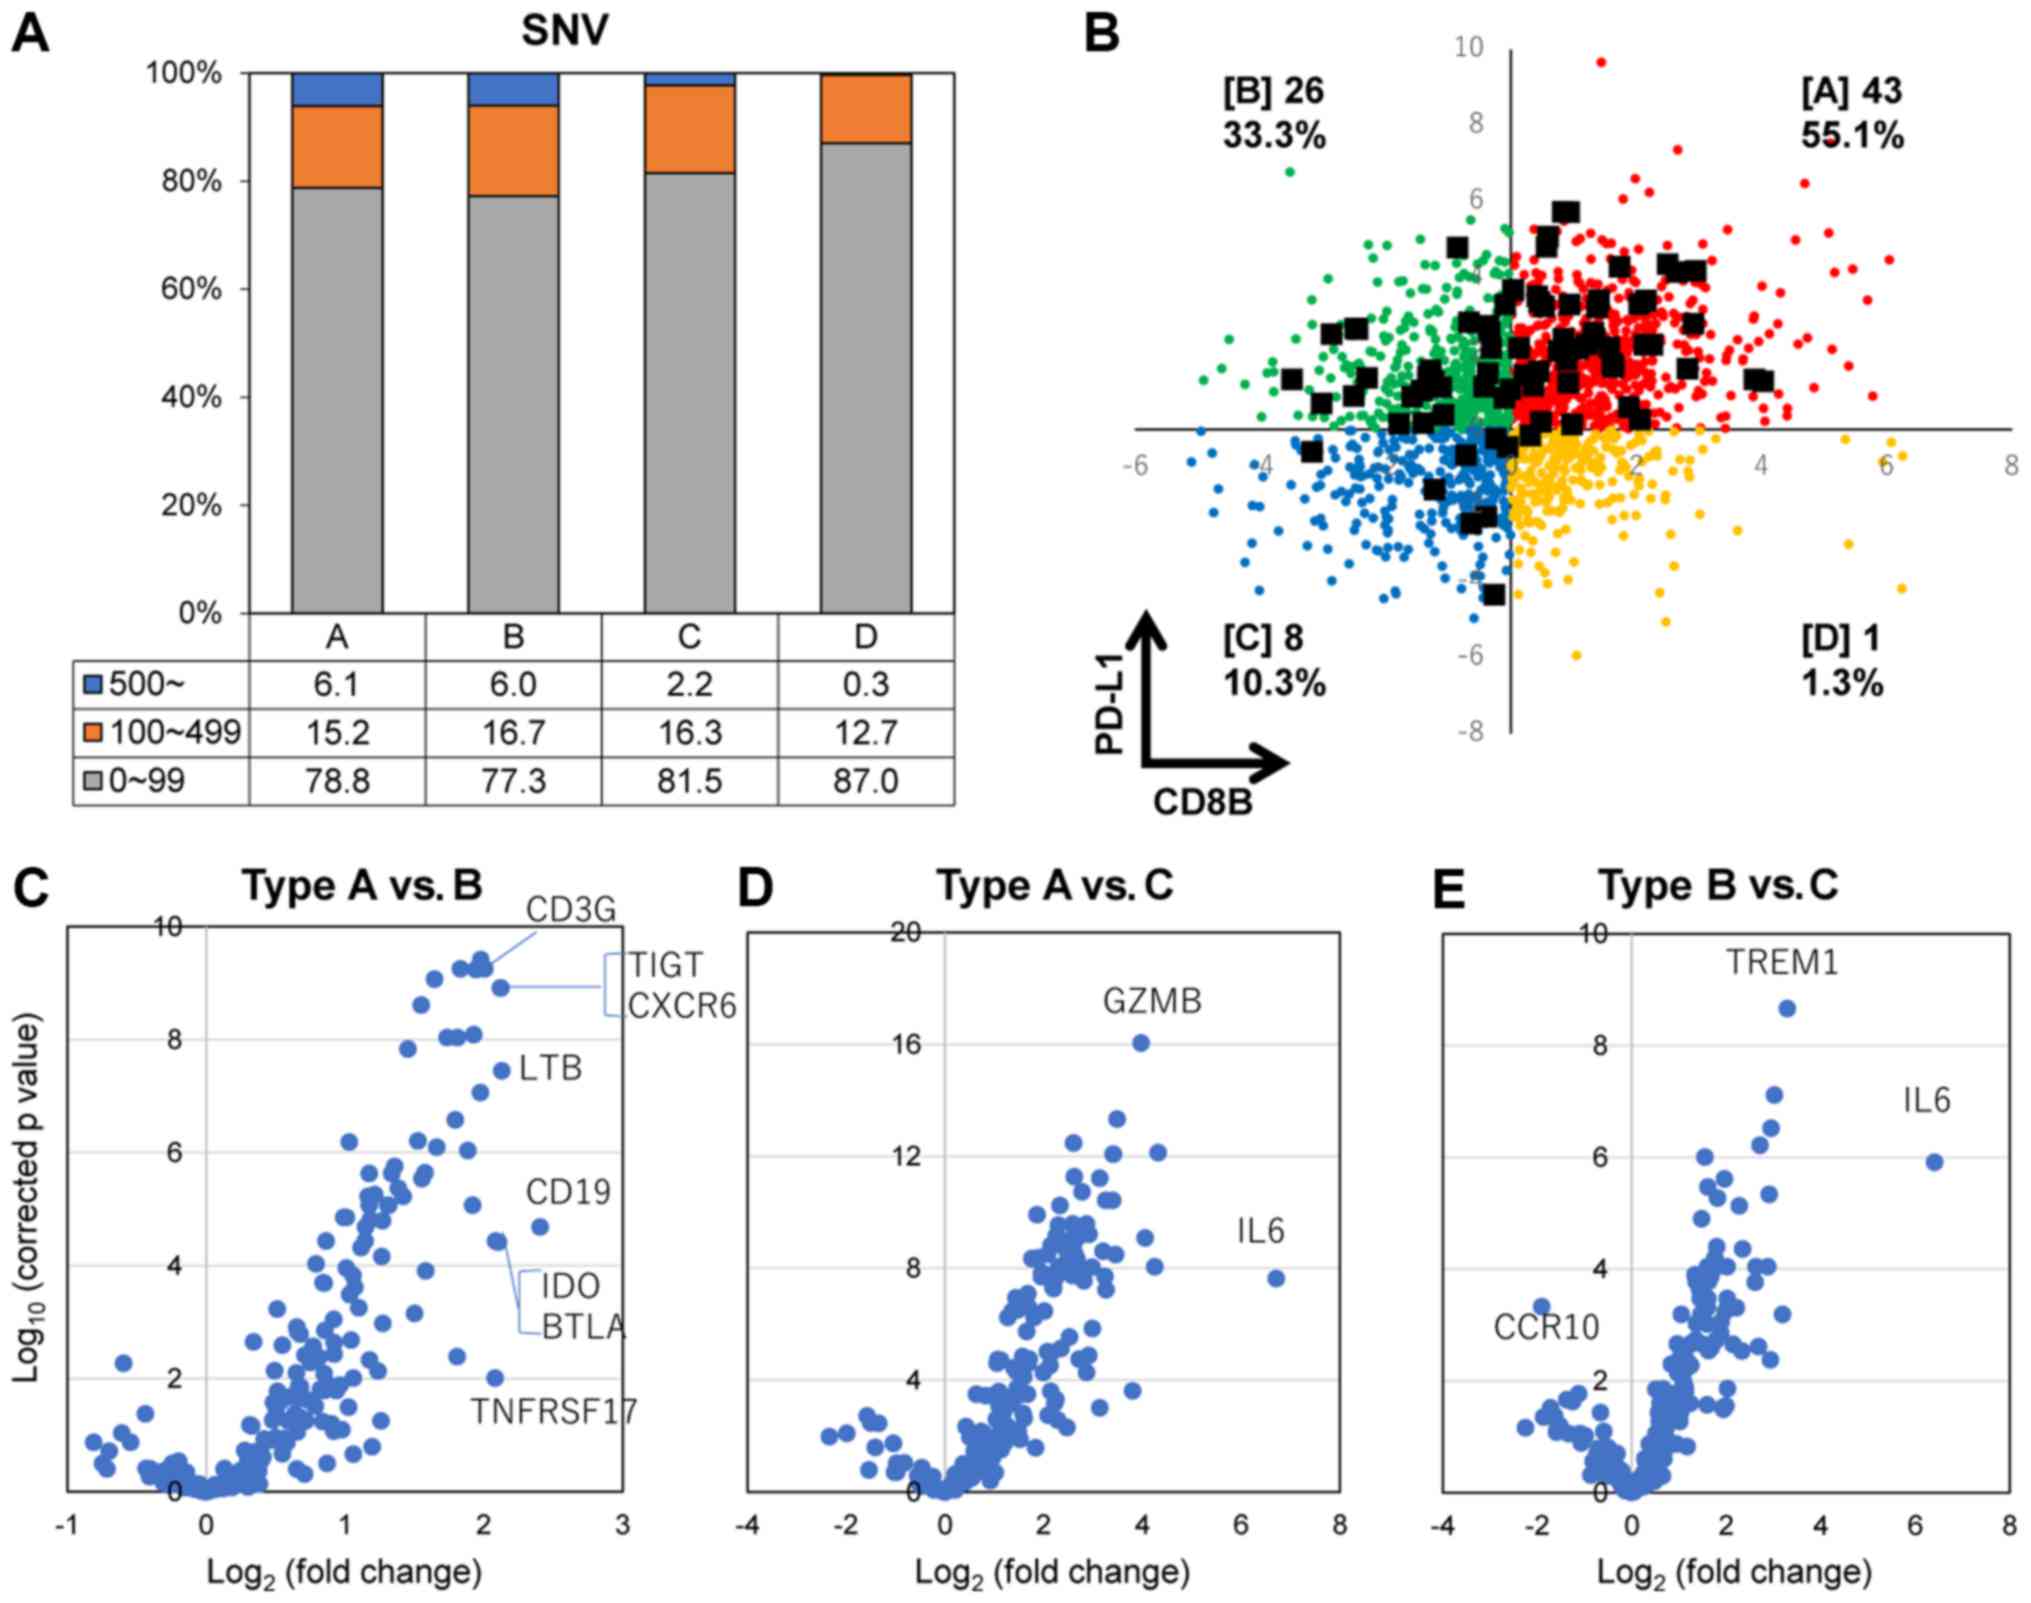
Hypermutator-related biomarker
identification based on PD-L1 and CD8B gene expression
The frequency of the SNV number in each TME immune
types is shown in Fig. 8A. The
frequency of hypermutator tumors (4.5%, 78 of 1,734 cases) with
>500 SNVs was significantly higher in types A and B, compared
with types C and D. Hypermutator cases are displayed as black
squares in Fig. 8B based on the
expression levels of the PD-L1 and CD8B genes. Most hypermutators
belonged to immune types A, B and C. Of note, only one case was
recognized in immune type D (PD-L1+CD8B−).
Moreover, the expression of 174 immune response-associated genes
was compared between hypermutator cases in each immune type using
the volcano plot analysis, which indicated that the IL6 gene was
upregulated in types A and B compared with type C (Fig. 8D and E; Table II), and that the TREM1 gene was
upregulated in type B compared with type C. Additionally, dominant
genes were not recognized when we compared immune
response-associated gene expression between type A and type B
(Fig. 8C and Table II).
| Table IIGene expression profiling comparing
between TME immune types: Hypermutator tumors. |
Table II
Gene expression profiling comparing
between TME immune types: Hypermutator tumors.
| Category | Gene Symbol | Probe ID | P-value | Log FC |
|---|
| A vs. B | CD19 | A_23_P113572 |
2.04×10⁻⁵ | 2.41 |
| A vs. B | LTB | A_33_P3248265 |
3.55×10⁻⁸ | 2.13 |
| A vs. B | TIGIT | A_33_P3342056 |
1.21×10⁻⁹ | 2.12 |
| A vs. B | CXCR6 | A_23_P109913 |
1.21×10⁻⁹ | 2.12 |
| A vs. B | IDO1 | A_23_P112026 |
3.79×10⁻⁵ | 2.10 |
| A vs. B | BTLA | A_33_P3358923 |
3.65×10⁻⁵ | 2.08 |
| A vs. B | TNFRSF17 | A_23_P37736 |
9.64×10⁻³ | 2.08 |
| A vs. B | CD3G | A_23_P98410 |
5.57×10⁻¹⁰ | 2.01 |
| A vs. C | IL6 | A_23_P71037 |
2.36×10⁻⁸ | 6.71 |
| A vs. C | GZMB | A_23_P117602 |
8.93×10⁻¹⁷ | 3.98 |
| B vs. C | IL6 | A_23_P71037 |
1.21×10⁻⁶ | 6.41 |
| B vs. C | TREM1 | A_33_P3319905 |
2.16×10⁻⁹ | 3.29 |
| B vs. C | CCR10 | A_33_P3221303 |
4.72×10⁻⁴ | −1.90 |
Discussion
Regarding the immune checkpoint blockade for
PD-1/PD-L1 in clinical trials, a positive PD-L1 expression, a high
mutation burden, a high microsatellite instability (MSI) status and
a high TIL status are considered to be possible biomarkers for
clinical responder prediction and a good prognosis in a variety of
solid tumors treated with PD-1/PD-L1 inhibitors (11-13).
The novelties about the current approach to
immunological classifications by PD-L1 and CD8B expression are the
following: i) profiling specific immunological marker-positive cell
populations including effector and exhausted T-cells, macrophages,
dendritic cells and NK cells; ii) immune response-associated gene
expression-based immune pathway analysis; and iii) Vogelstein
driver gene expression-based cancer signal pathway analysis.
First, genome-based immune cell characterization
other than IHC or living-cell methods, such as TILs-based surface
marker analysis, is not a widely used method, but few studies on
GEP-based immune cell characterization in tumors have been
published (21). Thus, there is
not much evidence for or against such an approach. However, it is
likely that specific immune cell distribution can be recognized
with the combination of other gene expression data, such as
cytolytic activity, Th1 and Th2 cytokine production and other
immune response-associated genes (22-28).
Second, in this study, the association of TME immune
types with immune or cancer signaling pathways was investigated
based on GEP data of immune response-associated genes or Vogelstein
driver genes. The radar chart demonstrating the association of each
immune type with various pathways was helpful to recognize which
signal pathways were associated with type A (immune activation) and
type C (immune suppression), respectively.
In sum, immune type A was associated with the Th1
T-cell pathway, NK cell activation pathway, dendritic cell
maturation and cancer-apoptosis activation signals, and exhibited
the highest score in immune-activation signaling pathways. On the
other hand, type C exhibited a downregulation of T-cell activation
signaling (with the lowest score) and oncogene signal pathway
activation. These results suggested that types A and C exhibited
opposite characteristics of immune and cancer signal pathways. Our
approach is a novel one; thus, the combination of immune-type
classification and signaling pathway analysis is a better method to
evaluate immunological status prior to specific cancer
immunotherapies.
Furthermore, clinical information regarding survival
time is suggested to be associated with the current immune type
classification. The preliminary observation, demonstrated by Ock
et al (15) using survival
data from TCGA database, revealed that immune subtype I
(PD-L1+CD8+) exhibited a longer overall
survival time compared with subtype III
(PD-L1+CD8−). We are planning a similar
survival analysis in the project HOPE in the near future.
In addition to a high PD-L1 expression and CD8B
upregulation as TIL marker, a high load of somatic mutations
(hypermutation) in the tumor is another crucial possible biomarker
that can predict the good response of immune checkpoint blockade
(29-31). In this study, we divided
hypermutator tumors with >500 SNV numbers into the 4 immune
types (Fig. 8B). Ock et al
demonstrated that the somatic SNV number was significantly higher
in immune type A. Of note, our data indicated that hypermutators
were found mainly in type A (48%) and B (35%), and even some in
type C (16%, PD-L1−CD8B−), but not in type D
(PD-L1−CD8B+). These results suggest that
PD-L1 upregulation is a crucial feature for the induction of a
durable CTL response against cancers and that hypermutators alone
are not sufficient. Additionally, comparing immune
response-associated gene expression between TME immune type A and C
derived from hypermutators revealed the upregulation of specific
genes, such as IL6 and GZMB. These observations may indicate that
the upregulation of these immunological genes mediated by
neoantigen boosting originating from hypermutation can lead to
PD-L1 upregulation, resulting in a potent immune checkpoint
blockade. Of note, the TREM1 gene was associated with PD-L1
expression in the absence of CD8B expression between types B and C,
which suggests activated macrophage-mediated PD-L1 induction.
Prat et al analyzed FFPE-derived tumor RNA on
the nCounter system using the PanCancer 730-Immune Panel and
identified 23 immune-related genes or signatures linked to
antitumor-response by immune checkpoint blockade and
progression-free survival (32).
These 23 immune-related genes included PD-1, PD-L1 and other genes
associated with CD8 and CD4 T-cell activation, NK cells and IFN-γ
activation.
This study demonstrated that immune type A was
associated with the Th1 T-cell pathway, NK cell activation pathway,
DC maturation and cancer-apoptosis activation signaling, which
indicated that such results are associated with immune
response-activating characteristic, leading to an antitumor
effect.
Finally, our approach, based on comprehensive immune
response-associated gene expression data from the HOPE project, may
be very informative and helpful to the evaluation of immunological
status before immunotherapy and the prediction of antitumor
response after immunotherapy. In the future, studies should
strengthen their evidence levels by adding updated data from a
multiomics approach, specifically immunohistochemistry and clinical
survival information.
Acknowledgments
The authors would like to thank the staff at the
Shizuoka Cancer Center Hospital for their clinical support and
sample preparation.
Abbreviations:
|
PD-1
|
programmed death-1
|
|
PD-L1
|
programmed death-ligand 1
|
|
MSI
|
microsatellite instability
|
|
CTL
|
cytotoxic T lymphocyte
|
|
DC
|
dendritic cell
|
|
WES
|
whole-exome sequencing
|
|
GEP
|
gene expression profiling
|
|
SNV
|
single nucleotide variant
|
Funding
No funding was received.
Availability of data and materials
All data generated or analyzed during this study are
included in this published article. As the project HOPE is in
progress, and not yet completed, sequencing and expression data
have not been deposited in a public database. However, the authors
declare that all the other data supporting the findings of this
study can be available from the corresponding author upon
reasonable request.
Authors' contributions
YA designed the study, drafted the manuscript, and
was responsible for completing the study. RK performed a
bioinformatics analysis of immune response-associated gene data
derived from a large of number cancer patients. AI, CN and HM
supported the bioinformatics analysis by organizing and editing
data. TN, KO and KU performed the storage and organization of
sequencing or gene expression data obtained by WES and GEP and
responsible for bioinformatics analysis of whole data. TA, KY and
MK supported and provided advice as regards the conception and
design of the present study. All authors have read and approved the
final draft.
Ethics approval and consent to
participate
The Shizuoka Cancer Center launched project HOPE
based on the multiomics analyses including WES and GEP. Ethical
approval for the HOPE study was obtained from the Institutional
Review Board at the Shizuoka Cancer Center (Authorization no.
25-33). Written informed consent was obtained from all patients
enrolled in the study.
Patient consent for publication
Not applicable.
Competing interests
The authors declare that they have no competing
interests.
References
|
1
|
Weber JS, O'Day S, Urba W, Powderly J,
Nichol G, Yellin M, Snively J and Hersh E: Phase I/II study of
ipilimumab for patients with metastatic melanoma. J Clin Oncol.
26:5950–5956. 2008. View Article : Google Scholar : PubMed/NCBI
|
|
2
|
Hodi FS, O'Day SJ, McDermott DF, Weber RW,
Sosman JA, Haanen JB, Gonzalez R, Robert C, Schadendorf D, Hassel
JC, et al: Improved survival with ipilimumab in patients with
metastatic melanoma. N Engl J Med. 363:711–723. 2010. View Article : Google Scholar : PubMed/NCBI
|
|
3
|
Topalian SL, Hodi FS, Brahmer JR,
Gettinger SN, Smith DC, McDermott DF, Powderly JD, Carvajal RD,
Sosman JA, Atkins MB, et al: Safety, activity, and immune
correlates of anti-PD-1 antibody in cancer. N Engl J Med.
366:2443–2454. 2012. View Article : Google Scholar : PubMed/NCBI
|
|
4
|
Brahmer JR, Tykodi SS, Chow LQ, Hwu WJ,
Topalian SL, Hwu P, Drake CG, Camacho LH, Kauh J, Odunsi K, et al:
Safety and activity of anti-PD-L1 antibody in patients with
advanced cancer. N Engl J Med. 366:2455–2465. 2012. View Article : Google Scholar : PubMed/NCBI
|
|
5
|
Wolchok JD, Kluger H, Callahan MK, Postow
MA, Rizvi NA, Lesokhin AM, Segal NH, Ariyan CE, Gordon RA, Reed K,
et al: Nivolumab plus ipilimumab in advanced melanoma. N Engl J
Med. 369:122–133. 2013. View Article : Google Scholar : PubMed/NCBI
|
|
6
|
Couzin-Frankel J: Breakthrough of the year
2013. Cancer immunotherapy. Science. 342:1432–1433. 2013.
View Article : Google Scholar : PubMed/NCBI
|
|
7
|
Snyder A, Makarov V, Merghoub T, Yuan J,
Zaretsky JM, Desrichard A, Walsh LA, Postow MA, Wong P, Ho TS, et
al: Genetic basis for clinical response to CTLA-4 blockade in
melanoma. N Engl J Med. 371:2189–2199. 2014. View Article : Google Scholar : PubMed/NCBI
|
|
8
|
Garon EB, Rizvi NA, Hui R, Leighl N,
Balmanoukian AS, Eder JP, Patnaik A, Aggarwal C, Gubens M, Horn L,
et al KEYNOTE-001 Investigators: Pembrolizumab for the treatment of
non-small-cell lung cancer. N Engl J Med. 372:2018–2028. 2015.
View Article : Google Scholar : PubMed/NCBI
|
|
9
|
Reck M, Rodríguez-Abreu D, Robinson AG,
Hui R, Csőszi T, Fülöp A, Gottfried M, Peled N, Tafreshi A, Cuffe
S, et al KEYNOTE-024 Investigators: Pembrolizumab versus
chemotherapy for PD-L1-positive non-small-cell lung cancer. N Engl
J Med. 375:1823–1833. 2016. View Article : Google Scholar : PubMed/NCBI
|
|
10
|
Le DT, Durham JN, Smith KN, Wang H,
Bartlett BR, Aulakh LK, Lu S, Kemberling H, Wilt C, Luber BS, et
al: Mismatch repair deficiency predicts response of solid tumors to
PD-1 blockade. Science. 357:409–413. 2017. View Article : Google Scholar : PubMed/NCBI
|
|
11
|
Dahlin AM, Henriksson ML, Van Guelpen B,
Stenling R, Öberg A, Rutegård J and Palmqvist R: Colorectal cancer
prognosis depends on T-cell infiltration and molecular
characteristics of the tumor. Mod Pathol. 24:671–682. 2011.
View Article : Google Scholar : PubMed/NCBI
|
|
12
|
Llosa NJ, Cruise M, Tam A, Wicks EC,
Hechenbleikner EM, Taube JM, Blosser RL, Fan H, Wang H, Luber BS,
et al: The vigorous immune microenvironment of microsatellite
instable colon cancer is balanced by multiple counter-inhibitory
checkpoints. Cancer Discov. 5:43–51. 2015. View Article : Google Scholar :
|
|
13
|
Schalper KA, Brown J, Carvajal-Hausdorf D,
McLaughlin J, Velcheti V, Syrigos KN, Herbst RS and Rimm DL:
Objective measurement and clinical significance of TILs in
non-small cell lung cancer. J Natl Cancer Inst. 107:dju4352015.
View Article : Google Scholar : PubMed/NCBI
|
|
14
|
Rooney MS, Shukla SA, Wu CJ, Getz G and
Hacohen N: Molecular and genetic properties of tumors associated
with local immune cytolytic activity. Cell. 160:48–61. 2015.
View Article : Google Scholar : PubMed/NCBI
|
|
15
|
Ock CY, Keam B, Kim S, Lee JS, Kim M, Kim
TM, Jeon YK, Kim DW, Chung DH and Heo DS: Pan-cancer immunogenic
perspective on the tumor microenvironment based on PD-L1 and CD8
T-cell infiltration. Clin Cancer Res. 22:2261–2270. 2016.
View Article : Google Scholar : PubMed/NCBI
|
|
16
|
Yamaguchi K, Urakami K, Nagashima T,
Shimoda Y, Ohnami S, Ohnami S, Ohshima K, Mochizuki T, Hatakeyama
K, Serizawa M, et al: Prevalence of low-penetrant germline TP53
D49H mutation in Japanese cancer patients. Biomed Res. 37:259–264.
2016. View Article : Google Scholar : PubMed/NCBI
|
|
17
|
Ohshima K, Hatakeyama K, Nagashima T,
Watanabe Y, Kanto K, Doi Y, Ide T, Shimoda Y, Tanabe T, Ohnami S,
et al: Integrated analysis of gene expression and copy number
identified potential cancer driver genes with
amplification-dependent overexpression in 1,454 solid tumors. Sci
Rep. 7:6412017. View Article : Google Scholar : PubMed/NCBI
|
|
18
|
Akiyama Y, Kondou R, Iizuka A, Ohshima K,
Urakami K, Nagashima T, Shimoda Y, Tanabe T, Ohnami S, Ohnami S, et
al: Immune response-associated gene analysis of 1,000 cancer
patients using whole-exome sequencing and gene expression
profiling-Project HOPE. Biomed Res. 37:233–242. 2016. View Article : Google Scholar : PubMed/NCBI
|
|
19
|
Brazma A, Hingamp P, Quackenbush J,
Sherlock G, Spellman P, Stoeckert C, Aach J, Ansorge W, Ball CA,
Causton HC, et al: Minimum information about a microarray
experiment (MIAME)-toward standards for microarray data. Nat Genet.
29:365–371. 2001. View Article : Google Scholar : PubMed/NCBI
|
|
20
|
Vogelstein B, Papadopoulos N, Velculescu
VE, Zhou S, Diaz LA Jr and Kinzler KW: Cancer genome landscapes.
Science. 339:1546–1558. 2013. View Article : Google Scholar : PubMed/NCBI
|
|
21
|
Papalexi E and Satija R: Single-cell RNA
sequencing to explore immune cell heterogeneity. Nat Rev Immunol.
18:35–45. 2018. View Article : Google Scholar
|
|
22
|
Teng MW, Ngiow SF, Ribas A and Smyth MJ:
Classifying cancers based on T-cell infiltration and PD-L1. Cancer
Res. 75:2139–2145. 2015. View Article : Google Scholar : PubMed/NCBI
|
|
23
|
Tosolini M, Kirilovsky A, Mlecnik B,
Fredriksen T, Mauger S, Bindea G, Berger A, Bruneval P, Fridman WH,
Pagès F, et al: Clinical impact of different classes of
infiltrating T cytotoxic and helper cells (Th1, th2, treg, th17) in
patients with colorectal cancer. Cancer Res. 71:1263–1271. 2011.
View Article : Google Scholar : PubMed/NCBI
|
|
24
|
Ascierto RA, Capone M, Urba WJ, Bifuco CB,
Botti G, Lugli A, Marincola FM, Ciliberto G, Galon J and Fox BA:
The additional facet of immunoscore: immunoprofiling as a possible
predictive tool for cancer treatment. J Transl Med. 11:542913.
View Article : Google Scholar
|
|
25
|
Lee HJ, Lee JJ, Song IH, Park IA, Kang J,
Yu JH, Ahn JH and Gong G: Prognostic and predictive value of
NanoString-based immune-related gene signatures in a neoadjuvant
setting of triple-negative breast cancer: Relationship to
tumor-infiltrating lymphocytes. Breast Cancer Res Treat.
151:619–627. 2015. View Article : Google Scholar : PubMed/NCBI
|
|
26
|
Gnjatic S, Bronte V, Brunet LR, Butler MO,
Disis ML, Galon J, Hakansson LG, Hanks BA, Karanikas V, Khleif SN,
et al: Identifying baseline immune-related biomarkers to predict
clinical outcome of immunotherapy. J Immunother Cancer. 5:442017.
View Article : Google Scholar : PubMed/NCBI
|
|
27
|
Ayers M, Lunceford J, Nebozhyn M, Murphy
E, Loboda A, Kaufman DR, Albright A, Cheng JD, Kang SP, Shankaran
V, et al: IFN-γ-related mRNA profile predicts clinical response to
PD-1 blockade. J Clin Invest. 127:2930–2940. 2017. View Article : Google Scholar : PubMed/NCBI
|
|
28
|
Stroncek DF, Butterfield LH, Cannarile MA,
Dhodapkar MV, Greten TF, Grivel JC, Kaufman DR, Kong HH, Korangy F,
Lee PP, et al: Systematic evaluation of immune regulation and
modulation. J Immunother Cancer. 5:212017. View Article : Google Scholar : PubMed/NCBI
|
|
29
|
Johnson DB, Frampton GM, Rioth MJ, Yusko
E, Xu Y, Guo X, Ennis RC, Fabrizio D, Chalmers ZR, Greenbowe J, et
al: Targeted next generation sequencing identifies markers of
response to PD-1 blockade. Cancer Immunol Res. 4:959–967. 2016.
View Article : Google Scholar : PubMed/NCBI
|
|
30
|
Dudley JC, Lin MT, Le DT and Eshleman JR:
Microsatellite instability as a biomarker for PD-1 blockade. Clin
Cancer Res. 22:813–820. 2016. View Article : Google Scholar : PubMed/NCBI
|
|
31
|
Gong J, Wang C, Lee PP, Chu P and Fakih M:
Response to PD-1 blockade in microsatellite stable metastatic
colorectal cancer harboring a POLE mutation. J Natl Compr Canc
Netw. 15:142–147. 2017. View Article : Google Scholar : PubMed/NCBI
|
|
32
|
Prat A, Navarro A, Paré L, Reguart N,
Galván P, Pascual T, Martínez A, Nuciforo P, Comerma L, Alos L, et
al: Immune-related gene expression profiling after PD-1 blockade in
non-small cell lung carcinoma, head and neck squamous cell
carcinoma, and melanoma. Cancer Res. 77:3540–3550. 2017. View Article : Google Scholar : PubMed/NCBI
|