Introduction
Multiple sclerosis (MS) is an autoimmune
inflammatory disease of the central nervous system. The
demyelination process is characterized by an inter-, not an
intra-individual, heterogeneity. Four distinct patterns of focal
demyelination have been identified histologically in biopsy and
autopsy materials. Neuromyelitis optica (NMO) is an idiopathic
inflammatory demyelinating disease of the central nervous system,
affecting predominantly the optic nerves and the spinal cord
(1). NMO is a severe monophasic
syndrome characterized by bilateral optic neuritis and myelitis
occurring in rapid succession. Serum NMO-immunoglobulin G (IgG) has
been investigated, and its presence is highly specific for NMO
(2,3). However, NMO-IgG is not detectable in
all patients. Therefore, NMO diagnosis is generally based on a
combination of clinical, neuroimaging, laboratory and pathological
findings (4,5).
Although both MS and NMO are demyelinating diseases
of the central nervous system, they differ in a variety of ways,
such as in pathogenesis, pathology, clinical features and treatment
options. Cerebrospinal fluid (CSF) proteomics is a well-accepted
powerful technique to monitor protein expression in CSF. Abnormal
CSF findings are one of the characteristics of NMO or MS, and may
provide important information to decipher NMO mechanisms or MS
pathogenesis. In the present study, the differences in the CSF
protein of an MS group, an NMO group and a normal control group of
individuals were compared using 2D gels. The aim of the study was
to find significant potential protein disease markers and to
discover disease pathogenesis. Understanding the expression and
functions of these disease-related proteins may enable us to
identify them as possible biomarkers to aid in the diagnosis of NMO
and, possibly, in its treatment and prognosis as well.
Materials and methods
Participants and preparation
The selected patients matched the 2005 version of
the McDonald diagnostic criteria for MS. The patients were all in
the recurrent-remitting (R-R) acute period with the following
characteristics: male/female (2/4), age 18–45 years (mean
28.7±9.6). The patients in the NMO group matched the Wingerchuk
diagnostic criteria for NMO with the following characteristics:
male/female (3/3), age 21–39 years (mean 27.2±8.4). The control
group consisted of healthy subjects with the following
characteristics: male/female (3/3), age 19–35 years (mean
25.2±6.2). The subjects in the control group did not suffer from
any specific previous disorders and their neurological examinations
showed no pathological signs. The study was approved by the ethics
committee of the Second Affiliated Hospital, School of Medicine,
Zhejiang University.
With the consent of the volunteers, CSF samples were
collected by lumbar puncture. Following the routine clinical tests
for CSF, the remaining samples were placed in sterile centrifuge
tubes and centrifuged for 15 min at a speed of 2,000 rpm. Following
centrifugation, the supernatant fluid was preserved and distributed
in sterile EP tubes. The EP tubes were then placed in a
refrigerator at −80°C for later use. The lumbar puncture procedure
was performed at normal pressure. The results of the routine CSF
and biochemical tests are shown in Table I.
 | Table IComparison of the CSF tests. |
Table I
Comparison of the CSF tests.
| MS | NMO | Control |
|---|
| Gender (M/F) | 2/4 | 3/3 | 3/3 |
| Age (years) | 28.7±9.6 | 27.2±8.4 | 25.2±6.2 |
| Pressure (mmHg) | 156.7±19.4 | 148.6±23.5 | 129.3±12.8 |
| Leukocyte (l) | 20.2±8.6 | 18.4±6.4 | 1.2±0.8 |
| Protein (mg/l) | 457.9±42.2 | 359.4±32.1 | 355.7±30.9 |
| Chloride
(mmol/l) | 129.1±33.5 | 124.4±29.7 | 125.4±21.5 |
| Glucose (mmol/l) | 3.6±2.1 | 4.1±2.9 | 3.0±1.5 |
Protein purification
The CSF samples were mixed and distributed in Amicon
Ultra-15 centrifugal ultra-filtration tubes. A high-speed
low-temperature centrifuge was placed at a fixed angle of 35°. The
centrifugation lasted for 45 min at 4°C and 5,000 × g. Then, the
concentrate (~200 μl) was collected.
Following the ProteoExtract Albumin/IgG Removal kit
affinity chromatography instructions, the original retained
buffering solution of the chromatograph was removed. The
chromatograph was washed with 0.7 ml specific buffering solution.
The buffering solution descended through the resin by gravity. The
diluted CSF was added to the chromatography column. The
cerebrospinal fluid was allowed to descend through the resin bed by
gravity, and the eluate was saved.
2D electrophoresis
The first phase of the isoelectric focusing
electrophoresis was conducted using the IPGphor IEF System. The
protein was centrifuged for 2 min before the sample was loaded.
Then, 100 μg of the sample was loaded and resolved with a
rehydration solution containing 8 M urea, 0.02% CHAPS, 0.02 M DTT
and 0.05% IPG buffering solution. Approximately 800 μl of covering
fluid was added. The focused strip was balanced twice on the SDS
balance solution (1.5 M tris-Cl, pH 8.8, 50 mM, 30% Glycerol, 6 M
urea, 2% SDS and Bromophenol blue trace) and then shaken twice on
the oscillation bed for 15 min. MDTT (20 mM) was added to the first
balance solution, whereas 100 mM of iodoacetamide was added to the
second balance solution. The strip was then moved to the PROTEAN II
xi Cell to be processed in the vertical SDS-PAGE for the second
phase. A 13% polyacrylamide gel separator was used with a constant
current of 40 mA for 40 min and 60 mA for 5 h. The process
continued until the front of the bromophenol blue reached the
bottom of the glass. This electrophoresis procedure was repeated
three times for each group of samples (Table II).
| Table IISilver staining. |
Table II
Silver staining.
| Steps | Time (min) |
|---|
| 1. Stationary
liquid | 30 |
| 2. Sensitizer | 30 |
| 3. Washing | 3×5 |
| 4. Silver
reaction | 20 |
| 5. Washing | 2×1 |
| 6. Staining | 2–5 |
| 7. Terminator | 10 |
Scanning and image analysis
The gel was scanned by an image scanner and the
images were saved in TIFF format. The scanned images were analyzed
using the ImageMaster 2D Platinum5.0 software. The test parameters,
particularly the smoothness optimization parameters, were set to
detect all the real protein spots and to split the overlapping
protein spots. By adjusting the saliency and minimum area values,
the noise interference was filtered. Thus, automatic detection
(spot detection) was completed and quantified and the background
was removed. The manual use of the spot-marking method enables the
increase or removal of the number of spots, and copies and splits
the spots, thus gaining access to the protein spot detection map.
In the present study, the molecular weight (MW) values of the
protein spots were obtained by marking the marker protein and its
pH value. Finally, a reference gel (refelenee gel) was selected for
comparison to other gels and a gel analysis report was generated.
The total volume percentage of one specific spot to the gel was
computed, and the differences in protein spots were compared using
statistical analysis (between group t-tests). Finally, the protein
spots were differentiated from the standard to determine whether
the analytical difference was significant and whether the volume
percentage was twice as large.
Preparation of mass spectrometry
sample
The tips of 200 μl yellow pipettors were cut into
appropriate sizes (preferably of the same size) and immersed in
washing lotion for 1 day. Distilled water and re-distilled water
were used to immerse them sequentially, and they were then
processed with ultrasonic waves. The gel samples were washed
thoroughly with re-distilled water and baked to dry. The protein of
interest was extracted from the gel with the cut gun tips or cut
with a 1.5-mm gel pen and placed in EP tubes or 96-hole boards. The
corresponding numbers of the spots and their positions were
recorded.
The gel was washed twice with 50 μl DDW for 10 min
each time. Up to 50 μl acetonitrile was added to dehydrate the gel
until it turned completely white. The mixture was pumped into a
vacuum for 5 min. Then, 20 μl of 10 mM DTT (prepared with 10 μl 1 M
DTT, 990 μl 25 mM NH4HCO3) was added. The
mixture was bathed in 56°C water for 1 h. After cooling to room
temperature, the gel was dried and 20 μl of 55 mM IAA (prepared
with 55 μl 1 M IAA, 945 μl 25 mM NH4HCO3) was
quickly added. The mixture was kept in a dark room for 45 min. The
gel particles were subsequently washed with 25 mM
NH4HCO3, 25 mM NH4HCO3
and 50% acetonitrile solution, and then dehydrated with
acetonitrile until the mixture turned completely white. Then, it
was pumped through a vacuum for 5 min to dry. The 0.l-μg/l stock
trypsin solution was diluted 10 times with 25 mM
NH4HCO3, and 2 μl of the dilution was added
to each EP tube. Short-term centrifugation was carried out to make
sure the gel particles were fully mixed with the enzyme. The EP
tubes were kept in a 4°C environment or placed on ice for 30 min
until the solution became completely absorbed by gel particles.
Subsequently, 25 mM NH4HCO3 were added to
each tube for a total volume of 10–15 μl. The tubes were stored at
37°C to be digested overnight. The next day, 2% TFA was added to
each tube to stop the reaction. The final TFA concentration was
maintained at 0.1%. The mixture was then shaken and
centrifuged.
HD-MS/MS analysis
Following digestion, the enzyme hydrolyzate sample
was loaded onto a 300-hole 1-μl volume stainless steel model. The
same sample loading procedure was repeated two more times after the
first sample spots became dry. Then, 1 μl of substance (CHCA) was
added. Approximately 1.1 μl of the calibration mixture was added in
the middle of the substance for calibration purposes while loading
the sample around it. The peak of the trypsin self-hydrolyzate was
used as internal calibration. The model was left at room
temperature to dry. It was then sent to the Beijing Military
Medical Sciences Mass Spectrometry Laboratory for HD-MS/MS analysis
using the Synapt HDMS produced by Waters Micromass Corporation.
Database search
The search was performed using MASCOT software which
may be found by logging into the Protein database via the internet
website (http://www.matrix-science.co.uk).
Preliminary analysis of protein
spots
The features of the proteins were searched and
identified from the internet protein search site (http://www.expasy.ch/swiss-2dpage/viewer) according to
their characteristics, such as their isoelectric point and relative
molecular mass, which were obtained through the gel analysis
report. They were then compared to the 2D-PAGE reference map of the
CSF from the SWISS-2DPAGE database. The preliminary analysis of
these proteins was performed in accordance with relevant literature
on this subject.
Results
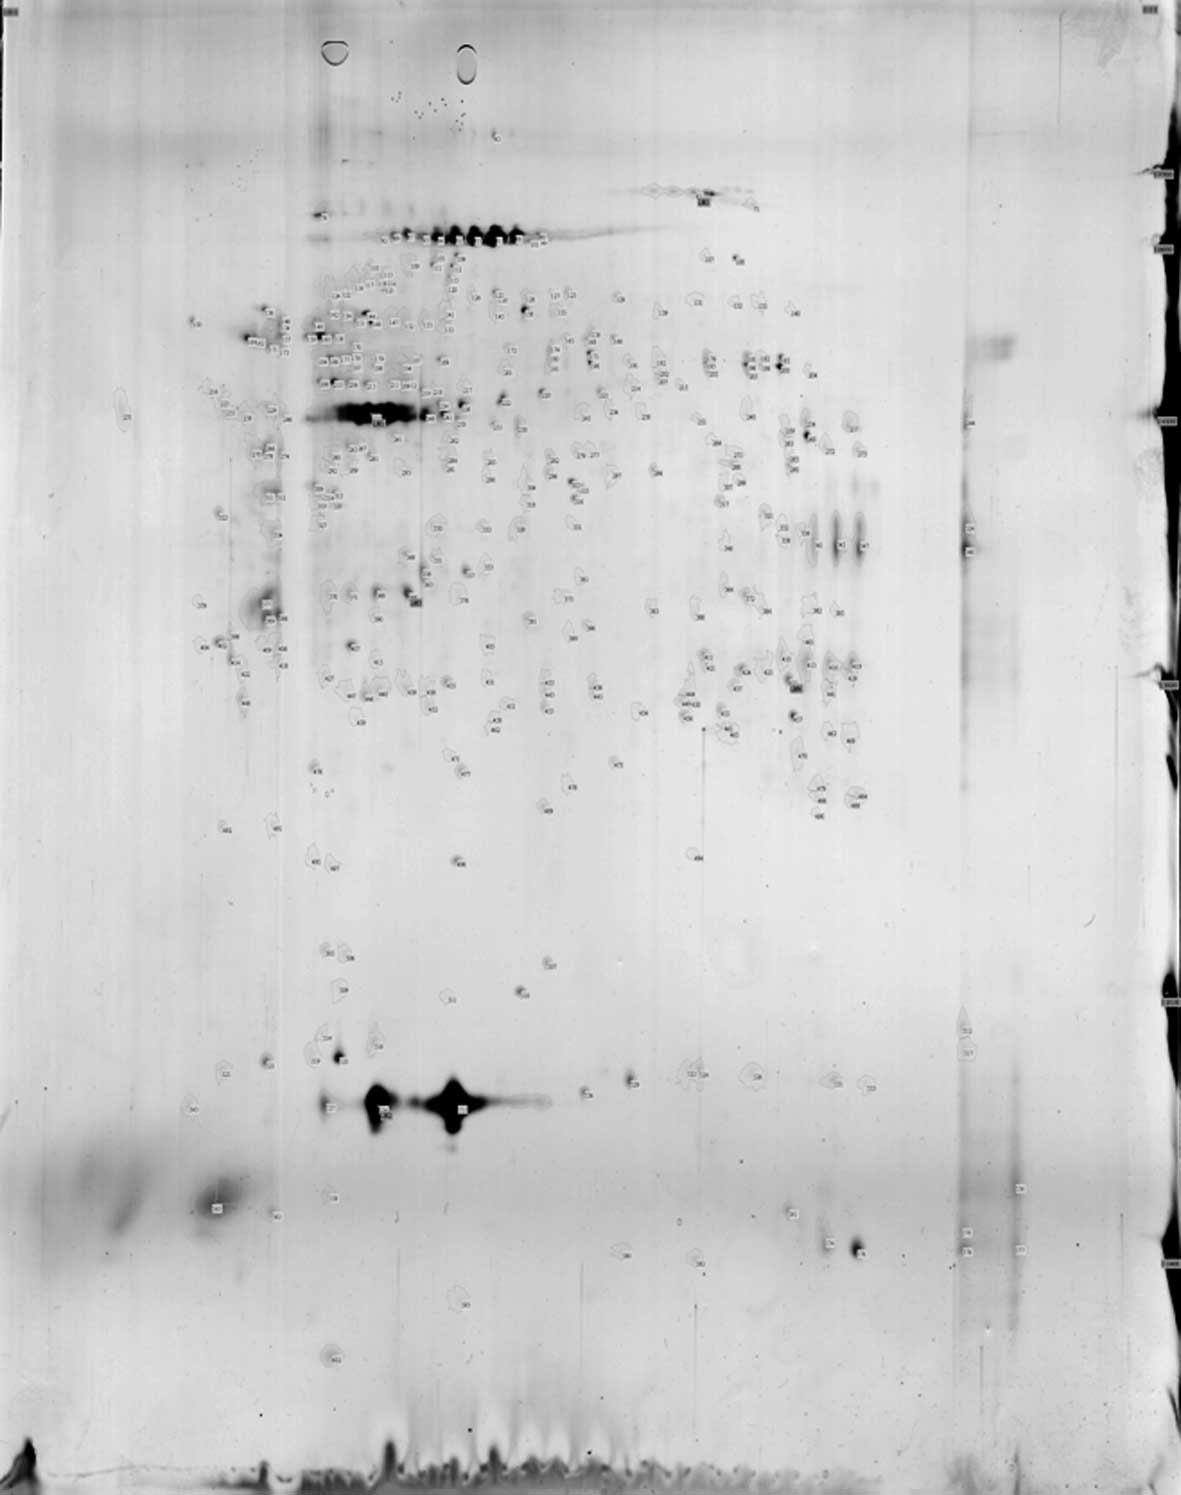
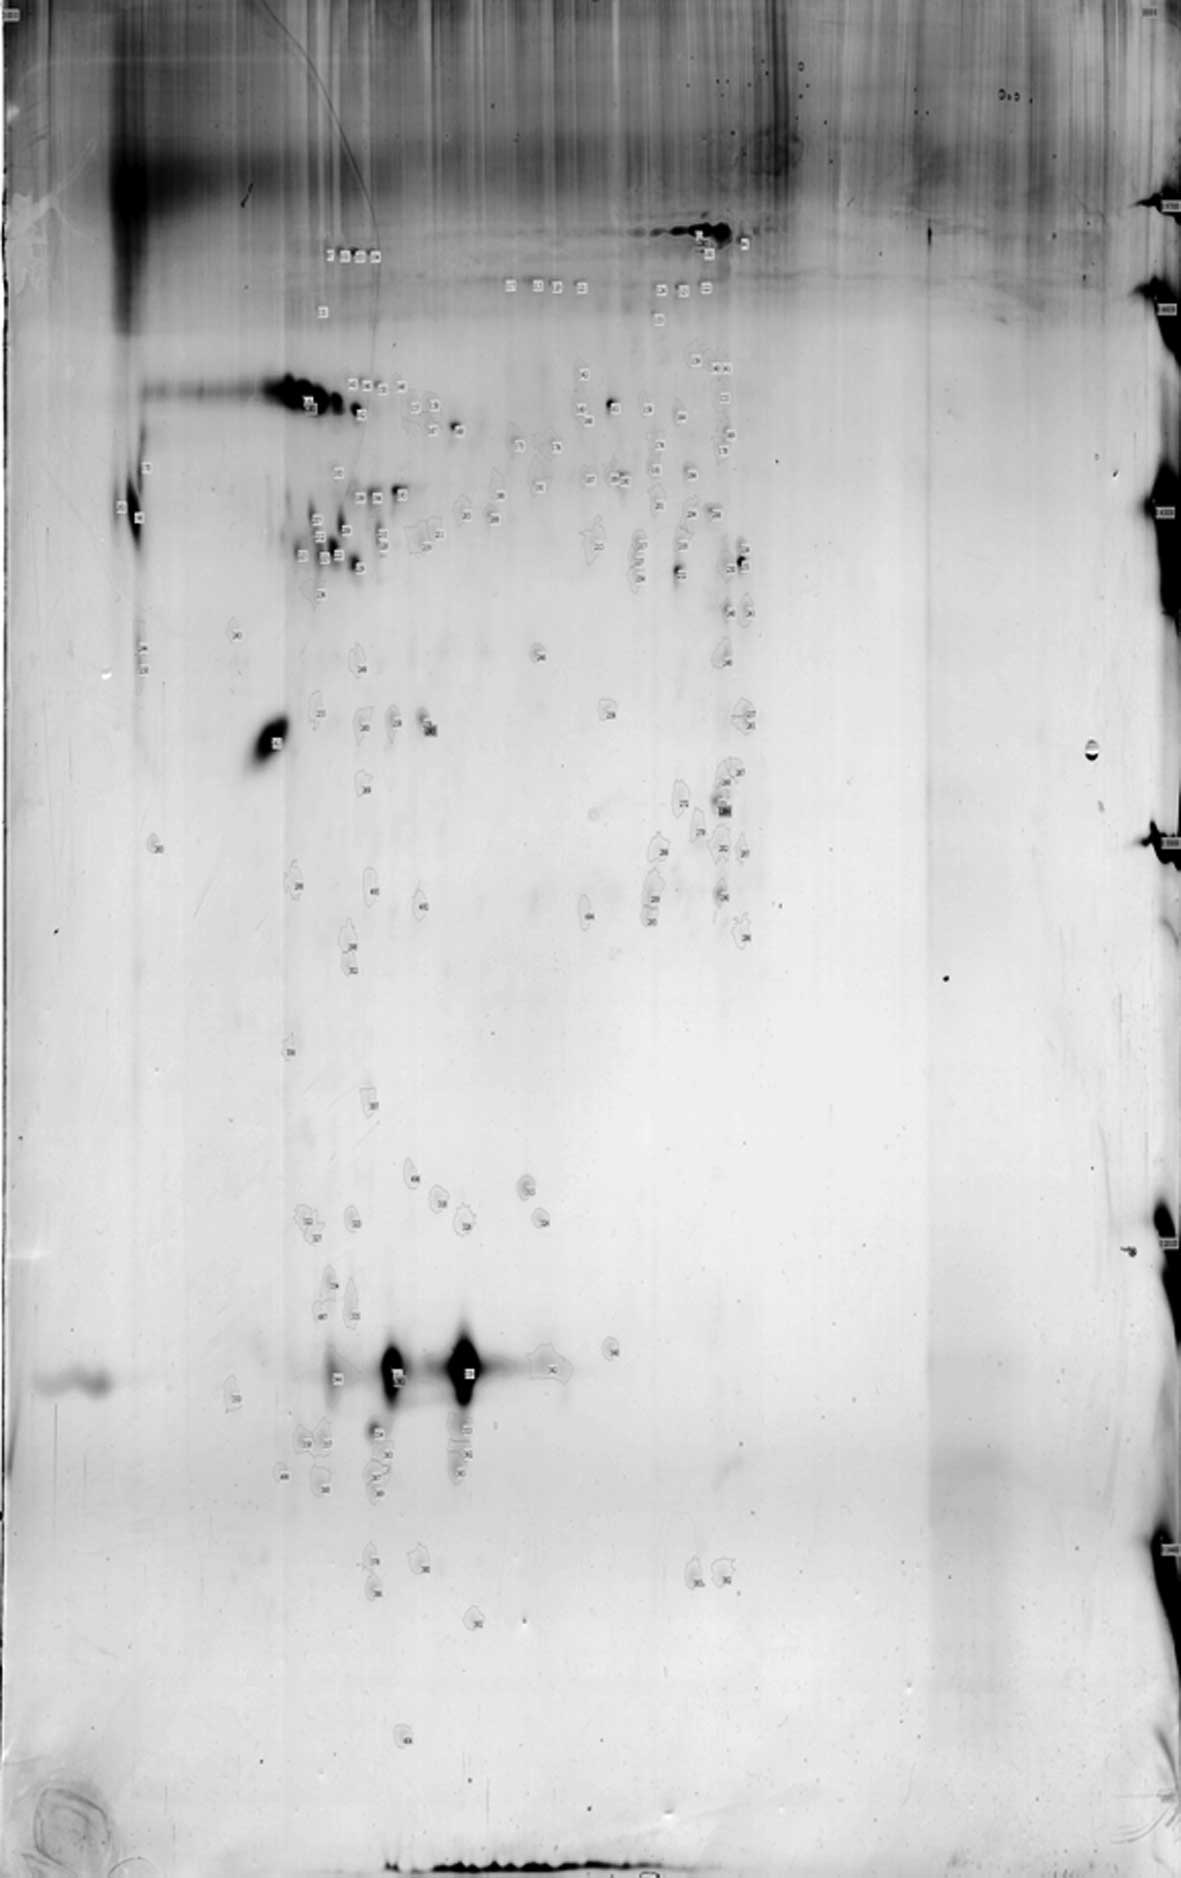
In the CSF 2D gel electrophoresis map, 118 points
were obtained from the MS group, 155 points were obtained from the
NMO group and 350 points were obtained from the normal control
group (Figs. 1–3).
Comparing the CSF 2D gel electrophoresis pattern of
the MS group and the control group, 51 matching protein spots were
found. Among these matching spots, the MS group had 38 upregulated
proteins, whereas the normal group had 24. Twenty-four spots had an
upregulating difference of >2 times. On the other hand, 13
protein spots were downregulated. The number of non-matching
protein spots was 67 for the MS group and 299 for the normal
control group.
Comparing the CSF 2D gel electrophoresis pattern of
the NMO and the control group, 82 matching protein spots were
found. Among these matching spots, the NMO group had 64 upregulated
proteins compared to the normal group, and 41 spots had >2
upregulated differences. On the other hand, 18 protein spots were
downregulated. The non-matching protein spots were 73 for the NMO
group, while for the normal control group they were 268.
There were 45 CSF protein spots expressed in the
control group, but not in the NMO group and the MS group.
Conversely, 14 CSF protein spots were expressed in the control and
the MS groups, but not in the NMO group.
By HD-MS/MS analysis and MASCOT web search, three
differential proteins were identified, i.e., pre-albumin (PA),
keratin 1 and keratin 9, and transferrin (Tf). PA was only found in
the CSF 2D gel electrophoresis map of the MS patients. Keratin 1
was expressed in the normal control group, but not in the MS group.
The difference in the expression of keratin 9 in the MS group was
two times higher than that of the normal control group. The
expression of keratin 1, keratin 9 and Tf in the NMO group was two
times higher than that of the normal control group. The expression
of PA was found in the CSF 2D gel electrophoresis map of the MS
patients, but not in the NMO group. Keratin 1 was expressed in the
NMO group, but not in the MS group (Tables III–V).
| Table IIIDifferences of CSF in protein spectrum
analysis of the MS and control groups. |
Table III
Differences of CSF in protein spectrum
analysis of the MS and control groups.
| Spot | Protein name | Accession no. | Experimental
mass/pI | MASCOT score |
|---|
| MS511 | Pre-albumin | gi|219978 | 15909/5.52 | 144 |
| Control191 | Keratin 1 | gi|7331218 | 65978/8.16 | 184 |
| MS493 | Cytokeratin 9 | gi|435476 | 62092/5.19 | 149 |
| Table VDifferences of CSF in protein spectrum
analysis of the MS and NMO groups. |
Table V
Differences of CSF in protein spectrum
analysis of the MS and NMO groups.
| Spot | Protein name | Accession no. | Experimental
mass/pI | MASCOT score |
|---|
| MS511 | Pre-albumin | gi|219978 | 15909/5.52 | 144 |
| NMO161 | Keratin 1 | gi|7331218 | 65978/8.16 | 106 |
Discussion
Numerous studies confirm that changes in the
composition of CSF are closely related to the demyelinating
diseases of the central nervous system. Thus, CSF is highly
suitable material for proteomic analysis of central nervous system
demyelinating diseases. However, the concentration of protein in
CSF is extremely low, and albumin and IgG comprise 99%, making the
abundance of specific disease-related proteins very low. Thus, the
highly-abundant proteins have to be removed before conducting 2D
electrophoresis. In the present study, ProteoExtract Albumin/IgG
Removal kit affinity chromatography was used to remove the highly
abundant proteins. An accurate 2D gel electrophoresis map was
obtained for further analysis.
Although the use of the proteomic analysis method to
study CSF remains in the trial stage, studies that apply this
method to MS patients have increased in recent years. Noben et
al adopted the LC-ESI-MS/MS technique to compare the proteome
differences of CSF in MS and non-MS groups (6). They identified a total of 148
proteins as follows: 80 co-expression proteins from the two groups,
24 proteins that were not expressed in the MS group and 44 for the
non-MS group. Ottervald et al used the 2D gel
electrophoresis tandem mass spectrometry technique to analyze CSF
samples of MS patients and controls, and found that three proteins
act as potential MS marking proteins: α1 anti-chymotrypsin,
α1-macroglobulin and angiotensinogen (7). Tumani et al used 2D
differential gel electrophoresis and matrix-assisted laser
desorption flight mass spectrometry techniques to compare CSF
samples of confirmed MS patients and patients with suspected nerve
inhibition. Using enzyme-linked immunosorbent assay, they found
that the level of serine peptidase inhibiting protein in the CSF of
MS patients increased, whereas the amounts of α-B-glycoprotein,
fetuin A, serum apolipoprotein A4, haptoglobin, transferrin,
ultra-oxidants superoxide dismutase I, retinol-binding protein,
human zinc-α-2-glycoprotein and eight others decreased. However,
more explicit evidence on how the pathophysiology of these proteins
is linked to clinical diagnosis is necessary. Although many related
studies are currently being conducted, due to the differences in
experimental methods, purposes and subjects, as well as the
complexity of proteomic analysis, current proteomic studies remain
in their infancy. Furthermore, different studies often fail to give
unanimous results; thus, further research is required.
CSF proteomics studies on NMO patients are
relatively fewer. One relevant study is that of Bai et
al(8) from the Medicine
Biochemistry and Molecular Biology Institute of Shandong
University, who analyzed CSF 2D electrophoresis maps and
matrix-assisted laser desorption ionization-flight time mass
spectrometry (MALDI-TOF-MS/MS) of NMO patients, and found that
their CSF had four upregulated and seven downregulated
proteins.
In the present study we developed the CSF 2D gel
electrophoresis maps of MS patients, NMO patients and normal
controls. We obtained further related protein information through
image analysis. We noted and identified four proteins that have
significant differences, i.e., PA, keratin 1, Tf and keratin 9. The
keratin 9 expression in the MS group was eight times higher than
that in the control group. PA was highly expressed only in the CSF
2D gel electrophoresis maps of MS patients and did not express in
the control group. Keratin 1 was expressed in the normal control
group, but not in the MS group. The expression of Tf, keratin 9 and
keratin 1 proteins in the NMO group was four, eight and seven times
higher than that of the normal control group, respectively. PA was
highly expressed in the MS group, but not in the NMO group. Keratin
1 was highly expressed in the NMO group, but not in the MS
group.
PA is a carrier protein in the synthesis of liver
cells. It is a stable tetramer which consists of four identical
subunits. Each subunit consists of 127 amino acid residues and
important biological activity. They participate in plasma thyroid
hormone transportation and vitamin A transportation in the blood
circulation. PA derives its name from its electrophoretic mobility,
which is greater than that of albumin, thus reaching its location
prior to albumin. It is also known as thyroid-binding PA or vitamin
A transport protein. PA can be detected in fetal blood at 11.5
weeks of pregnancy. It has a radioactive half-life period of 1.9
days and is classified under the fast-transporter proteins. PA may
be affected by estrogen and it has an impact on the activity of the
thymus hormone. It also increases immunity by inducing the
maturation of lymphocytes. Under stressed conditions and defective
energy metabolism, PA concentration declines rapidly. Hence, it is
a negative acute-phase protein (9). PA includes one of the water-soluble
proteins of the brain tissue. The ratios of PA in gray and in white
matter are 1.9 and 1.1%, respectively. PA in CSF form comes
primarily from the brain tissue and a small part from plasma
infiltration (10). The main
source of brain PA is the choroid. Whether the high expression of
PA in the CSF of patients with MS is associated with the
pathogenesis of MS and how the association is developed require
further exploration.
Tf includes blood (serum) Tf (serotransferrin, STf;
derived from the serum of vertebrates), egg (ovalbumin) Tf
(ovotransferrin, OTf; derived from bird egg and serum) and milk
(whey) transferrin, which is also known as lactoferrin
(lactotransferrin, LTf; derived from mammalian milk and other
secretions). Tf is an important β-globulin and acts as iron
transporter for the vertebrates. It is also an essential component
of vertebrate humoral and cells. Tf is a single chain glycosylated
protein which consists of approximately 6% glycosylation and two
highly homologous structural domains at the N-terminal and
C-terminal. The main physiological function of Tf is to transport
iron from the place it is absorbed and to store it in the
erythrocyte for the synthesis of hemoglobin (11). Tf regulates iron balance and energy
balance. In ion exchange kinetics, Tf not only changes the quality
of materials, but also converts their energies. In addition, Tf is
the key factor in the vertebrate respiratory chain (or respiratory
network) that directly participates in iron transport and
metabolism. The iron ions transported by Tf are delivered into the
erythrocyte to be used in the synthesis of hemoglobin and play an
important role in blood circulation. Tf is also involved in cell
proliferation and immune system regulation and is a necessary
growth factor for cell growth and proliferation. In tumor and
cancer cells, the Tf receptor content is significantly higher than
in the corresponding normal cells. Finally, Tf is a non-specific
immune factor in bodies of vertebrates. It serves antibacterial and
antiseptic purposes and is an important factor in the inhibition of
bacterial growth. Hence, Tf has a relatively comprehensive protein
physiological function and belongs to a special class of functional
proteins (12,13).
Tf in CSF comes from serum and is approximately
1/100 of the serum level. A dynamic, balanced relationship exists
between them (14). Przyjalkowski
et al(15) posited that Tf
is a good indicator for blood-brain barrier (BBB) damage. By
measuring the Tf level in CSF, insight may be gained into BBB
damage and the condition of the disease, which is useful in guiding
the treatment. Combining this information with our study, we
believe that the high expression of Tf in CSF may be associated
with impaired BBB in patients with NMO, and could be considered as
a response indicator of severe BBB damage during the pathological
NMO process.
Keratin 1 belongs to class II keratins, and is
expressed in the stratum spinosms, which are on the base of the
spine following mitosis. It modulates the expression of keratin 1,
which belongs to class I keratins, and they are often expressed in
pairs and bonded together (16).
Keratin 1 and keratin 10 are associated with cell differentiation
and maturation. Studies have shown that their expression can be
found in squamous cell carcinoma, which comes from the skin and
from the internal organs (17).
For unknown reasons, keratin 1 expression does not appear in MS.
The reason behind the high expression of keratin 1 in the CSF of
both the normal control and the NMO groups, and its non-expression
in the MS group, remain unknown.
Keratin 9 is a class I keratin mainly expressed in
palmoplantar epidermis (18) and
dispersedly expressed in the other areas of the epithelium
(19). It is often paired with
keratin 1 and reflects the function of keratin on the regulation of
glial cell differentiation (20).
The function of keratin 9 in the pathogenesis of MS has not been
reported.
References
|
1
|
Matiello M, Jacob A, Wingerchuk DM and
Weinshenker BG: Neuromyelitis optica. Curr Opin Neurol. 20:255–260.
2007. View Article : Google Scholar
|
|
2
|
Saiz A, Zuliani L, Blanco Y, Tavolato B,
Giometto B and Graus F: Revised diagnostic criteria for
neuromyelitis optica (NMO). Application in a series of suspected
patients. J Neurol. 254:1233–1237. 2007. View Article : Google Scholar : PubMed/NCBI
|
|
3
|
Lennon VA, Wingerchuk DM, Kryzer TJ, et
al: A serum autoantibody marker of neuromyelitis optica:
distinction from multiple sclerosis. Lancet. 364:2106–2112. 2004.
View Article : Google Scholar : PubMed/NCBI
|
|
4
|
Argyriou AA and Makris N: Neuromyelitis
optica: a distinct demyelinating disease of the central nervous
system. Acta Neurol Scand. 118:209–217. 2008. View Article : Google Scholar : PubMed/NCBI
|
|
5
|
Lana-Peixoto MA: Devic’s neuromyelitis
optica: a critical review. Arq Neuropsiquiatr. 66:120–138.
2008.
|
|
6
|
Noben JP, Dumont D, Kwasnikowska N, et al:
Lumbar cerebrospinal fluid proteome in multiple sclerosis:
characterization by ultrafiltration, liquid chromatography, and
mass spectrometry. J Proteome Res. 5:1647–1657. 2006. View Article : Google Scholar : PubMed/NCBI
|
|
7
|
Ottervald J, Franzen B, Nilsson K, et al:
Multiple sclerosis: identification and clinical evaluation of novel
CSF biomarkers. J Proteomics. 73:1117–1132. 2010. View Article : Google Scholar : PubMed/NCBI
|
|
8
|
Bai S, Liu S, Guo X, et al: Proteome
analysis of biomarkers in the cerebrospinal fluid of neuromyelitis
optica patients. Mol Vis. 15:1638–1648. 2009.PubMed/NCBI
|
|
9
|
Svenungsson E, Gunnarsson I, Fei GZ,
Lundberg IE, Klareskog L and Frostegard J: Elevated triglycerides
and low levels of high-density lipoprotein as markers of disease
activity in association with up-regulation of the tumor necrosis
factor alpha/tumor necrosis factor receptor system in systemic
lupus erythematosus. Arthritis Rheum. 48:2533–2540. 2003.
View Article : Google Scholar
|
|
10
|
Henry BJ: Clinical Diagnosis and
Management by Laboratory Methods. 18th edition. WB Saunders
Company; Philadelphia: pp. 4511991
|
|
11
|
Qian ZM, Li H, Sun H and Ho K: Targeted
drug delivery via the transferrin receptor-mediated endocytosis
pathway. Pharmacol Rev. 54:561–587. 2002. View Article : Google Scholar : PubMed/NCBI
|
|
12
|
Holmberg CG and Laurell CB: Investigations
in serum copper; nature of serum copper and its relation to the
iron-binding protein in human serum. Acta Chem Scand. 1:944–950.
1947. View Article : Google Scholar : PubMed/NCBI
|
|
13
|
Williams J: The evolution of transferrin.
Trends Biochem Sci. 7:394–397. 1982. View Article : Google Scholar
|
|
14
|
Gruener N, Gozlan O, Goldstein T, Davis J,
Besner I and Iancu TC: Iron, transferrin, and ferritin in
cerebrospinal fluid of children. Clin Chem. 37:263–265.
1991.PubMed/NCBI
|
|
15
|
Przyjalkowski W, Lipowski D, Kolasa T,
Issa E and Olejnik Z: Blood-cerebrospinal fluid barrier in purulent
cerebrospinal meningitis. Neurol Neurochir Pol. 30:39–48. 1996.(In
Polish).
|
|
16
|
Stoler A, Kopan R, Duvic M and Fuchs E:
Use of monospecific antisera and cRNA probes to localize the major
changes in keratin expression during normal and abnormal epidermal
differentiation. J Cell Biol. 107:427–446. 1988. View Article : Google Scholar
|
|
17
|
Moll R: Cytokeratins as markers of
differentiation in the diagnosis of epithelial tumors. Subcell
Biochem. 31:205–262. 1998.PubMed/NCBI
|
|
18
|
Langbein L, Heid HW, Moll I and Franke WW:
Molecular characterization of the body site-specific human
epidermal cytokeratin 9: cDNA cloning, amino acid sequence, and
tissue specificity of gene expression. Differentiation. 55:57–71.
1993. View Article : Google Scholar
|
|
19
|
Moll I, Heid H, Franke WW and Moll R:
Distribution of a special subset of keratinocytes characterized by
the expression of cytokeratin 9 in adult and fetal human epidermis
of various body sites. Differentiation. 33:254–265. 1987.
View Article : Google Scholar : PubMed/NCBI
|
|
20
|
Swensson O, Langbein L, McMillan JR, et
al: Specialized keratin expression pattern in human ridged skin as
an adaptation to high physical stress. Br J Dermatol. 139:767–775.
1998. View Article : Google Scholar : PubMed/NCBI
|