Introduction
Since the early observation by Otto Warburg, it has
been well known that tumor cells are characterized by an increased
requirement for energy metabolism. Additionally, these cells, have
a reduced ability to use mitochondrial oxidation and favor the
conversion of pyruvate into lactate, despite the availability of
oxygen. To compensate the inefficient extraction of energy from
glucose, malignant cells have an at least a 20- to 30-fold higher
rate of glycolysis than normal cells. This enhancement of
glycolytic metabolism requires an increased rate of glucose uptake
into tumor cells. The upregulation of glucose transport across the
plasma membrane is mediated by a family of facilitative glucose
transporter proteins (GLUTs), which differ regarding their
tissue-specific distribution and affinity for glucose (1,2).
These structurally-related carriers contain 12 transmembrane
spanning α-helix domains with both the amino and carboxyl termini
exposed on the cytoplasmic side of the plasma membrane (3).
The deregulation of glucose metabolism in cancer
cells is predominantly mediated by oxygen-related transcription
factors, such as the hypoxia-inducible factor 1 (HIF-1). HIF-1
induces a number of genes encoding glycolytic enzymes,
erythropoietin, the tumor-associated carbonic anhydrases (CAs),
CAIX and CAXII, vascular endothelial growth factor (VEGF), as well
as the facilitative GLUT isoforms 1 and 3 (GLUT1 and GLUT3).
Hypoxia-related GLUTs are characterized by low Km values and high
affinity for glucose as compared to other members of the GLUT
family. GLUT1 is mostly expressed in erythrocytes, placental cells
and endothelial cells of the blood-brain barrier, whereas GLUT3 is
found mainly in the brain, placenta and other cell-types, with an
intense requirement for glucose (4,5).
Previous studies have provided evidence of human malignancies
expressing a higher level of GLUT1 and GLUT3 in comparison with
normal cells. The overexpression of hypoxia-related GLUTs has been
demonstrated in a variety of tumors, including lung, endometrium,
breast, liver, kidney, head and neck, colon and oral squamous cell
carcinomas (6–13). In general, the overexpression of
GLUT1 and GLUT3 in different tumor types correlates with specific
clinicopathological characteristics, malignant potential and poor
prognosis. It has been suggested that the expression pattern of
both transporters may be used as a prognostic factor of malignancy
and progression, possibly assisting in the selection of patients
requiring more aggressive therapy.
Some of the contradictory results concerning the
level of GLUT1 and GLUT3 expression in thyroid lesions can be found
in the literature. Therefore, the aim of this study was to clarify
whether there is any difference in the expression of GLUT1 and
GLUT3 between benign and malignant neoplasms and non-neoplastic
thyroid lesions.
Materials and methods
Patients and samples
The analyzed specimens were obtained from the
Department of General and Oncological Surgery of the Medical
University of ŁódŸ. The material comprised samples from 73
patients, who underwent surgical resection due to nodular thyroid
diseases. Thyroid specimens from patients were rapidly frozen and
stored at −80°C until needed. The histological diagnosis report of
each patient was obtained from an experienced pathologist. Patient
characteristics and specimens are presented in Table I. Typing and staging of tumors were
carried out according to the system accepted by the International
Union Against Cancer (UICC, 2010).
 | Table ICharacteristics of patients and
surgically resected thyroid lesions. |
Table I
Characteristics of patients and
surgically resected thyroid lesions.
| Diagnosis | Number of samples
(n=73) | Male:Female | Age (range) |
|---|
| Papillary
carcinoma | 26 | 5:21 | 52.1 (30–81) |
| Stage |
| I | 6 | 1:5 | 41.8 (30–66) |
| II + III | 8 | 2:6 | 45.2 (33–59) |
| IV | 12 | 3:9 | 66.3 (45–81) |
| Lymph node
metastasis |
| No | 12 | 3:9 | 58.1 (33–81) |
| Yes | 14 | 3:11 | 52.2 (30–71) |
| Follicular
carcinoma | 6 | 2:4 | 63.5 (32–78) |
| Follicular
adenoma | 11 | 2:9 | 57.7 (32–64) |
| Nodular goiter | 30 | 4:26 | 51.6 (23–74) |
Isolation of cytoplasmic fraction
Pathological thyroid specimens were homogenized
using a Potter's homogenizer in 10 volumes of ice-cold sucrose
buffer (0.25 M sucrose, 5 mM MgCl2, 0.8 mM
KH2PO4, pH 6.7) with 1 mM
phenylmethylsulfonyl fluoride (PMSF) to inhibit protease activity.
The efficiency of homogenization was monitored by phase-contrast
light microscopy. The supernatants obtained after homogenate
centrifugation at 800 × g at 4°C for 10 min (sedimentation of
nuclei) were considered as cytoplasmic fractions including cellular
membranes and saved for further analysis.
RNA isolation and cDNA synthesis
Total RNA was isolated from frozen specimens by
using Fenozol reagent (A&A Biotechnology, Gdynia, Poland). The
RNA quality was confirmed by electrophoresis on a 1.2% agarose gel
with ethidium bromide staining and the 18S and 28S rRNA bands were
visualized under ultraviolet light. The yields were quantified
spectrophotometrically. RNA samples with a 260/280 nm ratio in the
range 1.8–2.0 were saved for further analysis. cDNA was then
synthesized from 2 μg of total RNA using a RevertAid™ First-Strand
cDNA Synthesis kit (Fermentas Inc., Vilnius, Lithuania), following
the manufacturer's instructions.
Quantitative real-time PCR
Quantitative real-time PCR with commercially
available primers and fluorescent probes (TaqMan® Gene
Expression Assay; Applied Biosystems™, Foster City, CA, USA) was
employed to detect the expression of the target genes [solute
carrier family 2, member 1 (SLC2A1) and solute carrier
family 2, member 3 (SLC2A3)] encoding GLUT1 and GLUT3 in different
types of thyroid lesions. The GAPDH gene was used as the
internal control. The assay numbers for these genes were as
follows: Hs00892681_m1 and Hs00359840_m1, Hs99999905_m1.
Each PCR reaction was performed in a 10 μl volume
that included 5 μl of 2X TaqMan Universal PCR MasterMix (Applied
Biosystems™), 4.5 μl of water-diluted cDNA tamplate and 0.5 μl of
TaqMan® Gene Expression assay consisting of a pair of
unlabeled PCR primers and a TaqMan FAM™ fluorescent probe. The
RT-qPCR reaction was carried out using the Mastercycler ep realplex
(Eppendorf) under the following conditions: denaturation for 10 min
at 95°C followed by 50 cycles of 15 sec at 95°C, 1≈min annealing
and extension at 60°C.
The 2−ΔCt
(Ctgene–CtGAPDH) method was used
to estimate the relative gene expression levels in the analyzed
samples. The 2−ΔCt values were re-calculated into
relative copy number values (number of SLC2A1 or
SLC2A3 mRNA copies per 1,000 copies of GAPDH mRNA).
Western blot analysis
The protein samples were mixed with solubilizing
buffer. Samples were not heated in a boiling water bath before
SDS-PAGE but incubated for 15 min at room temperature in order to
avoid GLUT protein aggregation. Denatured proteins of different
types of thyroid lesions (30 μg protein/lane) were resolved by
electrophoresis on a 10% polyacrylamide slab gel with 0.1% SDS
according to Laemmli (14) and
electrotransferred onto Immobilon-P transfer membranes (Millipore,
Bedford, MA, USA) by western blotting in Towbin's buffer (15). The quality of transfer was verified
by Ponceau S staining before blocking the membrane. Then, the blots
were incubated for 2 h at room temperature with the rabbit
anti-human GLUT1 polyclonal antibodies in a 1:1000 dilution
(Abcam®, Cambridge, UK) or mouse anti-human GLUT3
monoclonal antibodies in a 1:500 dilution, (Santa Cruz
Biotechnology® Inc., Santa Cruz, CA, USA). Blots were
washed 3 times with TBS-T (0.1% Tween-20 in Tris-buffered saline,
TBS) for 15 min, and were incubated for 1 h at room temperature
with horseradish peroxidase-labeled goat anti-rabbit or goat
anti-mouse IgG antibodies, which were added at a dilution of
1:5000, (Santa Cruz Biotechnology Inc.). After extensive washing
with TBS-T, the proteins were visualized on X-ray film by the
enhanced chemiluminescence method. To confirm that the same amounts
of proteins were loaded into each lane, the standard silver
staining method was used for total protein identification on the
gels (16). Gel-Pro Analyzer
software version 3.0 (Media Cybernetics Inc., Bethesda, MD, USA)
was used for densitometry analysis of the protein bands.
Statistical analysis
Statistical evaluation was performed using
STATISTICA version 9.0 (StatSoft, Krakow, Poland). The
non-parametric Mann-Whitney U test and Spearman rank analysis were
applied. A p-value <0.05 was considered to indicate a
statistically significant difference.
Results
Expression of GLUT1 and GLUT3 mRNA
mRNA levels of GLUT1 and GLUT3 were determined by
real-time PCR in different thyroid specimens, such as
non-neoplastic lesions i.e. nodular goiters (NGs) follicular
adenomas (FAs), papillary carcinomas (PCs) and follicular
carcinomas (FCs). The results of GLUT1 and GLUT3 gene expression in
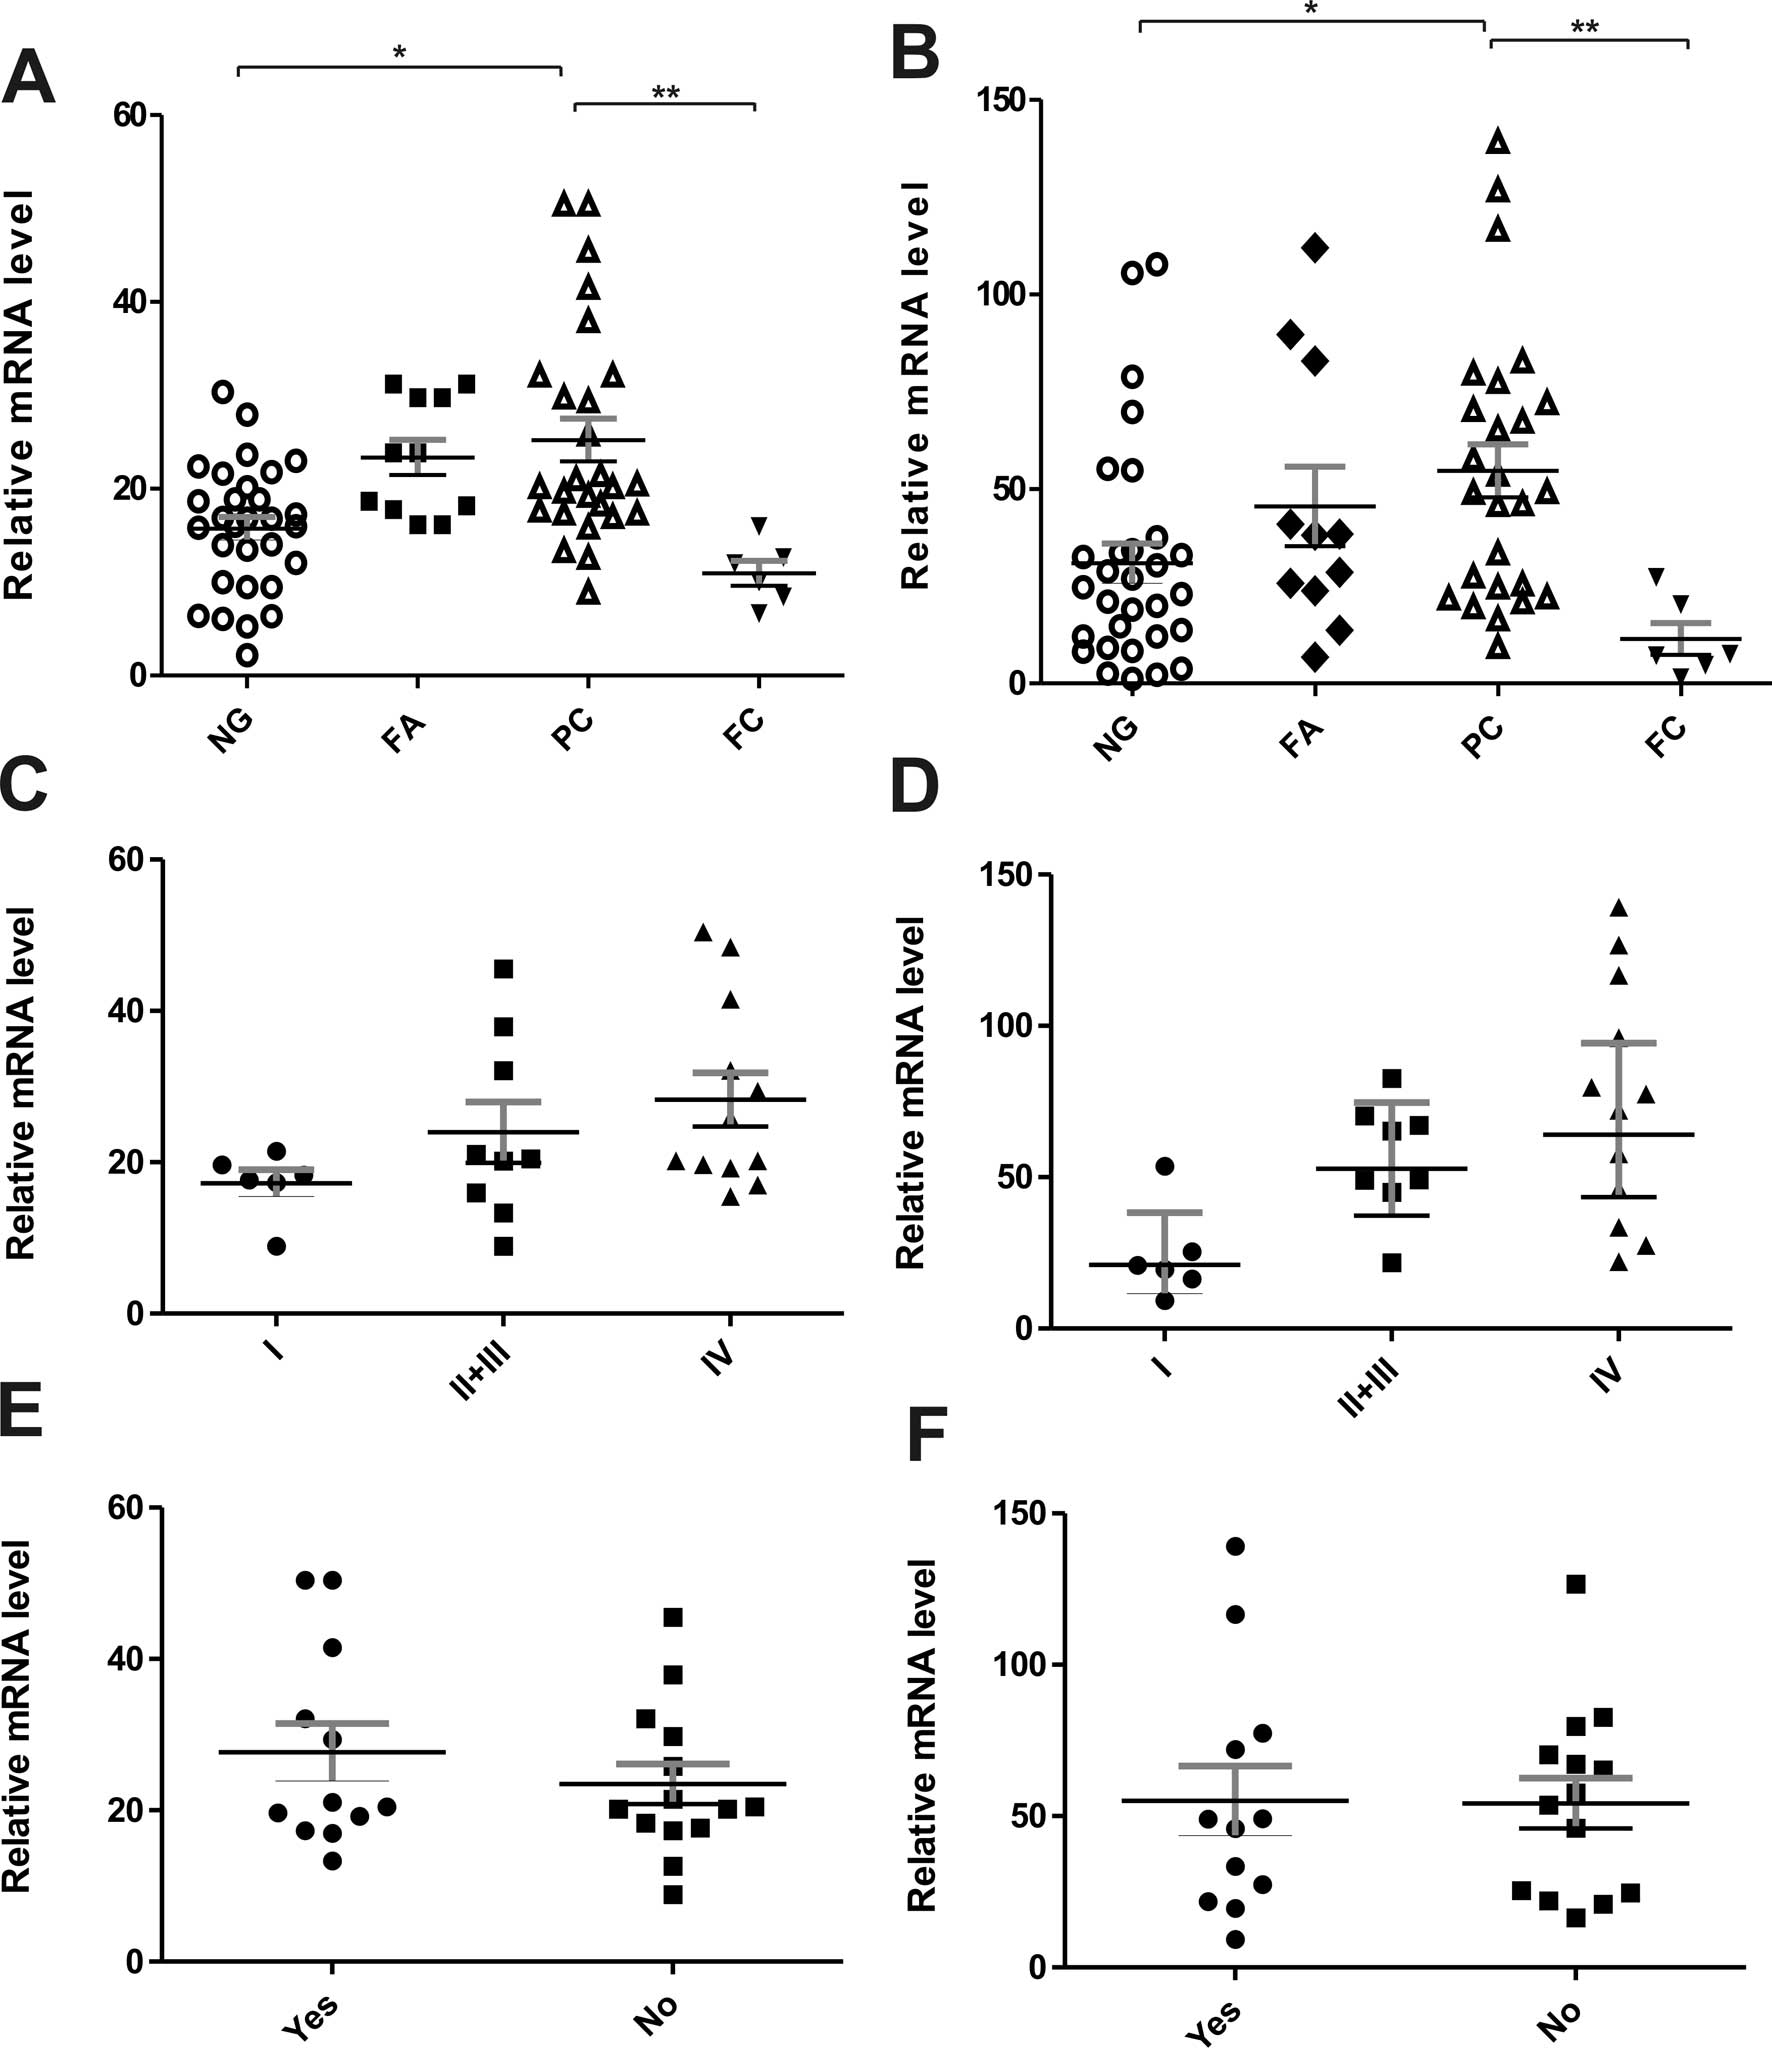
each type of thyroid lesions are presented in Table II and graphed in Fig. 1. The results indicate that
SLC2A1 gene (GLUT1) had a significantly higher expression in
PCs than in non-neoplastic lesions (p<0.05) (Table II and Fig. 1A). In addition, a lower level of
GLUT1 mRNA was observed in FCs in comparison with non-neoplastic,
benign lesions and PCs (p<0.01). No statistically significant
differences were found in GLUT1 mRNA levels between benign and
non-neoplastic lesions. There were similar findings regarding the
hypoxia-related SLC2A3 gene (GLUT3). The data showed a
higher expression level of GLUT3 mRNA in PC cases than in FCs
(p<0.01) and non-neoplastic lesions (p<0.05) (Table II and Fig. 1B). Moreover, in the PC group, a
tendency towards an increased expression of GLUT1 and GLUT3 mRNA
with more advanced disease stages was found (Fig. 1C and D). No statistically
significant differences were noted in the expression of both genes
in PC cases with or without metastasis to lymph nodes (Fig. 1E and F). A correlation was found
between GLUT1 and GLUT3 mRNA expression (Spearman's rank analysis,
p<0.001).
| Table IIExpression of SLC2A1 and
SLC2A3 genes and their respective proteins, GLUT1 and GLUT3,
in thyroid lesions. |
Table II
Expression of SLC2A1 and
SLC2A3 genes and their respective proteins, GLUT1 and GLUT3,
in thyroid lesions.
| Genea | Proteinb |
|---|
|
|
|
|---|
| Diagnosis | SLC2A1 | SLC2A3 | GLUT1 | GLUT3 |
|---|
| Nodular goiter
(NG) | 15.75±1.24 | 30.85±5.13 | 0.73±0.17 | 2.42±0.36 |
| Follicular adenoma
(AF) | 23.32±1.88 | 45.47±10.24 | 0.92±0.27 | 3.50±0.55 |
| Papillary carcinoma
(PC) | 25.22±2.23 | 53.93±7.29 | 1.23±0.23 | 4.28±0.68 |
| Follicular carcinoma
(FC) | 10.95±1.35 | 11.41±4.11 | 0.30±0.06 | 1.46±0.06 |
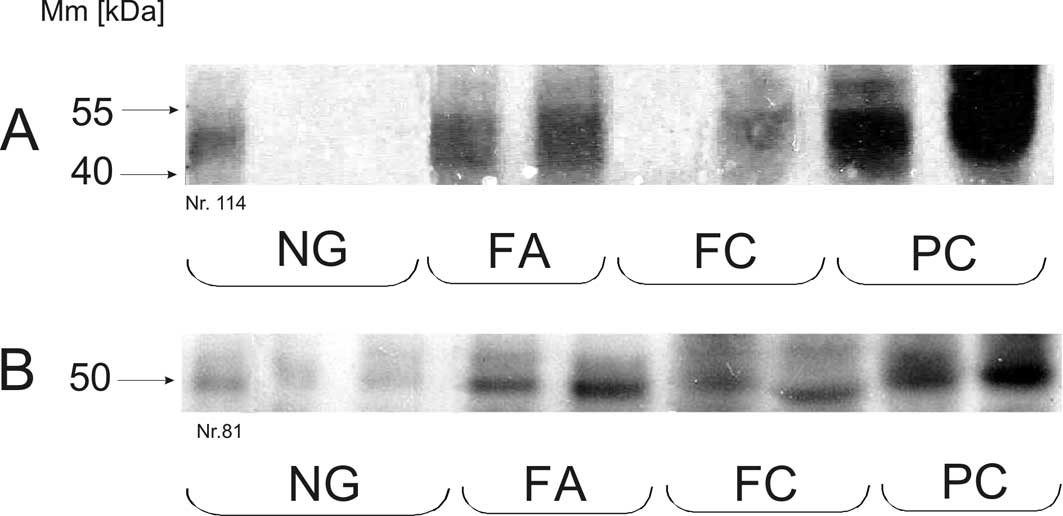
GLUT1 and GLUT3 protein level
The expression of GLUT1 protein with the expected
molecular masses in the range of 41–55 kDa (corresponding to its
heterogeneously glycosylated species) was detected in all types of
thyroid lesions (Fig. 2A).
However, there were some differences in the level of GLUT1
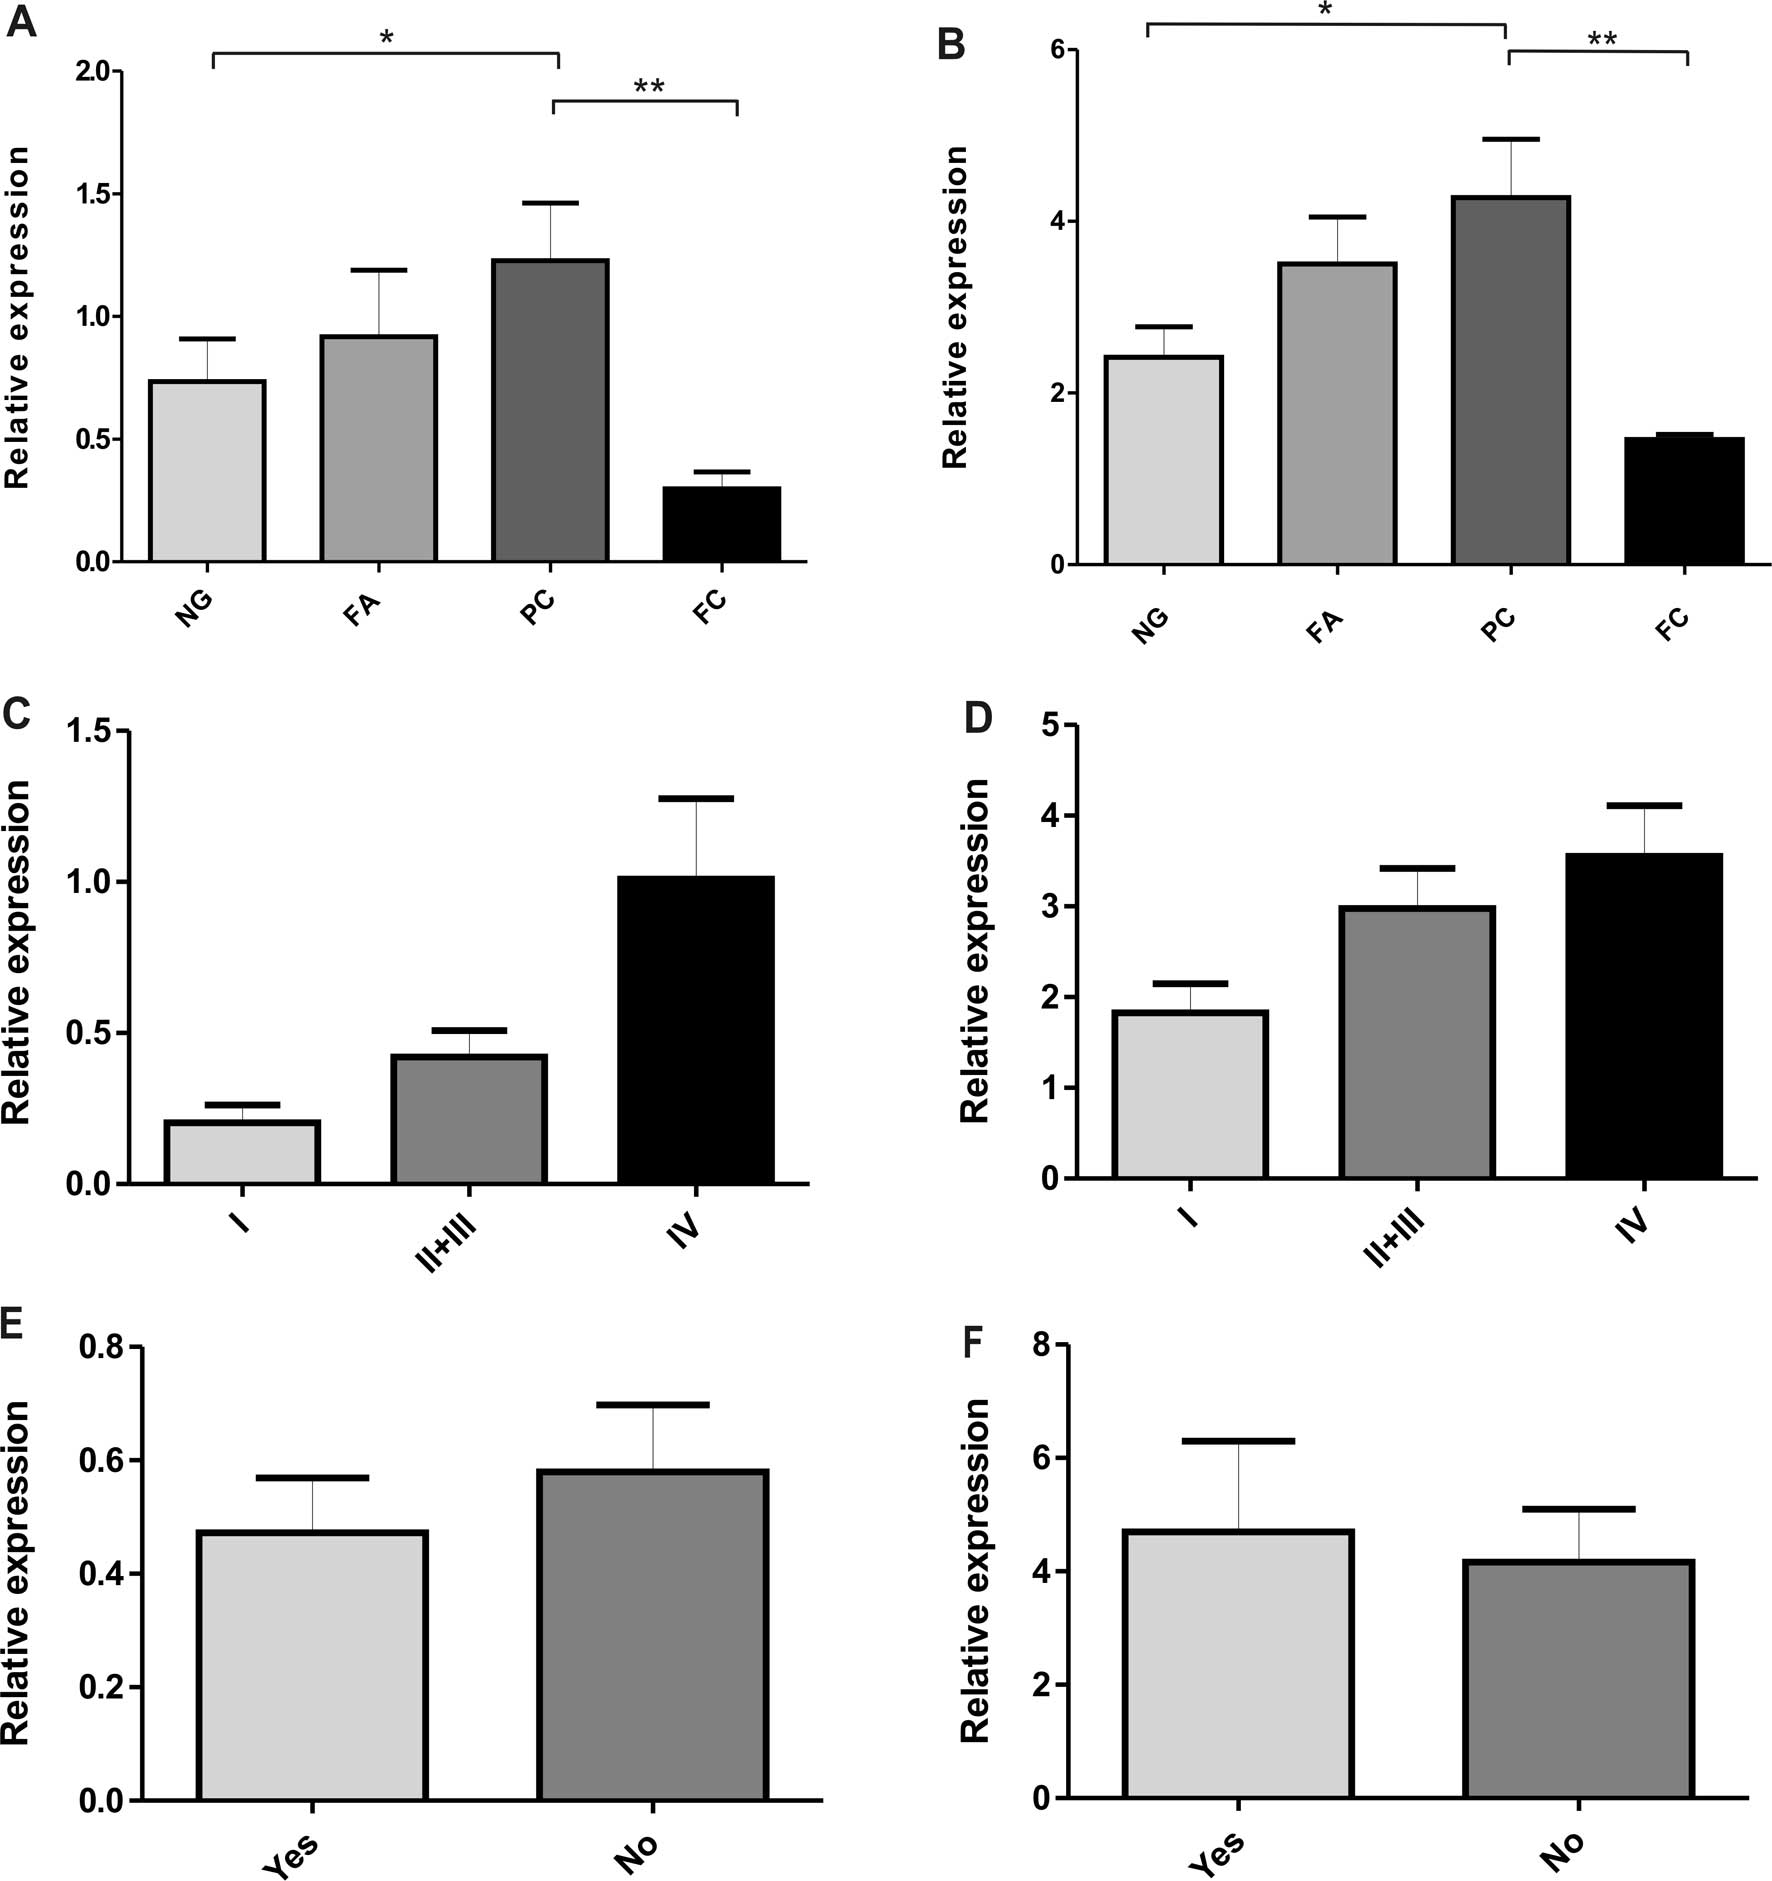
expression between the various groups of thyroid lesions (Table II and Fig. 3A). The majority of the PC samples
showed a higher immunoreactivity for GLUT1 in comparison with the
non-neoplastic thyroid lesions (p<0.05) (Fig. 2A). The relative GLUT1 protein level
was low in FCs compared to other types of lesions (p<0.01). A
tendency towards an increased expression of GLUT1 was observed in
the PC group with an elevated tumor stage (Fig. 3C). No obvious differences were
noted regarding other histological features, such as the lymph node
status (Fig. 3E).
The results of the GLUT3 expression in thyroid
lesions determined by western blot analysis are shown in Fig. 2B. The highest expression of GLUT3
was associated with PCs as opposed to low GLUT3 immunoreactivity in
FCs (p<0.01) and non-neoplastic lesions (p<0.05) (Table II and Fig. 3B). No statistically significant
differences were found in the GLUT3 protein level between
non-neoplastic lesions (NGs) and the benign neoplasm group (FAs).
Moreover, as observed in the GLUT1 expression patterns, the data
showed a significantly higher GLUT3 protein level in stage IV than
in stage I of PC (Fig. 3D). There
were no statistically significant differences in GLUT3 expression
in PC cases with or without metastasis to lymph nodes (Fig. 3F). There was a noted correlation
between the GLUT1 and GLUT3 protein expression (Spearman's rank
analysis, p<0.05), whereas a significant correlation was noted
between GLUT1 and GLUT3 expression levels determined by real-time
PCR and those obtained by western blot analysis (Spearman's test
analysis, p<0.01 and p<0.05, respectively).
Discussion
It is widely accepted that malignant cells enhance
glucose metabolism. Such a high rate of glucose metabolism cannot
be sustained without the upregulation of facilitative GLUTs
(1,2). In this study, using real-time PCR and
western blot analysis, we investigated whether there is any
difference in the expression of hypoxia-related GLUT1 and GLUT3
between benign and malignant neoplasms, as well as non-neoplastic
thyroid lesions.
To date, GLUT1 expression in thyroid malignancies
has mainly been investigated immunohistochemically. There are,
however, some discrepancies between the results of these studies.
Chandan et al (17)
described negative GLUT1 staining in all 15 (100%) examined cases
with an unequivocal cytological diagnosis of PC. Kim et al
(18) detected a positive
expression of GLUT1 only in anaplastic carcinomas, which correlated
with the impairment of p53 and p63 upregulation. Haber et al
(19) reported a positive
immunohistochemical expression of GLUT1 in both well- and
poorly-differentiated thyroid carcinomas.
Our results, obtained by western blot analysis,
showed a higher intensity of bands corresponding to GLUT1 in the
majority of PC samples in comparison with non-neoplastic thyroid
lesions. We also observed that the expression level of GLUT1 was
significantly higher in PC than in FC cases, which is in agreement
with the data previously reported (19–21).
In our study on SLC2A1 (GLUT1) gene expression comparable
findings were obtained.
There is little information in the literature
regarding the GLUT3 expression in thyroid cancer. Ciampi et
al (22) reported the most
prevalent GLUT3 mRNA expression in well-differentiated thyroid
papillary (NPA) and follicular (WRO) carcinoma cell lines. Another
study showed slightly higher GLUT3 mRNA expression levels in
thyroid cancer cells than in normal ones, although the results were
not statistically significant (23). Contrary to the immunohistochemical
analysis (21), we detected GLUT3
isoform expression both on the protein and mRNA levels. Our results
revealed a higher level of GLUT3 in papillary than in FCs and
non-neoplastic thyroid lesions. Moreover, we observed a tendency
towards an increased expression of GLUT1 and GLUT3 in the PC group
with a more advanced tumor stage.
The results of the present study suggest that the
differences in GLUT1 and GLUT3 expression levels are associated
with the histological type of thyroid carcinomas. Both
hypoxia-related GLUT1 and 3 are involved in the progression of
papillary thyroid carcinomas and may be added to a panel of
biological thyroid carcinoma markers. For the first time in the
literature we observed a close correlation between the
overexpression of GLUT1 and GLUT3 proteins and the high levels of
GLUT1 and GLUT3 mRNA in the same thyroid cancer specimens. However,
in some neoplasm cases we were not able to detect the GLUT1 or
GLUT3 positive band and the mRNA level was very low. A hypothesis
that provides an acceptable explanation for these findings is that
the expression of hypoxia-related GLUTs is further influenced by
the microenvironment of tumor cells. Some authors have observed the
most prominent GLUT1 expression around the necrotic areas or the
hypoxic regions of tumors (23,24).
The study of Tomes et al (25) on breast carcinomas showed that
necrosis was usually associated with hypoxia and the co-expression
of HIF1, CAIX and GLUT1. They also found that in cases of tumor
epithelium without associated necrosis, GLUT1 was present at a low
frequency. A similar phenomenon has been reported in thyroid
malignancies, which usually show extensive GLUT1 immunostaining in
the center of tumor cell groups or in perinecrotic areas (20,21).
In our study, we observed a correlation between GLUT1 and GLUT3
expression levels determined by both real-time PCR and western blot
analysis. Our results suggest that hypoxia-related GLUTs in the
thyroid may be regulated by common factors.
By contrast, the lack of hypoxia-related GLUTs in
some examined samples suggests the possibility that other GLUT
isoforms may be expressed. The expression of GLUT2, GLUT5 and
GLUT10 has been reported in thyroid tissue (21,26).
In conclusion, we presume that hypoxia-related GLUTs
may play an important role in the glucose metabolism of thyroid
neoplasms. Further investigations are required to clarify the exact
regulation of hypoxia-related GLUT1 and GLUT3 in thyroid cancer
cells.
Acknowledgements
This study was supported by the the University of
ŁódŸ (grant 505/0375), and is a ‘Project co-funded by the European
Union under the European Social Fund’ and ‘HUMAN-BEST
INVESTMENT.’
References
|
1
|
Airley RE and Mobasheri A: Hypoxic
regulation of glucose transport, anaerobic metabolism and
angiogenesis in cancer: novel pathways and targets for anticancer
therapeutics. Chemotherapy. 53:233–256. 2007. View Article : Google Scholar : PubMed/NCBI
|
|
2
|
Ganapathy V, Thangaraju M and Prasad PD:
Nutrient transporters in cancer: relevance to Warburg hypothesis
and beyond. Pharmacol Ther. 121:29–40. 2009. View Article : Google Scholar : PubMed/NCBI
|
|
3
|
Joost H-G and Thorens B: The extended
GLUT-family of sugar/polyol transport facilitators: nomenclature,
sequence characteristics, and potential function of its novel
members (Review). Mol Membr Biol. 18:247–256. 2001. View Article : Google Scholar
|
|
4
|
Mueckler M: Facilitative glucose
transporters. Eur J Biochem. 219:713–725. 1994. View Article : Google Scholar : PubMed/NCBI
|
|
5
|
Zhao F-Q and Keating AF: Functional
properties and genomics of glucose transporters. Curr Genomics.
8:113–128. 2007. View Article : Google Scholar : PubMed/NCBI
|
|
6
|
Usuda K, Sagawa M, Aikawa H, Ueno M,
Tanaka M, Machida Y, Zhao X-T, Ueda Y, Higashi K and Sakuma T:
Correlation between glucose transporter-1 expression and
18F-fluoro-2-deoxyglucose uptake on positron emission tomography in
lung cancer. Gen Thoroc Cardiovasc Surg. 58:405–410. 2010.
View Article : Google Scholar : PubMed/NCBI
|
|
7
|
Goldman NA, Katz EB, Glenn AS, Weldon RH,
Jones JG, Lynch U, Fezzari MJ, Runowicz CD, Goldberg GL and Charron
MJ: GLUT1 and GLUT8 in endometrium and endometrial adenocarcinoma.
Mod Pathol. 19:1429–1436. 2006.PubMed/NCBI
|
|
8
|
Krzeslak A, Wojcik-Krowiranda K, Forma E,
Jozwiak P, Romanowicz H, Bienkiewicz A and Brys M: Expression of
GLUT1 and GLUT3 glucose transporters in endometrial and breast
cancers. Pathol Oncol Res. 18:721–728. 2012. View Article : Google Scholar : PubMed/NCBI
|
|
9
|
Hernández F, Navarro M, Encinas JL, López
Gutiérrez JC, López Santamaría M, Leal N, Martínez L, Patrón M and
Tovar JA: The role of GLUT1 immunostaining in the diagnosis and
classification of liver vascular tumors in children. J Pediatr
Surg. 40:801–804. 2005.PubMed/NCBI
|
|
10
|
Suganuma N, Segade F, Matsuzu K and Bowden
DW: Differential expression of facilitative glucose transporters in
normal and tumour kidney tissues. BJU Int. 99:1143–1149. 2007.
View Article : Google Scholar : PubMed/NCBI
|
|
11
|
Chandan VS, Faquin WC, Wilbur DC and
Khurana KK: The ulility of GLUT-1 immunolocalization in cell
blocks: An adjunct to the fine needle aspiration diagnosis of
cystic squamous lesions of the head and neck. Cancer. 108:124–128.
2006. View Article : Google Scholar : PubMed/NCBI
|
|
12
|
Sakashita M, Aoyama N, Minami R, Maekawa
S, Kuroda K, Shirasaka D, Ichihara T, Kuroda Y, Maeda S and Kasuga
M: Glut1 expression in T1 and T2 stage colorectal carcinomas: its
relationship to clinicopathological features. Eur J Cancer.
37:204–209. 2001. View Article : Google Scholar : PubMed/NCBI
|
|
13
|
Ayala FR, Rocha RM, Carvalho KC, Carvalho
AL, da Cunha IW, Lourenço SV and Soares FA: GLUT1 and GLUT3 as
potential prognostic markers ror oral squamous cell carcinoma.
Molecules. 15:2374–2387. 2010. View Article : Google Scholar : PubMed/NCBI
|
|
14
|
Laemmli UK: Cleavage of structural
proteins during the assembly of the head of bacteriophage T4.
Nature. 227:680–685. 1970. View
Article : Google Scholar : PubMed/NCBI
|
|
15
|
Towbin H, Staehelin T and Gordon J:
Electrophoretic transfer of protein from polyacrylamide gels to
nitrocellulose sheets; procedure and some application. 1979.
Biotechnology. 24:145–149. 1992.PubMed/NCBI
|
|
16
|
Hochstrasser DF, Patchornik A and Merril
CR: Development of polyacrylamide gels that improve the separation
of proteins and their detection by silver staining. Anal Biochem.
173:412–423. 1988. View Article : Google Scholar : PubMed/NCBI
|
|
17
|
Chandan VS, Faquin WC, Wilbur DC and
Khurana KK: The role of immunolocalization of CD57 and GLUT-1 in
cell blocks in fine-needle aspiration diagnosis of papillary
thyroid carcinoma. Cancer. 108:331–336. 2006. View Article : Google Scholar : PubMed/NCBI
|
|
18
|
Kim YW, Do IG and Park YK: Expression of
the GLUT1 glucose transporter, p63 and p53 in thyroid carcinomas.
Pathol Res Pract. 202:759–765. 2006. View Article : Google Scholar : PubMed/NCBI
|
|
19
|
Haber RS, Weiser KR, Pritsker A, Reder I
and Burstein DE: GLUT1 glucose transporter expression in benign and
malignant thyroid nodules. Thyroid. 7:363–367. 1997. View Article : Google Scholar : PubMed/NCBI
|
|
20
|
Yasuda M, Ogane N, Hayashi H, Kameda Y,
Miyagi Y, Iida T, Mori Y, Tsukinoki K, Minematsu T and Osamura Y:
Glucose transporter-1 expression in the thyroid gland:
clinicopathological significance for papillary carcinoma. Oncol
Rep. 14:1499–1504. 2005.PubMed/NCBI
|
|
21
|
Schönberger J, Rüschoff J, Grimm D,
Marienhagen J, Rümmele P, Meyringer R, Kossmehl P, Hofstaedter F
and Eilles C: Glucose transporter 1 gene expression is related to
thyroid neoplasms with an unfavorable prognosis: an
immunohistochemical study. Thyroid. 12:747–754. 2002.PubMed/NCBI
|
|
22
|
Ciampi R, Vivaldi A, Romei C, Del Guerra
A, Salvadori P, Cosci B, Pinchera A and Elisei R: Expression
analysis of facilitative glucose transporters (GLUTs) in human
thyroid carcinoma cell lines and primary tumors. Mol Cell
Endocrinol. 291:57–62. 2008. View Article : Google Scholar : PubMed/NCBI
|
|
23
|
Brown RS, Goodman TM, Zasadny KR, Greenson
JK and Wahl RL: Expression of hexokinase II and Glut-1 in untreated
human breast cancer. Nucl Med Biol. 29:443–453. 2002. View Article : Google Scholar : PubMed/NCBI
|
|
24
|
Mori Y, Tsukinoki K, Yasuda M, Miyazawa M,
Kaneko A and Watanabe Y: Glucose transporter type 1 expression are
associated with poor prognosis in patients with salivary gland
tumors. Oral Oncol. 43:563–569. 2007. View Article : Google Scholar : PubMed/NCBI
|
|
25
|
Tomes L, Emberley E, Niu Y, Troup S,
Pastorek J, Strange K, Harris A and Watson PH: Necrosis and hypoxia
in invasive breast carcinoma. Breast Cancer Res Treat. 81:61–69.
2003. View Article : Google Scholar : PubMed/NCBI
|
|
26
|
Matsuzu K, Segade F, Matsuzu U, Carter A,
Bowden DW and Perrier ND: Differential expression of glucose
transporters in normal and pathologic thyroid tissue. Thyroid.
14:806–812. 2004. View Article : Google Scholar : PubMed/NCBI
|