Introduction
Pancreatic β-cell-specific expression of
thioredoxin, an antioxidative and anti-apoptotic protein, was
reported by Hotta et al(1)
in 1998. Following this, Shalev et al(2) identified a gene encoding
thioredoxin-interacting protein (TXNIP) that was the most markedly
upregulated gene in an oligonucleotide microarray study looking at
the effects of glucose on isolated human pancreatic islets. In
further studies, the same group generated a stable transfected
β-cell line (INS1E) overexpressing human TXNIP (3). It was observed that the
glucose-induced transcription of TXNIP, mediated by a distinct
carbohydrate response element (ChoRE), did not require de
novo protein synthesis or glucose metabolism. Thus,
2-deoxy-D-glucose (2-DG; which may undergo phosphorylation by
glucokinase but is not further metabolized), and
3-O-methyl-D-glucose (3-MG; which was postulated not to undergo
phosphorylation by glucokinase) increased TXNIP expression in the
INS1E cells. However, this did not occur with equimolar
concentrations of L-glucose or mannitol, which eliminated the
possibility of an osmotic effect. D-mannoheptulose, an inhibitor of
D-glucose phosphorylation, blocked or blunted the effects of
D-glucose and 2-DG on gene expression, but left the 3-MG effect
unaltered (3,4). It was proposed that D-glucose and
3-MG regulated transcription by two distinct pathways that converge
at a common ChoRE.
In addition, glucose-sensing by the carbohydrate
response element binding protein (ChREBP) and the MondoA-Mlx
transcription factor was recently reviewed by Havula and
Hietakangas (5), with emphasis on
their activation by glucose 6-phosphate (G6P).
As TXNIP represents a direct and glucose-induced
target of the MondoA-Mlx transcription factor, Stoltzman et
al(6) investigated the effects
of D-glucose, 2-DG, 6-DG, 3-MG and the rare sugar epimer of
D-glucose, D-allose, on TXNIP expression in human embryonic kidney
epithelial cells (HA1ER cells). D-glucose, 2-DG, 3-MG and D-allose,
but not 6-DG, enhanced the transcription of TXNIP in HA1ER cells
expressing MondoA-Mlx RNAi. These authors also measured the hexose
and hexose phosphate content of HA1ER cells and observed comparably
low levels of the phosphate esters in cells exposed to D-glucose
and 3-MG, and higher levels of the esters in cells exposed to 2-DG
and D-allose. The experimental data were consistent with MondoA-Mlx
nuclear activity being regulated by the phosphorylated forms of the
tested hexoses (6).
By contrast, Dentin et al(7) demonstrated that the stimulating
effect of D-glucose on a ChoRE luciferase reporter in HepG2
hepatoma cells was mimicked by 2-DG but not by 3-MG, which is
considered to be a non-metabolized D-glucose analog. Incidentally,
these findings were collected in the framework of investigations
leading to the view that G6P, rather than xylulose 5-phosphate, is
required for the activation of ChREBP in response to glucose in the
liver. More recently, Diaz-Moralli et al(8) proposed that G6P and xylulose
5-phosphate are involved in the modulation of gene expression in
human hepatocarcinoma cells and rat hepatocytes exposed to either a
high concentration of D-glucose (25.0 mM) or to 2-DG (20.0 mM) in
the concomitant presence of D-glucose (5.0 mM). Alternatively,
Arden et al(9) suggested
that fructose 2,6-bisphosphate is essential for the
glucose-regulated gene transcription of glucose-6-phosphatase and
other ChREBP target genes in hepatocytes. In addition, the
association of TXNIP and ChREBP expression with β-cell function was
recently extended to their involvement in β-cell glucotoxicity
(10,11).
Furthermore, mammalian and yeast hexokinases have
been demonstrated to catalyze the phosphorylation of 3-MG with
respective Km values for D-glucose and 3-MG at 0.06 and 6.5 mM (in
the case of bovine heart hexokinase); and at 0.2 and 7.6 mM (in the
case of yeast hexokinase) (12,13).
Therefore, the aim of the present study was to re-evaluate the
possible association of 3-MG phosphorylation with an effect on the
upregulation of TXNIP and other glucose-sensitive genes in rat
hepatocytes and INS1E cells.
Materials and methods
Cell culture and gene expression
analysis
The insulin-secreting INS1E cell line was provided
by Professor C Wollheim (University Medical Center, Geneva,
Switzerland). The cells were cultured in RPMI-1640 medium
containing 10% fetal calf serum (FCS) and antibiotics (100 U/ml
penicillin and 100 μg/ml streptomycin), and enriched with 2 mM
L-glutamine and 50 μM 2-mercaptoethanol, as previously described
(14). The D-glucose concentration
in the standard culture medium was 11.5 mM. Cells were plated on
6-well plates at a density of ~20% 4 days prior to the experiment.
One day prior to the experiment, the medium was changed to the low
(3.5 mM) D-glucose RPMI-1640 medium, enriched as mentioned
previously. Following 16 h of incubation in the low glucose medium,
the supplementary glucose and other reagents were added to the
wells and the incubation was continued for 24 h. The medium was
then removed and the cells were washed in cold phosphate-buffered
saline and scraped into the denaturation buffer for RNA isolation.
The RNAnow (Biogentex, League City, TX, USA) and Aurum total RNA
(Bio-Rad, Nazareth, Belgium) kits were used to extract the RNA. The
total RNA concentration was estimated by the NanoDrop
spectrophotometer (Thermo Fisher Scientific, Aalst, Belgium).
Rat hepatocytes were prepared using the method
described by Seglen (15) and
plated on 6-well plates at a density of ~70% in Dulbecco's modified
Eagle's medium (DMEM) containing 10% FCS and D-glucose (11.1 mM),
and enriched with 5 nM dexamethasone and 0.1 U/ml insulin. On day
2, the medium was removed and replaced with a similar DMEM medium
containing 5.5 mM glucose. Supplementary glucose and reagents were
added after 4 h, and cells were further incubated for 24 h. RNA was
then isolated as mentioned previously for the INS1E cells.
RNA (1 μg) was randomly primed and reverse
transcribed using a cDNA synthesis kit (High Capacity cDNA Reverse
Transcriptase kit; Applied Biosystems, Gent, Belgium). For standard
PCR amplification, 1 μl cDNA was obtained from 14 ng total RNA
using the GoTaq PCR kit (Promega, Leiden, the Netherlands) in a
final volume of 20 μl (with ‘green buffer’). In semi-quantitative
multiplex PCR, eight primers were simultaneously used, and these
are listed in Table I. The
concentration of dNTP was 200 μM and the concentration of the
primers was 10 μM, except for that of the house-keeping gene, HPRT
(3 μM). The amplification program was as follows: Original
denaturation, 2 min at 94°C; denaturation, 10 sec at 94°C for 30
cycles; annealing, 20 sec at 59°C; and elongation, 1 min at 72°C.
The reaction mixture (10 μl) was analyzed on 1.2% agarose gel,
images were captured using Fusion UV System equipment and image
densitometry scanning was performed using Bio1D software
(Scientific Software Group, Salt Lake City, UT, USA). The
reliability of quantification by densitometric scanning was
determined using qPCR with the same probes as previously mentioned,
but used separately, in the CFX96 Real Time PCR apparatus
(Bio-Rad). The total volume used for qPCR was also 20 μl,
containing 0.3 μM forward and reverse primers, 10 μl SYBR Green mix
(Bio-Rad Laboratories, Hercules, CA, USA) and 2 μl cDNA. The
cycling program included denaturation at 95°C for 3 min, followed
by 40 cycles of annealing (15 sec at 95°C) and denaturing (30 sec
at 60°C) for 30 sec. All reactions were performed in duplicate in a
96-well plate.
 | Table ISequences of forward and reverse
primers. |
Table I
Sequences of forward and reverse
primers.
| Gene | Position | Sequence |
|---|
| FAS | Forward 2807 |
AGACCCCTGTGGTGTAG |
| FAS | Reverse 3307 |
CTTGAGTGTCTCCCTCCAGG |
| HPRT | Forward 518 |
AGCAGTACAGCCCCAAAATG |
| HPRT | Reverse 806 |
ATGGCCACAGGACTAGAACG |
| LPK | Forward 1030 |
GCCACACAGATGCTGGAGAG |
| LPK | Reverse 1376 |
GATAGAAGCTGGGCTGAAGG |
| TXNIP | Forward 1154 |
CTAAACATCCCAGACACCCC |
| TXNIP | Reverse 1342 |
GCAGGGATCCACCTCAGTG |
Hexose phosphorylation by liver, INS1E
cell and rat pancreatic islet homogenates
The phosphorylation of D-[U-14C]glucose
and 3-O-[14C]methyl-D-glucose (14C-labeled
3-MG; Amersham, Buckinghamshire, UK) by tissue or cell homogenates
was conducted as described previously (16). Briefly, the experiments were
conducted over 60 min with an incubation at 37°C in a medium (120
μl) composed of 50 μl of the tissue or cell homogenates, which were
prepared by sonication (thrice for 10 sec) in a HEPES-NaOH buffer
(75 mM HEPES, 150 mM KCl, 15 mM KH2PO4, 16.5
mM MgCl2, 15 mM NaF, 3 mM cysteine and 1.5 mM EDTA). The
medium was brought to pH 7.4 and comprised 0.5 mg/ml bovine serum
albumin, 60 μl reaction mixture consisting of the same HEPES-NaOH
buffer diluted with H2O in a 2:1 ratio and containing 20
mM ATP, D-[U-14C]glucose or 14C-labeled 3-MG
and 10 μl of the same buffer used for tissue or cell
homogenization, and unlabeled D-glucose or 3-O-methyl-D-glucose.
Following incubation, 0.5–1.0 ml cold H2O was added to
each sample and the radioactive acidic metabolites were separated
by anion-exchange chromatography (16). All measurements were corrected for
the blank value determined under the same experimental conditions
in the absence of tissue or cell homogenate.
D-[5-3H]glucose
utilization
The conversion of D-[5-3H]glucose to
3HOH by INS1E cells was determined as previously
described (17).
Statistical analysis
Results are presented as the mean ± standard error
of the mean, together with the number of separate determinations
(n) or the degrees of freedom (df). The statistical significance of
the differences between mean values was assessed by the Student's
t-test. P<0.05 was considered to indicate a statistically
significant difference.
Results
TXNIP and LPK gene expression
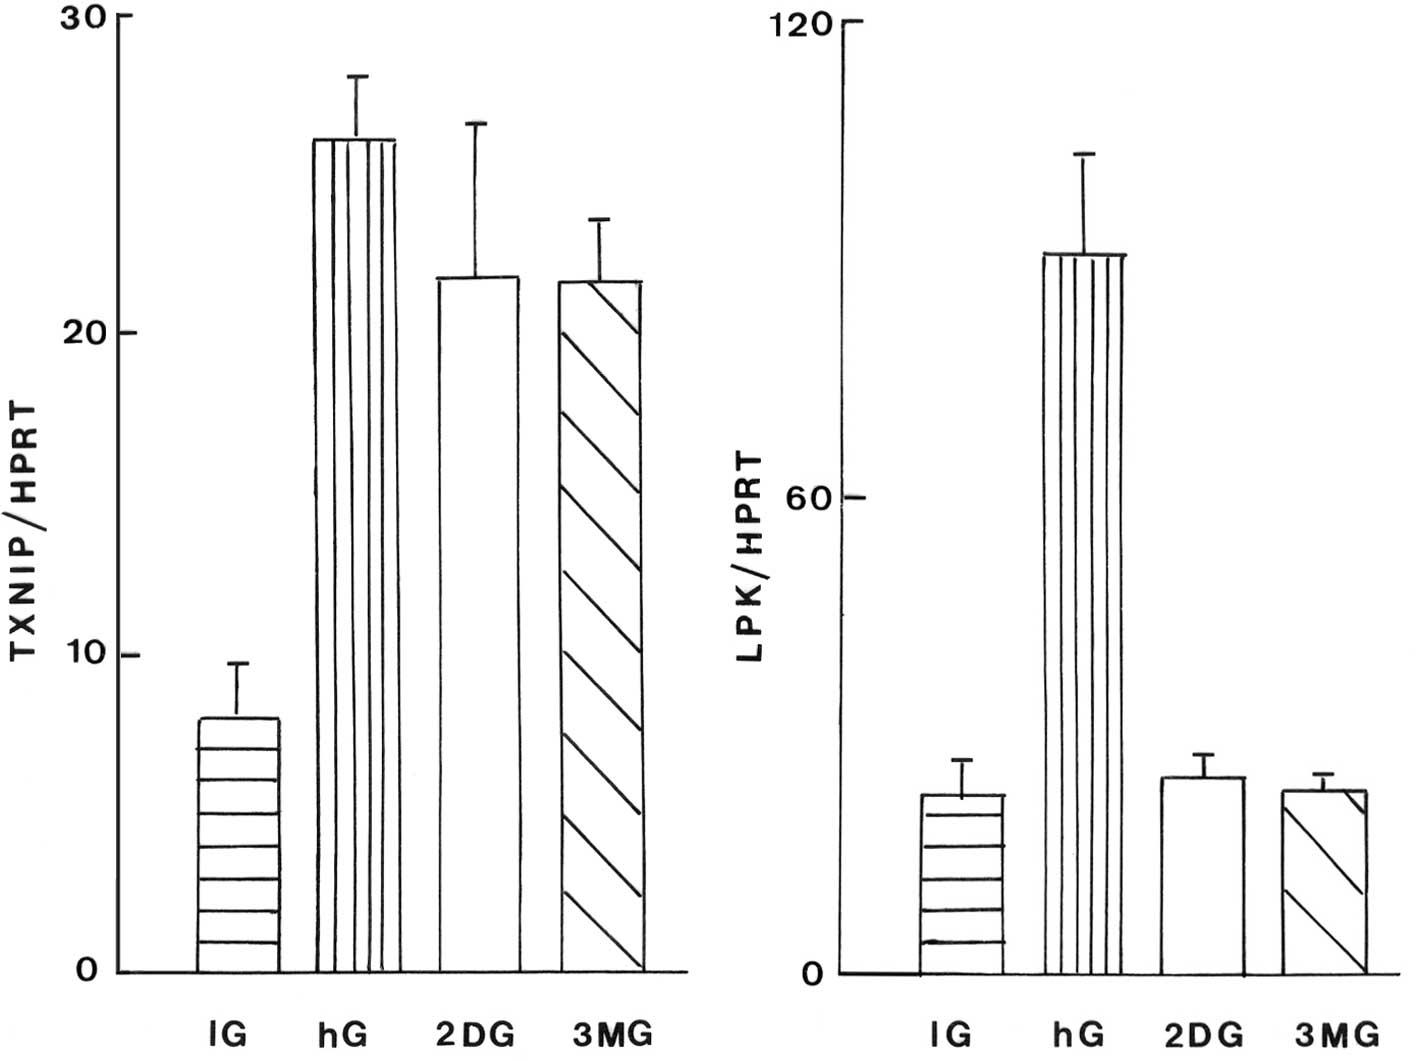
The mean absolute values of the TXNIP/HPRT and
LPK/HPRT gene expression ratios in the liver cell homogenates are
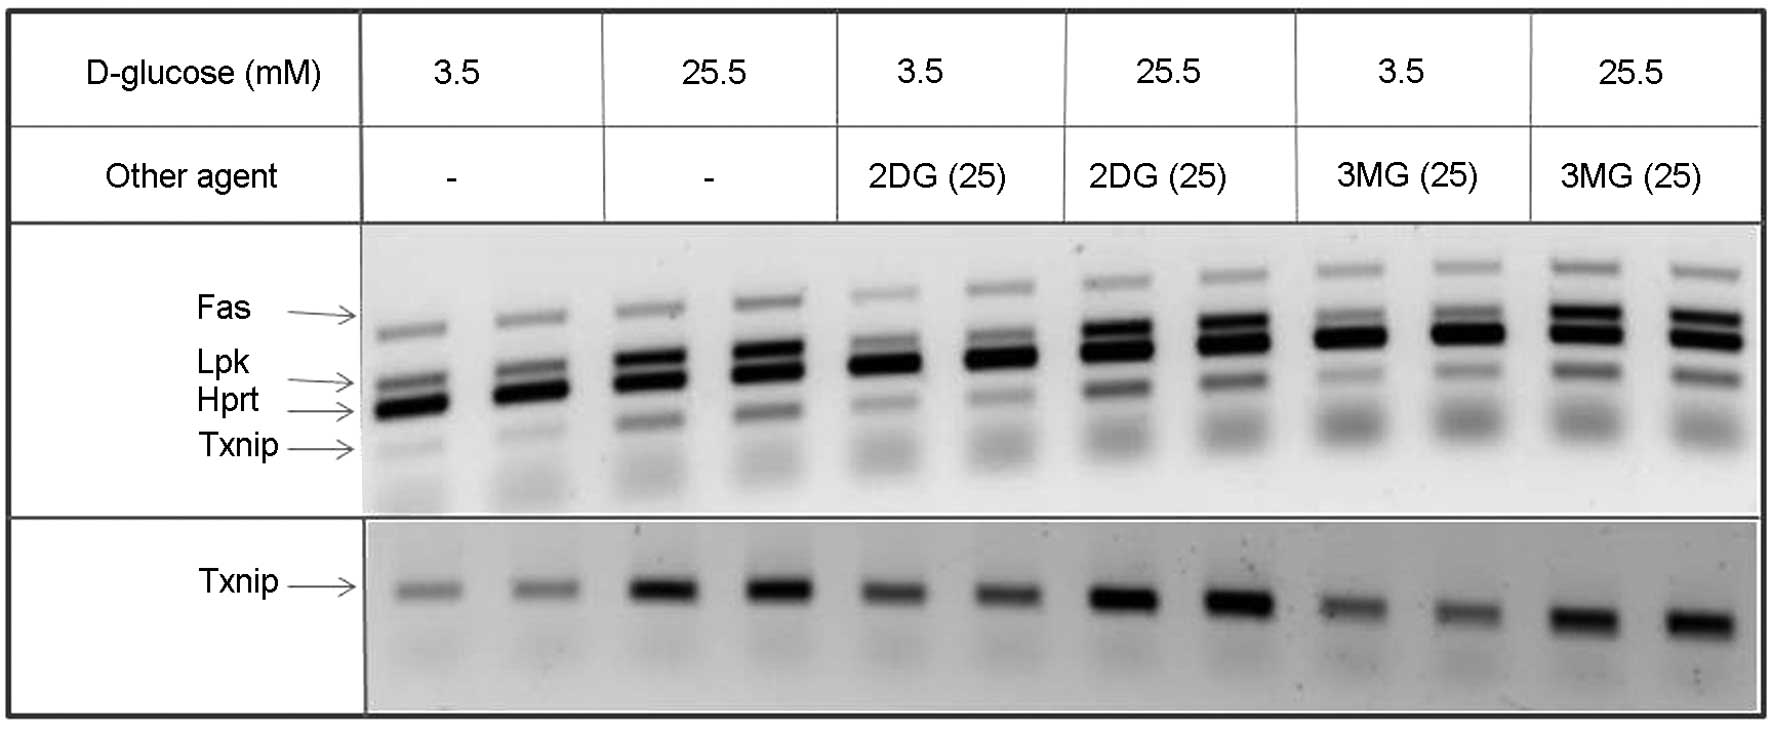
demonstrated in Fig. 1. A
representative experiment is shown in Fig. 2. This figure, as well as Fig. 4, also demonstrated that for results
concerning the FAS gene, no significant difference was observed
under the different experimental conditions in this study.
In the liver cells, an increase in the D-glucose
concentration from 5.5 to 25.0 mM and the incorporation of 2-DG or
3-MG (25.0 mM) to a medium containing 5.5 mM D-glucose
significantly increased the TXNIP/HPRT ratio (P<0.02 or less).
Relative to the basal value recorded in the presence of 5.5 mM
D-glucose, the values for the cells in the presence of either 2-DG
or 3-MG were not significantly different from one another and
averaged 81.5±7.6% (n=12; P<0.04), relative to those in the
presence of 25.0 mM D-glucose (100.0±3.0%; n=6).
In the liver cell homogenates, a rise in the
D-glucose concentration also led to an increase in the LPK/HPRT
ratio (P<0.001); however, this increase was not observed in the
cells exposed to 2-DG and 3-MG (Fig.
1).
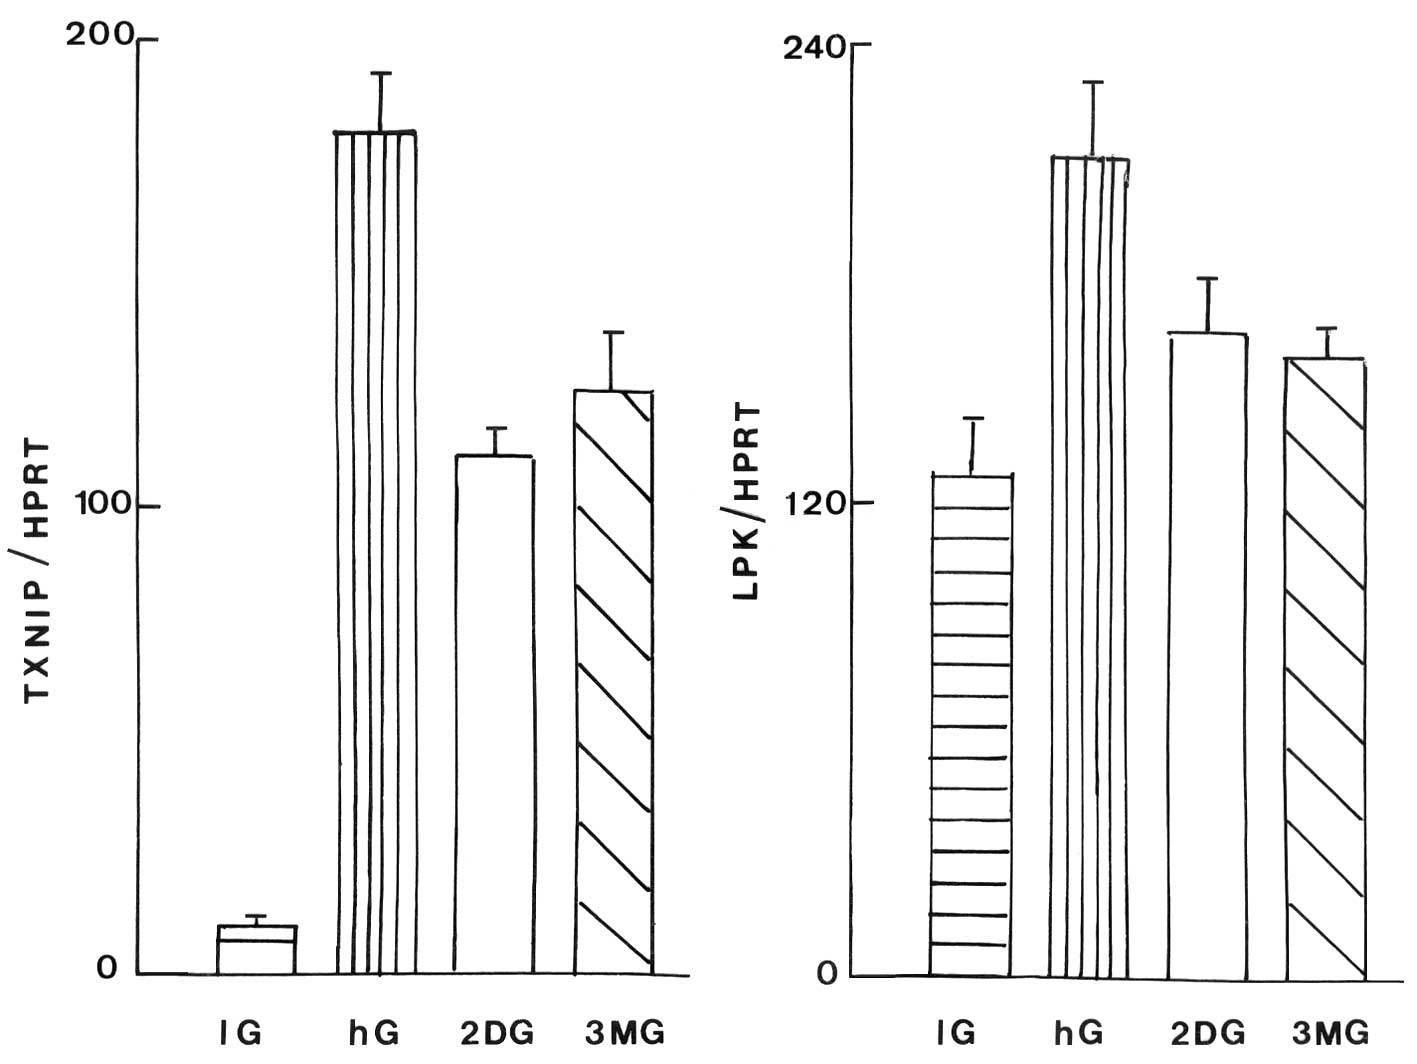
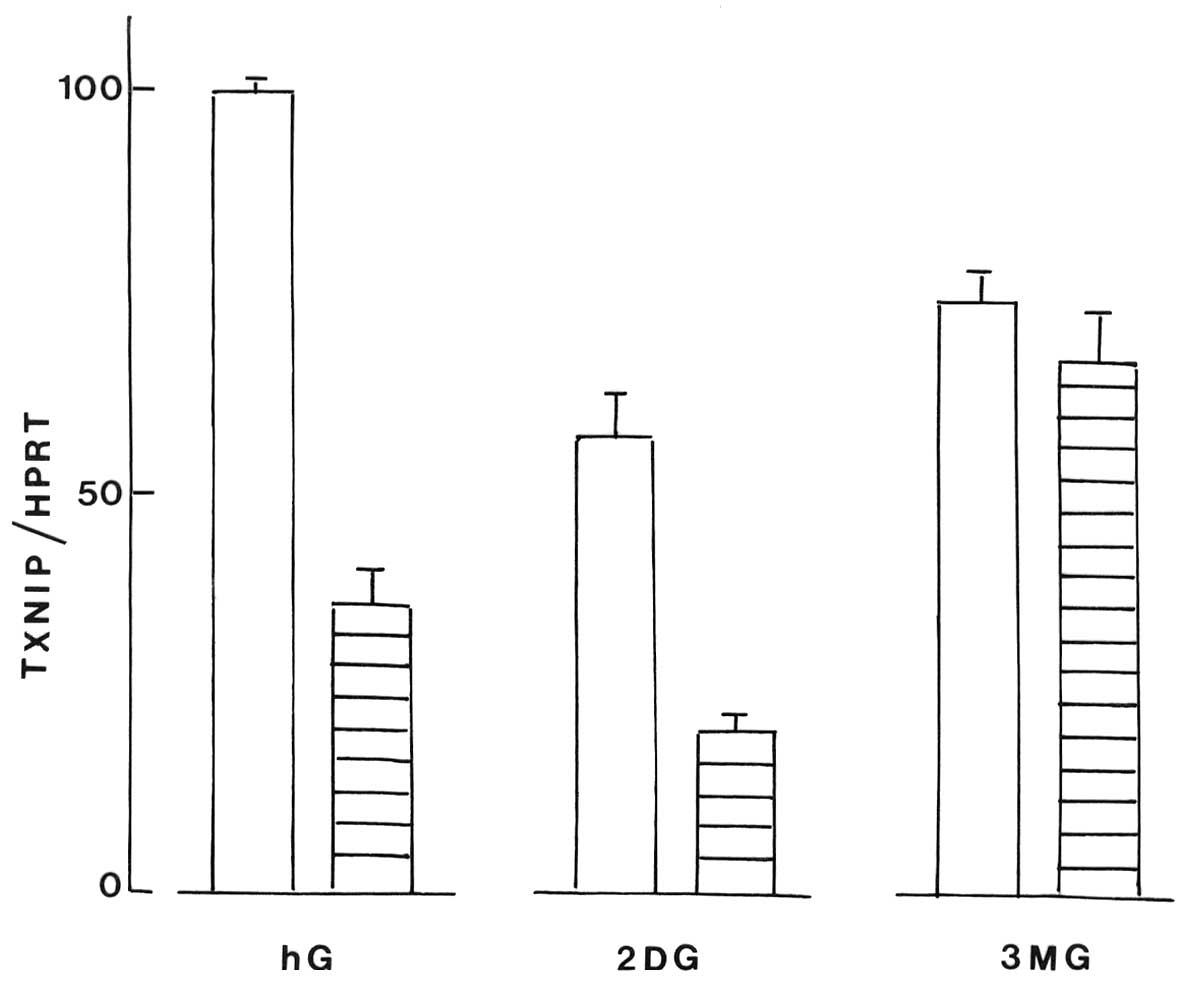
Fig. 3 documents
the absolute values for the TXNIP/HPRT and LPK/HPRT ratios in INS1E
cell homogenates. A representative experiment is illustrated in
Fig. 4. In the INS1E cells, the
TXNIP/HPRT ratio was also increased in response to an increase in
the D-glucose concentration and, to a lesser extent, in the cells
exposed to 2-DG or 3-MG (P<0.007; Fig. 3).
Likewise, the LPK/HPRT ratio also increased to a
lesser extent in the INS1E cells exposed to 2-DG or 3-MG compared
with those exposed to a high concentration of D-glucose. Thus, the
2-DG and 3-MG-induced increase in the LPK/HPRT ratio averaged
45.2±9.9% (n=9) and 42.4±16.0% (n=9), respectively, relative to
that caused within the same experiment by the rise in D-glucose
concentration. When compared within the same experiment, the paired
difference between the increase in the LPK/HPRT ratio due to 2-DG
and 3-MG was 14.9±7.5 (n=8), whilst there was a greater increase in
the TXNIP/HPRT ratio with 3-MG than with 2-DG, with a paired
difference of 18.8±7.2 (n=8). The algebraic difference between the
effects of 2-DG and 3-MG on the TXNIP/HPRT ratio and the LPK/HPRT
ratio thus averaged 33.6±10.4 (n=8; P<0.02).
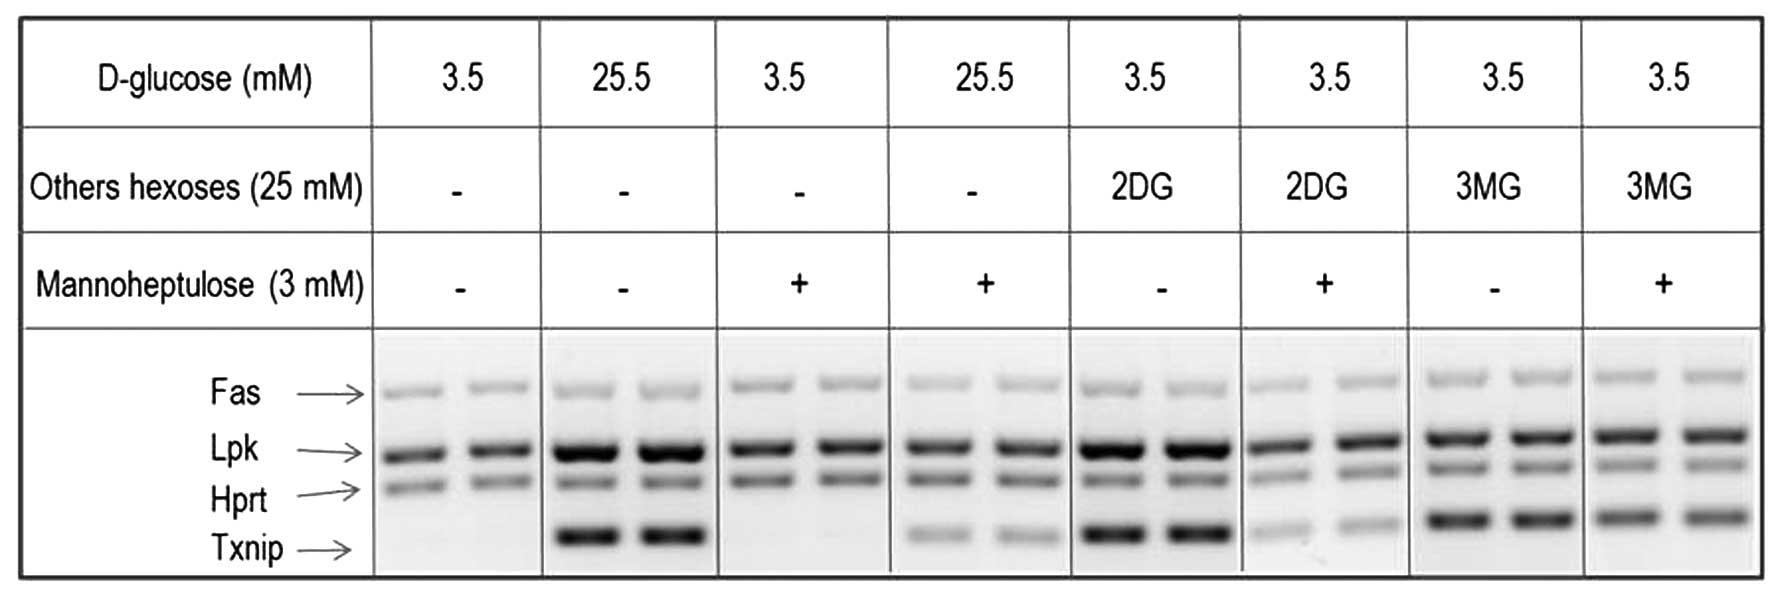
This study also aimed to investigate the effect of
D-mannoheptulose on the increase in the TXNIP/HPRT and LKP/HPRT
ratios provoked in INS1E cells by a rise in D-glucose concentration
or the addition of 2-DG and 3-MG.
In INS1E cells incubated at a low D-glucose
concentration (3.5 mM), D-mannoheptulose (3.0 mM) did not
significantly affect the TXNIP/HPRT ratio [10.5±1.8 (n=13) in the
control cells and 10.4±1.8 (n=10) in the cells exposed to
D-mannoheptulose]. However, following incubation at a high
concentration of D-glucose (25.0 mM), D-mannoheptulose (3.0 mM)
decreased the TXNIP/HPRT ratio from a control value of 174.2±11.0
(n=25) to 58.5±6.3 (n=18; P<0.001). In INS1E cells incubated at
a low concentration of D-glucose (3.5 mM) in the presence of 2-DG
(25.0 mM), D-mannoheptulose (3.0 mM) decreased the TXNIP/HPRT ratio
from a control value of 101.3±9.9 (n=9) to 48.3±5.1 (n=16;
P<0.001). By contrast, D-mannoheptulose (3.0 mM) did not
significantly affect the TXNIP/HPRT ratio in INS1E cells incubated
at a low concentration of D-glucose (3.5 mM) in the presence of
3-MG (25.0 mM), [mean control value, 141.8±20.0 (n=10);
experimental value, 135.7±17.7 (n=14; P>0.82)].
The increase in the TXNIP/HPRT ratio above the
paired basal value (resulting from either a rise in D-glucose
concentration or the presence of 2-DG) in the absence/presence of
D-mannoheptulose was compared within each experiment. The relative
magnitude of the heptose (D-mannoheptulose) inhibitory action did
not significantly differ (P>0.19) between the response to the
increase in D-glucose concentration (relative decrease, 64.3±4.7%;
df=41) or in the presence of 2-DG (relative decrease, 53.5±7.0%;
df=19; Fig. 5).
The LKP/HPRT ratio recorded in INS1E cells incubated
at the low D-glucose concentration (3.5 mM) was almost identical in
the absence or presence (3.0 mM) of D-mannoheptulose [152.3±9.4
(n=21) and 155.1±12.9 (n=10), respectively]. Following incubation
at a high D-glucose concentration (25.0 mM), the increase in the
LKP/HPRT ratio compared with the mean corresponding basal value in
the same experiment at a low concentration of hexose (3.5 mM)
averaged 101.4±5.7 (n=25) in the absence and 5.8±3.8 (n=18;
P>0.15 versus zero) in the presence of D-mannoheptulose. This
indicated that D-mannoheptulose abolished the effect of a rise in
D-glucose concentration (i.e., an increased LKP/HPRT ratio). The
significant increase in the LPK/HPRT ratio (by 37.8±7.3; n=9;
P<0.001) induced by 2-DG (25.0 mM) was abolished in the presence
of D-mannoheptulose, averaging at an LPK/HPRT ratio of 14.0±10.2
(n=16; P>0.19 versus zero). In contrast to the converging
observations thus far, the mean increases in the LKP/HPRT ratio
induced by 3-MG (25.0 mM) did not decrease in the presence of
D-mannoheptulose, with an overall mean value, 21.4±9.4 (n=28;
P<0.04 versus zero). When compared within the same experiments,
the absolute value for the LPK/HPRT ratio in INS1E cells exposed to
3-MG (25.0 mM) averaged 156.5±11.7 and 154.2±17.8 (n=12 in both
cases) following incubation in the absence and presence of
D-mannoheptulose, respectively (data not shown).
D-glucose and 3-O-methyl-D-glucose
phosphorylation
Liver cell homogenates
In a series of five experiments, the phosphorylation
of D-[U-14C]glucose (25.0 mM) by rat liver cell
homogenates averaged 91.5±9.7 pmol/μg wet weight per 60 min (n=16).
As shown in Table II, the
phosphorylation was ~4 times lower at 3.5 mM than at 25.0 mM
D-glucose, and was not significantly affected by the presence of
3-MG (25.0 mM) in the assay medium.
| Table IIPhosphorylation of
14C-labeled D-glucose and 3-MG by rat liver and INS1E
cell homogenates. |
Table II
Phosphorylation of
14C-labeled D-glucose and 3-MG by rat liver and INS1E
cell homogenates.
| Hexose
(concentration, mM) | Liver | INS1E |
|---|
|
D-[U-14C]glucose (3.5) | 25.4±1.7 (12) | 24.1±1.2 (9) |
|
D-[U-14C]glucose (3.5) + 3-MG
(25.0) | 24.9±1.8 (12) | 20.9±0.9 (9) |
|
D-[U-14C]glucose (25.0) | 100.0±0.7 (16) | 100.0±1.7 (8) |
|
D-[U-14C]glucose (25.0) + 3-MG
(25.0) | 98.1±0.9 (12) | 93.9±1.7 (10) |
|
14C-labeled 3-MG (25.0) | 6.9±0.5 (17) | −0.5±2.6 (16) |
|
14C-labeled 3-MG (25.0) +
D-glucose (25.0) | 7.0±0.6 (12) | −1.2±1.5 (16) |
Phosphorylation of 14C-labeled 3-MG (25.0
mM) was observed in each of the five experiments, averaging at
6.85±0.52% (n=17) relative to the mean corresponding value observed
within the same experiment in the presence of
D-[U-14C]glucose (also 25.0 mM). The phosphorylation of
14C-labeled 3-MG (25.0 mM) was significantly increased
in the presence of 25.0 mM D-glucose, averaging at 117.8±3.8%
(n=12) compared with the mean corresponding values in the absence
of D-glucose (100.0±4.3%; n=12; P<0.004).
The phosphorylation of 14C-labeled 3-MG
was also observed in intact hepatocytes. Intact hepatocytes
(0.4×10⁶ cells/sample) were first incubated for 120 min
at 37°C in 120 μl salt-balanced medium (18) containing bovine serum albumin (1.0
mg/ml), 14C-labeled 3-MG (25.0 mM) and, when required,
25.0 mM D-glucose. Iced H2O (1.0 ml) was added to each
sample and, following centrifugation for 3 min at 1,000 × g, the
supernatant solution was analyzed for its radioactive acidic
metabolite content. The results (expressed as 3-MG-equivalent)
averaged 6.42±0.50 (n=4) and 7.19±0.88 (n=5) pmol/103
cells per 60 min in the absence and presence of D-glucose (25.0
mM), respectively. Assuming a wet weight of 6.46 μg per
103 hepatocytes (19),
the mean results were not significantly different from one another
(P>0.5) and would correspond to 1.06±0.04 pmol/μg wet weight per
60 min (n=9), which is distinct from 7.24±1.16 pmol/μg wet weight
per 60 min (n=17) for the phosphorylation of 14C-labeled
3-MG (25.0 mM) by liver homogenates (P<0.001).
INS1E cell homogenates
In a series of three experiments, the
phosphorylation of D-glucose (25.0 mM) by INS1E cell homogenates
averaged 55.8±2.1 pmol/103 cells per 60 min (n=8).
Assuming a wet weight of ~1.5 μg/103 cells (20), the phosphorylation rate would
correspond to 37.2±1.4 pmol/μg wet weight per 60 min compared with
91.5±9.7 pmol/μg wet weight per 60 min in liver homogenates (n=16).
As indicated in Table II,
relative to this reference value, the results observed at 3.5 mM
D-glucose (in the absence or presence of 25.0 mM 3-MG) and at 25.0
mM D-glucose (in the presence of 25.0 mM 3-MG) were similar in
INS1E and liver cell homogenates. However, in the INS1E cell
homogenates, 3-MG (25.0 mM) significantly decreased the D-glucose
phosphorylation at 3.5 and 25.0 mM D-glucose. Thus, at 3.5 mM
D-glucose, 3-MG (25.0 mM) significantly decreased the D-glucose
phosphorylation by INS1E cell homogenates to 87.0±2.9% (n=9)
compared with that of the mean corresponding value in the absence
of 3-MG (100.0±1.7%; n=9; P<0.003). At 25.0 mM D-glucose, 3-MG
(25.0 mM) significantly decreased the phosphorylation of D-glucose
by INS1E cell homogenates to 93.0±1.7% (n=10) compared with that of
the corresponding control values (100.0±1.7%; n=10;
P<0.025).
No significant phosphorylation of
14C-labeled 3-MG (25.0 mM) by INS1E cell homogenates was
observed (Table II). Thus, in a
series of four experiments, the absolute values in the absence
(n=16) or presence (n=16) of D-glucose (25.0 mM) were not
significantly different from one another and averaged −0.15±1.01
pmol/103 cells per 60 min.
Rat pancreatic islet cell
homogenates
At a concentration of 25.0 mM, the phosphorylation
of D-[U-14C]glucose by rat pancreatic islet homogenates
averaged 650±12 and 612±15 pmol/islet per 60 min (n=5) in the
absence and presence of 3-MG (25.0 mM), respectively. Although
these values were not significantly different (P<0.08), the
values in the presence and absence of 3-MG (94.2±2.3 and
100.0±1.8%, respectively; n=5 for both) were similar to those
observed in the INS1E cell homogenates (93.0±1.7%; n=10;
P>0.68). In addition, assuming a mean islet volume of ~6.05±0.19
nl/islet (21), the
phosphorylation of D-[U-14C]glucose (25.0 mM) by islet
cell homogenates would correspond, at the most, to 107.4±2.0
pmol/μg wet weight per 60 min (n=5). This value is similar to that
observed in liver homogenates under the same experimental
conditions (91.5±9.7 pmol/μg wet weight per 60 min; n=15;
P>0.37).
In the same experiment, regardless of the
absence/presence of 25.0 mM D-glucose, no sizeable phosphorylation
of 14C-labeled 3-MG (25.0 mM) was observed (overall mean
value, −4.82±4.82 pmol/islet per 60 min; n=10).
D-[5-3H]glucose
utilization
In intact INS1E cells, the utilization of
D-[5-3H]glucose, expressed as pmol/103 cells
per 90 min, increased progressively as the concentration of the
hexose (D-glucose) was raised from 3.5 to 25.0 mM (Table III). The latter value (i.e.,
42.7±3.9 pmol/103 cells per 60 min) was similar to, but
marginally lower than the rate of D-glucose phosphorylation by
INS1E cell homogenates recorded at the same D-glucose concentration
(25.0 mM; 55.8±2.1 pmol/103 cells per 60 min; n=8;
P<0.04). Whilst 2-DG (20.0–25.0 mM) decreased
D-[5-3H]glucose utilization to 56.2±3.4% (n=9;
P<0.001) relative to the paired control value, 3-MG (20.0–25.0
mM) did not significantly affect the generation of 3HOH from
D-[5-3H]glucose, averaging at 100.6±8.0% (n=9) of the
paired control value. In the presence of 2-DG or 3-MG, the
percentages were not significantly different at low or high
D-glucose concentrations.
| Table IIID-[5-3H]glucose
utilization by INS1E cells. |
Table III
D-[5-3H]glucose
utilization by INS1E cells.
|
D-[5-3H]glucose utilization,
pmol/103 cells per 90 min (n) |
|---|
|
|
|---|
| 3.5 D-glucose
(mM) | 10.0 D-glucose
(mM) | 20.0 D-glucose
(mM) | 25.0 D-glucose
(mM) |
|---|
| Control | 7.2±2.1 (3) | 19.8 (1) | 34.5 (1) | 64.0±5.8 (2) |
| + 2-DG (20–25
mM) | 3.8±1.3 (3)a | 11.3 (1) | 18.1 (1) | 39.9±5.3
(2)a |
| + 3-MG (20–25
mM) | 7.1±1.4 (3)a | 20.5 (1) | 27.0 (1) | 60.8±9.0
(2)a |
Discussion
In the present study, an increase in the D-glucose
concentration augmented the TXNIP/HPRT and LPK/HPRT ratios in
hepatocytes. The incorporation of 2-DG or 3-MG in the incubation
medium also augmented the TXNIP/HPRT ratio, but not the LPK/HPRT
ratio in hepatocytes. In INS1E cells, the TXNIP/HPRT and LPK/HPRT
ratios were increased in response to either a rise in D-glucose
concentration or to the presence of 2-DG or 3-MG in the incubation
medium. This is in agreement with previous studies (2–4,6,10,11);
however, Dentin et al(7)
did not observe a stimulatory effect of 3-MG on ChoRE luciferase
activity in HepG2 hepatoma cells. Additionally, consistent with
previous studies (4),
D-mannoheptulose impaired the response of INS1E cells to an
increase in D-glucose concentration or the presence of 2-DG in the
incubation medium, although it did not affect the response to
3-MG.
The results demonstrated that the regulation of the
LPK gene expression by 2-DG and 3-MG was markedly different in
liver and INS1E cell homogenates, indicating cell specificity in
terms of the response of the same gene to selected carbohydrates.
The results also suggested that the molecular determinants involved
in the response to D-glucose and 2-DG differed from those involved
in the response to 3-MG. This was clearly demonstrated by the
contrasting effects of D-mannoheptulose on the TXNIP/HPRT and
LPK/HPRT ratios in INS1E cells exposed to either 2-DG or 3-MG.
However, this difference does not oppose the suggestion that
D-glucose or 2-DG and 3-MG regulate gene transcription by two
pathways that eventually converge at a common ChoRE (3,4).
Moreover, when comparing the effects of 2-DG and
3-MG on the TXNIP/HPRT and LPK/HPRT ratios in INS1E cells, a
statistically significant difference was observed in the paired
increments above the basal value. In the TXNIP/HPRT ratio, the mean
increase was higher in the cells exposed to 3-MG than in those
exposed to 2-DG, whilst the opposite was observed for the LPK/HPRT
ratio. The two pathways postulated to be involved in the response
to 2-DG and 3-MG may thus differentially affect the expression of
distinct genes.
In the experiment conducted in intact hepatocytes,
D-glucose (25.0 mM) did not significantly increase the
phosphorylation of 14C-labeled 3-MG (25.0 mM), as
determined by the recovery of radioactive acidic metabolites in the
supernatant medium. Furthermore, the ratio between the mean values
recorded under these experimental conditions in the
presence/absence of unlabeled D-glucose was 112.0%, which was not
significantly different from that observed in the liver cell
homogenates (117.8±3.8%; n=12; P>0.17).
A close similarity between liver and INS1E cell
homogenates with regard to the relative magnitude of the increment
in the D-glucose phosphorylation rate attributable to a rise in the
concentration of D-glucose from 3.5 to 25.0 mM was identified
(Table II). This is consistent
with a predominant role of glucokinase under the present
experimental conditions.
Two differences were observed when comparing the
results obtained in liver and INS1E cell homogenates, respectively.
First, in INS1E cell homogenates, unlike in liver cell homogenates,
3-MG (25.0 mM) significantly decreased D-glucose phosphorylation at
3.5 and 25.0 mM concentrations of D-glucose. In a previous study, a
marginal inhibitory effect of 3-MG (80.0 mM) on the phosphorylation
of D-glucose (16.7 mM) was observed in the presence of human β-cell
glucokinase (6.1±0.9% inhibition) (22). Under the same experimental
conditions, the relative extent of the inhibition was greater in
rat pancreatic islet homogenates (13.7±1.3% inhibition), which
express low-Km hexokinase and glucokinase activity (16). In the present study, the relative
magnitude of the decrease in D-glucose phosphorylation caused by
3-MG (25.0 mM) in INSE1 cell homogenates was not significantly
different (P>0.3) at either the low or high concentration of
D-glucose, with an overall mean value of 10.0±2.1% (df=36) This
suggested that the phosphorylation of D-glucose was catalyzed under
these experimental conditions predominantly, if not exclusively, by
glucokinase. The 3-MG-induced negative cooperativity of D-glucose
phosphorylation by the glucokinase present in insulin-producing
cells is similar to that of other sugars, including
2-deoxy-2-fluoro-D-glucose, D-mannoheptulose and D-xylose which, in
sharp contrast to D-glucose, D-mannose and 2-deoxy-D-glucose, do
not act as stimulators, but instead as inhibitors of D-fructose
phosphorylation by human β-cell glucokinase (23).
Second, liver cell homogenates, but not INS1E cell
homogenates, catalyzed the phosphorylation of 3-MG (25.0 mM).
Moreover, D-glucose (25.0 mM) significantly increased the
phosphorylation of 14C-labeled 3-MG (25.0 mM) by liver
homogenates. In a previous study, it was already demonstrated that
3-O-[14C]methyl-D-glucose (2.5 to 12.0 mM) was not
phosphorylated by human β-cell glucokinase (22). These results are reminiscent of
those of the glucose-induced positive cooperativity of D-fructose
phosphorylation by glucokinase (23,24).
Incidentally, It was previously demonstrated that 3-MG (6.0 mM) did
not reproduce the action of D-glucose (also 6.0 mM) in increasing
the phosphorylation of D-fructose by human β-cell glucokinase
(24).
The differences between liver and INS1E cell
homogenates are concurrent with the suggestion that the intrinsic
properties of glucokinase differ in the liver compared with
pancreatic islet cells (25).
Mutated forms of human β-cell glucokinase may also differ from the
wild-type enzyme in terms of the effects of D-glucose upon
D-fructose phosphorylation (23),
in a manner comparable to that observed here when comparing the
potential involvement of liver versus INS1E cell homogenates in
terms of their capacity to catalyze the phosphorylation of
3-MG.
The present results further document that the
response of glucose-regulated genes in INS1E cells to 2-DG or 3-MG
is not attributable to any favorable effect of these glucose
analogs on the catabolism of D-glucose itself.
In conclusion, taken as a whole, the results of the
present study reinforce the view that 3-MG phosphorylation is not
involved in the upregulation of the expression of
glucose-responsive genes in rat hepatocytes or INS1E cells. It may
be speculated, in light of previous findings and the present
findings, that two or more pathways lead to the activation of
ChoRE, resulting in changes of variable relative magnitude in the
mRNA expression of distinct glucose-responsive genes in the same or
different cell types. In a recent study (26), it was proposed that, even in the
case of glucose-induced gene expression, further investigation is
required to understand the involvement of distinct potential
mediators in pancreatic insulin-producing cells, as well as in rat
primary hepatocytes.
Acknowledgements
This study was supported by funding from the Belgian
Foundation for Scientific Medical Research (grant nos. 3.4520.07 to
A.S. and 3.4548.07 to M.S.).
References
|
1
|
Hotta M, Tashiro F, Ikegami H, Niwa H,
Ogihara T, Yodoi J and Miyazaki J: Pancreatic beta cell-specific
expression of thioredoxin, an antioxidative and antiapoptotic
protein, prevents autoimmune and streptozotocin-induced diabetes. J
Exp Med. 188:1445–1451. 1998. View Article : Google Scholar : PubMed/NCBI
|
|
2
|
Shalev A, Pise-Masison CA, Radonovich M,
Hoffmann SC, Hirshberg B, Brady JN and Harlan DM: Oligonucleotide
microarray analysis of intact human pancreatic islets:
identification of glucose-responsive genes and a highly regulated
TGFbeta signaling pathway. Endocrinology. 143:3695–3698. 2002.
View Article : Google Scholar
|
|
3
|
Minn AH, Hafele C and Shalev A:
Thioredoxin-interacting protein is stimulated by glucose through a
carbohydrate response element and induces beta-cell apoptosis.
Endocrinology. 146:2397–2405. 2005. View Article : Google Scholar : PubMed/NCBI
|
|
4
|
Minn AH, Couto FM and Shalev A:
Metabolism-independent sugar effects on gene transcription: the
role of 3-O-methylglucose. Biochemistry. 45:11047–11051. 2006.
View Article : Google Scholar : PubMed/NCBI
|
|
5
|
Havula E and Hietakangas V: Glucose
sensing by ChREBP/MondoA-Mlx transcription factors. Semin Cell Dev
Biol. 23:640–647. 2012. View Article : Google Scholar : PubMed/NCBI
|
|
6
|
Stoltzman CA, Kaadige MR, Peterson CW and
Ayer DE: MondoA senses non-glucose sugars: regulation of
thioredoxin-interacting protein (TXNIP) and the hexose transport
curb. J Biol Chem. 286:38027–38034. 2011. View Article : Google Scholar : PubMed/NCBI
|
|
7
|
Dentin R, Tomas-Cobos L, Foufelle F,
Leopold J, Girard J, Postic C and Ferré P: Glucose 6-phosphate,
rather than xylulose 5-phosphate, is required for the activation of
ChREBP in response to glucose in the liver. J Hepatol. 56:199–209.
2012. View Article : Google Scholar : PubMed/NCBI
|
|
8
|
Diaz-Moralli S, Ramos-Montoya A, Marin S,
Fernandez-Alvarez A, Casado M and Cascante M: Target metabolomics
revealed complementary roles of hexose- and pentose-phosphates in
the regulation of carbohydrate-dependent gene expression. Am J
Physiol Endocrinol Metab. 303:E234–E242. 2012. View Article : Google Scholar : PubMed/NCBI
|
|
9
|
Arden C, Tudhope SJ, Petrie JL, Al-Oanzi
ZH, Cullen KS, Lange AJ, Towle HC and Agius L: Fructose
2,6-bisphosphate is essential for glucose-regulated gene
transcription of glucose-6-phosphatase and other ChREBP target
genes in hepatocytes. Biochem J. 443:111–123. 2012. View Article : Google Scholar : PubMed/NCBI
|
|
10
|
Chen J, Saxena G, Mungrue IN, Lusis AJ and
Shalev A: Thioredoxin-interacting protein: a critical link between
glucose toxicity and beta-cell apoptosis. Diabetes. 57:938–944.
2008. View Article : Google Scholar : PubMed/NCBI
|
|
11
|
Cha-Molstad H, Saxena G, Chen J and Shalev
A: Glucose-stimulated expression of Txnip is mediated by
carbohydrate response element-binding protein, p300, and histone H4
acetylation in pancreatic beta cells. J Biol Chem. 284:16898–16905.
2009. View Article : Google Scholar : PubMed/NCBI
|
|
12
|
Gatley SJ, Holden JE, Halama JR, DeGrado
TR, Bernstein DR and Ng CK: Phosphorylation of glucose analog
3-O-metyl-D-glucose by rat heart. Biochem Biophys Res Commun.
119:1008–1014. 1984. View Article : Google Scholar : PubMed/NCBI
|
|
13
|
Malaisse-Lagae F, Giroix MH, Sener A and
Malaisse WJ: Phosphorylation of 3-O-methyl-D-glucose by yeast and
beef hexokinase. FEBS Lett. 198:292–294. 1986. View Article : Google Scholar : PubMed/NCBI
|
|
14
|
Portois L, Maget B, Tastenoy M, Perret J
and Svoboda M: Identification of a glucose response element in the
promoter of the rat glucagon receptor gene. J Biol Chem.
274:8181–8190. 1999. View Article : Google Scholar : PubMed/NCBI
|
|
15
|
Seglen PO: Preparation of isolated rat
liver cells. Methods Cell Biol. 13:29–83. 1976. View Article : Google Scholar : PubMed/NCBI
|
|
16
|
Giroix MH, Sener A, Pipeleers DG and
Malaisse WJ: Hexose metabolism in pancreatic islets. Inhibition of
hexokinase. Biochem J. 223:447–453. 1984.PubMed/NCBI
|
|
17
|
Nadi AB, Olivares E and Malaisse WJ:
D-glucose metabolism in normal disperse islet cells and tumoral
INS-1 cells. Mol Cell Biochem. 210:167–172. 2000. View Article : Google Scholar : PubMed/NCBI
|
|
18
|
Malaisse WJ, Maggetto C, Leclercq-Meyer V
and Sener A: Interference of glycogenolysis with glycolysis in
pancreatic islets from glucose-infused rats. J Clin Invest.
91:432–436. 1993. View Article : Google Scholar : PubMed/NCBI
|
|
19
|
Ramirez R, Courtois P, Ladriere L, Kadiata
MM, Sener A and Malaisse WJ: Uptake of D-mannoheptulose by rat
erythrocytes, hepatocytes and parotid cells. Int J Mol Med.
8:37–42. 2001.PubMed/NCBI
|
|
20
|
Orecná M, Hafko R, Bacová Z, Podskocová J,
Chorvát D Jr and Strbák V: Different secretory response of
pancreatic islets and insulin secreting cell lines INS-1 and INS-1E
to osmotic stimuli. Physiol Res. 57:935–945. 2008.PubMed/NCBI
|
|
21
|
Sener A, Ladriere L and Malaisse WJ:
Assessment by D-[(3)H]mannoheptulose uptake of B-cell density in
isolated pancreatic islets from Goto-Kakizaki rats. Int J Mol Med.
8:177–180. 2001.
|
|
22
|
Sener A, Scruel O, Louchami K, Jijakli H
and Malaisse WJ: Inhibition of glucose-induced insulin release by
3-O-methyl-D-glucose: enzymatic, metabolic and cationic
determinants. Mol Cell Biochem. 194:133–145. 1999. View Article : Google Scholar : PubMed/NCBI
|
|
23
|
Moukil MA and Van Schaftingen E: Analysis
of the cooperativity of human beta-cell glucokinase through the
stimulatory effect of glucose on fructose phosphorylation. J Biol
Chem. 276:3872–3878. 2001. View Article : Google Scholar : PubMed/NCBI
|
|
24
|
Scruel O, Sener A and Malaisse WJ:
Glucose-induced positive cooperativity of fructose phosphorylation
by human B-cell glucokinase. Mol Cell Biochem. 175:263–269. 1997.
View Article : Google Scholar : PubMed/NCBI
|
|
25
|
Randle PJ: Glucokinase and candidate genes
for type 2 (non-insulin-dependent) diabetes mellitus. Diabetologia.
36:269–275. 1993. View Article : Google Scholar : PubMed/NCBI
|
|
26
|
Iizuka K, Wu W, Horikawa Y and Takeda J:
Role of glucose-6-phosphate and xylulose-5-phosphate in the
regulation of glucose-stimulated gene expression in the pancreatic
β cell line, INS-1E. Endocr J. 60:473–482. 2013.PubMed/NCBI
|