Introduction
Cancer stem cells (CSCs) have been demonstrated to
play a role in laryngeal carcinoma (1–4).
CD133 is a useful putative marker for CSCs in human laryngeal
tumors (1–4), as well as in other types of cancer
(5–8). Numerous studies have demonstrated
that CD133+ CSCs possess higher clonogenicity,
invasiveness and tumorigenesis compared with CD133−
cells (1–8). CD133+ cells are resistant
to standard chemotherapy (1,8) and
radiotherapy (5–7). However, whether CD133+
CSCs have distinct metabolic programs from the bulk of tumor cells
is not well established. Certain regulatory pathways, including the
Wnt (9), Notch (10), Hedgehog (11) and PI3K/Akt pathways (12), have been found to be important in
governing cell metabolism and energy sensing of CSCs.
Interest in the Warburg effect has escalated in
recent years due to the proven utility of FDG-PET for imaging
tumors in cancer patients and may be useful in disease diagnosis,
staging, restaging and therapy monitoring in numerous types of
cancer (13,14), and cervical metastasis of carcinoma
from an unknown primary tumor (14). The Warburg effect dictates that
cancer cells rely on glycolysis rather than oxidative
phosphorylation under aerobic conditions. In numerous cancer cells,
glucose is used mainly for the glycolytic pathway (15). Stem cells have been demonstrated to
express high levels of glycolytic enzymes and rely mostly on
glycolysis to meet their energy demands (16). Glucose is transported through cell
membranes by glucose transporters (Glut). Numerous studies
(17–20), including ours (21,22),
have revealed that Glut-1 is significant in malignant glucose
metabolism and that it may contribute to the increased FDG uptake.
However, studies of Glut-1 expression in CSCs are limited (6,23,24).
In CD133+ thyroid cancer, infantile hemangioma and
embryonal neoplasms of the central nervous system, Glut-1 exhibited
a higher expression than in CD133− cells. Thus, the role
of the Warburg effect and Glut-1 in CSCs requires further
study.
In our previous studies, we revealed a high Glut-1
expression in laryngeal carcinoma (25–27).
We also demonstrated that antisense Glut-1 may decrease glucose
uptake and inhibit the proliferation of Hep-2 cells. In the present
study, we investigated the proliferation of CD133+ Hep-2
cells and whether Glut-1 is expressed in laryngeal carcinoma
CD133+ Hep-2 cells.
Materials and methods
Cell culture
The laryngeal carcinoma Hep-2 cell line was
purchased from the Cell Research Institute of the Chinese Academy
of Sciences (Shanghai, China). Hep-2 cells were cultured in
Dulbecco’s modified Eagle’s medium (Gibco-BRL, Gaithersburg, MD,
USA) containing 10% heat-inactivated fetal bovine serum (FBS;
Hyclone, Logan, UT, USA), 2 mM L-glutamine, 100 U/ml penicillin and
100 g/ml streptomycin at 37°C in a 5% CO2 atmosphere.
Cells were trypsinized and harvested after reaching 80–90%
confluence. The study was approved by the Ethics Committee of he
First Affiliated Hospital, College of Medicine, Zhejiang
University.
Detection of CD133 expression in Hep-2
cells by real-time reverse transcription-polymerase chain reaction
(RT-PCR)
Cells were homogenized in TRIzol reagent
(Invitrogen, Carlsbad, CA, USA). Total RNA was extracted from cells
according to the manufacturer’s instructions. The concentration of
total RNA was measured by ultraviolet spectrophotometry; an optical
density (OD) 260/280 ratio between 1.8 and 2.0 was deemed to be
acceptably pure. Reverse transcription was performed according to
the manufacturer’s instructions. Briefly, l μg of total RNA and the
Moloney Murine Leukemia Virus (MMLV) reverse transcriptase
(Fermentas, Burlington, Canada) in a 20 μl reaction volume
consisting of 0.5 μg/μl of oligo d(T) primer, 1 μl of random
primers (0.2 μg/μl) and 10 μl of DEPC-H2O. The reaction
mix was first pre-denatured at 65°C for 10 min. Following the
addition of 200 U M-MLV reverse transcriptase (Fermentas), the
samples were incubated at 42°C for 1 h and annealed at 70°C for 10
min. The synthesized cDNA was used as a template for real-time
fluorescent quantitative PCR using the fluorescent dye SYBR Green
and the Eppendorf Realplex 4 real-time PCR system (Eppendorf,
Hamburg, Germany). The 20 μl reaction mixture consisted of 10 μl of
2X SYBR Green, 1 μl of template, 1 μl of upstream and downstream
specific primers and 8 μl of deionized water. The reaction mixture
was pre-denatured at 95°C for 2 min, followed by 40 cycles at 95°C
for 15 sec, 59°C for 20 sec and 72°C for 20 sec. Each primer sample
was run in triplicate. The primers used were as follows:
CD133-forward (F): CACTTACGGCACTCTTCACCTG; CD133-reverse (R):
CCAGTCTGAGCCAAGTAGCTGTC. Glyceraldehyde 3-phosphate dehydrogenase
(GAPDH) was used as an internal standard for data calibration
(GAPDH-F: GGGTGTGAACCATGAGAAGTATG; GAPDH-R: GATGGCATGGACTGTGGTCAT).
The lengths of the PCR products were 213 (CD133) and 145 bp
(GAPDH).
To distinguish between specific and non-specific
products and primer dimers, dissociation curve analysis was
conducted immediately following amplification by continuous
monitoring of the SYBR Green I fluorescence signal at temperatures
between 60 and 95°C. For calculation of differential gene
expression, the 2−ΔΔCt formula was used.
Flow cytometry (FCM) and
fluorescence-activated cell sorting (FACS)
Cultured cells were trypsinized using 0.25% trypsin
and rinsed in phosphate-buffered saline (PBS). The cells were
centrifuged at 800 × g for 5 min and resuspended in up to 500 μl
PBS. Cell suspensions were incubated with phycoerythrin
(PE)-conjugated CD133 antibody in the dark for 30 min at room
temperature. During the reaction, vortexing was performed for 5
min. Following the reaction, the cells were rinsed with PBS and
resuspended in up to 400 μl PBS. Flow analysis was performed using
a FACS instrument (Becton-Dickinson, Mountain View, CA, USA).
CD133+ and CD133− cells were sorted.
CD133-sorted cell populations were again suspended in serum-free
medium (SFM; Sigma-Aldrich, St. Louis, MO, USA). The purities of
sorted CD133+ and CD133− cells were evaluated
by FCM.
Proliferation assays of CD133+
Hep-2 cells using the cell counting kit-8 (CCK-8) system
Cultured CD133+ and CD133−
Hep-2 cells were trypsinized using 0.25% trypsin. Cell
proliferation was measured using the CCK-8 system (Beyotime,
Nanjing, Jiangsu, China), according to the manufacturer’s
instructions. Briefly, 5×10³ CD133+ or
CD133− Hep-2 cells were seeded into 96-well culture
plates. Cells were cultured in SFM at 37°C. Following 1–6 days, 10
μl of CCK-8 reagent was added to each well and following 2 h of
incubation at 37°C, the absorbance was measured at 450 nm, using
the following formula: OD =
ODcell-ODblank.
Expression of Glut-1 mRNA in
CD133+ and CD133− Hep-2 cells by real-time
RT-PCR
Real-time RT-PCR was performed as described
previously. Briefly, CD133+ and CD133− Hep-2
cells were homogenized in TRIzol reagent (Invitrogen). Total RNA
was extracted from cells according to the manufacturer’s
instructions. Using l μg of total RNA and MMLV in a 20 μl reaction
volume, the reaction mix was first pre-denatured at 65°C for 10
min. Following the addition of 200 U MMLV, the samples were
incubated at 42°C for 1 h and annealed at 70°C for 10 min. The
synthesized cDNA was used as a template for real-time fluorescent
quantitative PCR. The 20 μl reaction mixture consisted of 10 μl of
2X SYBR Green, 1 μl of template, 1 μl of upstream and downstream
specific primers and 8 μl of deionized water. The reaction mixture
was pre-denatured at 95°C for 2 min, followed by 40 cycles at 95°C
for 15 sec, 59°C for 20 sec and 72°C for 20 sec. Experiments were
performed in triplicate and were repeated at least twice
independently. The primers used were as follows: Glut-1-forward
(F): CCGCAACGAGGAGAACCG; Glut-1-reverse: GTGACCTTCTTCTCCCGCATC.
GAPDH was used as an internal standard for data calibration
(GAPDH-F: GGGTGTGAACCATGAGAAGTATG; GAPDH-R: GATGGCATGGACTGTGGTCAT).
Dissociation curve analysis was conducted. For calculation of
differential gene expression, the 2−ΔΔ Ct formula was
used.
Glut-1 protein levels in
CD133+ and CD133− Hep-2 cells by western
blotting
Western blotting was performed as described
previously (26). The Glut-1 and
β-tubulin (as a control) protein in each group of Hep-2 cells were
assayed using a BAC protein quantitative kit (Wuhan Boster
Biological Technology Co. Ltd., Wuhan, Hubei, China). Briefly, 80
μg of protein was subjected to 10% sodium dodecyl
sulfate-polyacrylamide gel electrophoresis (SDS-PAGE) and
transferred onto a nitrocellulose membrane (Millipore, Billerica,
MA, USA). Skimmed milk (2%) was used as a blocking solution (room
temperature, 1 h). The membrane was incubated with the primary
antibody (Glut-1, 1:1,000; β-tubulin, 1:5,000) at room temperature
for 3 h and with the secondary antibody (1:5,000, donkey
anti-rabbit; 1:2,000, donkey anti-mouse) at room temperature for 1
h. The proteins were detected using an enhanced chemiluminescence
system (Santa Cruz Biotechnology, Inc., Santa Cruz, CA, USA) and
were exposed to X-ray film. Protein expression was analyzed
semi-quantitatively using the Kodak Gel Logic Analysis System
(Carestream Health Inc., Rochester, NY, USA).
Statistical analysis
Statistical analyses were performed using SPSS for
Windows, version 19.0. P<0.05 was considered to indicate a
statistically significant difference.
Results
Expression of CD133 in the Hep-2 cell
line
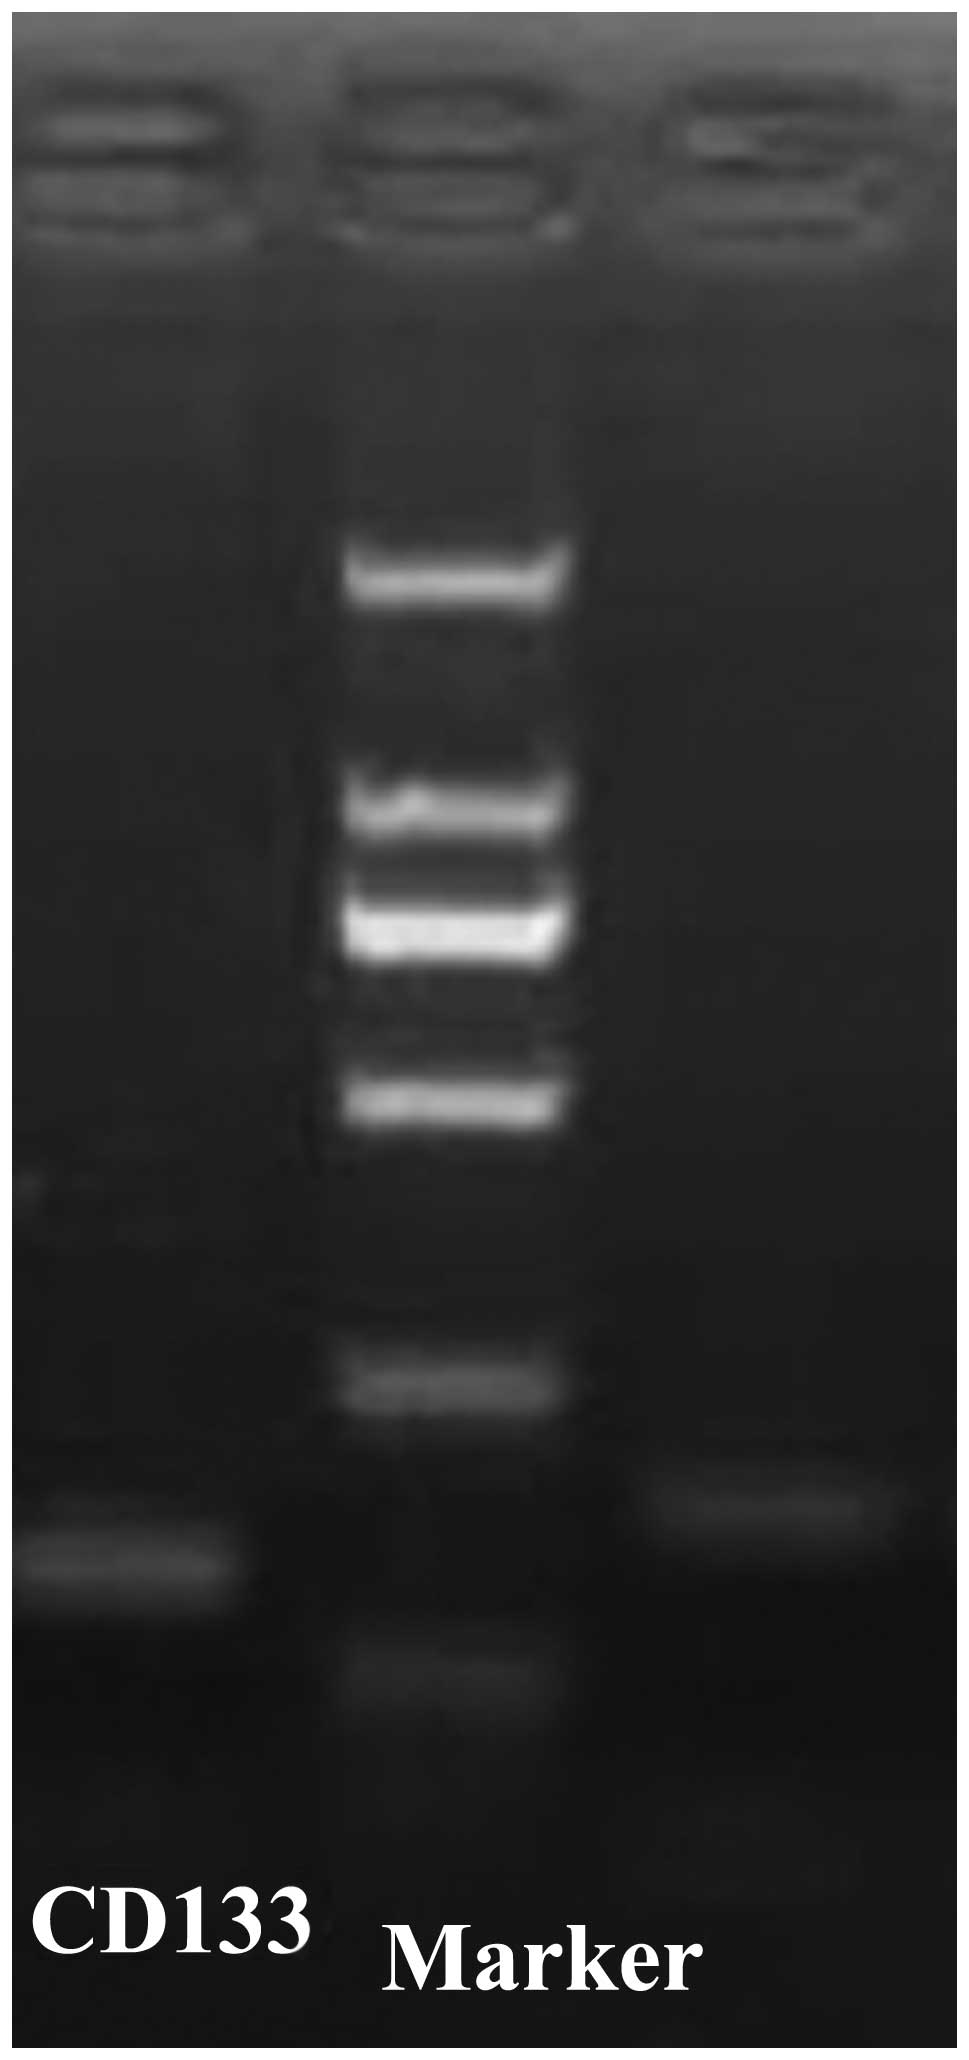
Real-time RT-PCR demonstrated that the sizes of the
CD133 and GAPDH PCR product were 213 and 145 bp, respectively
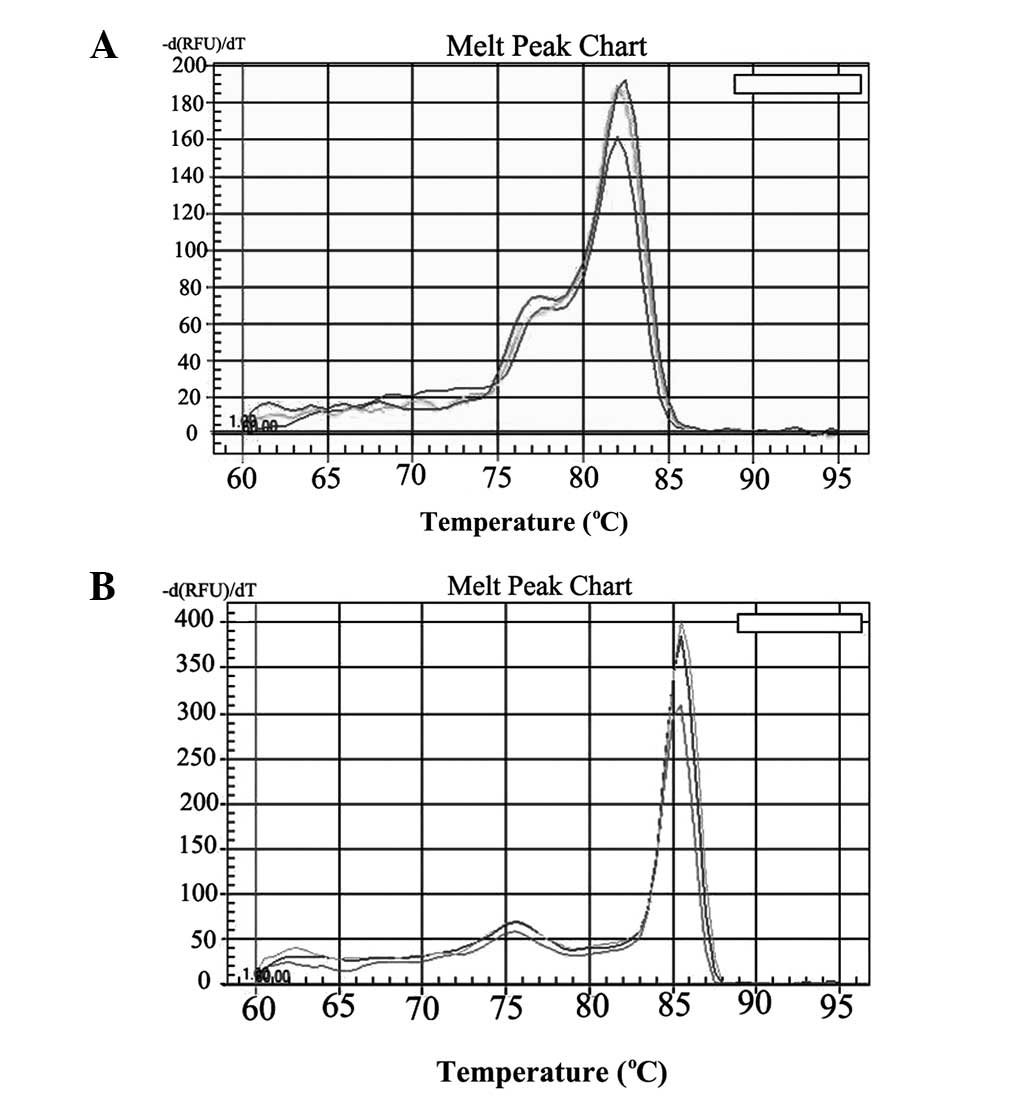
(Fig. 1). Dissociation curve
analysis performed between 60–95°C demonstrated only the expected
peaks at 82.1 and 85.1°C for CD133 and GAPDH, respectively
(Fig. 2). The analysis
demonstrated that each primer pair had sufficient specificity for
use in the present study of CD133 expression. The mean ΔCt of CD133
expression was 10.98.
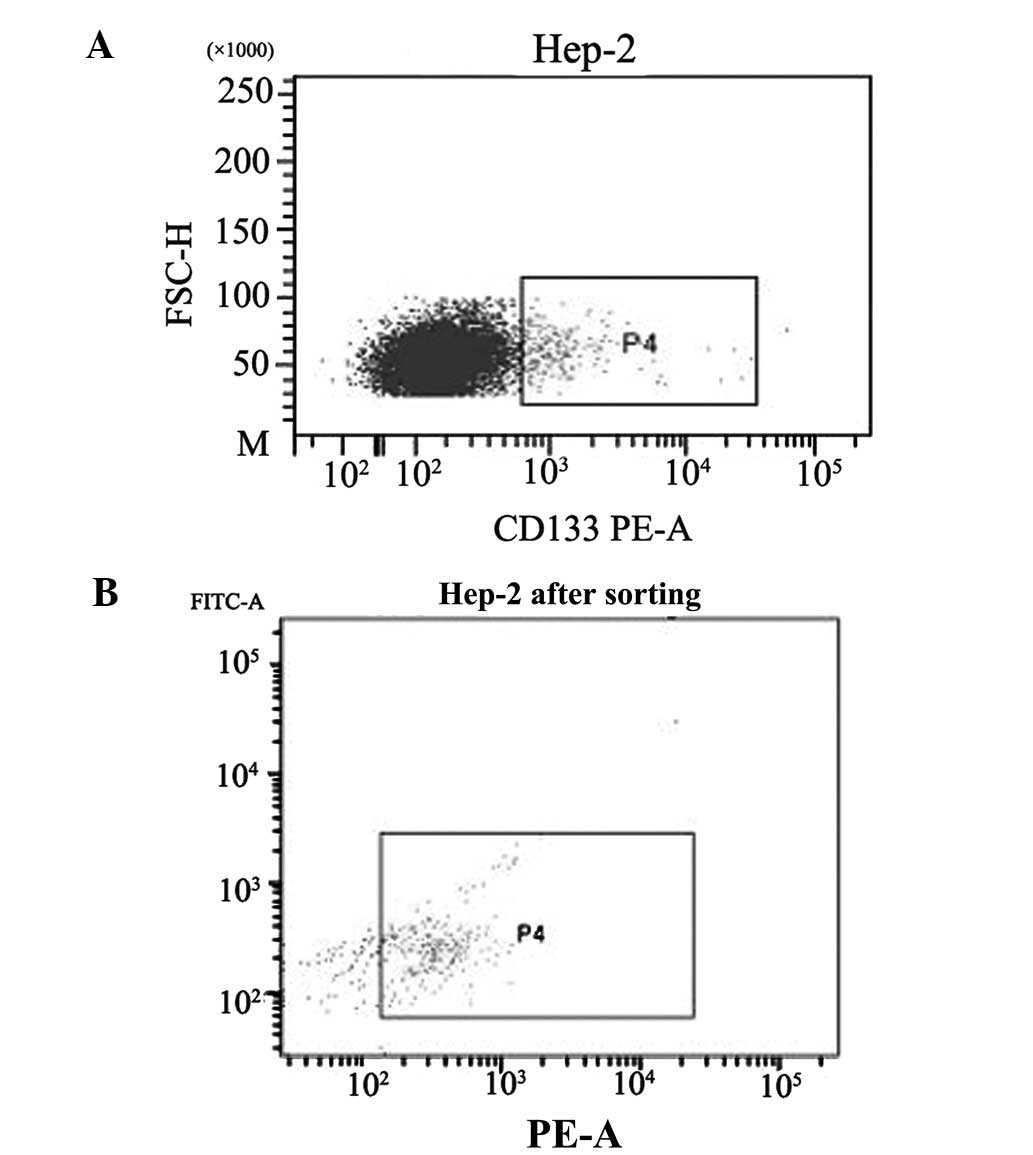
Detection of CD133+ Hep-2
cells by FCM
CD133 cells were isolated from the Hep-2 cell line
using FCM. To evaluate the efficiency of FCM, harvested cells were
subjected to FACS analysis. Prior to isolation, the
CD133+ fraction was 1.2%, which increased to 76.1%
following isolation (Fig. 3).
Successive tests also proved that cells grew well following
isolation.
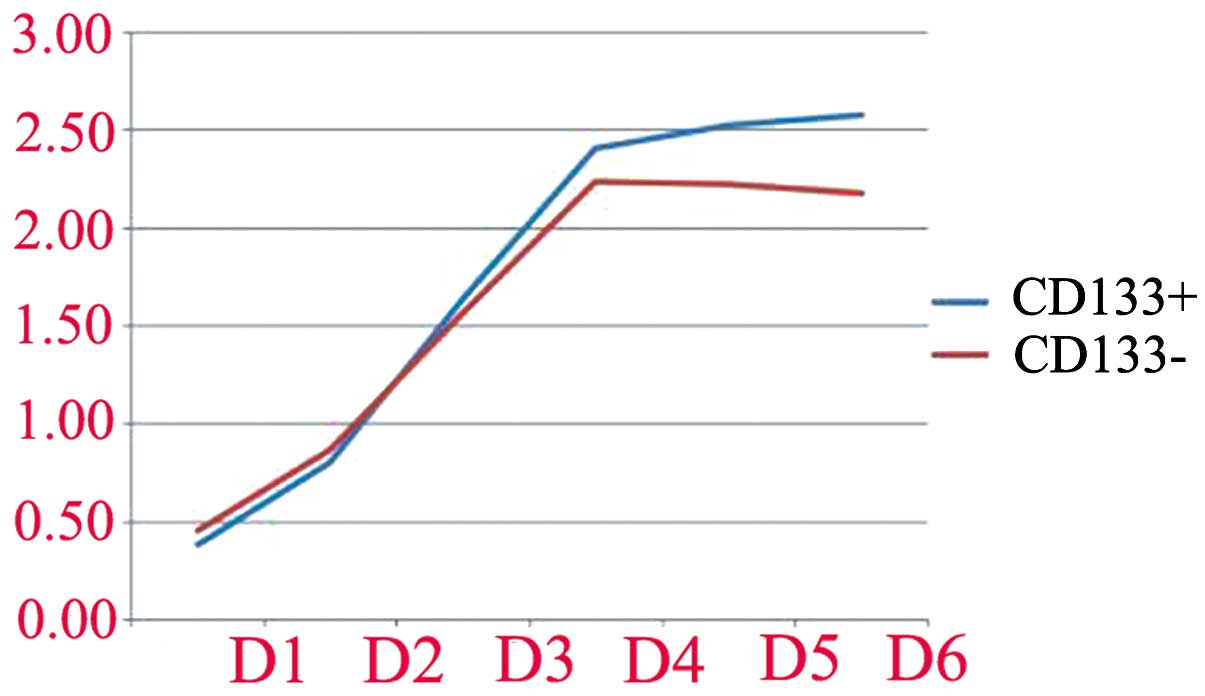
Proliferation of CD133+ Hep-2
cells
Following isolation, CD133+ and
CD133− cells were cultured separately in SFM.
Proliferation is displayed in Table
I and Fig. 4. The
proliferation of CD133+ and CD133− cells was
not different during the first 3 days (P>0.05). From day 4,
however, the proliferation capacity of CD133+ cells
in vitro was higher than that of CD133− cells
(P<0.05).
 | Table IUltraviolet absorption of
CD133+ cells and CD133− cells on days 1, 2,
3, 4, 5 and 6 (mean ± SD). |
Table I
Ultraviolet absorption of
CD133+ cells and CD133− cells on days 1, 2,
3, 4, 5 and 6 (mean ± SD).
| Day | CD133+
cells | CD133−
cells | P-value |
|---|
| 1 | 0.38±0.06 | 0.45±0.01 | P=0.18 |
| 2 | 0.81±0.05 | 0.87±0.03 | P=0.12 |
| 3 | 1.64±0.07 | 1.56±0,01 | P=0.11 |
| 4 | 2.43±0.06 | 2.24±0.05 | P=0.013 |
| 5 | 2.53±0.01 | 2.22±0.04 | P=0.000 |
| 6 | 2.57±0.03 | 2.17±0.06 | P=0.000 |
Glut-1 mRNA levels in CD133+
and CD133− Hep-2 cells
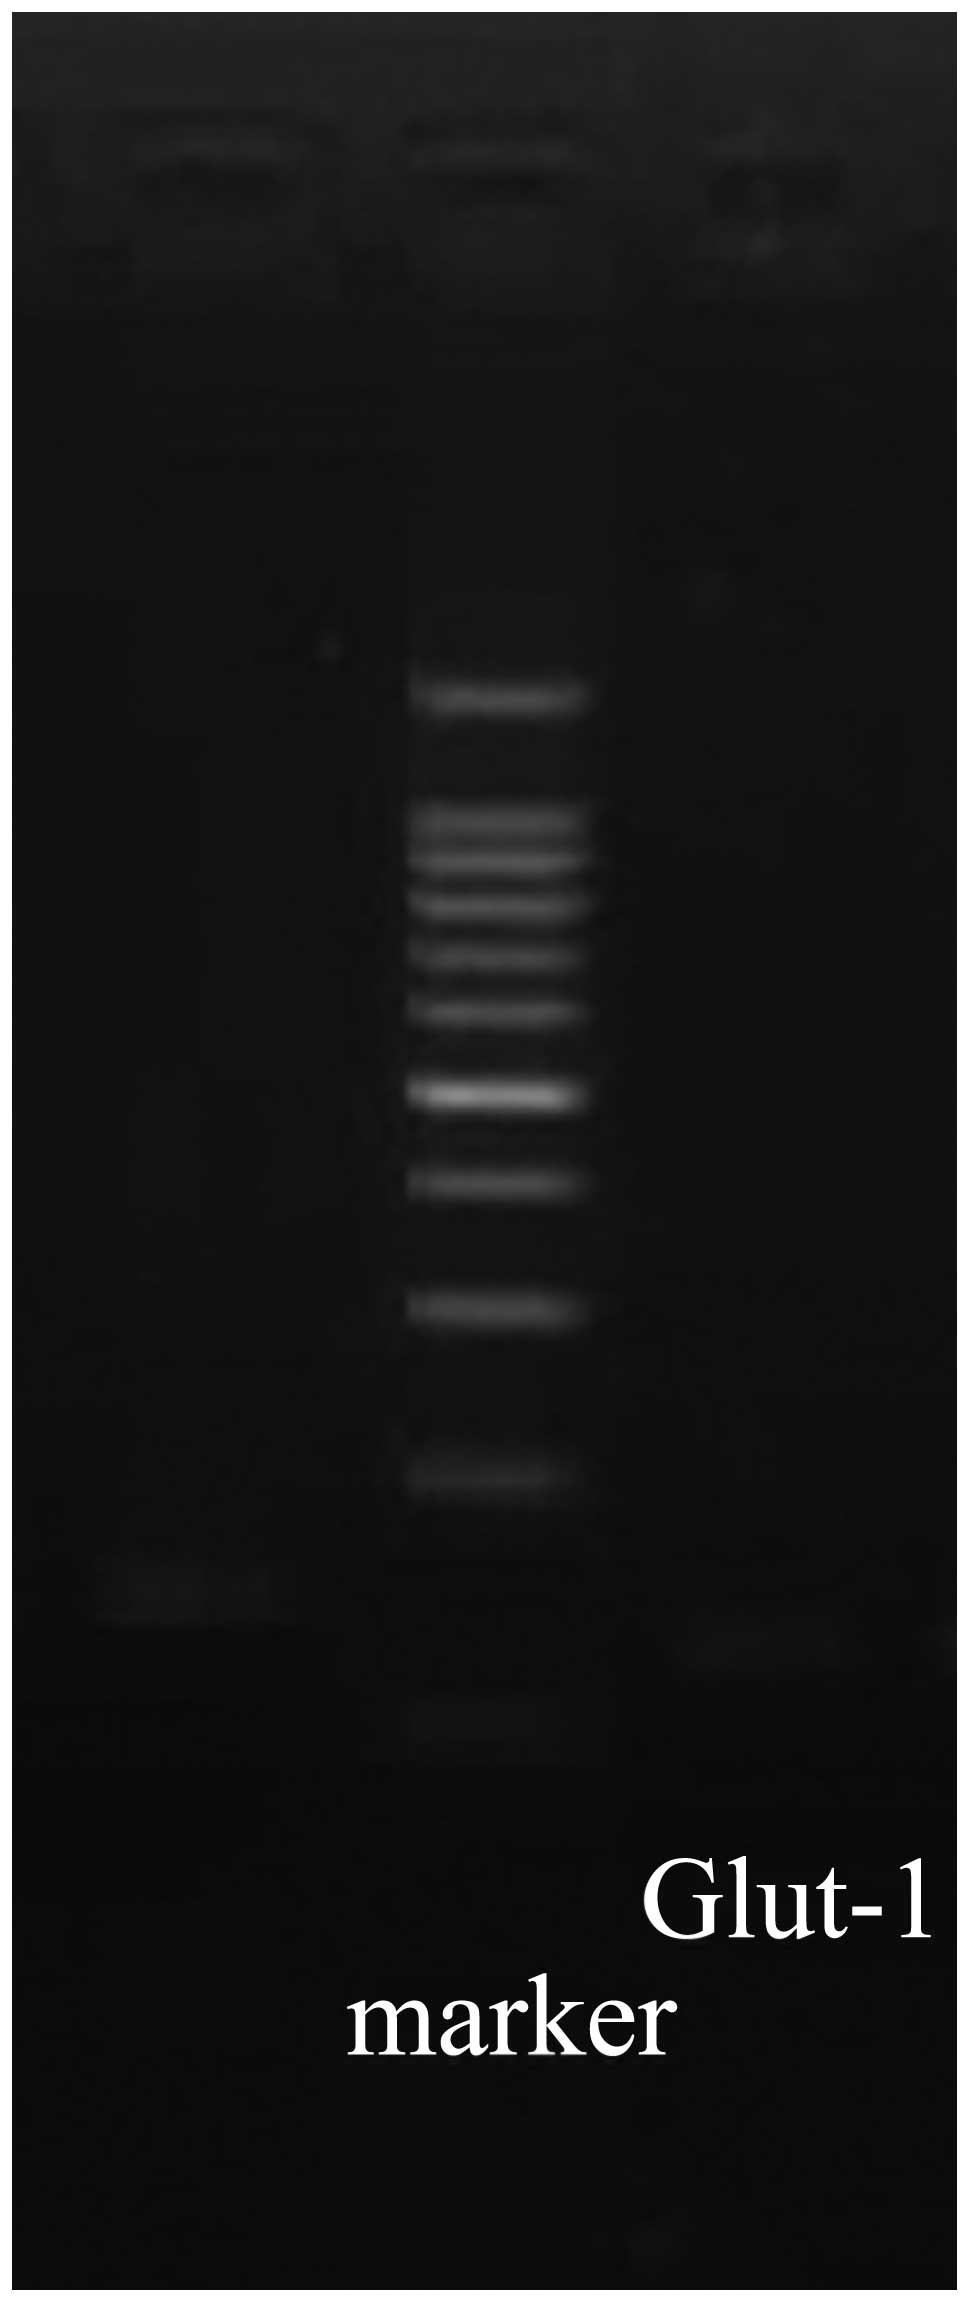
Real-time RT-PCR demonstrated that the sizes of the
Glut-1 and GAPDH PCR products were 123 and 145 bp, respectively
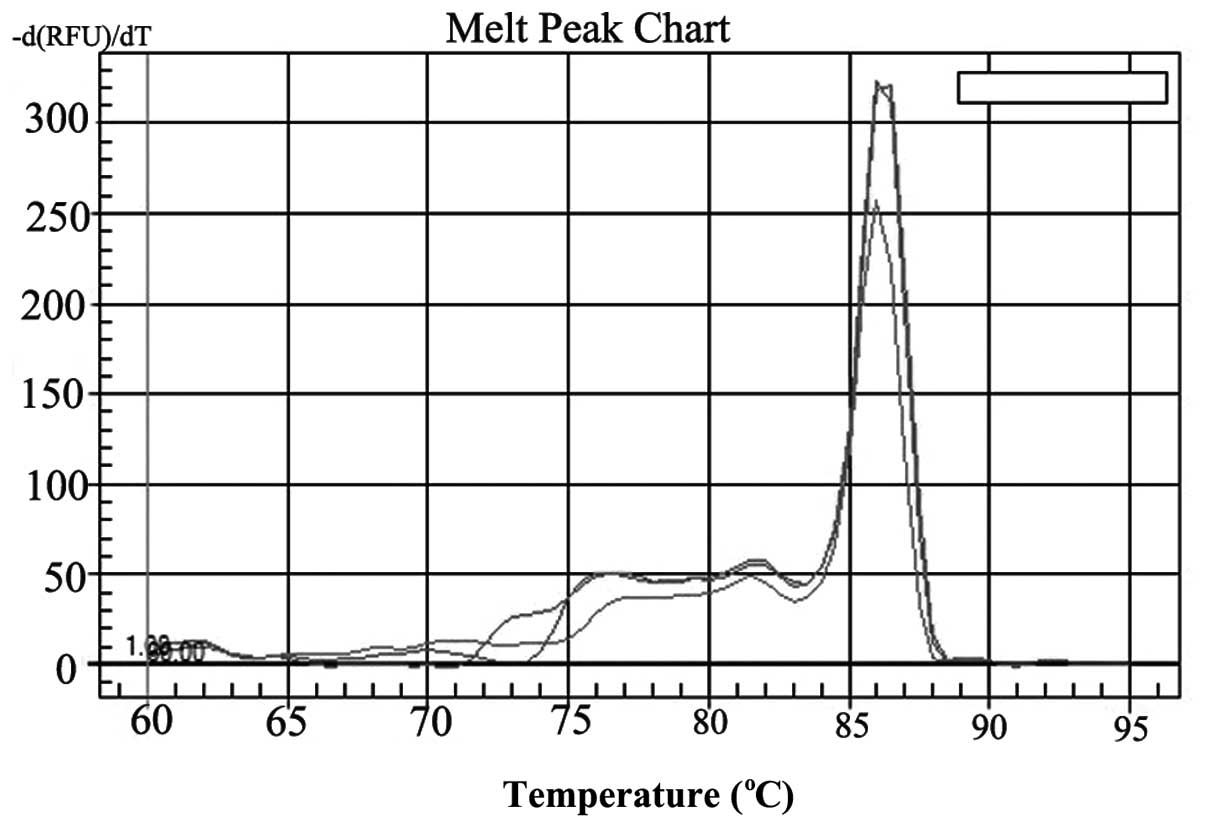
(Fig. 5). Dissociation curve
analysis performed between 60–95°C demonstrated only the expected
peaks at 86.2 and 85.1°C for Glut-1 and GAPDH mRNA, respectively
(Fig. 6). Thus, the analysis
demonstrated that each primer pair had sufficient specificity for
use in the present study of Glut-1 mRNA expression. The mean ΔCt of
Glut-1 mRNA expression in CD133+ cells was 1.78. The
mean ΔCt of Glut-1 mRNA expression in CD133− cells was
1.00. The expression of Glut-1 mRNA differed significantly between
CD133+ and CD133− cells (P<0.05).
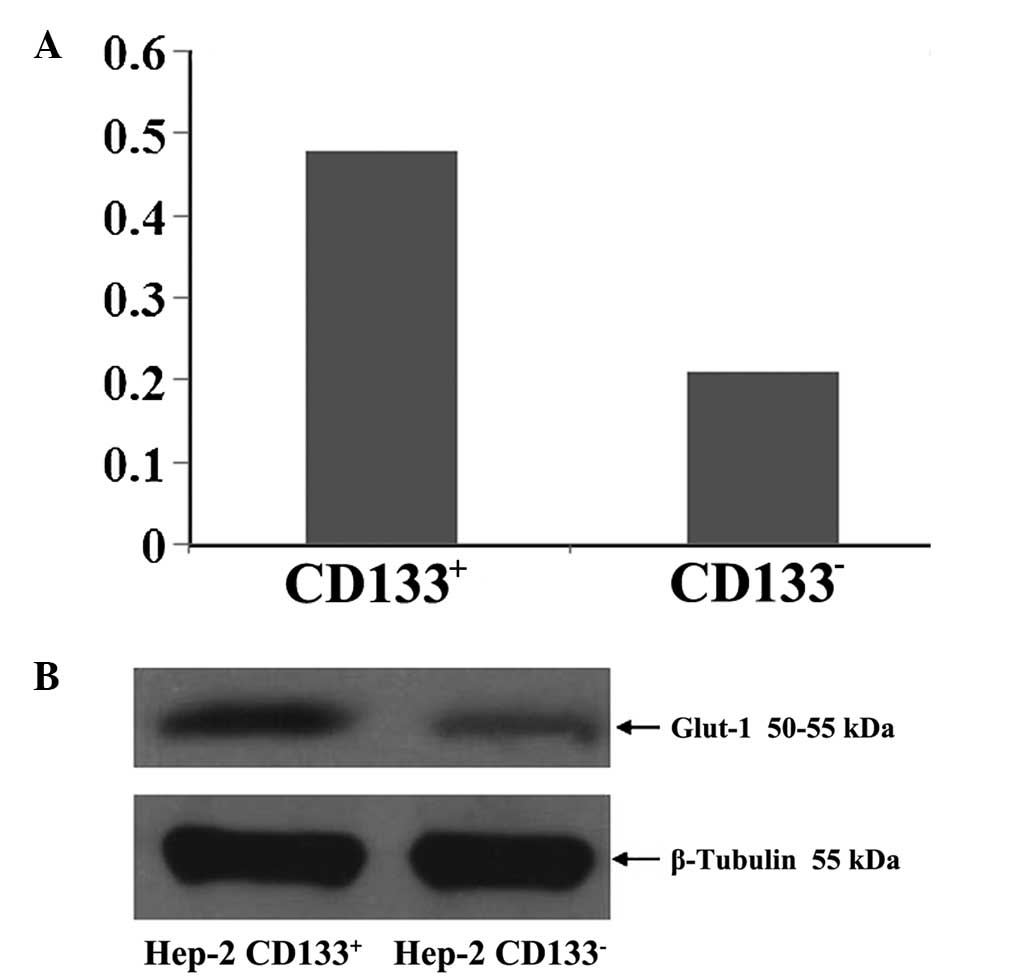
Glut-1 protein levels in
CD133+ and CD133− Hep-2 cells
Mean Glut-1 protein levels in CD133+
Hep-2 cells and CD133− Hep-2 cells relative to β-tubulin
were 0.48 ± 0.02 and 0.21 ± 0.03 μg/μl, respectively (P<0.05;
Fig. 7).
Discussion
Glut-1 is highly expressed in numerous types of
cancer, including laryngeal carcinoma (21,25)
and is associated with resistance to chemoradiotherapy and poor
prognosis (28–30). High expression of Glut-1 has been
demonstrated to be associated with FDG uptake (17–20,22).
Thus, Glut-1 is an intrinsic marker of hypoxia in cancer (31,32).
However, studies of Glut-1 expression in CSCs are limited (6,23,24).
To the best of our knowledge, no study of Glut-1 expression in
laryngeal CSCs exists.
CD133 has been demonstrated to be a marker of CSCs
in laryngeal carcinoma (1–4). In the present study, we successively
isolated CD133+ Hep-2 laryngeal carcinoma cells by FCM.
Prior to isolation, we confirmed the expression of CD133 in the
Hep-2 cells by real-time RT-PCR. Subsequently, FCM demonstrated
that the proportion of CD133+ Hep-2 cells was only 1.2%.
Following isolation, the approximate proportion of
CD133+ Hep-2 cells was 76.1%. In 2007, Zhou et al
first demonstrated that CD133 was a marker of CSCs in a Hep-2
laryngeal cell line (4). They
demonstrated that the CD133+ fraction was 2.45% by FACS
analysis prior to isolation and this was increased to 91.26%
following isolation. Wei et al demonstrated that the
CD133+ fraction was 3.15% by FACS analysis prior to
isolation, which increased to 90.26% following isolation (3). They demonstrated that
CD133+ cells have a stronger ability to form tumors
in vivo than unsorted cells. In the present study, we also
demonstrated that the proliferation capacity of CD133+
cells in vitro was higher than that of CD133−
cells at days 4, 5 and 6 (P<0.05). Thus, our study demonstrated
that CD133 may be a marker of laryngeal carcinoma CSCs. However,
further in vivo experiments are required to determine
whether the CD133+ cells are comparable with the in
vitro phenotype.
Whether CD133+ CSCs have metabolic
programs distinct from those of the bulk of tumor cells is not well
established. Certain regulatory pathways, including the Wnt
(9), Notch (10), Hedgehog (11) and PI3K/Akt pathways (12), have been demonstrated to be
important in the regulation of CSC metabolism and energy sensing.
However, in laryngeal carcinoma, Chen et al demonstrated no
significant difference between the expression of Notch2 and PTEN in
CD133+ and CD133− cells, although they were
expressed at high levels in CD133+ cells (2). Thus, other metabolic pathways may
play a regulatory role in CSCs of laryngeal carcinoma, including
the Warburg effect. Ke et al demonstrated that Glut-1
expression was higher in CD133+ than CD133−
cells in thyroid cancer following 131I radiotherapy
(6). Mai et al demonstrated
that stem cells from proliferating hemangiomas may produce Glut-1
(23). The present study is to the
best of our knowledge the first to demonstrate that Glut-1
expression in laryngeal CSCs and Glut-1 mRNA and protein expression
were higher in CD133+ than in CD133− cells
(P<0.05). These results suggest that Glut-1 expression may play
a role in the CSCs of laryngeal carcinoma. Glut-1 is a
transmembrane protein and a main glucose transporter. CSCs rely
primarily on glycolysis to meet their energy demands (16), which is dependent on glucose
uptake. Thus, we also suggest that Glut-1 is important in the
energy supply of laryngeal CD133+ Hep-2 cells. Several
studies have demonstrated that the inhibition of Glut-1 expression
may repress glycolysis and glucose uptake in cancer cells (27,33).
Phloretin is a glucose transporter inhibitor stated to induce
apoptosis and overcome drug resistance under hypoxic conditions
(33). In laryngeal carcinoma, we
demonstrated that antisense Glut-1 may decrease glucose uptake and
inhibit the proliferation of Hep-2 cells (27). We suggested that Glut-1 may be a
therapeutic target in laryngeal carcinoma. However, this requires
further study.
In conclusion, our data do not permit a definitive
conclusion regarding the expression of Glut-1 in laryngeal CSCs.
However, our findings demonstrate that Glut-1 mRNA and protein
expression is higher in CD133+ than in CD133−
cells. Thus, Glut-1 may be important in the energy supply of
laryngeal CD133+ Hep-2 cells and may represent a
potential therapeutic target for the inhibition of the
proliferation of laryngeal CSCs.
Acknowledgements
This study was supported by the National Natural
Science Foundation of China (no. 81172562 and 81372903), Science
and Technology Department of Zhejiang Province, China (no.
2009C33026), Health Department of Zhejiang Province (no. 2010KYA062
and no. 2009B042) and Department of Education of Zhejiang Province,
China (no. Y201121184).
References
|
1
|
Yang JP, Liu Y, Zhong W, Yu D, Wen LJ and
Jin CS: Chemoresistance of CD133+ cancer stem cells in
laryngeal carcinoma. Chin Med J (Engl). 124:1055–1060.
2011.PubMed/NCBI
|
|
2
|
Chen H, Zhou L, Dou T, Wan G, Tang H and
Tian J: BMI1’S maintenance of the proliferative capacity of
laryngeal cancer stem cells. Head Neck. 33:1115–1125. 2011.
|
|
3
|
Wei XD, Zhou L, Cheng L, Tian J, Jiang JJ
and Maccallum J: In vivo investigation of CD133 as a putative
marker of cancer stem cells in Hep-2 cell line. Head Neck.
31:94–101. 2009. View Article : Google Scholar : PubMed/NCBI
|
|
4
|
Zhou L, Wei X, Cheng L, Tian J and Jiang
JJ: CD133, one of the markers of cancer stem cells in Hep-2 cell
line. Laryngoscope. 117:455–460. 2007. View Article : Google Scholar : PubMed/NCBI
|
|
5
|
Piao LS, Hur W, Kim TK, et al:
CD133+ liver cancer stem cells modulate radioresistance
in human hepatocellular carcinoma. Cancer Lett. 315:129–137.
2012.
|
|
6
|
Ke CC, Liu RS, Yang AH, et al:
CD133-expressing thyroid cancer cells are undifferentiated,
radioresistant and survive radioiodide therapy. Eur J Nucl Med Mol
Imaging. 40:61–71. 2013. View Article : Google Scholar : PubMed/NCBI
|
|
7
|
Bao S, Wu Q, McLendon RE, et al: Glioma
stem cells promote radioresistance by preferential activation of
the DNA damage response. Nature. 444:756–760. 2006. View Article : Google Scholar : PubMed/NCBI
|
|
8
|
Liu YP, Yang CJ, Huang MS, et al:
Cisplatin selects for multidrug-resistant CD133+ cells
in lung adenocarcinoma by activating Notch signaling. Cancer Res.
73:406–416. 2013. View Article : Google Scholar : PubMed/NCBI
|
|
9
|
Neth P, Ries C, Karow M, Egea V, Ilmer M
and Jochum M: The Wnt signal transduction pathway in stem cells and
cancer cells: influence on cellular invasion. Stem Cell Rev.
3:18–29. 2007. View Article : Google Scholar : PubMed/NCBI
|
|
10
|
Huang D, Gao Q, Guo L, et al: Isolation
and identification of cancer stem-like cells in esophageal
carcinoma cell lines. Stem Cells Dev. 18:465–473. 2009. View Article : Google Scholar : PubMed/NCBI
|
|
11
|
Gangopadhyay S, Nandy A, Hor P and
Mukhopadhyay A: Breast cancer stem cells: a novel therapeutic
target. Clin Breast Cancer. 13:7–15. 2013. View Article : Google Scholar
|
|
12
|
Ping YF, Yao XH, Jiang JY, et al: The
chemokine CXCL12 and its receptor CXCR4 promote glioma stem
cell-mediated VEGF production and tumour angiogenesis via PI3K/AKT
signalling. J Pathol. 224:344–354. 2011. View Article : Google Scholar : PubMed/NCBI
|
|
13
|
Bensinger SJ and Christofk HR: New aspects
of the Warburg effect in cancer cell biology. Semin Cell Dev Biol.
23:352–361. 2012. View Article : Google Scholar : PubMed/NCBI
|
|
14
|
Zhao K, Luo XM, Zhou SH, et al:
18F-fluorodeoxyglucose positron emission
tomography/computed tomography as an effective diagnostic workup in
cervical metastasis of carcinoma from an unknown primary tumor.
Cancer Biother Radiopharm. 27:685–693. 2012. View Article : Google Scholar
|
|
15
|
Hammoudi N, Ahmed KB, Garcia-Prieto C and
Huang P: Metabolic alterations in cancer cells and therapeutic
implications. Chin J Cancer. 30:508–525. 2011. View Article : Google Scholar : PubMed/NCBI
|
|
16
|
Varum S, Rodrigues AS, Moura MB, et al:
Energy metabolism in human pluripotent stem cells and their
differentiated counterparts. PLoS One. 6:e209142011. View Article : Google Scholar : PubMed/NCBI
|
|
17
|
Han MW, Lee HJ, Cho KJ, et al: Role of
FDG-PET as a biological marker for predicting the hypoxic status of
tongue cancer. Head Neck. 34:1395–1402. 2012. View Article : Google Scholar : PubMed/NCBI
|
|
18
|
Li XF, Ma Y, Sun X, Humm JL, Ling CC and
O’Donoghue JA: High 18F-FDG uptake in microscopic peritoneal tumors
requires physiologic hypoxia. J Nucl Med. 51:632–638. 2010.
View Article : Google Scholar : PubMed/NCBI
|
|
19
|
Alakus H, Batur M, Schmidt M, et al:
Variable 18F-fluorodeoxyglucose uptake in gastric cancer is
associated with different levels of GLUT-1 expression. Nucl Med
Commun. 31:532–538. 2010.PubMed/NCBI
|
|
20
|
Nagamatsu A, Umesaki N, Li L and Tanaka T:
Use of 18F-fluorodeoxyglucose positron emission tomography for
diagnosis of uterine sarcomas. Oncol Rep. 23:1069–1076.
2010.PubMed/NCBI
|
|
21
|
Zhou S, Wang S, Wu Q, Fan J and Wang Q:
Expression of glucose transporter-1 and -3 in the head and neck
carcinoma--the correlation of the expression with the biological
behaviors. ORL J Otorhinolaryngol Relat Spec. 70:189–194. 2008.
View Article : Google Scholar : PubMed/NCBI
|
|
22
|
Li LF, Zhou SH, Zhao K, et al: Clinical
significance of FDG single-photon emission computed tomography:
Computed tomography in the diagnosis of head and neck cancers and
study of its mechanism. Cancer Biother Radiopharm. 23:701–714.
2008. View Article : Google Scholar : PubMed/NCBI
|
|
23
|
Mai HM, Zheng JW, Wang YA, et al: CD133
selected stem cells from proliferating infantile hemangioma and
establishment of an in vivo mice model of hemangioma. Chin Med J
(Engl). 126:88–94. 2013.PubMed/NCBI
|
|
24
|
Loda M, Xu X, Pession A, Vortmeyer A and
Giangaspero F: Membranous expression of glucose transporter-1
protein (GLUT-1) in embryonal neoplasms of the central nervous
system. Neuropathol Appl Neurobiol. 26:91–97. 2000. View Article : Google Scholar : PubMed/NCBI
|
|
25
|
Wu XH, Chen SP, Mao JY, Ji XX, Yao HT and
Zhou SH: Expression and significance of hypoxia-inducible factor-1α
and glucose transporter-1 in laryngeal carcinoma. Oncol Lett.
5:261–266. 2013.
|
|
26
|
Xu YY, Bao YY, Zhou SH and Fan J: Effect
on the expression of MMP-2, MT-MMP in laryngeal carcinoma Hep-2
cell line by antisense glucose transporter-1. Arch Med Res.
43:395–401. 2012. View Article : Google Scholar : PubMed/NCBI
|
|
27
|
Zhou SH, Fan J, Chen XM, Cheng KJ and Wang
SQ: Inhibition of cell proliferation and glucose uptake in human
laryngeal carcinoma cells by antisense oligonucleotides against
glucose transporter-1. Head Neck. 31:1624–1633. 2009. View Article : Google Scholar : PubMed/NCBI
|
|
28
|
Korkeila E, Jaakkola PM, Syrjänen K,
Pyrhönen S and Sundström J: Pronounced tumour regression after
radiotherapy is associated with negative/weak glucose transporter-1
expression in rectal cancer. Anticancer Res. 31:311–315.
2011.PubMed/NCBI
|
|
29
|
Chiba I, Ogawa K, Morioka T, et al:
Clinical significance of GLUT-1 expression in patients with
esophageal cancer treated with concurrent chemoradiotherapy. Oncol
Lett. 2:21–28. 2011.PubMed/NCBI
|
|
30
|
Kunkel M, Moergel M, Stockinger M, et al:
Overexpression of GLUT-1 is associated with resistance to
radiotherapy and adverse prognosis in squamous cell carcinoma of
the oral cavity. Oral Oncol. 43:796–803. 2007. View Article : Google Scholar : PubMed/NCBI
|
|
31
|
Eckert AW, Kappler M, Schubert J and
Taubert H: Correlation of expression of hypoxia-related proteins
with prognosis in oral squamous cell carcinoma patients. Oral
Maxillofac Surg. 16:189–196. 2012. View Article : Google Scholar : PubMed/NCBI
|
|
32
|
Rademakers SE, Lok J, van der Kogel AJ,
Bussink J and Kaanders JH: Metabolic markers in relation to
hypoxia; staining patterns and colocalization of pimonidazole,
HIF-1α, CAIX, LDH-5, GLUT-1, MCT1 and MCT4. BMC Cancer.
11:1672011.PubMed/NCBI
|
|
33
|
Cao X, Fang L, Gibbs S, et al: Glucose
uptake inhibitor sensitizes cancer cells to daunorubicin and
overcomes drug resistance in hypoxia. Cancer Chemother Pharmacol.
59:495–505. 2007. View Article : Google Scholar : PubMed/NCBI
|