Introduction
Renal transplantation is the best currently
available therapy for patients with end-stage renal disease, since
it results not only in better survival rates, but also, in better
quality of life for the patients compared to dialysis. Rejection is
still a major obstacle in long-term allograft survival in renal
transplant recipients. The decrease in the incidence of clinical
rejections and the increased graft survival at one year after
transplantation do not improve the long-term outcome of renal
transplant patients. Current rates of graft loss are in the order
of 2% per year (1). Numerous risk
factors are known to influence graft survival, such as the age of
the recipient, its ethnicity, diabetes, delayed graft function and
human leukocyte antigen mismatch (2,3).
Acute rejection (AR) has consistently been reported to be the most
important immunologic risk factor leading to chronic allograft
nephropathy (4–6), which is also the most common cause of
graft loss after the first year of transplantation (7,8). AR
is a complex process of injury of the allograft, caused by
infiltrating cells of the host immune system.
The diagnosis of acute renal allograft rejection is
commonly based on the increase in the serum creatinine level,
indicating renal injury. The ‘gold standard’ for clinical diagnosis
of acute rejection in patients with kidney transplants is based on
histological classification of a graft biopsy, which is costly,
invasive and entails risks of complications (9–12).
In order to develop the most appropriate molecular diagnostic
criteria, several research groups have employed ‘-omics’
technologies, such as transcriptomics and proteomics, expected to
allow identifying novel biomarkers and unravelling the biological
mechanisms underlying acute rejection following transplantation
(13). In a previous study, our
group identified 20 microRNAs (miRNAs) differentially expressed
(DE) in acute rejection following renal transplantation. These data
indicated that miRNAs are involved in the pathogenesis of acute
rejection, and may be useful in diagnosis, treatment and prevention
of acute rejection after renal transplantation (14). Unfortunately, candidates from
currently employed approaches do not fulfill the criteria for
clinical application (15).
Long non-coding RNAs (lncRNAs) are transcripts
longer than 200 nt with little or no protein-coding capacity.
LncRNAs can both up-and downregulate gene expression in eukaryotes
and prokaryotes, and are essential in processes such as dosage
compensation, genomic imprinting, developmental patterning and
differentiation, and stress response (16–20).
Moreover, genome-wide studies on embryonic stem cells, adult brain,
CD8+ T cells, and a number of other tissues have
indicated that the few lncRNAs that have been characterized to date
display a diverse range of functions, expression profiles in
specific cell types and localizations in specific subcellular
compartments (21–23).
To date, the association between changes in
expression of lncRNAs and acute rejection following renal
transplantation has not been studied. In this study, we analyzed
lncRNA expression in human renal allograft biopsies of acute
rejection following renal transplantation using the Arraystar Human
lncRNA arrays, and explored the association between lncRNAs and
acute rejection upon renal transplantation.
Materials and methods
Patients and controls
We studied biopsies of three patients with acute
rejection graded as IA and IB as per the Banff 97 classification
(9). Renal biopsies were performed
by clinical ultrasound observation using the BIOPTYo instrument
(BARD, Murray Hill, NJ, USA). The samples constituted of renal
cortex, obtained from renal resection operation. Diagnosis of acute
rejection in all patients was confirmed by histological tests, as
described in the histological analysis. The 3 samples of the
control group were renal cortex obtained during resection operation
of the renal tumor; the samples located far from the tumor tissue,
and tissue structures appeared normal under the light microscope.
All biopsies were performed at the 181st Hospital of Guangxi
Military Area of PLA from 2011 to 2012. The present study was
approved by the Ethics Committee of the 181st Hospital Guangxi
Military Area of PLA and written informed consent was obtained from
each patient.
Histological analysis
The biopsy material was immediately fixed in 10%
phosphate-buffered paraformaldehyde and stored at 4°C. Following
fixation, biopsies were dehydrated through passages in solutions of
increasing ethanol concentration and were embedded in EPON 812
resin (Haide Biotech Company, Beijing, China). Serial, semi-thin
(0.5-μm thick) sections were performed on a Reichert Ultracut
Emicrotome (Leica, Glattbrugg, Switzerland). The resin was removed
by treatment of the sections with sodium methoxide prior to
rehydration, and immunostaining was performed as previously
described (24).
Preparation of renal tissue samples
Renal cortex pieces (<0.3×0.3×0.3 mm3)
obtained from nephrectomy were immediately washed in RNase-free
0.9% NaCl, and dipped in Epicentre® RNase Inhibitor
solution (Illumina, Madison, WI, USA) according to the
manufacturer’s instructions. Following overnight storage at 4°C,
the depressor was removed from the samples, which were stored at
−80°C.
RNA isolation and target labeling
Total RNA was extracted using the Invitrogen™ TRIzol
reagent (Thermo Fisher Scientific, Waltham, MA, USA) and the RNeasy
kit (Qiagen, Hilden, Germany) following the manufacturer’s
instructions, including a DNase digestion step. Following
measurement of the RNA concentration on the Nanodrop ND-1000
machine (NanoDrop Technologies, Wilmington, DE, USA) and denaturing
gel electrophoresis, the samples were used to synthesize
double-stranded cDNA using the Invitrogen™ Superscript®
Double-Stranded cDNA Synthesis kit (Thermo Fisher Scientific). cDNA
synthesis was performed for 60 min at 37°C. The cDNA was labeled
using a biotinylated nucleotide in vitro labeling kit
(Affymetrix, Santa Clara, CA, USA) and hybridized to the 12×135 K
LncRNA Expression microarray using the NimbleGen Hybridization
System (Roche Diagnostics, Shanghai, China).
Microarray expression analysis
The microarray used in this study is designed for
global profiling of long transcripts, including lncRNAs and
protein-coding mRNAs. Each transcript is represented by 1–5 unique
probes, in order to improve statistical confidence. Probes for
housekeeping genes and negative probes are present multiple times
to ensure hybridization quality. Human lncRNAs (n=18,534) in this
microarray have been collected from multiple data sources,
including the NCBI RefSeq database (db), the University of
California, Santa Cruz (UCSC) Genome db, RNAdb (http://research.imb.uq.edu.au/rnadb/),
NRED (http:/nred.matticklab.com/cgi-bin/ncrnadb.pl), and the
literature. Highly similar sequences and ncRNAs <200 bp are
excluded. Protein-coding genes (n=18,847) from the NCBI RefSeq db
are also contained on this array, to allow simultaneous detection
of mRNAs and lncRNAs in a single experiment.
Raw data were extracted as pair files using the
NimbleScan software version 2.5 (Roche Diagnostics). Quantile
normalization and background correction were performed with the RMA
method implemented in this software. The Probe level
(*_norm_RMA.pair) files and the Gene summary
(*_RMA.calls) files were created. The 2 gene summary
files were imported into the GeneSpring software version 11.0
(Agilent Technologies, Inc., Santa Clara, CA, USA) for further
analysis. The effect of normalization was examined on box-plots. DE
lncRNAs were identified by fold-change analysis and a p-value
cutoff <0.05.
Pathway analysis of DE RNAs
Pathway analysis was based on the pathways available
at the Kyoto Encyclopedia of Genes and Genomes (KEGG) database
(http://www.genome.jp/kegg/). This
analysis allows to identify the biological pathways in which the
differentially expressed RNAs are involved. The p-value denotes the
significance of pathway enrichment based on Fisher tests: the lower
the p-value, the more significantly enriched is the list of DE RNAs
in this pathway. We used the recommended p-value cutoff ≤0.05.
Quantitative PCR (qPCR)
The qPCR reaction was carried out using 1 μl (50–100
ng/μl) of cDNA as the template; 1 μl of forward and reverse primers
(listed in Table I) and 10 μl of
Invitrogen™ 10,000X SYBR-Green PCR Master mix (Thermo Fisher
Scientific). The cDNA was serially diluted 2-fold in nuclease-free
water prior to use. The experiment was conducted in duplicate for
each sample. Master mix without total RNA was prepared for all
reactions, and 24 μl were aliquoted into each reaction tube. The
diluted cDNA was then added individually in each tube. qPCR
reactions were conducted on a Rotor-Gene 3000 Real-Time PCR system
(Corbett Research, New South Wales, Australia) as follows:
pre-denaturation for 5 min at 95°C; 40 cycles of 10 sec at 95°C, 15
sec at 58°C, and 20 sec at 72°C. Melting-curve analysis was
performed to determine the reaction specificity. Agarose gel
electrophoresis was also performed to confirm of the size of the
PCR products. The mean of the cycle threshold (Ct) values was
calculated in order to determine the linearity of the GAPDH
expression level. The expression data were analyzed with the
comparative CT method (25).
 | Table IQuantitative PCR primers. |
Table I
Quantitative PCR primers.
| Name | Primer sequence |
|---|
| β-actin | F: 5′-CCT GTA CGC CAA
CAC AGT GC-3′
R: 5′-ATA CTC CTG CTT GCT GAT CC-3′ |
| AF113674 | F: 5′-CCC TCG TTC ACT
CTT CTG-3′
R: 5′-GTG GGT ATT TGC GTC TTT-3′ |
| uc003wbj | F: 5′-CTG GTG GGT GAA
TGG GAA GG-3′
R: 5′-TTG ACA GCG GAA GTG GTT GC-3′ |
| uc010ftb | F: 5′-GAC AAG GAA GCC
GAG TCG TA-3′
R: 5′-ACA GCT GCC CTC ATT ACT ACC-3′ |
| uc001fty | F: 5′-TTT ACA GTG GGT
GGG TCT-3′
R: 5′-GGC TTC CTT CAA AGT TCC-3′ |
| AK129917 | F: 5′-AGT CTT ATC CAC
TGC CAC GG-3′
R: 5′-CTC AAG CAA TCC TCC TAC CA-3′ |
Statistical analysis
Signal intensities for each spot were acquired by
the Axon GenePix 4000B microarray scanner (Molecular Devices,
Sunnyvale, CA, USA) and further analyzed with the NimbleScan and
Agilent GeneSpring software. Signal intensities for each spot were
calculated by subtracting the local background (based on the median
intensity of the area surrounding each spot) from the total
intensity. An average value of the 5 spot replicates for each
lncRNA was generated following data transformation (to convert any
negative value to 0.01), and normalization was performed by using a
“per chip normalization”, in which each measurement was divided by
the 50th percentile of all measurements in its array, allowing
comparison among chips. In order to identify lncRNAs that
characterize each group, a per-gene median normalization was
performed, which normalizes the expression of every lncRNA on its
median among samples.
Results
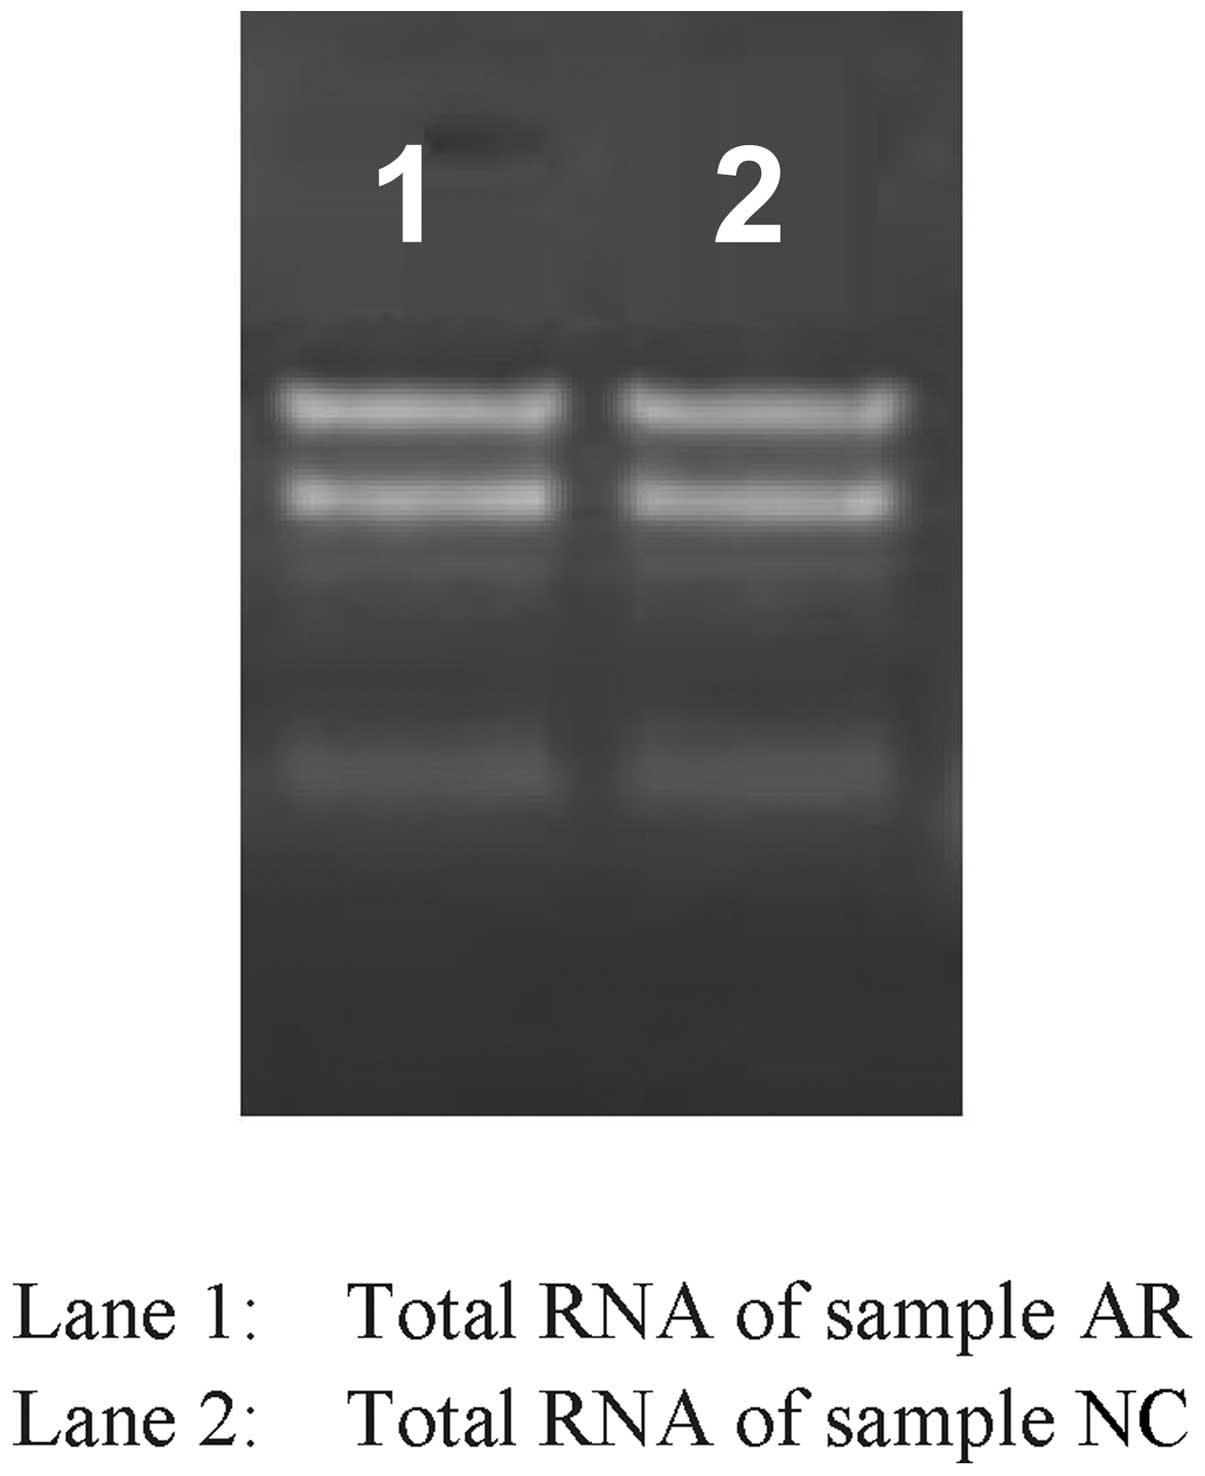
RNA quantity and quality
The quantity and quality of the acute rejection (AR)
and normal (healthy) control (NC) RNA samples were assessed by gel
electrophoresis (Fig. 1) and via
the optical density ratio OD260/OD280
(Table II). These analyses
confirmed that the isolated total RNA is of good quality.
| Table IIOptical densities (OD) of the total
RNA acute rejection (AR) and normal (healthy) control (NC)
samples. |
Table II
Optical densities (OD) of the total
RNA acute rejection (AR) and normal (healthy) control (NC)
samples.
| Sample | OD260 | OD280 |
OD260/OD280 |
OD260/OD230 | Total RNA
concentration (ng/μl) |
|---|
| AR | 39.471 | 19.803 | 1.99 | 2.27 | 1578.82 |
| NC | 24.335 | 12.021 | 2.02 | 2.27 | 973.39 |
LncRNA expression
To compare the expression profiles of lncRNAs in AR
and NC samples, we used a custom microarray approach. Following
normalization of the raw data, the differentially expressed genes
or lncRNAs were identified based on fold-change differences in
expression between the two groups, with a threshold value ≥2.0.
This analysis identified 5,339 lncRNAs as significantly
differentially expressed. Of these, 2,191 lncRNAs were found to be
upregulated and 3,148 to be downregulated. The top 20 upregulated
and downregulated lncRNAs in AR samples as compared to NC samples
are summarized in Table III.
From the DE lncRNAs, we selected, based on their fold changes and
probability values, 5 for validation by RT-qPCR, which confirmed
their expression profiles (Table
IV).
| Table IIIThe top 20 up- and 20 downregulated
long non-coding RNAs in acute rejection (AR) and normal (healthy)
control (NC) samples. |
Table III
The top 20 up- and 20 downregulated
long non-coding RNAs in acute rejection (AR) and normal (healthy)
control (NC) samples.
| Array_id | Sequence id | NC
(normalized) | AR
(normalized) | Fold change | Chromosome |
|---|
| Upregulated |
| ASLNC04531 | uc002rpc | 46.51560 | 17315.78000 | 372.25757 | 2 |
| ASLNC09207 | uc001mng | 94.44511 | 5389.65770 | 57.06656 | 11 |
| ASLNC14712 | BC020554 | 264.48758 | 11507.56800 | 43.50892 | 2 |
| ASLNC08637 | uc009xqb | 182.39748 | 6850.25240 | 37.55673 | 10 |
| ASLNC13599 | BC046920 | 163.36601 | 6082.66160 | 37.23333 | 1 |
| ASLNC07985 | uc004cac | 292.56890 | 9997.94200 | 34.17294 | 9 |
| ASLNC19577 | AK123269 | 149.90768 | 4837.56250 | 32.27028 | 2 |
| ASLNC03665 | uc001fcl | 684.48210 | 21773.67600 | 31.81043 | 1 |
| ASLNC12108 | uc002lxr | 923.49524 | 29205.33600 | 31.62478 | 19 |
| ASLNC21766 | AL117622 | 39.51770 | 1140.18730 | 28.85257 | 2 |
| ASLNC18894 | AK095208 | 181.09515 | 5154.58400 | 28.46340 | Y |
| ASLNC11418 | uc002gwi | 43.88539 | 1162.90340 | 26.49864 | 17 |
| ASLNC03614 | uc009wpu | 119.10841 | 3144.25510 | 26.39826 | 1 |
| ASLNC11432 | uc010cqs | 53.65291 | 1416.20410 | 26.39566 | 17 |
| ASLNC04193 | uc001axt | 187.77946 | 4847.61100 | 25.81544 | 1 |
| ASLNC12713 | uc002ywy | 33.03370 | 851.20294 | 25.76771 | 21 |
| ASLNC00922 | NR_024418 | 84.38660 | 2173.93480 | 25.76161 | 5 |
| ASLNC00559 | NR_003377 | 66.64611 | 1700.32530 | 25.51274 | 1 |
| ASLNC17358 | AK026561 | 26.36899 | 580.09990 | 21.99931 | 4 |
| ASLNC14352 | AL049227 | 38.68229 | 778.73160 | 20.13147 | 5 |
| Downregulated |
| ASLNC06892 | uc003wcs | 12141.12600 | 205.09033 | 59.19891 | 7 |
| ASLNC02456 | ASO3568 | 2672.73120 | 60.76619 | 43.98385 | 9 |
| ASLNC08095 | uc003zfx | 2563.60520 | 63.50388 | 40.36926 | 9 |
| ASLNC01268 | NR_015423 | 1845.16000 | 46.51090 | 39.67156 | 9 |
| ASLNC10347 | uc010akv | 4372.90000 | 138.60800 | 31.54868 | 14 |
| ASLNC19249 | AK097316 | 9239.31800 | 325.60782 | 28.37560 | 16 |
| ASLNC07072 | uc003syy | 1711.72670 | 65.63537 | 26.07933 | 7 |
| ASLNC01067 | NR_015356 | 2245.38570 | 87.05270 | 25.79340 | 7 |
| ASLNC04837 | uc002tjx | 4122.41650 | 160.13051 | 25.74410 | 2 |
| ASLNC22002 | AY343893 | 4541.71400 | 195.93309 | 23.17992 | 9 |
| ASLNC08815 | uc001pyd | 845.93524 | 45.35469 | 18.65154 | 11 |
| ASLNC17495 | AK054638 | 676.56573 | 40.45289 | 16.72478 | 8 |
| ASLNC01430 | NR_024430 | 766.93530 | 53.67410 | 14.28874 | 11 |
| ASLNC21970 | AY129027 | 2840.09330 | 204.75237 | 13.87087 | 9 |
| ASLNC12665 | uc002zic | 15624.00400 | 1273.09390 | 12.27246 | 21 |
| ASLNC12607 | uc010gqe | 16797.70300 | 1392.48970 | 12.06307 | 21 |
| ASLNC00493 | NR_002946 | 4926.25100 | 428.81802 | 11.48797 | 1 |
| ASLNC10383 | uc001vvi | 1599.94170 | 140.93541 | 11.35230 | 14 |
| ASLNC13003 | uc002zpx | 21649.31600 | 2080.54540 | 10.40559 | 22 |
| ASLNC22440 | BC023609 | 5342.29740 | 516.37445 | 10.34578 | 10 |
| Table IVReverse transcription-quantitative
PCR data on expression of long non-coding RNAs (lncRNAs) in acute
rejection (AR) and normal (healthy) control (NC) samples. |
Table IV
Reverse transcription-quantitative
PCR data on expression of long non-coding RNAs (lncRNAs) in acute
rejection (AR) and normal (healthy) control (NC) samples.
| LncRNA | AR | NC | AR/β-actin | NC/β-actin | AR/NC ratio |
|---|
| AF113674 | 4.28E-04 | 9.47E-04 | 7.07E-01 | 1.31E+00 | 0.539 |
| uc003wbj | 3.42E-04 | 2.87E-04 | 5.65E-01 | 3.98E-01 | 1.410 |
| uc010ftb | 4.33E-03 | 3.06E-03 | 7.15E+00 | 4.24E+00 | 1.686 |
| uc001fty | 1.79E-04 | 2.67E-04 | 2.95E-01 | 3.73E-01 | 0.790 |
| AK129917 | 9.22E-05 | 1.14E-05 | 1.52E-01 | 1.58E-02 | 9.620 |
| β-actin | 6.05E-04 | 7.21E-04 | | | |
Biological pathways identified in acute
rejection patients
Pathway analysis was performed next; this is a type
of functional analysis mapping genes to pathways, e.g., from KEGG,
followed by statistical significance tests of enrichment. As shown
in Table V, 21 pathways were
significantly (P<0.05) enriched among the DE lncRNAs, including
a number of immune-response pathways (IL2-mediated signaling
events, IL6, B cell survival pathway, and TNFα/NF-κB). These
results suggest that alterations in expression of a limited number
of genes may affect the regulation of numerous immune response and
inflammatory pathways that are common to acute rejection.
| Table VThe top 21 significantly enriched
Kyoto Encyclopedia of Genes and Genomes pathways for the
differentially expressed long non-coding RNAs (DE lncRNAs). |
Table V
The top 21 significantly enriched
Kyoto Encyclopedia of Genes and Genomes pathways for the
differentially expressed long non-coding RNAs (DE lncRNAs).
| Pathway name | No. of DE
lncRNAs | No. of genes in
pathway | No. of DE lncRNAs
in pathway | P-value |
|---|
| IL2-mediated
signaling events | 179 | 50 | 27 | 1.80E-02 |
| IL6 | 66 | 48 | 27 | 9.11E-03 |
| ERK-PI3K (collagen)
signaling | 36 | 24 | 16 | 4.72E-03 |
| Alanine and
aspartate metabolism | 76 | 22 | 15 | 4.50E-03 |
| Lissencephaly gene
(lis1) in neuronal migration and development | 18 | 11 | 9 | 4.30E-03 |
| Cytochrome
p450 | 54 | 6 | 6 | 3.21E-03 |
| Phase 1
functionalization | 87 | 6 | 6 | 3.21E-03 |
| Cyanoamino acid
metabolism | 27 | 6 | 6 | 3.21E-03 |
| FGF signaling
pathway | 78 | 29 | 19 | 2.83E-03 |
| Antiapoptotic
pathway | 19 | 14 | 11 | 2.67E-03 |
| Metabolism of amino
acids | 297 | 38 | 24 | 1.73E-03 |
| FOXA2 and FOXA3
transcription factor networks | 56 | 46 | 28 | 1.67E-03 |
| FOXA transcription
factor networks | 103 | 75 | 42 | 1.48E-03 |
| B cell survival
pathway | 13 | 7 | 7 | 1.23E-03 |
| Granzyme a mediated
apoptosis pathway | 12 | 7 | 7 | 1.23E-03 |
| p75(NTR)-mediated
signaling | 293 | 83 | 46 | 1.21E-03 |
| Proteogylcan
syndecan-mediated signaling events | 306 | 104 | 56 | 9.75E-04 |
| Neurotrophic
factor-mediated Trk receptor signaling | 160 | 56 | 34 | 5.90E-04 |
| IL3 | 76 | 62 | 37 | 5.53E-04 |
| Syndecan-2-mediated
signaling events | 130 | 41 | 28 | 1.01E-04 |
| TNFα/NF-κB | 214 | 165 | 93 | 2.06E-06 |
Discussion
High-density microarray technology provides a means
to simultaneously measure the differential expression of hundreds
to thousands of genes. The ability to measure the expression of
lncRNAs in samples of early acute rejection following kidney
transplantation allows to identify several biomarkers that have the
potential to directly impact current clinical practices. In the
present study, we took advantage of the high-throughput nature of
the Arraystar Human lncRNA array to identify and characterize
lncRNAs differentially expressed between acute rejection following
renal transplantation and healthy control tissues. This study
identified 5,339 DE lncRNAs, of which 3,148 were downregulated and
2,191 were upregulated in AR compared to NC samples. From the
functional analysis of these DE lncRNAs using KEGG pathway
enrichment analysis, we conclude that acute rejection is associated
with immune activation and inflammation. A number of studies have
investigated the expression of immune activation genes in allograft
biopsies. Interleukin (IL)-7, IL-8, IL-10, IL-15 and interferon;
T-cell receptor (TCR) variable regions; cytotoxic T lymphocyte
effector molecules, such as perforin, granzyme B, Fas and Fas
ligand; and the CD40 ligand have all been identified as upregulated
in acutely rejecting allograft biopsy tissues (13,26).
As immune cells, such as T cells, differentiate, gene expression is
affected by the combination of epigenetic alterations in DNA
methylation, chromatin structure and locus accessibility (27). The roles of lncRNAs in gene and
epigenetic regulation are well documented (28). The finding of the present study
that thousands of lncRNAs are expressed in acute renal rejection is
not surprising. In addition, the presented data are derived from
only three patients.
The function of only a minority of lncRNAs is
documented at present. Therefore, we studied the potential
association between acute rejection and lncRNAs in order to gain
new insights into the pathogenesis of acute rejection and
potentially identify novel biomarkers, which are aspects that have
not been previously studied. From the DE lncRNAs identified herein,
we selected 5 based on their expression fold changes and
probability values for further validation by RT-qPCR experiments,
and further investigated their functions in the literature.
The lncRNA uc001fty locates at the intron of the
C-reactive protein-coding gene (CRP). LncRNAs from introns
have diverse regulatory functions, such as acting as precursors of
shorter RNAs, protein-coding RNA stabilization, control of gene
expression, and regulation of alternative splicing in
protein-coding RNA (29). The
uc001fty belongs to the pentaxin family. It is involved in several
host defense-related functions based on its ability to recognize
foreign pathogens and host damaged cells and to initiate their
elimination by interacting with humoral and cellular effector
systems in the blood. In our study, we observed downregulation in
both uc001fty and CRP gene expression. T cells play a key
role in the alloimmune response, thus it is not surprising that TCR
active-chain expression was upregulated in all acute rejection
samples (data not shown), as previously shown by other groups
(7–9). The uc003wbj, corresponding to the
Homo sapiens mRNA for the T-cell receptor β chain, was found
at relatively high expression level in the acute rejection samples,
which may be related with inflammatory reactions occurring during
acute rejection.
Transcribed lncRNAs interact with downstream
promoter regions of protein-coding genes to regulate mRNA
expression (30). The lncRNA
AK129917 (chr2, mRNA) locates across the transcription start site
of Hsp90B. Hsp90 proteins are highly conserved molecular chaperones
that have key roles in signal transduction, protein folding,
protein degradation and morphology. Overexpression of Hsp90s has
been reported in rat renal cortex following ischemia and in
recipients with graft-versus-host disease (31,32).
Interestingly, we observed that AK129917 and Hsp90B1 are
both upregulated in acute rejection biopsy samples, possibly
through independent regulation pathways.
The lncRNA uc010ftb (chr6, UCSC) locates across the
transcription start site of the caspase 10 gene
(CASP10). This lncRNA encodes a protein that is a
member of the cysteine-aspartic acid protease (caspase) family.
Sequential activation of caspases plays a central role in the
execution phase of cell apoptosis. In this study, we found that
CASP10 is downregulated, but the expression of uc010ftb was
upregulated. From these data, we may infer that uc010ftb negatively
regulates the CASP10 gene. The lncRNA AF113674 (chr19, mRNA)
also locates across the transcription start site of the complement
component 3 (C3). The complement system is an important contributor
to both innate and adaptive immunity, ultimately forming a
proteolytic cascade that sets an inflammatory reaction in motion.
Innate immunity, adaptive immunity and inflammation all converge at
the C3 convertase step, a central amplification point in the
cascade (33). The activation of
the complement is associated with ischemia, reperfusion and
inflammation that occur during graft rejection (34). Therefore, the AF113674 lncRNA may
constitute a suitable biomarker of acute rejection.
The individual lncRNA variation between patients may
be difficult to detect and of no significance, since random
expression changes may occur in each patient. In our study, RNAs
from each group were pooled together in the same sample, so that
the individual differences among subjects are reduced. The aim of
this study was to reveal the relationship between acute renal
rejection and lncRNAs, expecting to draw the attention of
additional research groups to this subject.
In conclusion, we presented herein an analysis of
lncRNA expression in control and acute rejection renal allograft
biopsy samples using lncRNA microarrays. Our results indicate that
certain lncRNAs show promising potential as diagnostic biomarkers
and as factors involved in the pathogenesis of acute rejection.
Nevertheless, it is important to note that the findings described
in this study are merely a starting point for the understanding of
roles that lncRNAs may play in acute renal transplant rejection. In
this context, it is notable that the function of only a minority of
lncRNAs is documented at present. Additional studies are needed to
functionally characterize lncRNAs, including the ones identified in
this study. The list of lncRNAs linked to acute rejection following
renal transplantation may promote the identification of novel
methods for the diagnosis, treatment and prevention of acute renal
rejection, and further illuminate the mechanisms underlying the
rejection of other solid organ transplants.
Acknowledgements
The authors thank the patients who participated in
this study. The authors also thank Kang Chen Biotech for technical
assistance. This study was supported by grants from the National
Natural Science Foundation of China (no. 30972741) and the Guangxi
Natural Science Foundation (no. 2012GXNSFD-A053017).
References
|
1
|
Ekberg H, Bernasconi C, Tedesco-Silva H,
et al: Calcineurin inhibitor minimization in the Symphony study:
observational results 3 years after transplantation. Am J
Transplant. 9:1876–1885. 2009.PubMed/NCBI
|
|
2
|
Shoskes DA and Cecka JM: Deleterious
effects of delayed graft function in cadaveric renal transplant
recipients independent of acute rejection. Transplantation.
66:1697–1701. 1998. View Article : Google Scholar : PubMed/NCBI
|
|
3
|
Hariharan S, Johnson CP, Bresnahan BA,
Taranto SE, McIntosh MJ and Stablein D: Improved graft survival
after renal transplantation in the United States, 1988 to 1996. N
Engl J Med. 342:605–612. 2000. View Article : Google Scholar : PubMed/NCBI
|
|
4
|
Meier-Kriesche HU, Ojo AO, Hanson JA, et
al: Increased impact of acute rejection on chronic allograft
failure in recent era. Transplantation. 70:1098–1100. 2000.
View Article : Google Scholar : PubMed/NCBI
|
|
5
|
Paul LC: Chronic allograft nephropathy: an
update. Kidney Int. 56:783–793. 1999. View Article : Google Scholar : PubMed/NCBI
|
|
6
|
Humar A, Hassoun A, Kandaswamy R, Payne
WD, Sutherland DE and Matas AJ: Immunologic factors: the major risk
for decreased long-term renal allograft survival. Transplantation.
68:1842–1846. 1999. View Article : Google Scholar : PubMed/NCBI
|
|
7
|
Cosio FG, Pelletier RP, Falkenhain ME, et
al: Impact of acute rejection and early allograft function on renal
allograft survival. Transplantation. 63:1611–1615. 1997. View Article : Google Scholar : PubMed/NCBI
|
|
8
|
Woodroffe R, Yao GL, Meads C, et al:
Clinical and cost-effectiveness of newer immunosuppressive regimens
in renal transplantation: a systematic review and modelling study.
Health Technol Assess. 9:1–179. iii–iv. 2005.PubMed/NCBI
|
|
9
|
Racusen LC, Solez K, Colvin RB, et al: The
Banff 97 working classification of renal allograft pathology.
Kidney Int. 55:713–723. 1999. View Article : Google Scholar : PubMed/NCBI
|
|
10
|
Howie AJ: Problems with BANFF.
Transplantation. 73:1383–1384. 2002. View Article : Google Scholar : PubMed/NCBI
|
|
11
|
Ramanathan V, Goral S and Helderman JH:
Renal transplantation. Semin Nephrol. 21:213–219. 2001. View Article : Google Scholar
|
|
12
|
Girlanda R, Mannon RB and Kirk AD:
Diagnostic tools for monitoring kidney transplant recipients. Semin
Nephrol. 27:462–478. 2007. View Article : Google Scholar : PubMed/NCBI
|
|
13
|
Perkins D, Verma M and Park KJ: Advances
of genomic science and systems biology in renal transplantation: a
review. Semin Immunopathol. 33:211–218. 2011. View Article : Google Scholar : PubMed/NCBI
|
|
14
|
Sui W, Dai Y, Huang Y, Lan H, Yan Q and
Huang H: Microarray analysis of microRNA expression in acute
rejection after renal transplantation. Transpl Immunol. 19:81–85.
2008. View Article : Google Scholar : PubMed/NCBI
|
|
15
|
Zand MS: Immunosuppression and immune
monitoring after renal transplantation. Semin Dial. 18:511–519.
2005. View Article : Google Scholar : PubMed/NCBI
|
|
16
|
Mercer TR, Dinger ME and Mattick JS: Long
non-coding RNAs: insights into functions. Nat Rev Genet.
10:155–159. 2009. View
Article : Google Scholar : PubMed/NCBI
|
|
17
|
Feng J, Bi C, Clark BS, Mady R, Shah P and
Kohtz JD: The Evf-2 noncoding RNA is transcribed from the Dlx-5/6
ultraconserved region and functions as a Dlx-2 transcriptional
coactivator. Genes Dev. 20:1470–1484. 2006. View Article : Google Scholar : PubMed/NCBI
|
|
18
|
Yan MD, Hong CC, Lai GM, Cheng AL, Lin YW
and Chuang SE: Identification and characterization of a novel gene
Saf transcribed from the opposite strand of Fas. Hum Mol Genet.
14:1465–1474. 2005. View Article : Google Scholar : PubMed/NCBI
|
|
19
|
Wang H, Iacoangeli A, Lin D, et al:
Dendritic BC1 RNA in translational control mechanisms. J Cell Biol.
171:811–821. 2005. View Article : Google Scholar : PubMed/NCBI
|
|
20
|
Sleutels F, Zwart R and Barlow DP: The
non-coding Air RNA is required for silencing autosomal imprinted
genes. Nature. 415:810–813. 2002. View
Article : Google Scholar : PubMed/NCBI
|
|
21
|
Mercer TR, Dinger ME, Sunkin SM, Mehler MF
and Mattick JS: Specific expression of long noncoding RNAs in the
mouse brain. Proc Natl Acad Sci USA. 105:716–721. 2008. View Article : Google Scholar : PubMed/NCBI
|
|
22
|
Dinger ME, Amaral PP, Mercer TR, et al:
Long noncoding RNAs in mouse embryonic stem cell pluripotency and
differentiation. Genome Res. 18:1433–1445. 2008. View Article : Google Scholar : PubMed/NCBI
|
|
23
|
Pang KC, Dinger ME, Mercer TR, et al:
Genome-wide identification of long noncoding RNAs in
CD8+ T cells. J Immunol. 182:7738–7748. 2009. View Article : Google Scholar : PubMed/NCBI
|
|
24
|
Groos S, Reale E and Luciano L:
Re-evaluation of epoxy resin sections for light and electron
microscopic immunostaining. J Histochem Cytochem. 49:397–406. 2001.
View Article : Google Scholar : PubMed/NCBI
|
|
25
|
Schmittgen TD and Livak KJ: Analyzing
real-time PCR data by the comparative C(T) method. Nat Protoc.
3:1101–1108. 2008. View Article : Google Scholar : PubMed/NCBI
|
|
26
|
Sharma VK, Bologa RM, Li B, et al:
Molecular executors of cell death - differential intrarenal
expression of Fas ligand, Fas, granzyme B, and perforin during
acute and/or chronic rejection of human renal allografts.
Transplantation. 62:1860–1866. 1996. View Article : Google Scholar
|
|
27
|
McLean AG, Hughes D, Welsh KI, et al:
Patterns of graft infiltration and cytokine gene expression during
the first 10 days of kidney transplantation. Transplantation.
63:374–380. 1997. View Article : Google Scholar : PubMed/NCBI
|
|
28
|
Wilson CB, Makar KW, Shnyreva M and
Fitzpatrick DR: DNA methylation and the expanding epigenetics of T
cell lineage commitment. Semin Immunol. 17:105–119. 2005.
View Article : Google Scholar : PubMed/NCBI
|
|
29
|
Mattick JS, Amaral PP, Dinger ME, Mercer
TR and Mehler MF: RNA regulation of epigenetic processes.
Bioessays. 31:51–59. 2009. View Article : Google Scholar
|
|
30
|
Louro R, Smirnova AS and Verjovski-Almeida
S: Long intronic noncoding RNA transcription: expression noise or
expression choice? Genomics. 93:291–298. 2009. View Article : Google Scholar : PubMed/NCBI
|
|
31
|
Harrison EM, Sharpe E, Bellamy CO, et al:
Heat shock protein 90-binding agents protect renal cells from
oxidative stress and reduce kidney ischemia-reperfusion injury. Am
J Physiol Renal Physiol. 295:F397–F405. 2008. View Article : Google Scholar : PubMed/NCBI
|
|
32
|
Goral J, Shenoy S, Mohanakumar T and
Clancy J Jr: Antibodies to 70 kD and 90 kD heat shock proteins are
associated with graft-versus-host disease in peripheral blood stem
cell transplant recipients. Clin Exp Immunol. 127:553–559. 2002.
View Article : Google Scholar
|
|
33
|
Markiewski MM, DeAngelis RA and Lambris
JD: Complexity of complement activation in sepsis. J Cell Mol Med.
12:2245–2254. 2008. View Article : Google Scholar : PubMed/NCBI
|
|
34
|
Ioannou A, Dalle Lucca J and Tsokos GC:
Immunopathogenesis of ischemia/reperfusion-associated tissue
damage. Clin Immunol. 141:3–14. 2011. View Article : Google Scholar
|