Introduction
Gene transcription analysis is important in
understanding the gene transcription profile in order to reveal
complex mechanisms involved in disease initiation, progression and
drug resistance (1,2). Reverse transcription-quantitative
polymerase chain reaction (RT-qPCR) is a sensitive method for the
analysis of gene transcription in tissues or cells. This method
requires reference genes that are not differentially transcribed
across various tissues and experimental conditions, in order to
evaluate target gene transcription (3). However, previous studies have
suggested that several reference genes have variable levels of
transcription, and that different treatments may influence the
stability of the reference genes: Schmittgen and Zakrajsek
(4) reported that the
transcription of ACTB and GAPDH increased significantly following
serum stimulation and that the most suitable internal control genes
for this experimental condition were B2M and 18S RNA. Caradec et
al (5) observed that certain
cell lines required multiple different internal reference genes at
different oxygen concentrations. This suggests that the utilization
of certain internal reference control genes may adversely affect
results and that suitable control reference genes should be
determined to successfully analyze gene transcription in any
experimental context. An additional study demonstrated that
experimental results were highly dependent on the reference gene
used (6).
In cancer research and clinical studies, paclitaxel
(PTX) has been widely used to improve patient prognosis in the
treatment of various types of gynecological cancer, including
ovarian, cervical and endometrial cancer, in addition to breast,
gastric and non-small-cell lung cancer (7–9). PTX
interferes with spindle microtubules, resulting in depolymerization
delay, which then triggers cell cycle arrest and cellular apoptosis
(10). PTX is also able to
directly bind to Bcl-2 and induce apoptosis (11). Camptothecin (CPT), a
chemotherapeutic drug, has been reported to be efficient at
inhibiting the growth of ovarian, hepatic, gastric, colorectal and
breast cancer (12–16). CPT and its derivatives are able to
inhibit the replication and transcription of DNA and mitosis by
acting on type-I DNA topoisomerase (17,18).
The CPT derivative, 10-hydroxycamptothecin (HCPT) exhibits
increased activity and is less toxic than other derivatives, which
are all widely used and studied anticancer drugs. Therefore, if
these anticancer treatments influence the transcriptional stability
of the internal reference gene, the results of the investigation
may be adversely affected. Thus, in the current study the
transcriptional stabilities of several candidate reference genes
were investigated, in order to determine the appropriate reference
gene for the quantification of alterations in gene transcription
following treatment of cancer cells with PTX and HCPT.
Materials and methods
Cell lines and cell culture
The human ovarian cancer cell line UACC-1598 was
obtained from Dr Xin-Yuan Guan at the University of Hong Kong (Pok
Fu Lam, Hong Kong). The human ovarian cancer cell line SKOV3 was
obtained from the Cell Bank of the Type Culture Collection of the
Chinese Academy of Sciences (Shanghai, China). These cells were
cultured in RPMI-1640 (Invitrogen Life Technologies, Grand Island,
NY, USA) containing 10% fetal bovine serum at 37°C in a 5%
CO2 humidified atmosphere. UACC-1598 and SKOV3 cells
were treated with 0.5 ng/μl PTX (IC50 × 0.5; Knowshine
Pharmachemicals, Inc., Shanghai, China) and 1.0 ng/μl HCPT
(IC50 × 0.5; Knowshine Pharmachemicals, Inc.) for 24 and
48 h each.
Total RNA isolation and RT
Total RNA from the cultured cells was extracted
using TRIzol reagent (Invitrogen Life Technologies) according to
the manufacturer’s instructions. The integrity of RNA was confirmed
by electrophoresis (Bio-Rad Laboratories, Inc., Hercules, CA, USA)
on a 1% agarose gel (Gene Tech Co., Ltd, Shanghai, China). The
concentrations of the isolated RNA were determined by measuring the
A260/A280 and A260/A230
absorbance ratios with a DU 800 spectrophotometer (Beckman Coulter,
Brea, CA, USA).
The concentration of RNA was adjusted to 500 ng/μl
with nuclease-free water (Sigma-Aldrich, St. Louis, MO, USA). A
total of 1 μg total RNA was reverse-transcribed into cDNA using
Transcriptor Fisrt Strand cDNA Synthesis Kit (Roche Diagnostics,
Indianapolis, IN, USA) in a total reaction volume of 20 μl by
incubation at 50°C for 60 min, followed by 85°C for 5 min.
Gene selection, primer design and
efficiency evaluation
A total of 30 candidate cancer-associated internal
control genes were selected according to previous studies (Table I) (19–25)
Certain primer sequences were selected from these studies and
others were designed using Gene Runner software, version 3.05
(www.generunner.net); they are summarized in Table I. The RT-qPCR efficiencies for all
primers were detected using serial 10-fold dilutions of the same
cDNA sample. Amplification efficiencies were calculated
automatically from raw fluorescence data by the LightCycler 480
software (version 1.5) in the Light Cycler® 480
Real-Time PCR System (Roche Diagnostics).
 | Table ICandidate genes for reference gene
selection. |
Table I
Candidate genes for reference gene
selection.
| Gene
abbreviation | Gene name | NCBI accession
no. | Primer sequences
forward (5′-3′) | Amplicon size
(bp) | qPCR efficiency |
|---|
| GAPDH* |
Glyceraldehyde-3-phosphate
dehydrogenase | NM_002046.3 | F:
GACAGTCAGCCGCATCTTCT
R: TTAAAAGCAGCCCTGGTGAC | 127 | 1.961 |
| ACTB* | Actin, β | NM_001101.3 | F:
GCCCTGAGGCACTCTTCCA
R: CGGATGTCCACGTCACACTTC | 100 | 1.938 |
| B2M* |
β-2-microglobulin | NM_004048.2 | F:
CACCCCCACTGAAAAAGATGAG
R: CCTCCATGATGCTGCTTACATG | 106 | 2.014 |
| 18S* | 18S ribosomal
RNA | X03205.1 | F:
GGCGCCCCCTCGATGCTCTTAG
R: GCTCGGGCCTGCTTTGAACACTCT | 154 | 1.942 |
| PPIA* | Peptidylprolyl
isomerase A (cyclophilin A) | NM_021130.3 | F:
AGACAAGGTCCCAAAGAC
R: ACCACCCTGACACATAAA | 118 | 1.944 |
| RPLP0 | Ribosomal protein,
large, P0 | NM_053275.3 | F:
CTGATGGGCAAGAACACCAT
R: GTGAGGTCCTCCTTGGTGAA | 115 | 1.907 |
| GUSB | Glucuronidase, β | NM_000181.3 | F:
GAAAATACGTGGTTGGAGAGCTCATT
R: CCGAGTGAAGATCCCCTTTTTA | 101 | 1.950 |
| PGK1* | Phosphoglycerate
kinase 1 | NM_000291.3 | F:
TAAAGCCGAGCCAGCCAAAATAG
R: TCATCAAAAACCCACCAGCCTTCT | 152 | 2.033 |
| YWHAZ* | Tyrosine
3-monooxygenase/tryptophan 5-monooxygenase activation protein, ζ
polypeptide | NM_001135702.1 | F:
ACTTTTGGTACATTGTGGCTTCAA
R: CCGCCAGGACAAACCAGTAT | 94 | 1.986 |
| HMBS* | Hydroxymethylbilane
synthase | NM_000190.3 | F:
TGCAACGGCGGAAGAAAA
R: ACGAGGCTTTCAATGTTGCC | 113 | 1.998 |
| POLR2A* | Polymerase (RNA) II
(DNA directed) polypeptide A, 220 kDa | NM_000937.4 | F:
AAGGTGGTGGTGGAGAATG
R: CTGAATGTTGGAGTAGAAGAGG | 141 | 1.803 |
| RPL13A* | Ribosomal protein
L13a | NM_012423.2 | F:
CGGACCGTGCGAGGTAT
R: CACCATCCGCTTTTTCTTGTC | 114 | 1.800 |
| ALAS* | Aminolevulinate,
δ-, synthase 1 | NM_199166.2 | F:
GGCAGCACAGATGAATCAGA
R: CCTCCATCGGTTTTCACACT | 150 | 1.975 |
| ABL1* | c-abl oncogene 1,
non-receptor tyrosine kinase | NM_005157.4 | F:
GCCTCCTTCTTCCACTTCTC
R: ATGCCCTTCCCGAAATGC | 135 | 2.076 |
| ATP5B | ATP synthase,
H+ transporting, mitochondrial F1 complex, β
polypeptide | NM_001686.3 | F:
TCACCCAGGCTGGTTCAGA
R: AGTGGCCAGGGTAGGCTGAT | 80 | 2.119 |
| ESD | Esterase D | NM_001984.1 | T:
TGATCAAGGGAAAGATGACCA
R: AACCCTCTTGCAATCGAAAA | 113 | 2.022 |
| G6PD* | Glucose-6-phosphate
dehydrogenase | NM_000402.3 | F:
ATCGACCACTACCTGGGCAA
R: TTCTGCATCACGTCCCGGA | 191 | 1.920 |
| HSP90AB1 | Heat shock protein
90 kDa α (cytosolic), class B member 1 | NM_007355.2 | F:
AAGAGAGCAAGGCAAAGTTTGAG
R: TGGTCACAATGCAGCAAGGT | 120 | 1.950 |
| TPT1 | Tumor protein,
translationally-controlled 1 | NM_003295.2 | F:
GATCGCGGACGGGTTGT
R: TTCAGCGGAGGCATTTCC | 100 | 2.061 |
| MRPL19* | Mitochondrial
ribosomal protein L19 | NM_014763.3 | F:
GGGATTTGCATTCAGAGATCAGG
R: CTCCTGGACCCGAGGATTATAA | 117 | 1.947 |
| HPRT1 | Hypoxanthine
phosphoribosyltransferase 1 | NM_000194.2 | F:
AGAGCTATTGTAATGACCAG
R: GGATTATACTGCCTGACC | 157 | 2.004 |
| TBP* | TATA box binding
protein | NM_001172085.1 | F:
TGGTTGTAAACTTGACCTAAAG
R: CTGTTCTTCACTCTTGGCTC | 166 | 1.866 |
| UBC | Ubiquitin C | | F:
TCAAGCAGCAGGTCCTTAAG
R: TGTGCCTGAACTCCCTGTAC | 192 | 1.994 |
| TFRC | Transferrin
receptor (p90, CD71) | NM_001128148.1 | F:
ATTCTCTAACTTGTTTGGTG
R: CATAGCAGATACTTCCACTAC | 182 | 1.944 |
| SDHA | Succinate
dehydrogenase complex, subunit A, flavoprotein (Fp) | NM_004168.2 | F:
GTTTCCTACCAGGTCACAC
R: CTGCTCCGTCATGTAGTG | 157 | 1.996 |
| IPO8* | Importin 8 | NM_006390.3 | F:
TTTCCATTCAACATTCACG
R: TCTATCTTGTCGACCACTCC | 167 | 1.911 |
| TMBIM6 | Transmembrane BAX
inhibitor motif containing 6 | NM_003217.2 | F:
CCTGATATTGATGATTTGG
R: CAGGTAAAGATCATTGCC | 189 | 2.030 |
| YAP1 | Yes-associated
protein 1 | NM_001195045.1 | F:
ACAACAACATGGCAGGAC
R: TAAATTTCTCCATCCTGAGTC | 155 | 2.032 |
| HIST1H2AI | Histone cluster 1,
H2ai | NM_003509.2 | F:
GAAGACTCGCATCATCCC
R: ACTTGCCCTTCGCCTTGT | 167 | 2.045 |
| TUBA1B | Tubulin, α 1b | NM_006082.2 | F:
TGGAACCCACAGTCATTGATGA
R: TGATCTCCTTGCCAATGGTGTA | 135 | 2.033 |
RT-qPCR
RT-qPCR was performed using the LightCycler 480 SYBR
Green I Master mix (Roche Diagnostics). The RT-qPCR reaction mix
consisted of 0.5 μM forward and reverse primers (Table I), 10 μl Master mix, 100 ng cDNA
and nuclease-free water up to a 20 μl reaction volume. All
experiments were performed in triplicate and a no-template control
(reaction mix without cDNA) was used in each assay. RT-qPCR assays
were conducted at 95°C for a 5 min pre-incubation, then 45 cycles
of denaturation at 95°C for 10 sec, primer reannealing at 58–62°C
for 20 sec and extension at 72°C for 30 sec. The RT-qPCR reaction
was followed by melting curve analysis at 95°C for 5 sec and 65°C
for 1 min.
Data analysis
For a stability comparison of the candidate
reference genes, two pieces of software were used,
qbase+ (version 2.0; http://www.biogazelle.com/qbaseplus; Biogazelle,
Ghent, Belgium) and the Microsoft Excel add-in program NormFinder
(version 19; http://moma.dk/normfinder-software; Department of
Molecular Medicine, Aarhus, Denmark).
Results
RNA extraction and gene
transcription
Total RNA was extracted from the two cell lines
following treatment with PTX and HCPT for 0, 24 and 48 h, then the
integrity was confirmed by the ratios of 28S to 18S ribosomal RNA
with agarose gel electrophoresis (data not shown). It was
determined that all samples had A260/A280
ratios >1.9 and A260/A230 ratios >1.5,
which indicates that the extracted RNA was of sufficient purity for
the experiments. The levels of the 30 candidate genes were then
evaluated using RT-qPCR in the samples of ovarian cancer cells
treated with PTX or HCPT. The cycle threshold values for these
genes were 12.11–28.65, which indicated that every selected gene
had appropriate transcription (data not shown). Preliminary
analysis of the transcriptional stability of each gene with or
without treatment was conducted using a one-way analysis of
variance. A total of 12 genes were identified in which the levels
of transcription remained stable following treatment with PTX, and
10 transcriptionally stable genes were identified following HCPT
treatment. The selected genes, which are presented in Table I, were further analyzed using the
gene transcription software described.
Analysis of the stability of gene
transcription in UACC-1598 cells
qbase+ software was used to identify
suitable reference genes via the analysis of the transcriptional
stability of the selected genes in ovarian cancer cells treated
with PTX and HCPT. qbase+ software utilizes a pairwise
comparison of variation to compute a geNorm M value for each gene
and an average geNorm M. A geNorm M value < the average geNorm M
value was considered to indicate high transcriptional stability.
The lower the geNorm M value of the internal reference gene is, the
greater the transcriptional stability it will have.
qbase+ software also calculates a geNorm V value, which
represents the optimal number of reference genes to combine in one
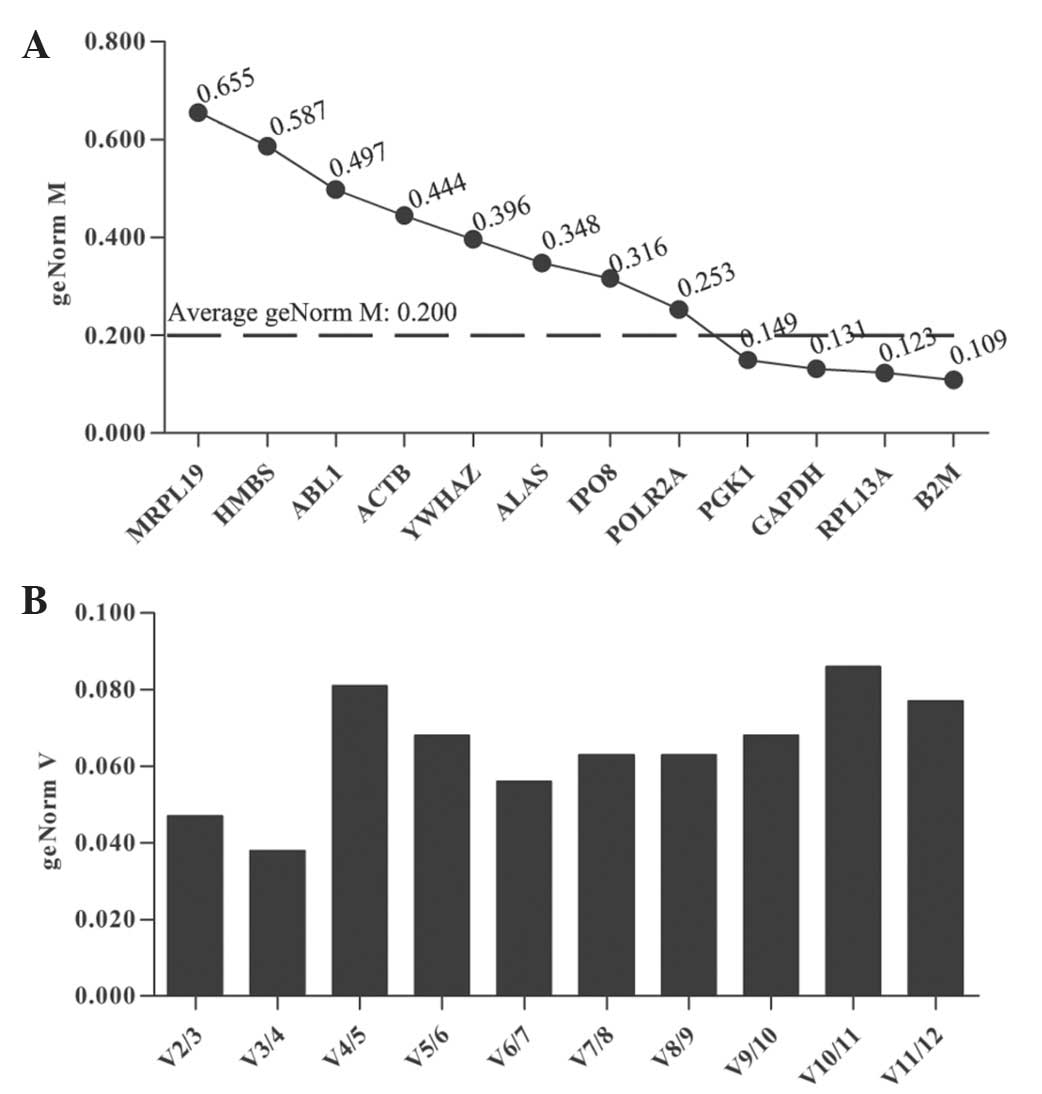
experiment. In the UACC-1598 cells treated with PTX,
qbase+ analysis calculated the geNorm M for each gene,
with an average of 0.200 (Fig.
1A). The genes with a lower than average geNorm M value [B2M
(β-2-microglobulin), ribosomal protein L13a (RPL13A), GAPDH and
phosphoglycerate kinase 1 (PGK1)] were considered to have high
transcriptional stability. Furthermore, B2M, which had the lowest
geNorm M value (0.109) was identified as the most stable reference
gene in UACC-1598 cells treated with PTX. The data from UACC-1598
cells was also analyzed using NormFinder software which yielded
similar results, identifying B2M as the optimal internal reference
gene (data not shown). The optimal number of genes selected in
transcriptional studies was identified to be two, the results
indicating that it is not necessary to include more than two
control genes for analysis (Fig.
1B). The optimal normalization factor was calculated as the
geometric mean of the reference combination B2M and RPL13A.
Determination of the optimal number of control genes for
normalization was performed on the basis of a pair-wise variation
(Vn/n + 1) analysis. V2/3 was the first value typically lower than
the cutoff value 0.150, indicating that there was no need to
include the third gene in order to determine the optimal number of
reference genes.
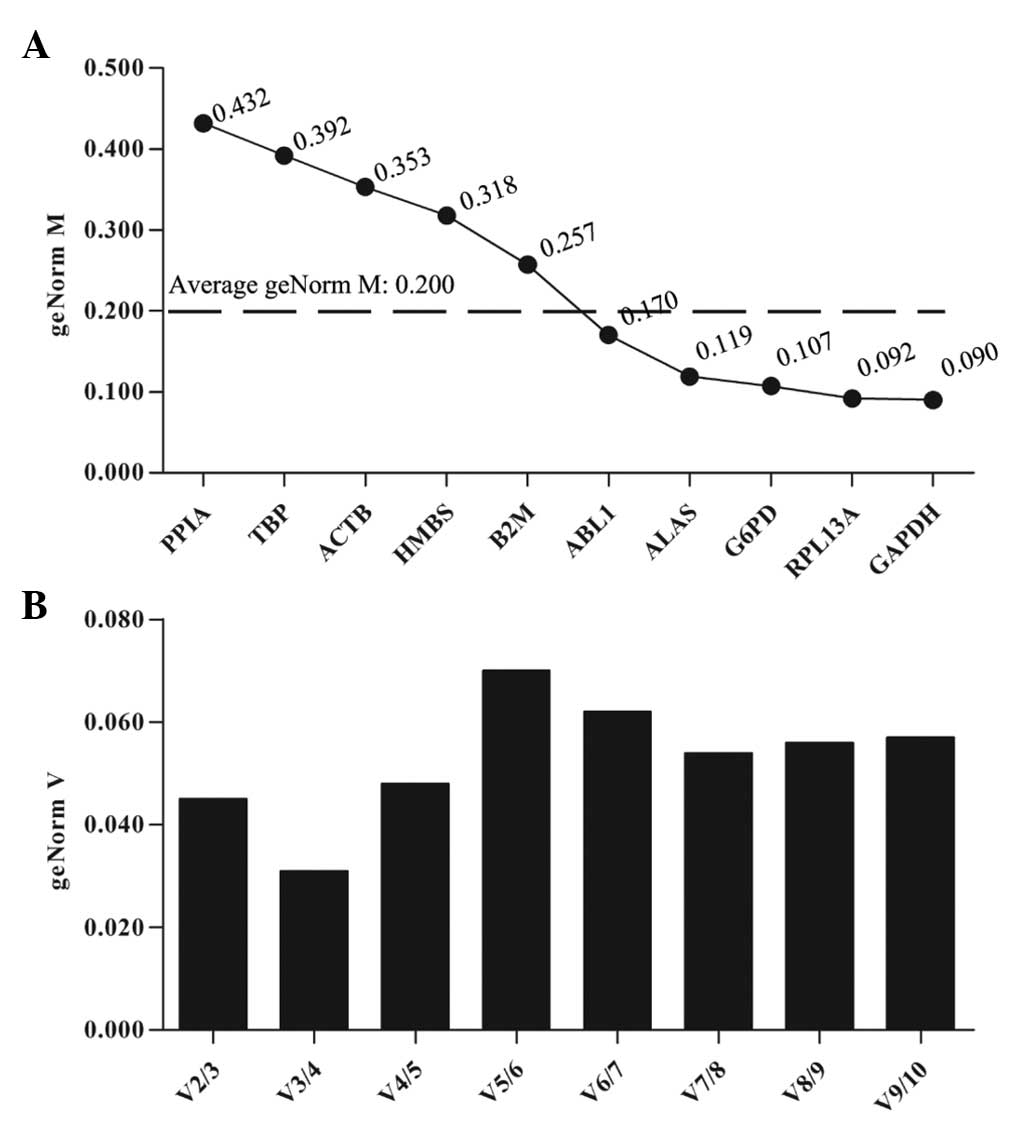
For UACC-1598 cells treated with HCPT,
qbase+ analysis demonstrated that five genes with a
geNorm M lower than average (GAPDH, RPL13A, G6PD, ALAS and ABL1)
had high reference target stability (Fig. 2B). GAPDH exhibited the lowest
geNorm M value (0.090) and thus was identified as the most stable
reference gene in HCPT-treated UACC-1598 cells (Fig. 2A). The optimal normalization factor
was two, as illustrated in Fig. 2B
and the best reference gene combination was GAPDH and RPL13A
(Fig. 2B).
The reference genes with high transcriptional
stability in PTX- or HCPT-treated UACC-1598 cells varied,
suggesting that stimulation with different chemotherapeutic drugs
has a varied effect on the gene transcription profile in the same
cell line. The widely used reference gene ACTB presented poor
transcriptional stability in PTX- and in HCPT-treated cells.
However, in PTX- and HCPT-treated UACC-1598 cells, RPL13A remained
transcriptionally stable, thus it was concluded that RPL13A is a
suitable reference gene in UACC-1598 cells for gene transcription
analysis.
Analysis of the stability of gene
transcription in SKOV3 cells
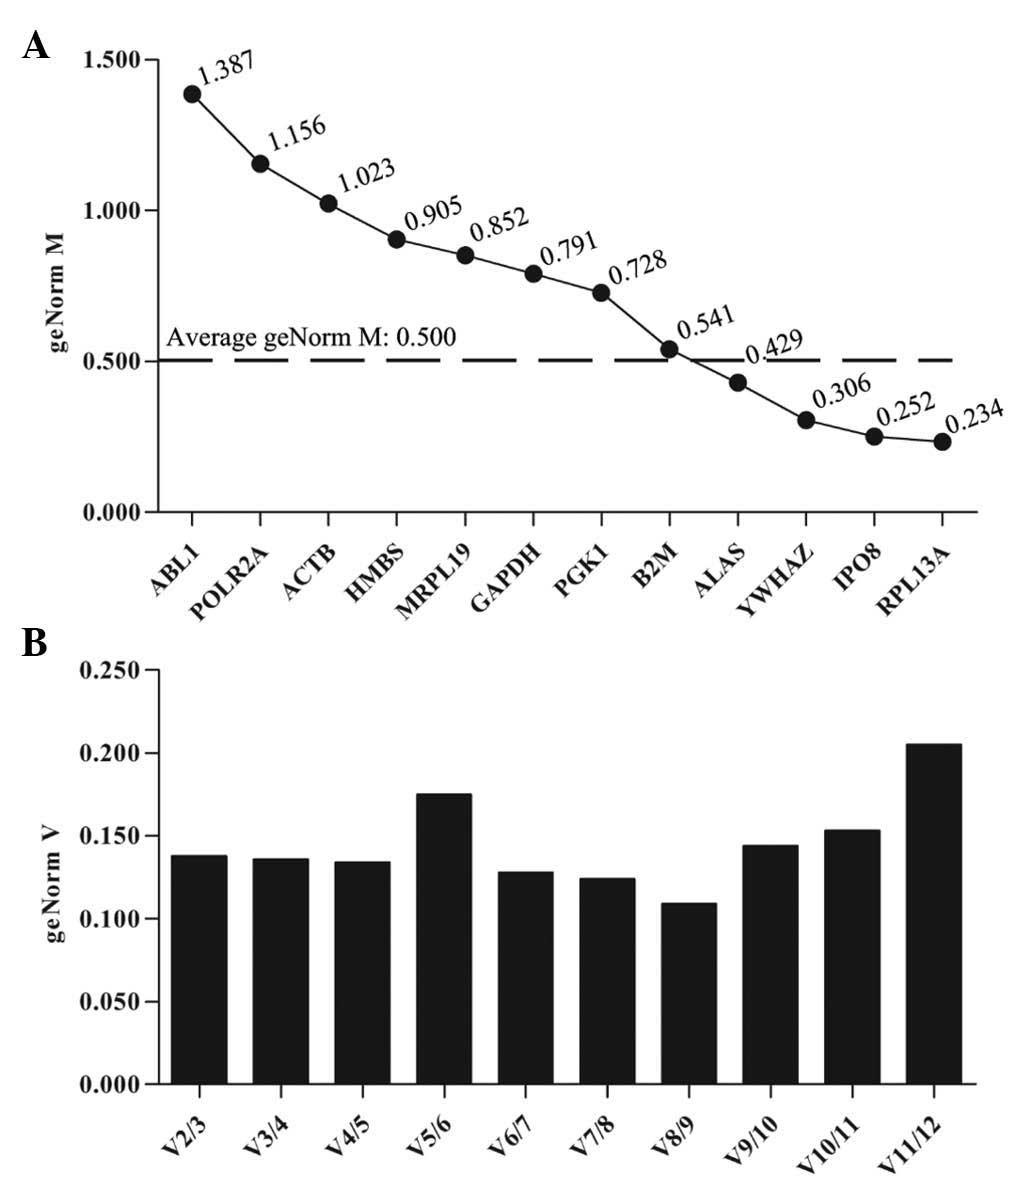
The transcriptional stabilities of the selected
genes were then investigated in the SKOV3 ovarian cancer cell line
following treatment with PTX and HCPT. qbase+ analysis
revealed that the average geNorm M was 0.500 (Fig. 3A). The RPL13A, IPO8, YWHA and ALAS
genes all presented geNorm M values lower than the average, and
exhibited high transcriptional stability following treatment with
PTX. The optimal reference gene combination was observed to be
RPL13A and IPO8 (Fig. 3B).
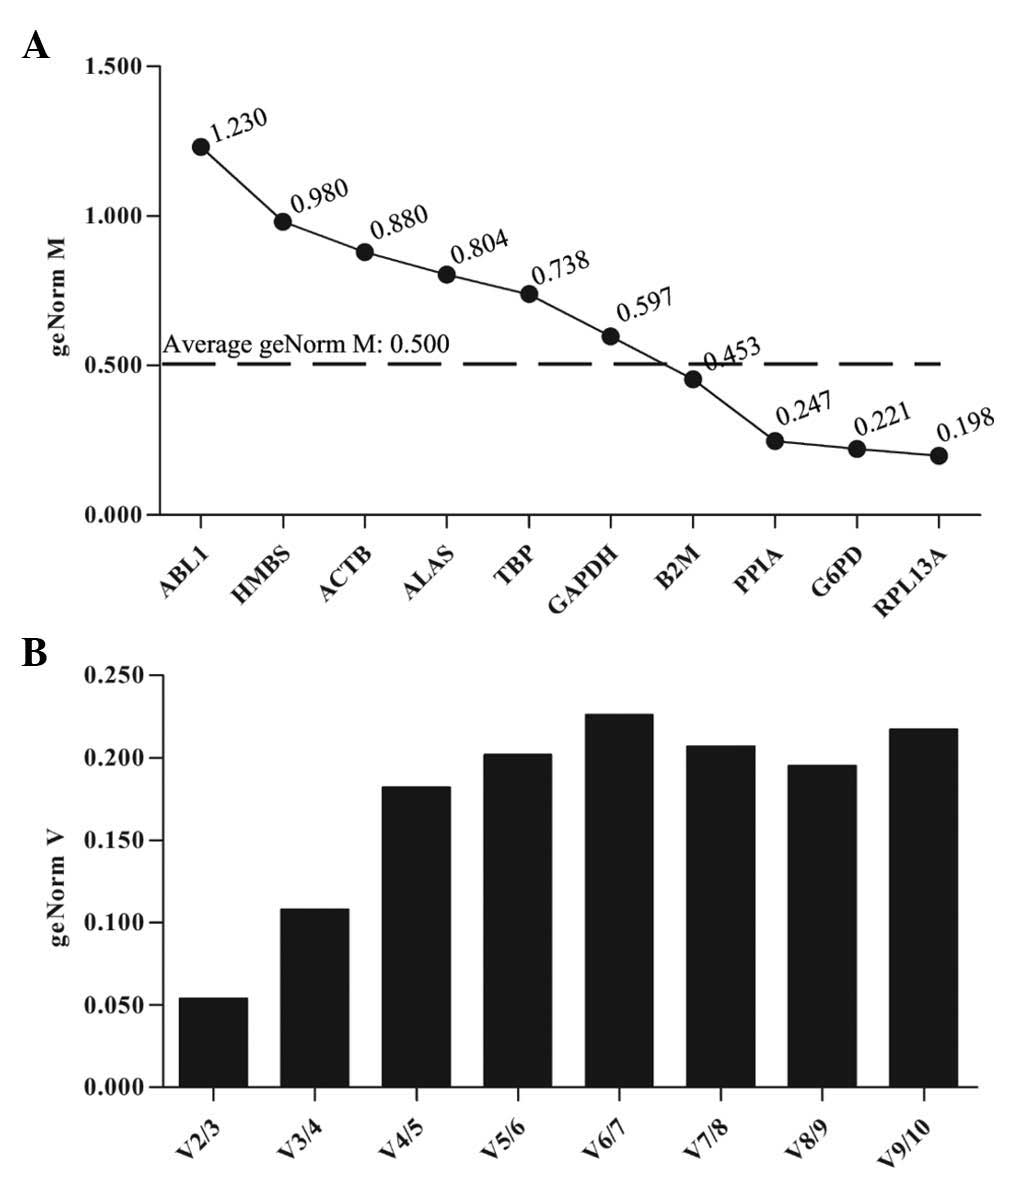
In the analysis of SKOV3 cells treated with HCPT,
qbase+ analysis identified four genes that presented
high transcriptional stability (RPL13A, G6PD, PPIA and B2M;
Fig. 4A), and the best reference
gene combination was RPL13A and G6PD (Fig. 4B).
The results obtained in SKOV3 cells were consistent
with those of UACC-1598 cells, with RPL13A exhibiting a high
transcriptional stability in the two cell types, when treated with
PTX or HCPT. Together, these results suggest that different cell
lines originating from the same organ may exhibit different
transcription profiles following drug treatment. Although the
different cell lines may exhibit stable transcription of different
internal reference genes, RPL13A is a suitable reference gene for
gene transcription analysis in ovarian cancer cells following PTX
or HCPT treatments.
Discussion
RT-qPCR is widely used to analyze gene transcription
in cells. To evaluate the differences in the transcription of
target genes, it is necessary to eliminate the differences in RNA
quality and quantity, in addition to variations in RT efficiency.
One method to overcome this problem is to adjust the transcription
of the target genes using an internal reference gene. An ideal
reference gene has consistent transcription in all experimental
conditions. A previous study that focused on internal reference
genes for ovarian cancer identified GUSB, PPIA and TBP as stably
transcribed genes and suggested that GUSB and PPIA be used in
combination as internal reference genes to normalize the
transcriptional levels of other target genes (26). An additional study suggested that
the genes RPL4, RPLP0 and HSPCB presented the most stable
transcription in ovarian cancer tissues, and thus recommended RPL4
and RPLP0 as reference genes for normalization (25). This research illustrates that there
are different appropriate reference genes for different ovarian
cancer samples. These observations support the theory that
following anticancer drug treatment, ovarian cancer cells require
different reference genes.
In the current study, the transcriptional levels of
30 candidate genes were analyzed, and the genes that transcribed
differently following drug treatments were eliminated from the
search at a preliminary stage. The stability of transcription for
the selected genes was then evaluated using qbase+ and
NormFinder software. Approximately four genes were identified to
have high transcriptional stability in each experimental group. The
identified genes in the different groups were compared and a total
of nine genes were indicated to have high transcriptional
stability. In addition, there were five genes that presented high
transcriptional stability in >2 groups. RPL13A was observed to
exhibit high transcriptional stability in all groups (Table II). It was concluded from the data
collected that treatment with PTX and HCPT did not influence the
transcriptional stability of RPL13A. The results of the present
study suggest that the transcriptional stability of genes
fluctuates when the cells are exposed to different conditions, such
as drug treatment. A previous study evaluated the transcriptional
stability of 11 genes following treatment with tamoxifen, revealing
that gene transcription was significantly altered except for that
of RPL13A, TFRC and GUSB (27).
This observation suggests that treatment with anticancer drugs may
influence the transcriptional stability of the majority of internal
reference genes, which is consistent with the observations of the
current study. With pharmacological stimulation, the
transcriptional profile of cancer cells may be altered greatly. The
present study demonstrated that with the exception of the gene
RPL13A, which had comparable transcriptional stability in the two
cell lines investigated, the other genes were ranked differently in
their transcriptional stability prior to and subsequent to drug
treatment. The results support the theory that genes are not stably
transcribed in all types of carcinoma, including cells from similar
tissues, following treatment with the same drug. In view of the
fact that different drugs influence the transcriptional stability
of genes in different ways, it is necessary to determine the best
reference gene prior to analysis of the transcription profile of
cells receiving treatment. The current study demonstrated for the
first time that following treatment of ovarian cancer cells with
PTX and HCPT, different reference genes are stably transcribed in
the different cells. It is notable that RPL13A is a suitable
reference gene for normalizing gene expression of ovarian cancer
cells following anticancer drug treatment.
| Table IIStability of internal reference genes
in UACC-1598 and SKOV3 cells under different conditions. |
Table II
Stability of internal reference genes
in UACC-1598 and SKOV3 cells under different conditions.
| UACC-1598 | SKOV3 |
|---|
|
|
|
|---|
| Gene | PTX | HCPT | PTX | HCPT |
|---|
| B2M | + | | | + |
| RPL13A | + | + | + | + |
| GAPDH | + | + | | |
| PGK1 | + | | | |
| G6PD | | + | | + |
| ALAS | | + | + | |
| IPO8 | | | + | |
| YWHAZ | | | + | |
| PPIA | | | | + |
Acknowledgements
The present study was supported by the International
Science & Technology Cooperation Program of China (grant no.
2013DFA31610); the Program for Changjiang Scholars and Innovative
Research Team in University (grant no. IRT1230); the New Century
Support Program for the Excellent Scholar, Ministry of Education of
China (grant nos. NCET-10-0149 and NCET-11-0954); and the National
Natural Science Foundation of China (grant no. 81272288).
References
|
1
|
Pal S, Gupta R and Davuluri RV:
Alternative transcription and alternative splicing in cancer.
Pharmacol Ther. 136:283–294. 2012. View Article : Google Scholar : PubMed/NCBI
|
|
2
|
Richardson A and Kaye SB: Drug resistance
in ovarian cancer: the emerging importance of gene transcription
and spatio-temporal regulation resistance. Drug Resist Updat.
8:311–321. 2005. View Article : Google Scholar : PubMed/NCBI
|
|
3
|
Lin Y, Zhang C, Lan H, Gao S, et al:
Validation of potential reference genes for qPCR in maize across
abiotic stresses, hormone treatments, and tissue types. PLoS One.
9:e954452014. View Article : Google Scholar : PubMed/NCBI
|
|
4
|
Schmittgen TD and Zakrajsek BA: Effect of
experimental treatment on housekeeping gene expression: validation
by real-time, quantitative RT-PCR. J Biochem Biophys Methods.
46:69–81. 2000. View Article : Google Scholar : PubMed/NCBI
|
|
5
|
Caradec J, Sirab N, Keumeugni C, et al:
‘Desperate house genes’: the dramatic example of hypoxia. Br J
Cancer. 102:1037–1043. 2010. View Article : Google Scholar : PubMed/NCBI
|
|
6
|
Dheda K, Huggett JF, Chang JS, et al: The
implications of using an inappropriate reference gene for real-time
reverse transcription PCR data normalization. Anal Biochem.
344:141–143. 2005. View Article : Google Scholar : PubMed/NCBI
|
|
7
|
Montana M, Ducros C, Verhaeghe P, Terme T,
Vanelle P and Rathelot P: Albumin-bound paclitaxel: the benefit of
this new formulation in the treatment of various cancers. J
Chemother. 23:59–66. 2011. View Article : Google Scholar : PubMed/NCBI
|
|
8
|
Wang N, Zhang H, Yao Q, Wang Y, Dai S and
Yang X: TGFBI promoter hypermethylation correlating with paclitaxel
chemoresistance in ovarian cancer. J Exp Clin Cancer Res. 31:62012.
View Article : Google Scholar : PubMed/NCBI
|
|
9
|
Socinski MA, Okamoto I, Hon JK, et al:
Safety and efficacy analysis by histology of weekly nab-paclitaxel
in combination with carboplatin as first-line therapy in patients
with advanced non-small-cell lung cancer. Ann Oncol. 24:2390–2396.
2013. View Article : Google Scholar : PubMed/NCBI
|
|
10
|
Amos LA and Löwe J: How Taxol stabilises
microtubule structure. Chem Biol. 6:R65–R69. 1999. View Article : Google Scholar : PubMed/NCBI
|
|
11
|
Ferlini C, Cicchillitti L, Raspaglio G, et
al: Paclitaxel directly binds to Bcl-2 and functionally mimics
activity of Nur77. Cancer Res. 69:6906–6914. 2009. View Article : Google Scholar : PubMed/NCBI
|
|
12
|
Ping YH, Lee HC, Lee JY, et al: Anticancer
effects of low-dose 10-hydroxycamptothecin in human colon cancer.
Oncol Rep. 15:1273–1279. 2006.PubMed/NCBI
|
|
13
|
Zhang XW, Qing C and Xu B: Apoptosis
induction and cell cycle perturbation in human hepatoma hep G2
cells by 10-hydroxycamptothecin. Anticancer Drugs. 10:569–576.
1999. View Article : Google Scholar
|
|
14
|
Lesueur-Ginot L, Demarquay D, Kiss R, et
al: Homocamptothecin, an E-ring modified camptothecin with enhanced
lactone stability, retains topoisomerase I-targeted activity and
antitumor properties. Cancer Res. 59:2939–2943. 1999.PubMed/NCBI
|
|
15
|
Shoji T, Takatori E, Kaido Y, et al: A
phase I study of irinotecan and pegylated liposomal doxorubicin in
recurrent ovarian cancer (Tohoku Gynecologic Cancer Unit 104
study). Cancer Chemother Pharmacol. 73:895–901. 2014. View Article : Google Scholar : PubMed/NCBI
|
|
16
|
Rino Y, Yukawa N, Sato T, et al: Phase II
study on the combination of irinotecan plus cisplatin as a
second-line therapy in patients with advanced or recurrent gastric
cancer. Mol Clin Oncol. 1:749–752. 2013.
|
|
17
|
Hertzberg RP, Caranfa MJ and Hecht SM: On
the mechanism of topoisomerase I inhibition by camptothecin:
evidence for binding to an enzyme-DNA complex. Biochem.
28:4629–4638. 1989. View Article : Google Scholar
|
|
18
|
Fukada M: Action of camptothecin and its
derivatives on deoxyribonucleic acid. Biochem Pharmacol.
34:1225–1230. 1985. View Article : Google Scholar : PubMed/NCBI
|
|
19
|
Cicinnati VR, Shen Q, Sotiropoulos GC,
Radtke A, Gerken G and Beckebaum S: Validation of putative
reference genes for gene expression studies in human hepatocellular
carcinoma using real-time quantitative RT-PCR. BMC Cancer.
8:3502008. View Article : Google Scholar : PubMed/NCBI
|
|
20
|
Gresner P, Gromadzinska J and Wasowicz W:
Reference genes for gene expression studies on non-small cell lung
cancer. Acta Biochim Pol. 56:307–316. 2009.PubMed/NCBI
|
|
21
|
Valceckiene V, Kontenyte R, Jakubauskas A
and Griskevicius L: Selection of reference genes for quantitative
polymerase chain reaction studies in purified B cells from B cell
chronic lymphocytic leukaemia patients. Br J Haematol. 151:232–238.
2010. View Article : Google Scholar : PubMed/NCBI
|
|
22
|
Ferreira E and Cronjé MJ: Selection of
suitable reference genes for quantitative real-time PCR in
apoptosis-induced MCF-7 breast cancer cells. Mol Biotechnol.
50:121–128. 2012. View Article : Google Scholar
|
|
23
|
Andersen CL, Jensen JL and Ørntoft TF:
Normalization of real-time quantitative reverse transcription-PCR
data: a model-based variance estimation approach to identify genes
suited for normalization, applied to bladder and colon cancer data
sets. Cancer Res. 64:5245–5250. 2004. View Article : Google Scholar : PubMed/NCBI
|
|
24
|
Ohl F, Jung M, Xu C, et al: Gene
expression studies in prostate cancer tissue: which reference gene
should be selected for normalization? J Mol Med (Berl).
83:1014–1024. 2005. View Article : Google Scholar
|
|
25
|
Fu J, Bian L, Zhao L, et al:
Identification of genes for normalization of quantitative real-time
PCR data in ovarian tissues. Acta Biochim Biophys Sin (Shanghai).
42:568–574. 2010. View Article : Google Scholar
|
|
26
|
Li YL, Ye F, Hu Y, Lu WG and Xie X:
Identification of suitable reference genes for gene expression
studies of human serous ovarian cancer by real-time polymerase
chain reaction. Anal Biochem. 394:110–116. 2009. View Article : Google Scholar : PubMed/NCBI
|
|
27
|
Shah KN and Faridi JS: Estrogen,
tamoxifen, and Akt modulate expression of putative housekeeping
genes in breast cancer cells. J Steroid Biochem Mol Biol.
125:219–225. 2011. View Article : Google Scholar : PubMed/NCBI
|