Introduction
Lung cancer is the most common cause of
cancer-related mortality in males and females in the USA with a
frequency of 160,000 new cases per annum. The prognosis is poor, as
is evident from low survival rates; the five- and 10-year total
survival rates for patients receiving therapy were only 14 and 8%,
respectively (1). Lung cancer is
classified into four main histological types, which are categorized
into two large groups: Non-small cell lung cancer (NSCLC) and small
cell lung cancer (SCLC). NSCLC, contributing to 80% of lung
carcinoma, is further subdivided into three sub-types based upon
histopathological screening and comprises squamous cell carcinoma,
large cell carcinoma and adenocarcinoma of the lung, which
contribute to 20–25%, 15–20% and 30–40% of lung cancer cases,
respectively (2).
A biomarker is defined as any type of specific
parameter used for estimation of biological homeostasis, which has
the ability to discriminate 'abnormal' from 'normal' (3). It may also be referred to as a
molecule predicting any deviation from normal physiology (4). Cancer biomarkers provide valuable
direction in the field of cancer biology. They not only assist in
early cancer screening, but they offer valuable information for the
investigation of cancer stage and treatment sensitivity (5). The clinical information provided by
cancer biomarkers is important in the selection of appropriate
treatment, which leads to personalized cancer therapy (6). Carcinoembryonic antigen, cytokeratin
fragment-19, neuron-specific enolase and cancer antigen-125 are a
number of candidate lung cancer biomarkers (7).
Proteins are excreted as a result of tumor growth
and appear in serum fractions (8).
Therefore, serum can be used as an indicator of any undergoing
lesion in the body and it is used in proteomic research as a
screening parameter in biomarker investigation. Protein profiling
methodologies, including two-dimensional gel electrophoresis (2DE)
and matrix-assisted laser desorption/ionization
time-of-flight/time-of-flight (MALDI/TOF/TOF) offer versatile and
systematic research tools in disease screening and handling and
enable the analysis of complex protein mixtures (4). Proteomic methodologies are important
in the recognition of disease biomarkers and are emerging as a key
subject in current health issues. Therefore, oncoproteomic
investigations provide a direct method of cancer screening at the
single cancer patient level.
Haptoglobin is a positive acute-phase protein, which
is produced mainly in liver cells against the acute host
inflammatory response to stimuli (9) and is reported to be a predictor of
lung cancer (10). It attaches to
hemoglobin and acts as a biomarker of hemolysis (11). The haptoglobin protein exists
naturally as a tetramer comprised of two α- and two β-subunits,
which are linked by disulfide bonds (12). Unlike the β-subunit, which has no
isoforms, two isoforms of the α-chain exist: α-1 and α-2 (13). A high degree of glycosylation is
one of the significant features of β-haptoglobin. The β-subunit
contains 243 amino acids and has a molecular weight of >40 kDa
(13). Upregulation of the
haptoglobin β-chain has been noted in adenocarcinoma of the lung
and in several different types of cancer compared with that in
normal individuals (7). This
observation supports the hypothesis that overexpression of the
haptoglobin β-chain may act as a useful biomarker for lung cancer
(7).
In the present study, sodium dodecyl sulphate
polyacrylamide gel electrophoresis (SDS-PAGE), 2DE coupled with
in-gel digestion, MALDI/TOF/TOF and western blotting were used to
identify and confirm haptoglobin as a lung cancer biomarker
protein. The effective implementation of these proteomic approaches
may assist in identifying differentially expressed lung cancer
serum proteins compared with controls, as well as to elaborate the
important role of disease-specific biomarker proteins.
Materials and methods
Sampling
Blood samples were collected from lung cancer
patients from the Allah Wali Oncology ward of Gulab Devi Chest
Hospital (Lahore, Pakistan) with permission of the hospital
administration and legal authenticated reviews from the ethical
committee of the University of the Punjab (Lahore, Pakistan).
Written informed consent was obtained from the patients. The lung
cancer patient group consisted of 100 participants, including males
aged 44–72 years (n=85) and females aged 36–55 years (n=15). The
control group consisted of 50 healthy individuals, including males
aged 23–73 years and females aged 29–57 years. Only patients
diagnosed with lung cancer were included, excluding of all
non-cancerous chest diseases and the samples were categorized into
two main histopathological types: NSCLC, which was further
sub-divided into adenocarcinoma, squamous cell carcinoma and large
cell carcinoma and SCLC. Differentiation of carcinoma type was
based upon microscopic observations and immunohistochemical
staining. These types were based on biopsy reports of the patients
examined by a consultant histopathologist. The parameters recorded
by a survey in the present study, included age, gender, occupation,
smoking habits, socioeconomic status, area of geographical
location, family size, any past disease, site of tumor or lymph
node, side of affected lung and signs/symptoms. The clinical
biological data of the patients is presented in Table I.
 | Table IClinical biological data of patients
with lung cancer. |
Table I
Clinical biological data of patients
with lung cancer.
| Histopathology of
lung cancer | n |
|---|
| Non-small cell lung
carcinoma/adenocarcinoma | 34 |
| Squamous cell
carcinoma | 48 |
| Large cell lung
carcinoma | 6 |
| Small cell lung
carcinoma | 12 |
| Work-related
probability of malignancy (male/female) | 23/0 |
| Smoking exposure
(years; male/female) | 8–22/1–3 |
| Surgical resection
cases (male/female) | 5/1 |
Serum preparation and protein
quantification
A total of 10 ml venous blood was aspirated by
sterile disposable syringes and immediately transferred to a clot
activator tube (silicon coated) to boost the blood clotting
process. Following transfer of the blood into the tubes, the blood
collection tubes were stored on ice in order to ensure the
integrity of the sample during transportation to the laboratory.
The serum was collected after 25 min incubation of the blood sample
at room temperature (30°C) and the transparent top liquid fraction
was carefully removed followed by centrifugation at 4,000 rpm for
10 min and was stored at −80°C for further proteomic profiling and
quantitative evaluation. All the samples were processed in a
similar manner.
The total protein contents in the control and
patient serum samples were estimated following Bradford's dye
binding method (14). A standard
curve was plotted between the appropriate concentration standards
of bovine serum albumin (Sigma-Aldrich, St. Louis, MO, USA) between
20 µg/ml and 160 µg/ml and their respective
absorbance values were measured at 595 nm.
SDS-PAGE of the serum samples
SDS-PAGE is a commonly used technique for the
qualitative study of complex protein mixtures. This type of
resolution of proteins and peptides enables the estimation of a
certain protein/peptide in an analytical specimen and results in
assessment of the antigentic capacity of the proteins and peptides
by coupling SDS-PAGE with immuno-electroblotting (15). The SDS-PAGE was performed according
to the method described by Laemmli (16) and the gels were placed in fixative
solution containing 30% ethanol, 10% acetic acid and 60% deionized
water for 4 h, washed with deionized water and stained overnight
with 50 ml colloidal Coomassie stain G-250 (Sigma-Aldrich), which
was prepared by mixing 40 ml stain and 10 ml freshly added
methanol. Destaining was performed by frequent changes of fresh
deionized water until the entire background of the gel was cleared.
This was scanned using a gel documentation system (GeneSnap;
Syngene, Cambridge, UK). All the samples were resolved in the same
manner for characterization of the differentially expressed protein
profile.
2DE
The 2DE technique provides an improved resolution
and fine separation of proteins with accurate molecular weights and
information regarding isoelectric points. The technique involved
the following sequential steps:
Rehydration
Immobilized pH gradient (IPG) strips of 18 cm in
length (Serva, Heidelberg, Germany), were added to 350 µl
rehydration buffer, which was prepared by dissolving 4.8 g urea and
0.1 g 3-(3-cholamidopropyl) dimethylammonio propanesulfonate
in 10 ml deionized water followed by the addition of 0.02 g
dithiothreitol (DTT; cat no. R0861; Fermentas, Pittsburgh, PA,
USA), 125 µl servalyte (pH 3–10; cat no. 42940; Serva) and
0.0002% bromophenol blue. Silicon oil (1–2 ml; Fluka, Buchs,
Switzerland) was also used to cover the strip to avoid dehydration
of the gel. The whole assembly was incubated at 20°C overnight.
First-dimension (isoelectric
focusing)
To perform isoelectric focusing, flat-bed
isoelectric focusing equipment (Amersham Pharmacia Biotech,
Amersham, UK) was used. The chiller was set at 20°C and the IPG
strips were removed from the rehydration tray and aligned 2 mm
apart on the flat bed chamber with the gel side facing upward.
Silicon oil (Fluka) was pre-coated on the cooling plate of the
focusing chamber to avoid the thermal fluctuations beyond 20°C. The
time and voltage specifications for the steps involved in the
focusing operation are listed in Table II.
| Table IIOutline of isoelectric focusing
conditions for immobilized pH gradient strips. |
Table II
Outline of isoelectric focusing
conditions for immobilized pH gradient strips.
| Steps | Voltage (V) | Time (h) | Duration (Vh) |
|---|
| Step 1 | 150 | 01 | 150 |
| Step 2 | 300 | 01 | 300 |
| Step 3 | 600 | 01 | 600 |
| Step 4 | 1000 | 12 | 12000 |
| Step 5 | 2000 | 05 | 10000 |
| Safety step 6 | 3000 | 02 | 6000 |
| Step 7 | 4000 | 08 | 32000 |
Second dimension (SDS-PAGE)
The freeze-focused strips were placed at room
temperature until normalized. Equilibration buffers (1 and 2) were
prepared and the strip was carefully transferred with the gel side
facing upward to the rehydration tray. Equilibration buffer (10 ml;
stock) was added for removal of the residual buffer reagents that
were used in the first dimension followed by equilibration steps. A
0.5% molten agarose gel was evenly layered over the horizontal
surface of a 12% polyacrylamide gel, standard protein marker (cat
no. SM0661; PageRular; Fermantas, Waltham, MA, USA) was loaded and
the gel was run at a constant voltage of 60 V until the sample
remained in the agarose gel. The voltage was then increased to 120
V as the sample migrated to the resolving gel. Protein fixation,
staining and destaining of the gel was performed, as described
previously, and the gel was scanned using a gel documentation
system (GeneSnap; Syngene). Following comparison of the patient and
control gel images, the differentially expressed protein spots were
observed, marked and labeled.
In-gel digestion
The in-gel digestion procedure included the
following steps:
Washing and destaining of the protein
spot
Following 2DE and image analysis, the gel was washed
with fresh deionized water. The marked, differentially expressed,
protein spot was excised by comparing the respective gel images
using a sterilized, methanol washed, metal blade and transferred to
a clean and sterile microfuge tube containing deionized water.
Following incubation at room temperature for 15 min, the protein
gel spot was washed with a mixture of 100 µl acetonitrile
(ACN; Sigma-Aldrich) and double distilled water in equal ratio and
was incubated at room temperature for 15 min. Following removal of
the mixture, 100 µl ACN was added in each tube and incubated
until the gel spot was white and sticky. Subsequently, following
removal of the ACN, 100 µl of 100 mM ammonium bicarbonate (;
Ambic), which was prepared by dissolving 0.079 g ammonium
bicarbonate in 10 ml autoclaved deionized water (pH 8.0), was added
followed by 5 min incubation at room temperature. An equal quantity
of ACN was added to the tube in a 1:1 solution and was incubated
again for 15 min. The solution was removed and the gel spot was
desiccated in a freeze dryer (Alpha1-4, Loc-Im; Martin Christ,
Osterode am Harz, Germany).
Reduction and alkylation
A solution of 100 µl of 10 mM DTT (prepared
by mixing 50 µl of 200 mM DTT and 950 µl of 100 mM
Ambic) was added to the dried protein spot from the gel for
reduction of the disulphide bonds in the protein, followed by
incubation at 56°C for 45 min. This was followed immediately by the
addition of 100 µl 55 mM iodoacetamide (IAA) containing
0.101 g IAA in 10 ml 100 mM Ambic, following removal of the
reducing solution and incubation in the dark for 30 min. The
solution was removed again and the spot was washed with 100 mM
Ambic followed by a 5-min incubation. An equal quantity of ACN was
added to produce a 1:1 solution, which was further incubated for 15
min. The protein gel spot was fully dried, as previously, in a
freeze dryer.
Peptide digestion
A total of 400 ng of trypsin, reconstituted in 50 mM
Ambic, was added to each gel spot and incubated on ice for 45 min.
The solution was then discarded and 50 mM Ambic was added, ensuring
that the gel spot was entirely soaked, followed by incubation at
37°C overnight.
Peptide extraction
The peptide extract was acidified with 10%
trifluoroacetic acid (TFA) to ~pH 3 and the peptide extract
supernatant was removed and stored in a clean microfuge tube. The
residual gel slice was covered again with TFA and CAN (0.1:60) and
placed in an ultrasonic water bath (Ultrasonic LC30/H; Elma,
Singen, Germany) for 30 min at 20°C for further peptide extraction.
The final peptide extract, which was pooled from the supernatants,
was dried in a freeze dryer and the liquid volume was reduced up to
10 µl followed by storage at −20°C until MALDI/TOF/TOF
analysis.
Peptide mass fingerprinting
(MALDI-TOF/TOF) and database analysis
The mass spectrometric procedure was performed using
an α-hydroxycinnamic acid matrix (Bruker Daltonics, Bremen,
Germany) according to the manufacturer's instructions and the
resulting peaks list was subjected to a Mascot search analysis
(www.matrixscience.com) following
baseline adjustment and screening of noises using flex analysis to
identify the proteins. The Mascot database search parameters were
set as follows: carbamidomethyl modification of cysteine, possible
oxidation of methionine up to one missed cleavage and trypsin (cat
no. V5111; Promega Corporation, Madison, WI, USA) for proteolytic
cleavage. The sequence coverage level, matching peptide numbers and
Mascot score parameters were used to confirm the identification.
The SwissProt database (http://www.uniprot.org/) was used for protein
identification.
Immunological investigation of targeted
proteins
In order to establish a set of lung cancer protein
biomarkers for screening and therapeutic applications, by
correlating the expression level of a particular protein in all the
patient and control samples, the differentially expressed proteins
were targeted for further evaluation and estimation. Western blot
analysis was performed to confirm the presence of the targeted
protein in the serum samples.
Western blot analysis
Western blot analysis was performed according to the
method described by Towbin et al (17). A total of 10 µg serum
proteins from all the serum samples were resolved on a 15% SDS-gel,
which was run by the method described by Laemmli (16), transferred onto a nitrocellulose
blotting membrane sheet of 8.5×7.5 cm dimension and 0.22 µm
pore size (Cat no. 786-018NC; G-Biosciences, St. Louis, MO, USA)
and the protein transfer was continued for 1.5 h at constant
voltage (18 V) in a semi dry transfer cell assembly (Trans-Blot Sd;
Bio-Rad, Hercules, CA, USA). The primary anti-haptoglobin β-chain
antibody [1:10,000; (2F4) LF-MA0158; Abfrontier, Seoul, Korea] was
added to the blot followed by incubation at 4°C overnight for
maximum binding of the antibody to its antigenic site.
Subsequently, the blot was washed three times with Tris-buffered
saline containing 0.01% Tween-20, and goat anti-mouse
immunoglobulin (Ig) G, alkaline phosphatase (AP)-conjugated
secondary antibody (cat no. 786-R43; G-Biosciences) was added
followed by incubation at room temperature for 2 h followed by
three washings with the same wash buffer. The blot was finally
developed using AP-substrate buffer solution.
Results and Discussion
Lung cancer represents one of the major causes of
cancer-associated mortality worldwide (18). It is one of the most commonly
occurring and the most life-threatening types of neoplasia in
numerous areas of the world and is responsible for 25% of
cancer-related mortality (19).
Biomarkers are assessment tools for a particular biological
condition. Cancer biomarkers may assist in patient diagnosis and
disease handling by stage characterization and evaluation of
therapeutic feedback (20).
SDS-PAGE of patient and control
serum
All serum samples were subjected to SDS-PAGE
following the estimation of total protein content using the
above-mentioned procedure. Total serum protein (10 µg) from
each patient and control was resolved on a 12% SDS-gel using
Bio-Rad mini gel assembly followed by protein fixation, staining
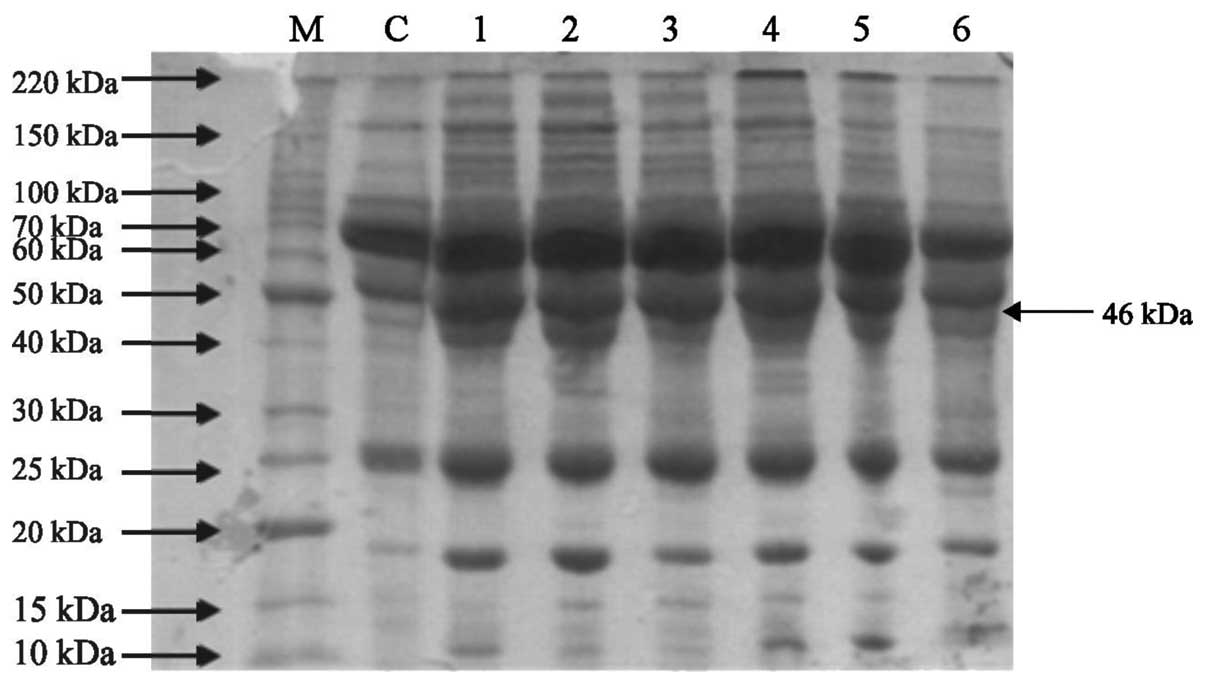
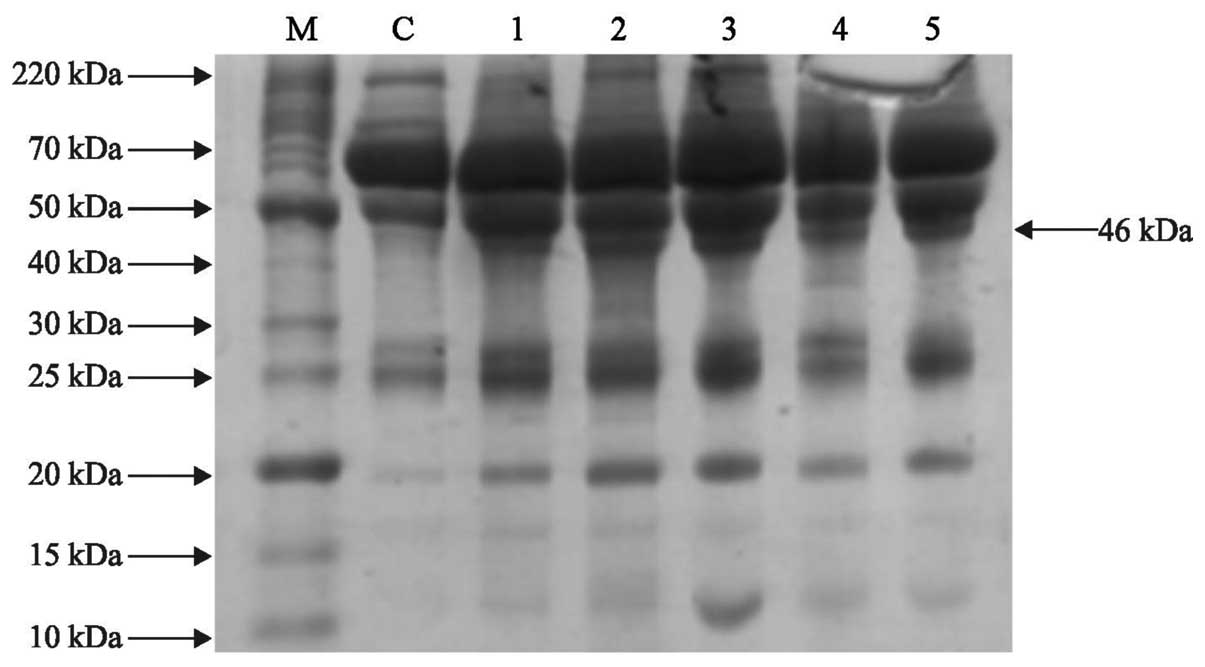
and destaining steps, as previously described. One-dimensional gel
electrophoresis demonstrated a compact protein banding pattern in
the control and lung cancer serum samples, as shown in Figs. 1 and 2. Differential expression was observed at
various positions in the adenocarcinoma and squamous cell carcinoma
patient samples. A protein with a molecular weight of ~46 kDa was
overexpressed in the adenocarcinoma and squamous cell carcinoma
patient samples compared with the control (Figs. 3Figure 4–5).
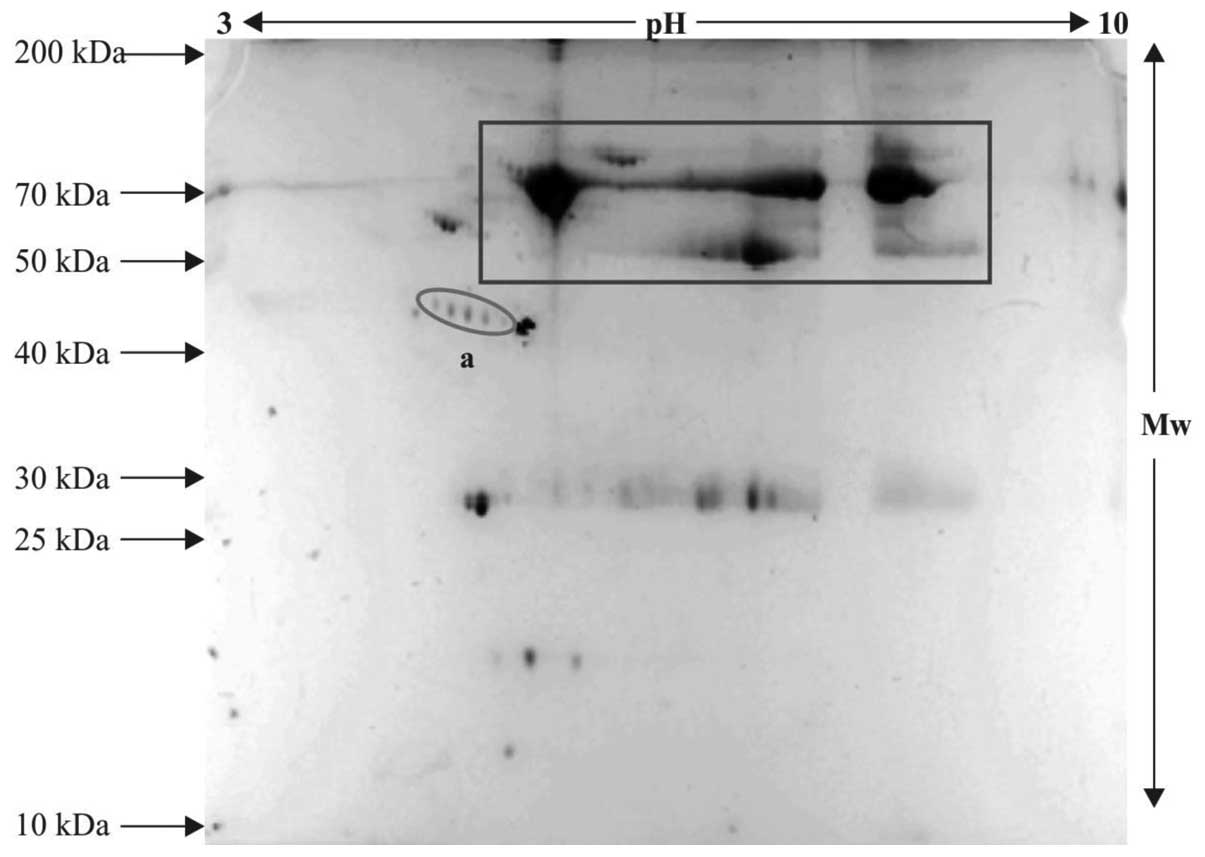
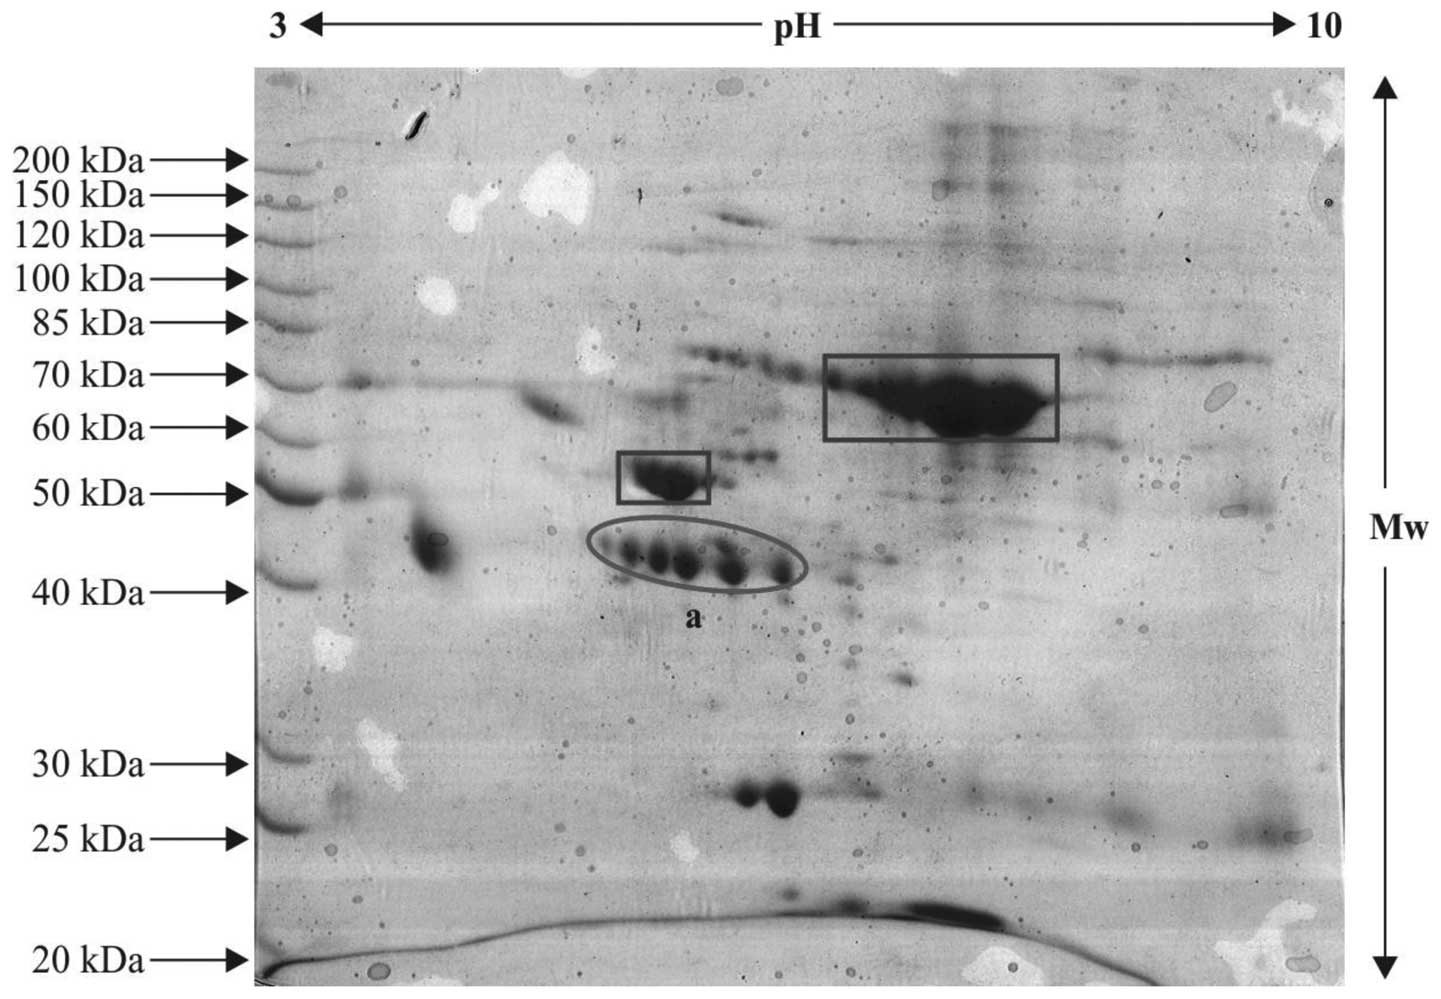
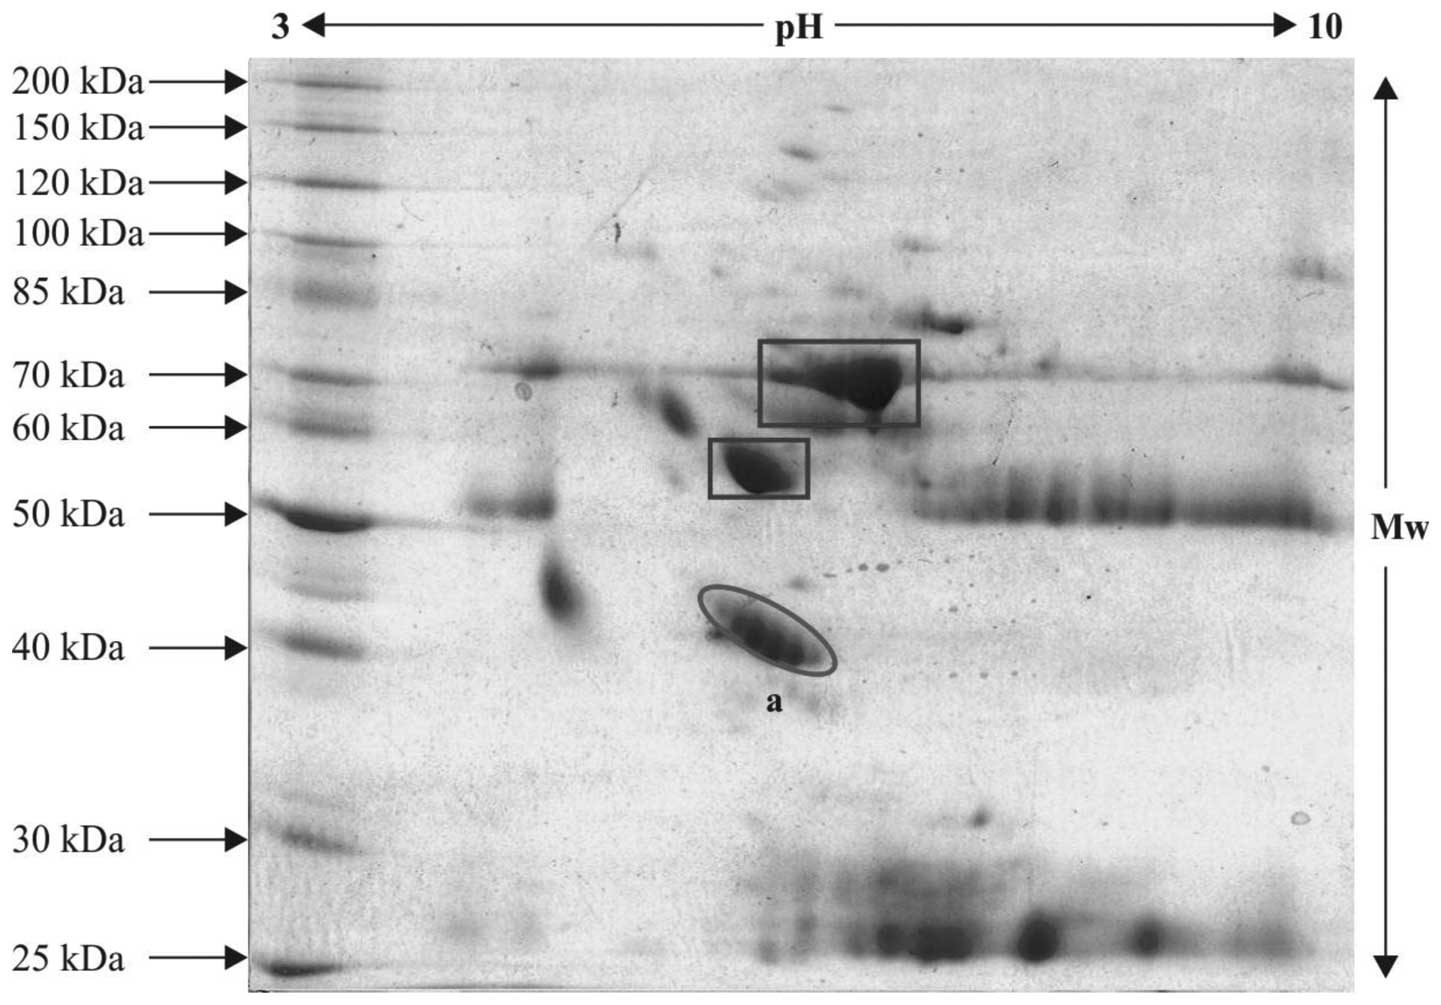
2DE
The serum proteins from the patient and control
samples were resolved on IPG strips and subsequent steps were
performed, as described above. The control and patient sample gels
exhibiting variable pattern and differentially expressed protein
spots were subjected to tryptic digestion and further protein
profiling, as the spots appeared with defined boundaries and were
expressed in an unusual pattern. These were selected for mass
spectrometric analysis. The protein spots, which were relatively
differentially expressed in the patient samples compared with the
controls are indicated within ovals in the 2-D gels (Figs. 3Figure 4–5) and the serum proteins, which were
observed in abundance, are indicated within rectangle boxes. A
relatively high expression level of the ~42–46 kDa protein was
observed (spot 'a' in Figs. 4 and
5), compared with spot 'a' in the
control gel (Fig. 3). This spot
was selected for in-gel digestion and mass spectrometric
investigations.
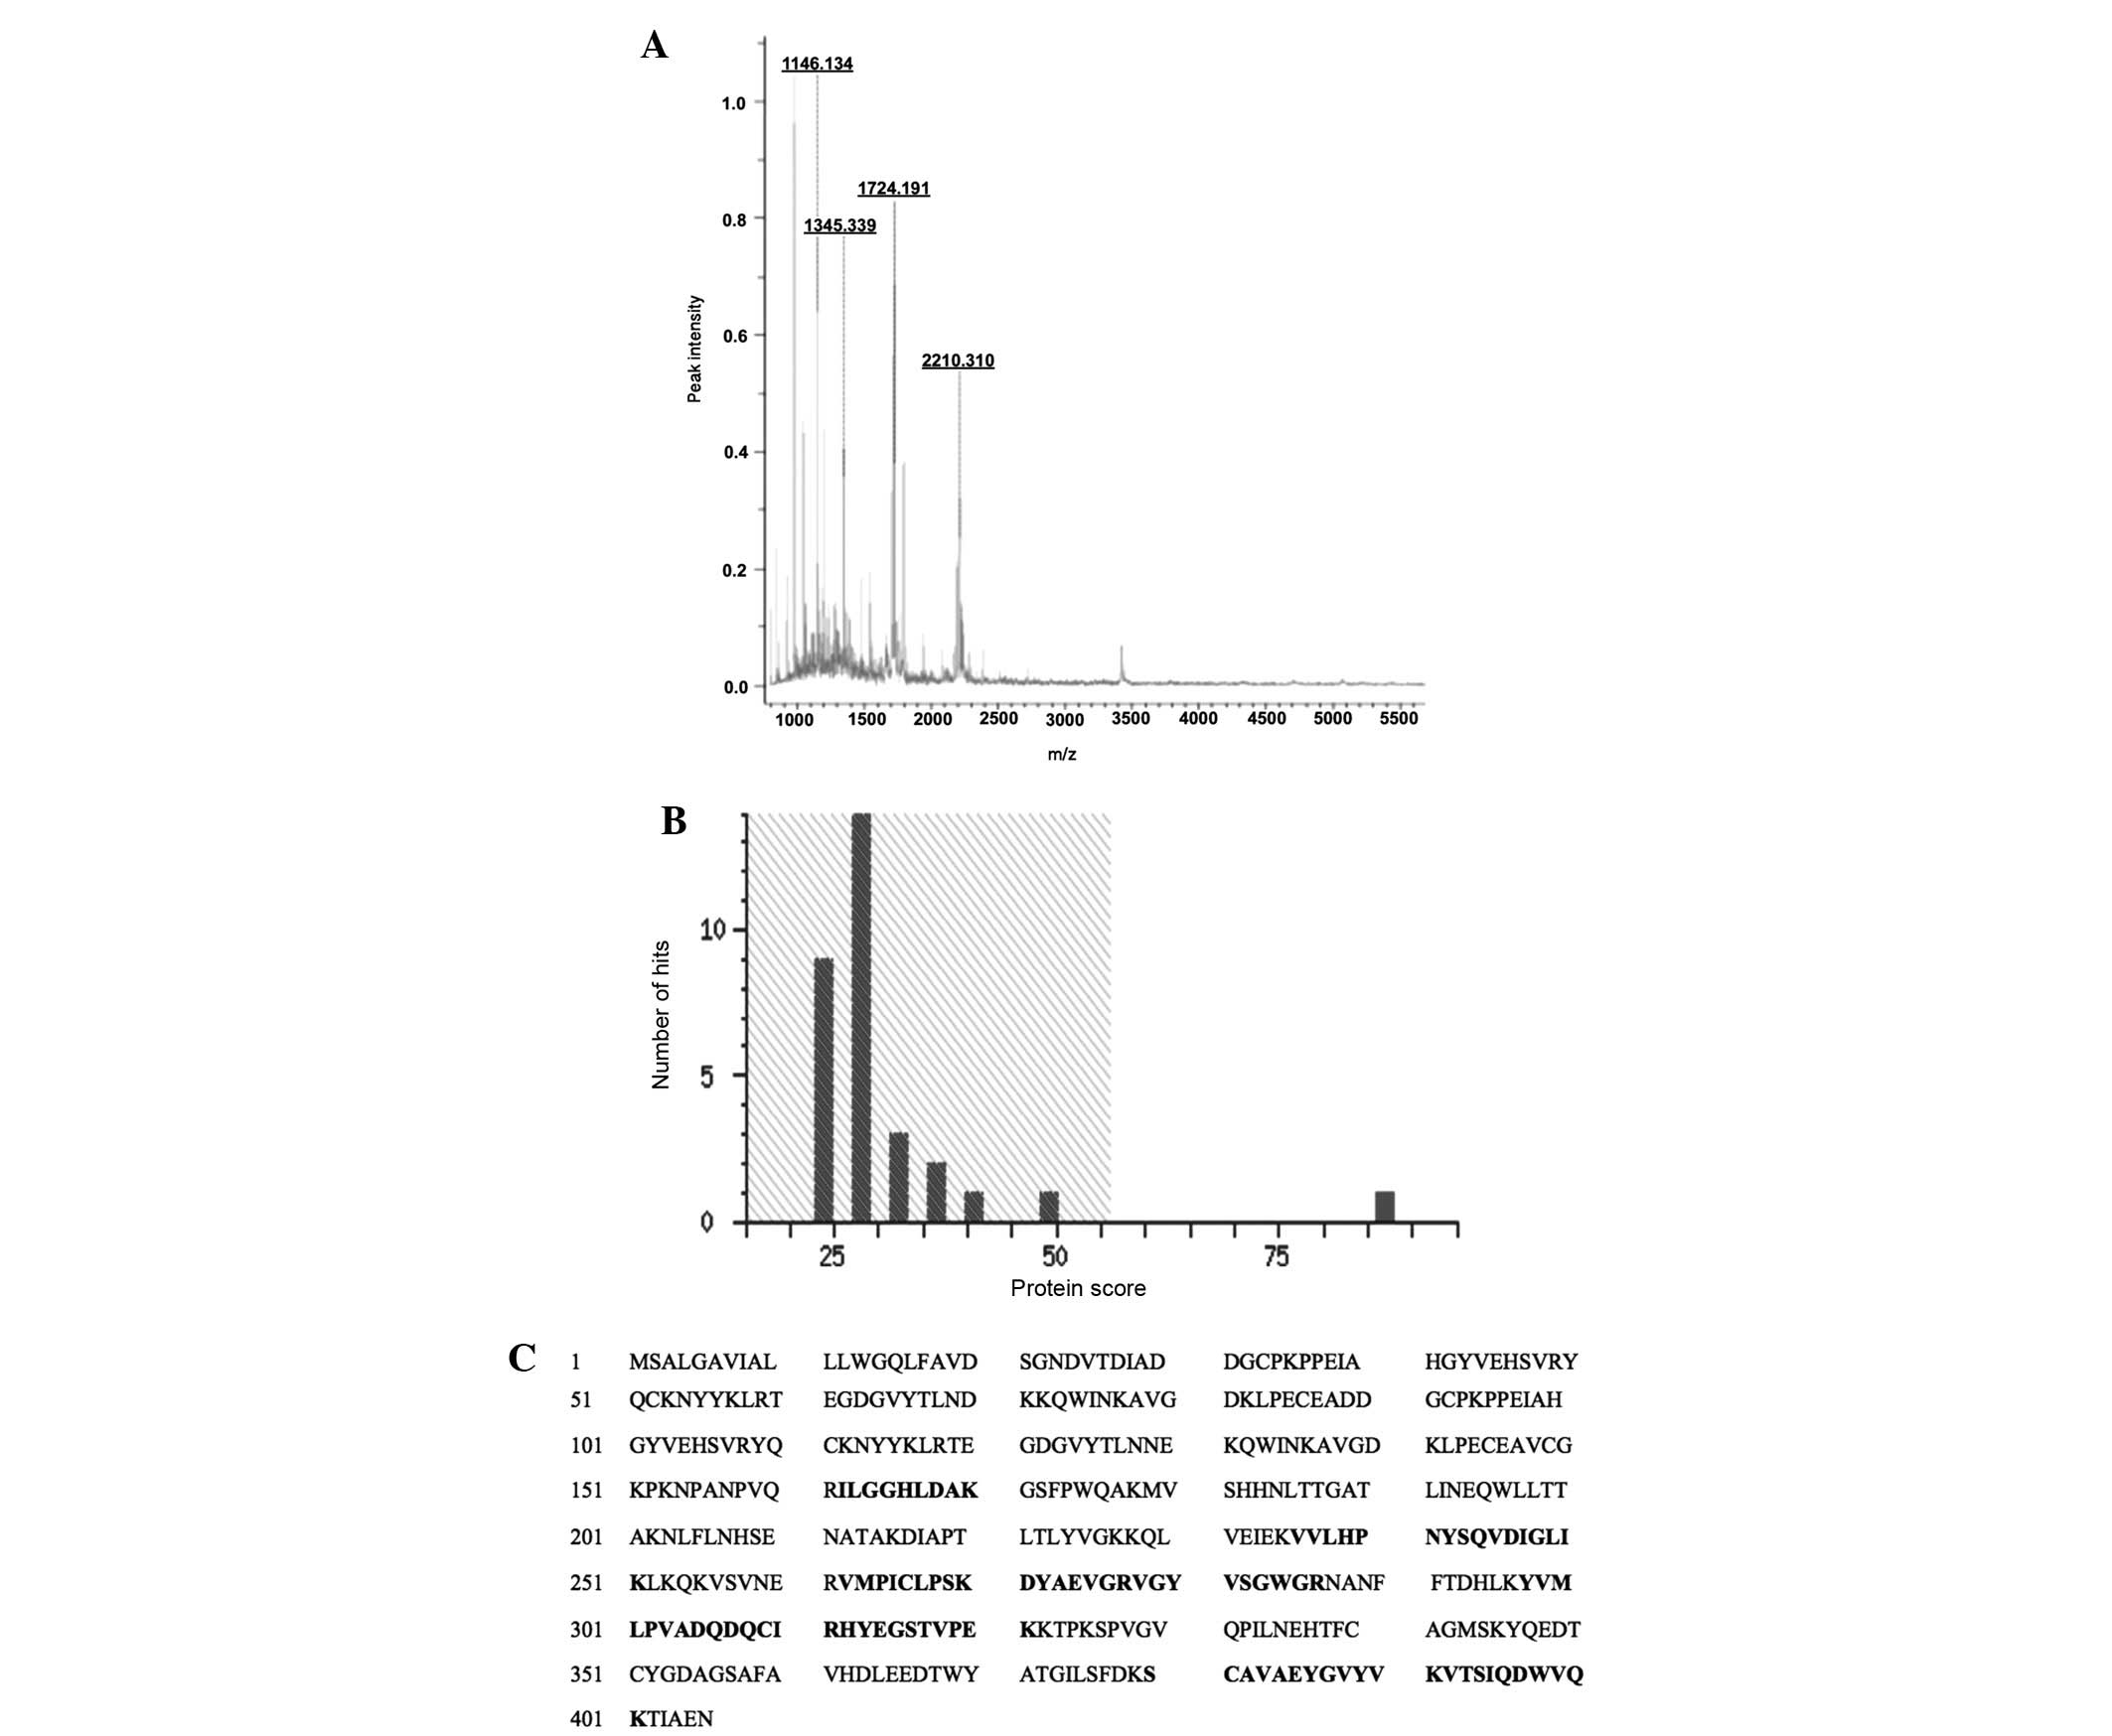
MALDI-TOF/TOF or peptide mass finger
printing analysis of the protein spots
Following in-gel digestion of the differentially
expressed protein spots, peptide mass fingerprinting was performed
to identify the protein, with a protein exhibiting high confidence
(Mascot score >60 and sequence coverage ≥20%) considered to be
valid. The mass spectrometric analysis parameters are summarized in
Table III, the Mascot
specifications are shown in Table
IV and the mass spectrum, score histrogram and peptide profile
of the identified protein are shown in Fig. 6. The Mascot analysis of the
identified peptides recognized the protein as human haptoglobin
(experimental mass 45.861 kDa), which has optimal confidence
parameters of a Mascot score of 87, sequence coverage of 23%,
isoelectric point of 6.13 and accession no. P00738. These values
are based on mass spectrometry and Mascot analysis. The observed
isoelectric point of the protein (5.5–6.2) was comparable to the
experimental one (6.13). The discrepancy from original value was
attributed to post-translational modifications.
| Table IIIMass spectrometric analysis parameters
for the protein profiling of the in-gel-digested peptides. |
Table III
Mass spectrometric analysis parameters
for the protein profiling of the in-gel-digested peptides.
| Laser beam wavelength
(nm) | Digitizer (GHz) | Mode of analysis | Ion acceleration
(kv) | Lens potential
(kv) | Laser frequency
(Hz) | Intensity (%) | Detector gain | Sample rate
(GS/s) |
|---|
| 337 | 2 | Linear positive | 25 | 6 | 100 | 60–70 | 7.5 | 0.5 |
| Table IVDetailed representation of peptide
mass fingerprinting and protein database analysis of the in-gel
digested peptides of the targeted protein. |
Table IV
Detailed representation of peptide
mass fingerprinting and protein database analysis of the in-gel
digested peptides of the targeted protein.
| Protein ID | Accession no. | Observed Mr
(kDa) | pI | Experimental Mr
(kDa) | pI | Mascot score | Sequence
coverage | Database | Mass values
searched | Mass values
matched |
|---|
| Haptoglobin | P00738 | 42–46 | 5.5–6.2 | 45.861 | 6.13 | 87 | 23 | SwissProt | 14 | 10 |
Human haptoglobin
Following excision, in-gel digestion, MALDI/TOF/TOF
analysis and database examination, the marked protein spot 'a' was
identified as haptoglobin. The protein had a molecular weight of
45.861 kDa, isoelectric point of 6.13, Mascot score of 87 and had
23% sequence coverage. The spectral view and Mascot score histogram
are shown in Fig. 6A and B,
respectively, while the matched sequence of peptides are shown in
Fig. 6C.
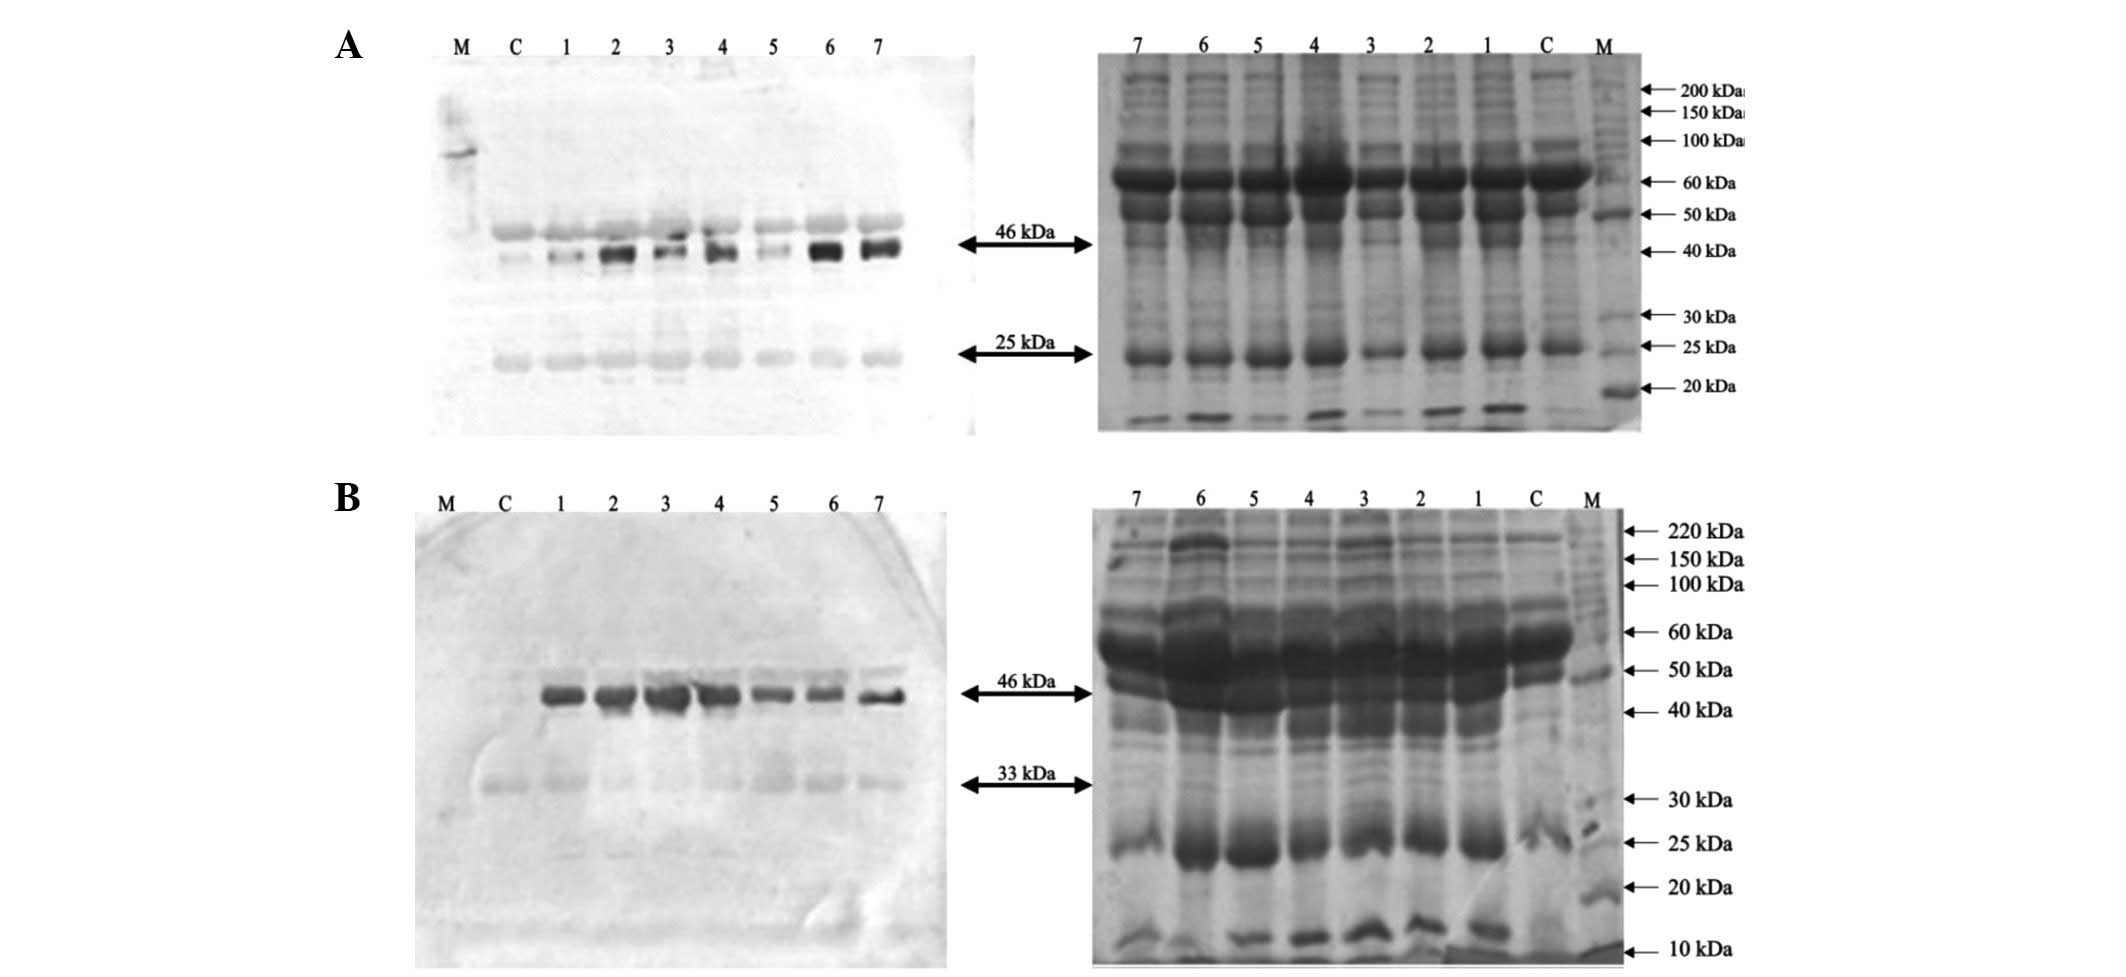
Immunological validation of haptoglobin
by western blot analysis
To support and justify the results of the
MALDI/TOF/TOF analysis, western blot analysis was performed for
haptoglobin using the procedure described above. This immunological
practice offers economical and valuable implementation for the
screening and detection of a particular antigen in any biological
sample. The haptoglobin protein demonstrated significant
upregulation in the squamous cell carcinoma and adenocarcinoma
groups, with relatively high expression in squamous cell carcinoma
(Fig. 7A and B). The results
revealed a high degree of immunoreactivity of this acute phase
protein by detecting dense bands at ~46 kDa, which confirmed high
expression in the squamous cell and adenocarcinoma groups compared
with the control. Protein bands were also observed at several other
positions, including 33, 25 and 50 kDa. This may have been due to
the presence of various isoforms of the haptoglobin protein
exhibiting affinity to the antibody. It is a common occurrence that
antibodies raised against the β-chain of haptoglobin also attach to
pre-pro-haptoglobin and pro-haptoglobin, as these proteins consist
of the complete amino acid sequence of the β-chain of haptoglobin
(21). The 25 kDa protein band
(Fig. 7A) corresponds to the
α-isoform (22), whilst the 33 kDa
protein (Fig. 7B) corresponds to
the unglycosylated β-chain, as reported by Oda et al
(23). The 50 kDa protein band
appears to be either an albumin-degraded fragment or
pro-haptoglobin, as described in a previous study (21). However, Kang et al (7) recognized the haptoglobin protein as
9, 19 and 45 kDa protein products, differing from their estimated
masses. This study suggested that β-chain of the haptoglobin
protein may be N-glycosylated and, therefore, identified at the
higher molecular mass of 45 kDa, which was confirmed by
Peptide:N-glycosidase F treatment.
In the present study, of all the proteins expressed,
the highest signal was obtained at 46 kDa revealing that this
isoform of haptoglobin exhibited maximum expression compared with
the other isoforms (Fig. 7A and
B). The normal molecular mass of the β-subunit of haptoglobin
is 38 kDa (13), however the
haptaglobin molecular mass of 46 kDa appeared to be due to
glycosylation. Modifications to the β-subunit of haptoglobin by
glycosylation have been previously reported (24). Therefore, the glycosylated
haptoglobin β-chain may serve as a sensitive predictor of lung
cancer compared to non-glycosylated forms and the high expression
of glycosylated β-haptoglobin in squamous cell carcinoma compared
with adenocarcinoma may further assist in differentiating between
the histopathalogical types of lung carcinoma.
The results of the present study assist in the
establishment of a screening methodology to evaluate and monitor
the expression of a particular disease biomarker in serum and to
access the treatment response of disease in patients. On the basis
of lung cancer serum protein profiling coupled with immunological
confirmation, the haptoglobin β-chain may offer a candidate lung
cancer protein biomarker for novel therapeutic targets to improve
the survival rates in patients with lung cancer. The role of
smoking was found to be critical during the course of the present
study, therefore, positive planning to improve outcomes is required
and the only technique to eradicate this alarming public health
issue is intersectoral collaboration. This biomarker protein may
assist in investigating in depth metabolic pathways and to
establish a set of therapeutic agents leading to early detection of
disease. In addition, conveying and communicating awareness to
smoking hazards and its life-threatening consequences is required
worldwide in order to decrease mortality rates and to promote the
eradication of lung cancer resulting in improved survival
rates.
By following several important preventive measures,
the incidence of lung cancer can be reduced. These include
prohibiting smoking and passive smoking, which increases the risk
of developing lung cancer more than smoking itself and wearing
masks while on roads, as several lung cancer patients involved in
the present study were exposed to air pollution or occupational
toxicity. Menthol cigarettes facilitate the deep penetration of
toxic smoke compounds and have been found to be more harmful and,
in females, the trend can also be minimized by excluding the use of
talc-based cosmetics, which causes serious injury to lungs.
References
|
1
|
Chen G, Gharib TG, Wang H, Huang CC, Kuick
R, Thomas DG, Shedden KA, Misek DE, Taylor JMG, Giordano TJ, Kardia
SLR, Iannettoni MD, Yee J, Hogg PJ, Orringer MB, Hanash SM and Beer
DG: Protein profiles associated with survival in lung
adenocarcinoma. Proc Natl Acad Sci USA. 100:13537–13542. 2003.
View Article : Google Scholar : PubMed/NCBI
|
|
2
|
Brambilla E, Travis WD, Colby TV, Corrin B
and Shimosato Y: The new World Health Organization classification
of lung tumours. Eur Respir J. 18:1059–1068. 2001. View Article : Google Scholar
|
|
3
|
Dalton WS and Friend SH: Cancer biomarkers
- an invitation to the table. Science. 312:1165–1168. 2006.
View Article : Google Scholar : PubMed/NCBI
|
|
4
|
Fung ET, Wright GL Jr and Dalmasso EA:
Proteomic strategies for biomarker identification: progress and
challenges. Curr Opin Mol Ther. 2:643–650. 2000.
|
|
5
|
Sung HJ and Cho JY: Biomarkers for the
lung cancer diagnosis and their advances in proteomics. BMB Rep.
41:615–625. 2008. View Article : Google Scholar : PubMed/NCBI
|
|
6
|
Druker BJ: Imatinibmesylate in the
treatment of chronic myeloid leukaemia. Expert Opin Pharmaco ther.
4:963–971. 2003. View Article : Google Scholar
|
|
7
|
Kang SM, Sung HJ, Ahn JM, Park JY, Lee SY,
Park CS and Cho JY: The Haptoglobin β chain as a supportive
biomarker for human lung Cancer. J Mol Bio Syst. 7:1167–1175.
2011.
|
|
8
|
Maciel CM, Junqueira M, Paschoal ME,
Kawamura MT, Duarte RL, CarvalhoMda G and Domont GB: Differential
proteomic serum pattern of low molecular weight proteins expressed
by adenocarcinoma lung cancer patients. J Exp Ther Oncl. 5:31–38.
2005.
|
|
9
|
Gruys E, Toussaint MJM, Niewold TA and
Koopmans SJ: Acute phase reaction and acute phase proteins. J
Zhejiang Univ Sci B. 6:1045–1056. 2005. View Article : Google Scholar : PubMed/NCBI
|
|
10
|
Kasprzyk M, Dyszkiewicz W, Zwarun D,
Lesniewska K and Wiktorowicz K: The assessment of acute phase
proteins as prognostic factors in patients surgically treated for
non-small cell lung cancer. Pneumonol Alergol Pol. 76:321–326.
2008.In Polish.
|
|
11
|
Andersen MN, Mouritzen CV and Gabrielli
ER: Mechanisms of plasma hemoglobin clearance after acute hemolysis
in dogs: serum haptoglobin levels and selective deposition in liver
and kidney. Ann Surg. 164:905–912. 1966. View Article : Google Scholar : PubMed/NCBI
|
|
12
|
Kurosky A, Barnett DR, Lee TH, Touchstone
B, Hay RE, Arnott MS, Bowman BH and Fitch WM: Covalent structure of
human haptoglobin: a serine protease homolog. Proc Natl Acad Sci
USA. 77:3388–3392. 1980. View Article : Google Scholar : PubMed/NCBI
|
|
13
|
Patzelt D, Geserick G and Schroder H: The
genetic haptoglobin polymorphism: relevance of paternity
assessment. Electrophoresis. 9:393–397. 1988. View Article : Google Scholar : PubMed/NCBI
|
|
14
|
Bradford MM: A rapid and sensitive method
for the quantitation of microgram quantities of protein utilizing
the principle of protein-dye binding. Anal Biochem. 72:248–254.
1976. View Article : Google Scholar : PubMed/NCBI
|
|
15
|
Judd RC: Purification of outer membrane
proteins of the gram-negative bacterium Neisseria gonorrhoeae. Anal
Biochem. 173:307–316. 1988. View Article : Google Scholar : PubMed/NCBI
|
|
16
|
Laemmli UK: Cleavage of structural
proteins during the assembly of the head of bacteriophage T4.
Nature. 227:680–685. 1970. View
Article : Google Scholar : PubMed/NCBI
|
|
17
|
Towbin HK, Staehelin T and Gordon J:
Elerophoretic transfer of protein from polyacrylamide gels to
nitrocellulose membrane. Proc Natl Acad Sci USA. 76:4350–4359.
1979. View Article : Google Scholar
|
|
18
|
Parkin DM, Bray F, Ferlay J and Pisani P:
Global cancer statistics. J Clin. 55:74–108. 2002, 2005. View Article : Google Scholar
|
|
19
|
Jemal A, Siegel R, Ward E, Murray T, Xu J,
Smigal C and Thun MJ: Cancer statistics. J Clin. 56:106–130. 2006.
View Article : Google Scholar
|
|
20
|
Ludwig JA and Weinstein JN: Biomarkers in
cancer staging, prognosis and treatment selection. Nat Rev Cancer.
5:845–856. 2005. View
Article : Google Scholar : PubMed/NCBI
|
|
21
|
Hanley JM, Haugen TH and Heath EC: Studies
on the biosynthesis of rabbit Haptoglobin. J Biol Chem.
258:7858–7869. 1983.PubMed/NCBI
|
|
22
|
Langlois MR and Delanghe JR: Biological
and clinical significance of haptoglobin polymorphism in humans.
Clin Chem. 42:1589–1600. 1996.PubMed/NCBI
|
|
23
|
Oda K, Miki K, Hirose S, Takami N, Misumi
Y and Ikehara Y: Immunoblotting analysis of plasma protein
processing in the secretory pathway of rat liver: identification of
proteolytic conversion sites of complement pro-C3 and
prohaptoglobin. J Biochem. 100:1669–1675. 1986.PubMed/NCBI
|
|
24
|
Hoagland L, Campa M, Gottlin E, Herndon J
and Patz E: Haptoglobin and post-translational glycan-modified
derivatives as serum biomarkers for the diagnosis of non-small cell
lung cancer. 110:2260–2268. 2007.
|