Introduction
Congenital intestinal aganglionosis, which is also
referred to as Hirschsprung's disease (HSCR) is a common
gastrointestinal deformity in children that is caused by defects
that occur during the migration, proliferation, differentiation,
survival and apoptosis of gut neural crest stem cells (1). HSCR has an incidence of 1/5,000 live
births and a male:female ratio of ~4:1 (2). Epidemiological and animal studies
have demonstrated that the etiology of the disease is associated
with various genes, including the proto-oncogene, RET, endothelin
signaling gene and transcription factors (3,4).
However, the exact mechanism underlying the pathogenesis of HSCR
remains to be fully elucidated. In the present study, human cDNA
microarray technology was applied, and the results were
comparatively analyzed using various techniques to determine
differences in gene expression profiles on the same chip between
normal colon tissue samples and those from patients with HSCR. This
involved the preliminary screening for genes with differential
expression levels in the colorectal lesions of children with HSCR,
which were compared with normal colon tissue samples. Differences
in gene expression may provide information regarding HSCR candidate
genes.
Materials and methods
Specimen collection
The subjects of the present study included six
children with HSCR (five males and one female, aged between 13 days
and 4 years old) with no other concurrent abnormalities. The
children were recruited from the Department of Neonatal
Gastrointestinal Surgery at the Children's Hospital of Chongqing
Medical University (Chongqing, China). Written-informed consent was
obtained from the family of the patients. Under sterile surgical
conditions, full-thickness bowel tissues were cut from the
stricture, expansion and anastomotic sections, and trimmed into
tissue blocks (0.3–0.5 × 0.5–1.0 cm). These tissue samples were
placed in sterile aluminum foil for rapid storage in liquid
nitrogen. The stricture was located and used as the experimental
tissue specimen. The control group included three randomly selected
male cases (from the original five males). The normal colon tissue
samples were used as control specimens, and were collected from
colorectal trauma cases and from the stoma during leakage closure
following congenital anorectal transverse colostomy. The control
samples were sectioned in a similar manner to the patient samples.
The study was approved by the ethics committee of the Children's
Hospital of Chongqing Medical University.
Array information
An Agilent Human 4×44 K Gene Expression Microarray
v.2 was supplied by KangChen Bio-tech Inc. (Shangha, China), and
used to perform the gene expression profiles of the nine human
tissue samples (project code H1305022).
The whole human genome oligo microarray represents
all known genes and transcripts of the human genome. The sequences
were compiled from a broad source survey prior to verification and
optimization via alignment to the assembled human genome. Coupled
with Agilent probe selection and a robust validation processes,
this method provides increased data quality and reduces
gene-coverage redundancy (unpublished data). The targets were
27,958 Entrez Gene RNAs. The content was sourced from RefSeq Build
36.3 (http://www.ncbi.nlm.nih.gov/refseq/), Ensemble Release
52 (http://asia.ensembl.org/index.html?redirect=no),
Unigene Build 216 (http://www.ncbi.nlm.nih.gov/unigene/) and GenBank
(http://www.ncbi.nlm.nih.gov/genbank).
RNA extraction and quality control
The tissue samples were cryopulverized using
BioPulverizer™ (BioSpec Products Inc, Bartlesville, OK, USA) prior
to being placed in liquid nitrogen. The tissue samples were then
further homogenized using a Mini-Bead-Beater-16 (BioSpec Products
Inc). Total RNA was extracted using TRIzol® (Invitrogen;
Thermo Fisher Scientific, Inc., Waltham, MA, USA) and an RNeasy
Mini Spin column (Qiagen, Shanghai, China) according to the
manufacturer's protocol. RNA integrity and concentration were
assessed following RNA extraction and prior to sample labeling. RNA
integrity was assessed using agarose gel electrophoresis (Enzo Life
Sciences, Inc., Farmingdale, NY, USA). Intact total RNA separated
on a denaturing gel exhibits distinct 28S and 18S rRNA bands
(eukaryotic samples), with the 28S rRNA band being approximately
twice as intense as the 18S rRNA band. This 2:1 intensity ratio
indicates that the RNA is intact (unpublished data). A NanoDrop
ND-1000 spectrophotometer was used to accurately measure the RNA
concentrations at optical density (OD)260, protein contamination
(ratio of OD260/OD280) and organic compound contamination (ratio of
OD260/OD230). The results typically provided total RNA with an
OD260/OD280 ratio >1.8.
The whole procedure was performed in accordance with
manufacturer's instruction, including RNA sample preparation, total
RNA clean-up and quality control, labeling reaction preparation,
purification of the labeled/amplified RNA, labeled cRNA quality
control, hybridization, microarray washing and scanning. The
specific activity (pmol dyes/µg genomic DNA) of the labeled
genomic DNA was obtained using the following equation: Specific
activity = (concentration of Cy3) / (concentration of cRNA) × 1,000
= pmol Cy3 per µg cRNA. If the yield was <1.65 µg,
and the specific activity was <9.0 pmol Cy3/µg cRNA, the
hybridization step did not proceed, and re-preparation of the cRNA
was required.
RNA labeling and in situ
hybridization
Sample labeling and array hybridization were
performed using Agilent One-Color Microarray-Based Gene Expression
Analysis (Agilent Technologies, Inc., Santa Clara, CA, USA),
according the manufacturer's instructions. The total RNA from each
sample was linearly amplified and labeled using Cy3-UTP (Enzo Life
Sciences). The labeled cRNAs were purified using an RNeasy Mini kit
(Qiagen). The concentration and specific activity levels of the
labeled cRNAs (pmol Cy3/µg cRNA) were measured using the
NanoDrop ND-1000 spectrophotometer. A total of 1 µg of each
labeled cRNA was fragmented by adding 11 µl 10X blocking
agent (Agilent Technologies, Inc.) and 2.2 µl of 25X
fragmentation buffer (Agilent Technologies, Inc.). The mixture was
then heated to 60°C for 30 min, and 55 µl 2X GE
hybridization buffer (Agilent Technologies, Inc.) was added to
dilute the labeled cRNA. A total of 100 µl hybridization
solution was dispensed into a gasket slide, which was added to the
gene expression microarray slide. The slides were incubated for 17
h at 65°C in an Agilent hybridization oven (Agilent Technologies,
Inc.). The hybridized arrays were washed with Milli-Q water
(Millipore, Billerica, MA, USA), fixed, and scanned using an
Agilent DNA Microarray Scanner (G2505C; Agilent Technologies,
Inc.).
An Agilent Quick Amp Labeling kit (Agilent
Technologies, Inc.) was used for the sample labeling. Hybridization
was performed in Agilent SureHyb Hybridization Chambers (Agilent
Technologies, Inc.). In GeneSpring GX v11.5.1, a normalized value
is a relative number that comes from the ratio of the comparison
between the raw value of the listed probe and that of the controls.
Normalized values were calculated based on the normalization method
applied to the data. Please refer to the technical note for
information on how the control values were calculated. For
one-color data, the four normalization methods (median, scale,
quantile, and normalization to control genes) were used. For
two-color data, each raw intensity value corresponding to the
control channel was adjusted using a locally-weighted Lowess
regression method. Each value in the signal channel was divided by
the adjusted control value, resulting in the final normalized
value.
Data collection and analysis
The slides were washed with Milli-Q water and
subsequently scanned using the Agilent DNA Microarray Scanner
(Agilent Technologies, Inc.). Data was collected using Agilent
Feature Extraction software (Agilent Technologies, Inc.).
Normalization and data analysis were performed using Agilent
GeneSpring GX v11.5.1 (Agilent Technologies, Inc.). The results
were provided in the Gene Expression Profiling Data.xls file
and Data Analysis Folder. Agilent Feature Extraction
software v11.0.1.1 (Agilent Technologies, Inc.) was used to analyze
the acquired array images. Quantile normalization and subsequent
data processing were performed using the GeneSpring GX v11.5.1
software package (Agilent Technologies, Inc.). Following quantile
normalization of the raw data, genes for which a minimum of three
out of the nine samples were statistically significant were
selected for further data analysis. Genes that were differentially
expressed in the two groups to a statistically significant degree
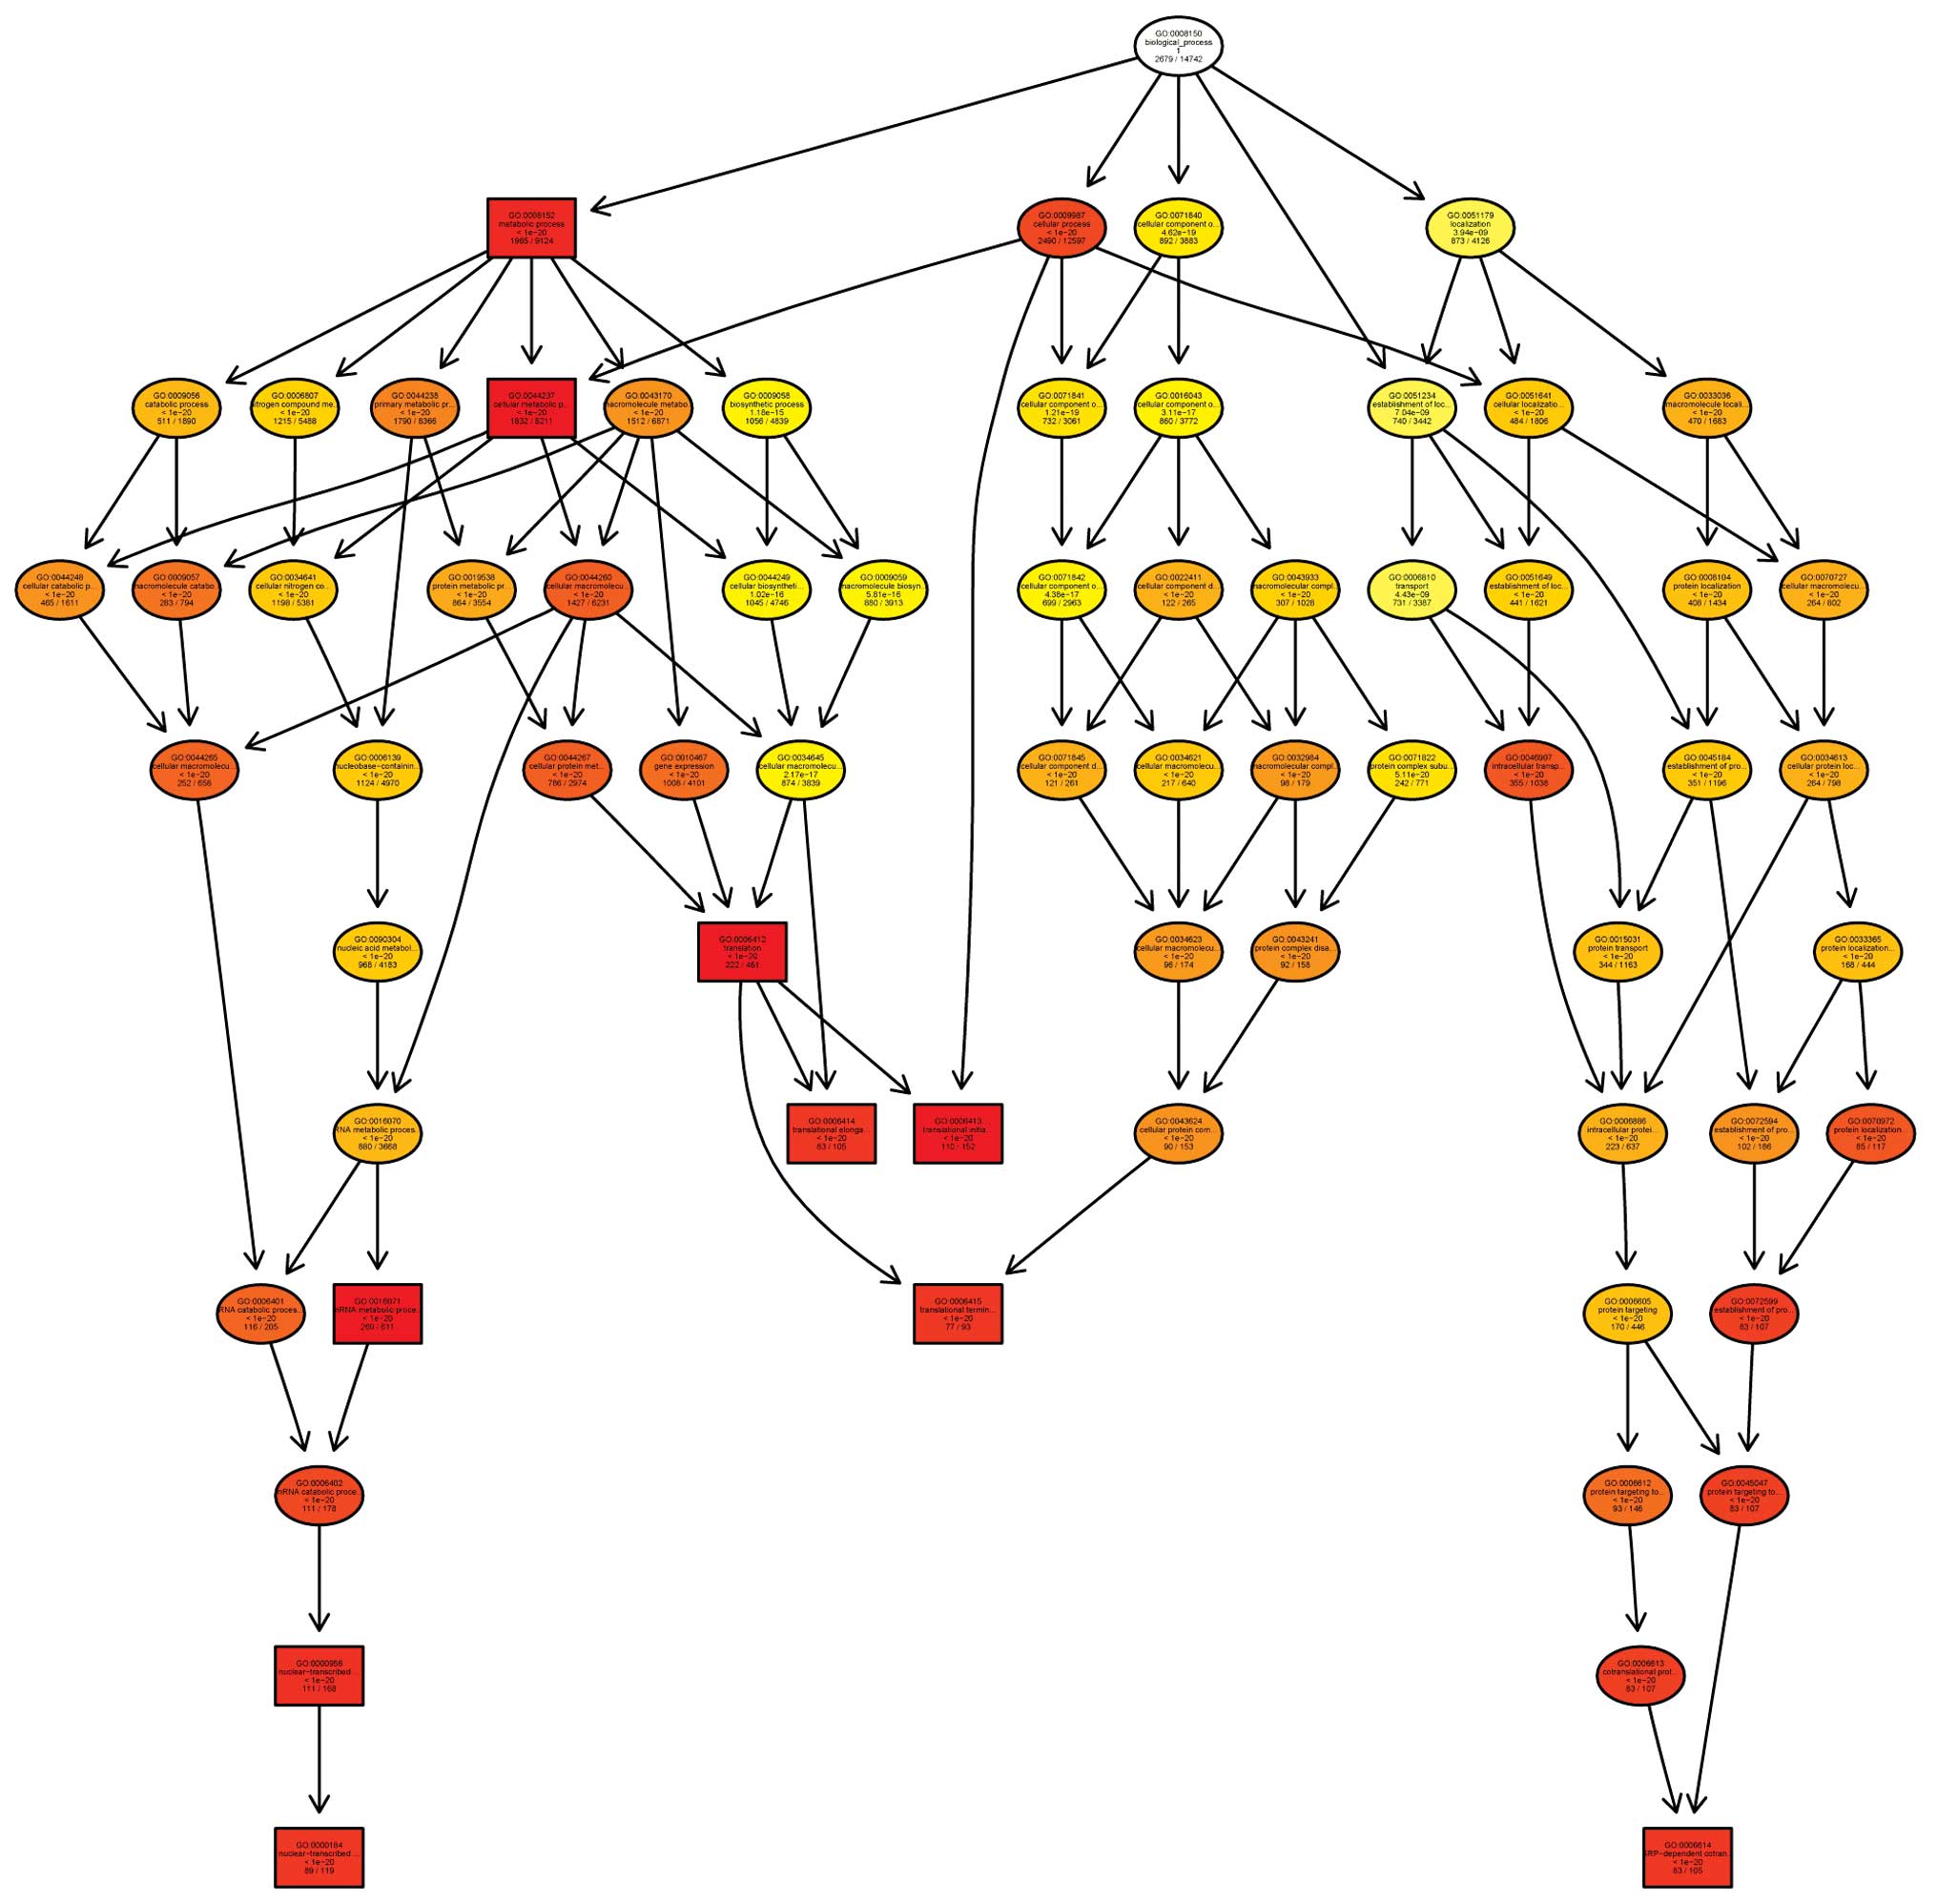
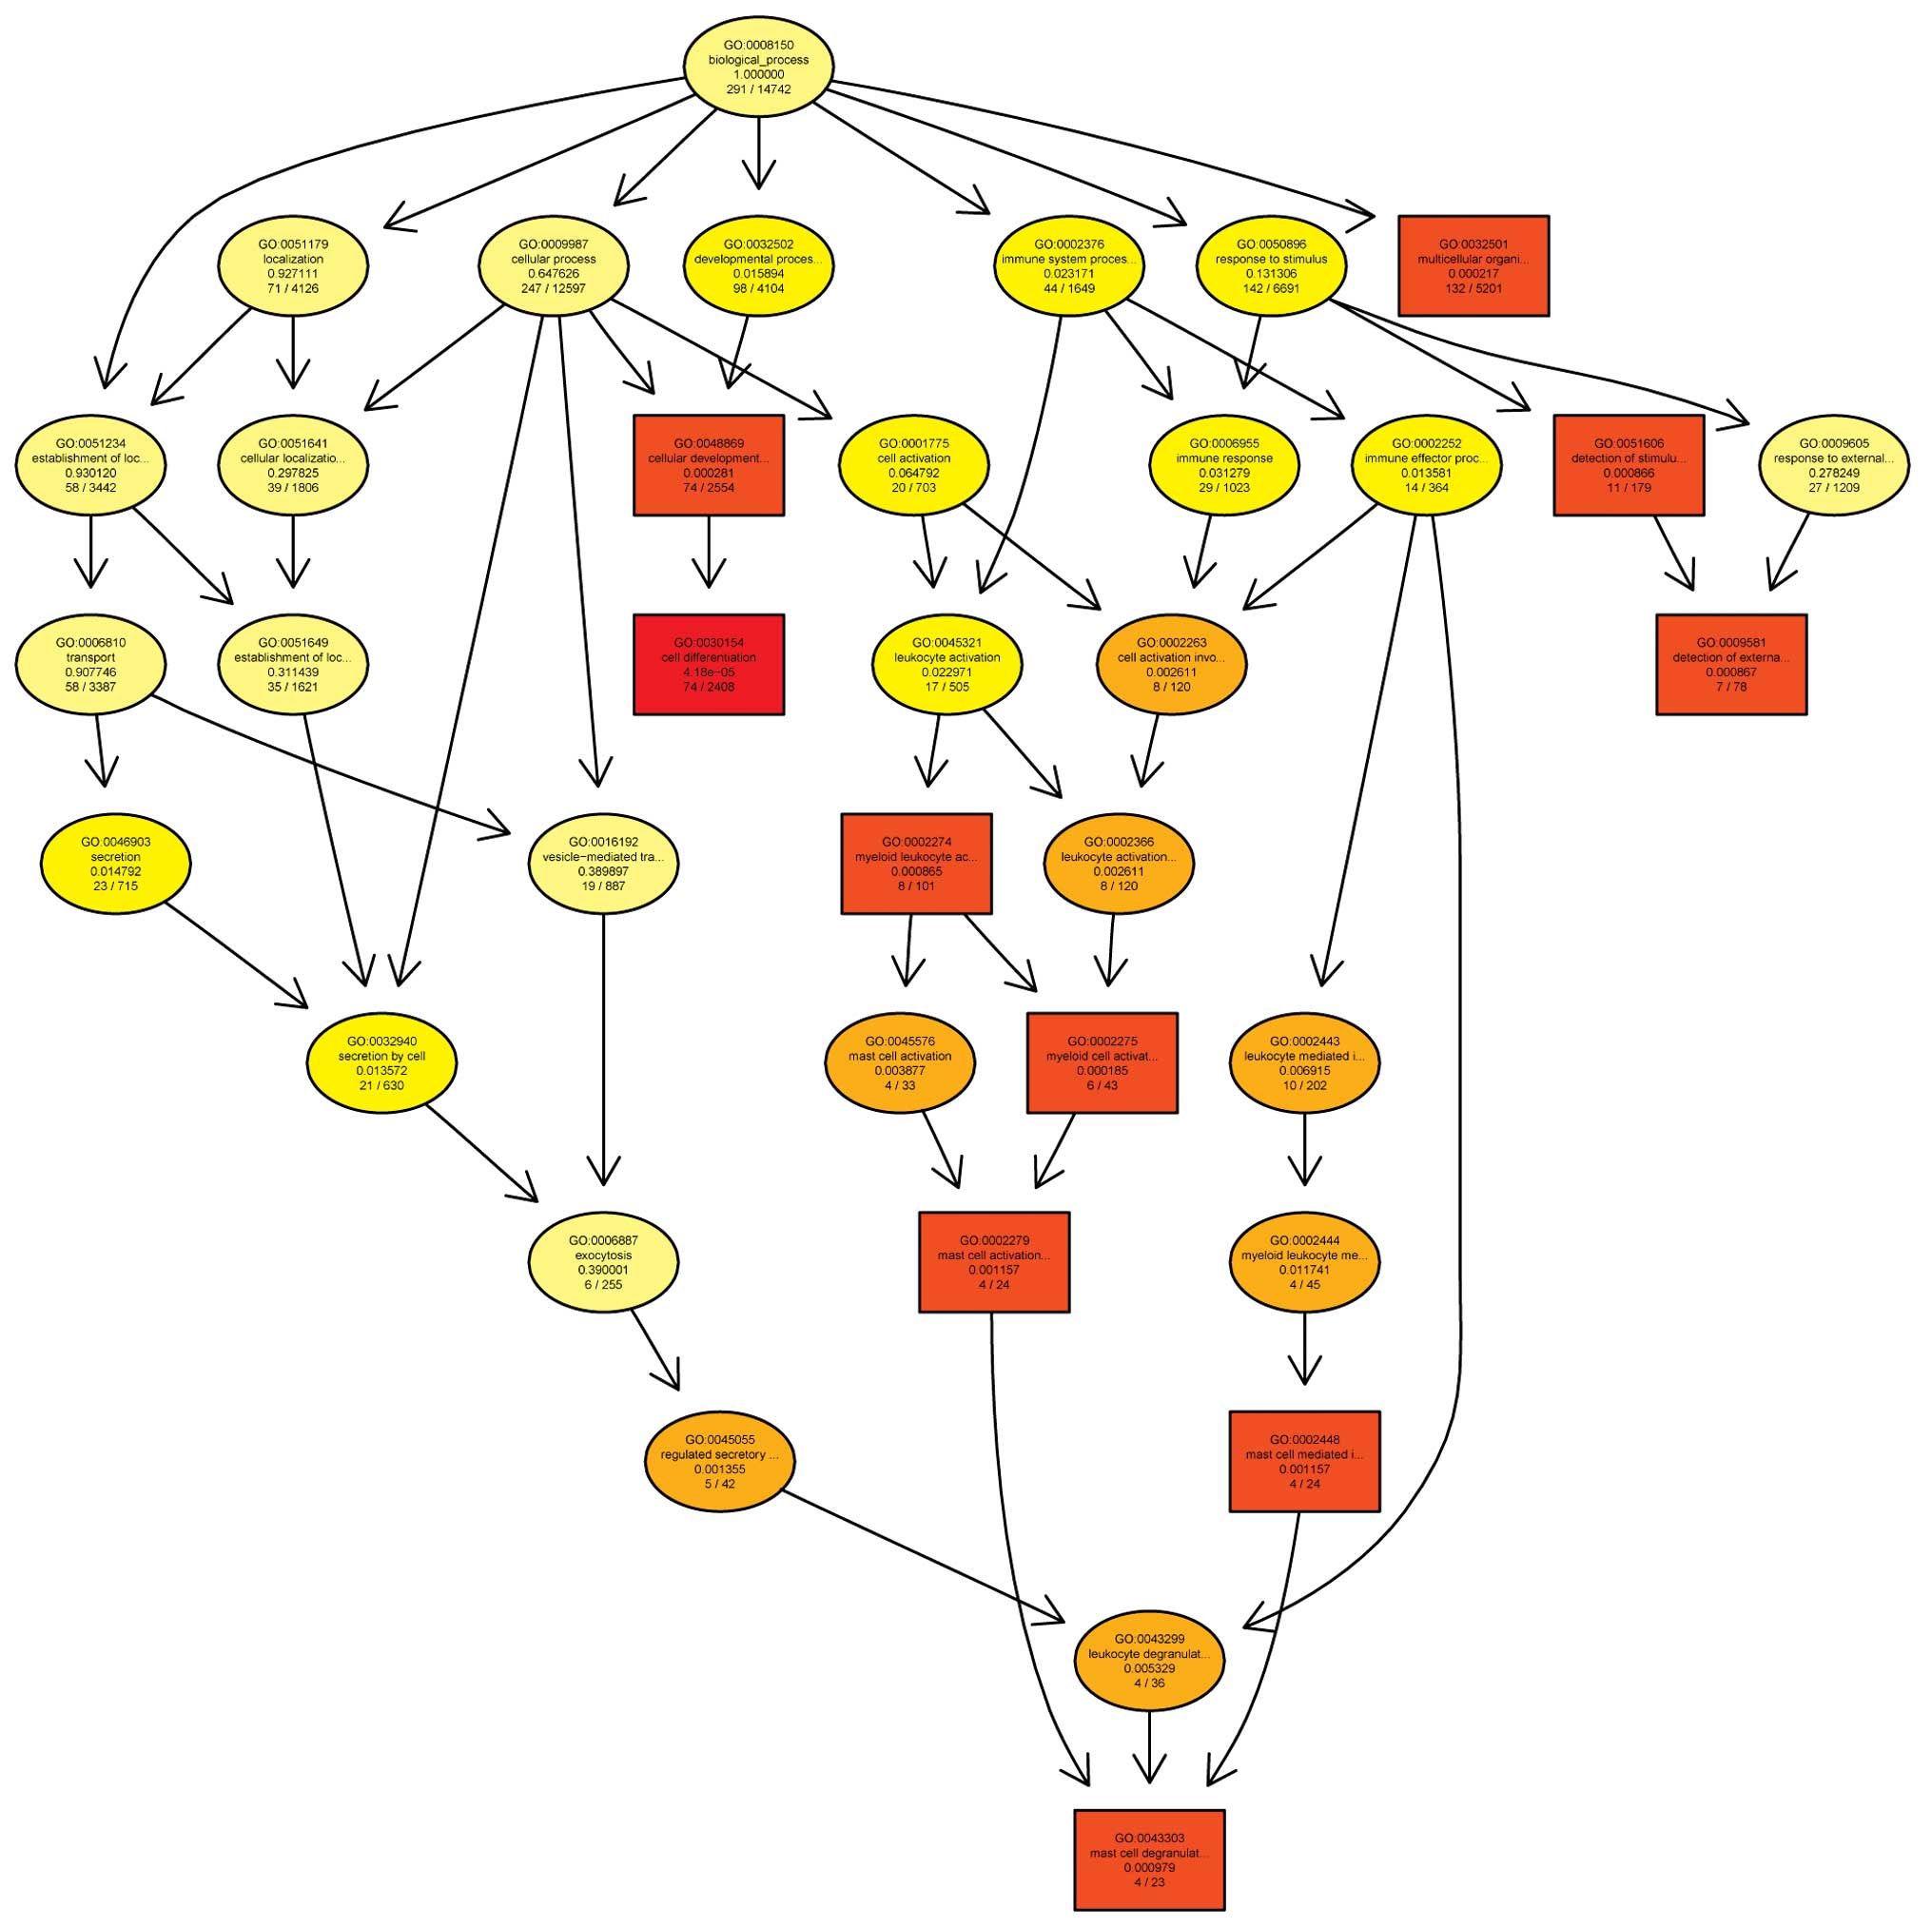
were identified using volcano plot filtering. Hierarchical
clustering was performed using Agilent GeneSpring GX software
v11.5.1 (Agilent Technologies, Inc.). Gene ontology (GO) analysis
and pathway analysis were performed using a standard enrichment
computation method. The results were analyzed for three parameters:
Molecular function, biological process and cellular components. The
analyses were based on volcano plots, box plots, scatter plots,
heat maps, hierarchical clustering, P-values, absolute fold change
and GO assessed. Preliminary screening was used to determine the
genes with statistically significant differences in expression
levels in children with HSCR, in order to determine target genes
for further verification and analysis step.
Results
Total RNA extraction and quality
assurance
A NanoDrop ND-1000 spectrophotometer was used to
accurately measure the RNA concentrations (OD260), protein
contamination (ratio of OD260/OD280) and organic compound
contamination (ratio of OD260/OD230). The results typically
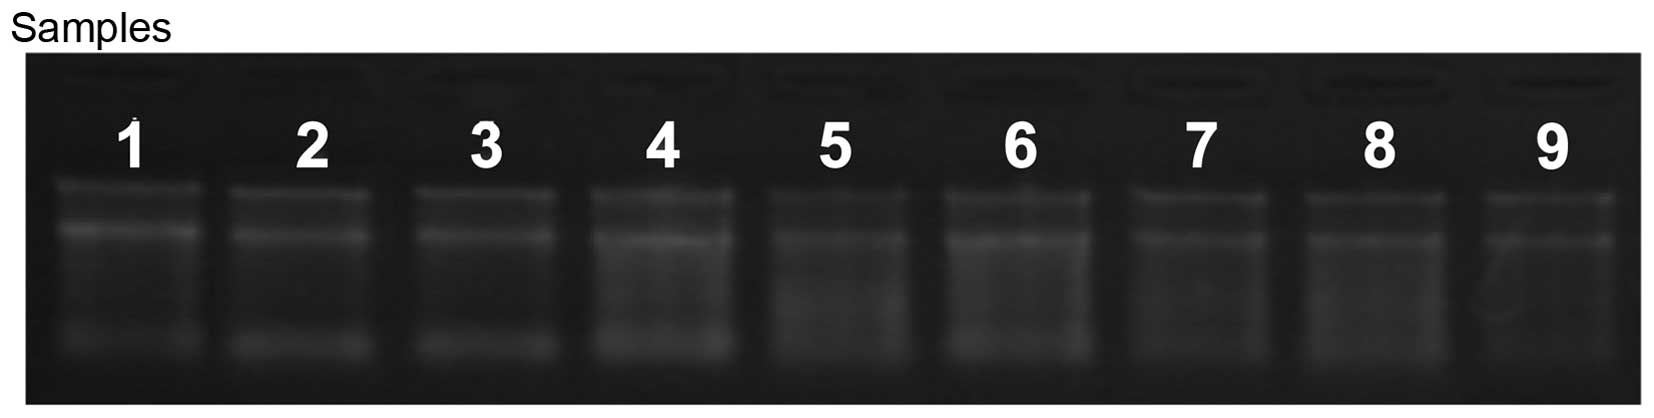
provided total RNA with an OD260/OD280 ratio >1.8. RNA integrity
was assessed using agarose gel electrophoresis. Intact total RNA
separated on the denaturing gel exhibited marked 28S and 18S rRNA
bands (eukaryotic samples), with the 28S rRNA being approximately
twice as intense as the 18S rRNA band. This 2:1 intensity ratio
indicated that the RNA was intact (Tables I and II; Fig.
1). A total of 1 µg RNA was used for labeling and the
specific activity levels (pmol dye/µg cRNA) of the labeled
RNA was determined.
 | Table IRNA quantification and quality
assurance. |
Table I
RNA quantification and quality
assurance.
| Sample ID | OD260/280
ratio | OD260/230
ratio | Conc.
(ng/µl) | Volume
(µl) | Quantity (ng) | QC pass or
fail |
|---|
| 2 | 2.01 | 2.29 | 1,002.25 | 80 | 80,180.00 | Pass |
| 3 | 1.99 | 1.98 | 534.28 | 10 | 5,342.80 | Pass |
| 4 | 1.99 | 2.29 | 1,084.86 | 80 | 86,788.80 | Pass |
| 10 | 1.99 | 2.32 | 954.17 | 60 | 57,250.20 | Pass |
| 13 | 1.98 | 2.24 | 653.52 | 50 | 32,676.00 | Pass |
| 16 | 1.99 | 2.26 | 914.64 | 80 | 73,171.20 | Pass |
| 20 | 1.93 | 2.25 | 593.50 | 10 | 73,171.20 | Pass |
| 21 | 1.91 | 2.28 | 538.83 | 20 | 10,776.60 | Pass |
| 26 | 2.00 | 2.29 | 1,237.42 | 60 | 74,245.20 | Pass |
| Table IILabeling efficiency quality
control. |
Table II
Labeling efficiency quality
control.
| Sample ID | Dye name | Dye
(pmol/µl) | cRNA
concentration
(µg/µl) | Specific
activitya
(pmol dye/µg cRNA) | Volume
(µl) | Total
quantity
(µg) |
|---|
| 2 | Cy3 | 16.69 | 0.74462 | 22.41412 | 20 | 14.892 |
| 3 | Cy3 | 16.79 | 0.72459 | 23.17172 | 20 | 14.492 |
| 4 | Cy3 | 16.71 | 0.76486 | 21.84714 | 20 | 15.297 |
| 10 | Cy3 | 16.59 | 0.72675 | 22.82766 | 20 | 14.535 |
| 13 | Cy3 | 16.13 | 0.71639 | 22.51567 | 20 | 14.328 |
| 16 | Cy3 | 16.85 | 0.76996 | 21.88425 | 20 | 15.399 |
| 20 | Cy3 | 16.77 | 0.74127 | 22.62334 | 20 | 14.825 |
| 21 | Cy3 | 16.36 | 0.79604 | 20.55173 | 20 | 15.921 |
| 26 | Cy3 | 16.31 | 0.70736 | 23.05757 | 20 | 14.147 |
Determination of normalized values from
the initially loaded raw data
In GeneSpring GX v11.5.1, a normalized value is a
relative number, originating from the raw value ratio of the listed
probe of the control (unpublished data).
Genes with differential expression
levels
Microarray technology was used to examine the human
gene expression profiles of the colorectal lesions (spasm segment)
of children with HSCR, compared with the normal colon tissue
samples, used as a control. In the present study, the primary aim
was to determine the biological processes underlying the pathology
of the disease, particularly regarding growth-associated genes and
their association with signaling pathways (Figs. 2 and 3).
Of >20,000 detected human genes, preliminary
screening revealed 3,850 differentially expressed genes with
upregulated expression levels, (P<0.05; absolute fold changes
>2-fold). Among those upregulated genes, the P-values were as
follows: P=0.01–0.05 for 154 genes, P=0.001–0.009 for 468 genes,
P=0.0001–0.0009 for 834 genes and P<0.0001 for 2,394 genes. The
absolute fold changes were >10 for 28 genes, 5–10 for 286 genes,
3–5 for 1,343 genes, and <3 for 2,193 genes.
A total of 645 differentially expressed genes with
downregulated expression levels were identified, (P<0.05;
absolute fold changes >2-fold). Among the downregulated genes,
the P-values were as follows: P=0.01–0.05 for 52 genes,
P=0.001–0.009 for 111 genes, P=0.0001–0.0009 for 142 genes and
P<0.0001 for 321 genes. The absolute fold changes were >10
for 13 genes, 5–10 for 37 genes, 3–5 for 93 genes, and <3 for
483 genes.
Of the upregulated genes, 118 were involved in
widely-recognized signal transduction pathways (P<0.01),
including 48 genes with P=0.01–0.0001 and absolute fold changes
>2-fold and 70 genes with P<0.0001 and absolute fold changes
>2-fold. Of the downregulated genes, 11 genes were involved in
classic signaling pathways (P<0.001; absolute fold changes
>2-fold. Certain differentially expressed genes exhibiting
upregulated or downregulated expression levels are presented in
Tables III and IV.
| Table IIISelected upregulated genes with
differential expression levels in the Hirschsprung's disease and
normal tissues samples. |
Table III
Selected upregulated genes with
differential expression levels in the Hirschsprung's disease and
normal tissues samples.
| Probe | P-value | Absolute fold
change
(Test, vs. Control) |
Regulation
(Test, vs. Control) | Gene symbol | Description |
|---|
| A_23_P131676 | <0.0001 | 13.0916 | Up | CXCR7 | Homo sapiens
chemokine (C-X-C motif) receptor, mRNA [NM_020311] |
| A_23_P34915 | 0.0005 | 16.0183 | Up | ATF3 | Homo sapiens
activating transcription factor 3, transcript variant 4, mRNA
[NM_001040619] |
| A_33_P3323298 | <0.0001 | 19.6882 | Up | JUN | Homo sapiens
jun proto-oncogene, mRNA [NM_002228] |
| A_33_P3382856 | <0.0001 | 12.2331 | Up | DCN | Homo sapiens
decorin, transcript variant E, mRNA [NM_133507] |
| A_33_P3246268 | <0.0001 | 6.8989 | Up | HOXD13 | Homo sapiens
homeobox D13, mRNA [NM_000523] |
| A_33_P3332018 | 0.0001 | 6.8305 | Up | FGL2 | Homo sapiens
fibrinogen-like 2, mRNA [NM_006682] |
| A_23_P204630 | <0.0001 | 6.8007 | Up | NTN4 | Homo sapiens
netrin 4, mRNA [NM_021229] |
| A_24_P681301 | <0.0001 | 6.2878 | Up | UBC | Homo sapiens
ubiquitin C, mRNA [NM_021009] |
| A_33_P3294252 | <0.0001 | 6.2697 | Up | ATF1 | Homo sapiens
activating transcription factor 1, mRNA [NM_005171] |
| A_33_P3341499 | 0.0008 | 5.7485 | Up | WNT5A | Homo sapiens
wingless-type MMTV integration site family, member 5A, mRNA
[NM_003392] |
| A_23_P46045 | 0.0013 | 4.3238 | Up | RGS5 | Homo sapiens
regulator of G-protein signaling 5, transcript variant 1, mRNA
[NM_003617] |
| A_23_P105251 | 0.0007 | 3.5154 | Up | GLI1 | Homo sapiens
GLI family zinc finger 1, transcript variant 1, mRNA
[NM_005269] |
| A_23_P161190 | 0.0014 | 3.4808 | Up | VIM | Homo sapiens
vimentin, mRNA [NM_003380] |
| A_23_P60387 | <0.0001 | 3.5481 | Up | NOTCH1 | Homo sapiens
notch 1, mRNA [NM_017617] |
| A_33_P3313055 | <0.0001 | 2.7250 | Up | NOTCH3 | Homo sapiens
notch 3, mRNA [NM_000435] |
| A_33_P3316621 | 0.0139 | 4.3922 | Up | BMP3 | Homo sapiens
bone morphogenetic protein 3, mRNA [NM_001201] |
| A_33_P3342613 | 0.0031 | 2.3638 | Up | ZDHHC8 | Homo sapiens
zinc finger, DHHC-type containing 8, transcript variant 2, mRNA
[NM_013373] |
| A_24_P351420 | 0.0028 | 3.3429 | Up | ZDHHC3 | Homo sapiens
zinc finger, DHHC-type containing 3, transcript variant 2, mRNA
[NM_016598] |
| A_23_P389919 | 0.0003 | 5.5806 | Up | WHSC1 | Homo sapiens
Wolf-Hirschhorn syndrome candidate 1, transcript variant 1, mRNA
[NM_133330] |
| A_24_P83183 | 0.0001 | 2.7925 | Up | WHSC2 | Homo sapiens
Wolf-Hirschhorn syndrome candidate 2, mRNA [NM_005663] |
| Table IVSelected downregulated genes with
differential expression levels in Hirschsprung's disease and normal
tissue samples. |
Table IV
Selected downregulated genes with
differential expression levels in Hirschsprung's disease and normal
tissue samples.
| Probe | P-value | Absolute fold
change
(T, vs. C) |
Regulation
(T, vs. C) | Gene symbol | Description |
|---|
| A_23_P145644 | <0.0001 | 13.5701 | Down | DDC | Homo sapiens
dopa decarboxylase (aromatic L-amino acid decarboxylase),
transcript variant 2, mRNA [NM_000790] |
| A_23_P253446 | 0.0003 | 9.0073 | Down | GAP43 | Homo sapiens
growth associated protein 43, transcript variant 2, mRNA
[NM_002045] |
| A_33_P3353941 | 0.0465 | 8.1737 | Down | PIK3CD | Homo sapiens
phosphoinositide-3-kinase, catalytic, delta polypeptide, mRNA
[NM_005026] |
| A_24_P88696 | <0.0001 | 8.0735 | Down | SCG2 | Homo sapiens
secretogranin II, mRNA [NM_003469] |
| A_23_P140290 | 0.0001 | 5.8798 | Down | RTN1 | Homo sapiens
reticulon 1, transcript variant 1, mRNA [NM_021136] |
| A_23_P378926 | 0.0005 | 5.6988 | Down | ADRA2B | Homo sapiens
adrenergic, alpha-2B-receptor, mRNA [NM_000682] |
| A_33_P3393010 | <0.0001 | 5.2971 | Down | PKDCC | Protein kinase
domain containing, cytoplasmic homolog (mouse) [Source: HGNC,
Symbol; Acc: 25123] [ENST00000492861] |
| A_33_P3725227 | 0.0286 | 4.4080 | Down | COBL | Homo sapiens
cordon-bleu homolog (mouse), mRNA [NM_015198] |
| A_23_P85903 | 0.0001 | 4.1725 | Down | TLR5 | Homo sapiens
toll-like receptor 5, mRNA [NM_003268] |
| A_32_P27479 | <0.0001 | 4.0215 | Down | NLRP11 | Homo sapiens
NLR family, pyrin domain containing 11, mRNA [NM_145007] |
| A_33_P3725227 | 0.0286 | 4.4080 | Down | COBL | Homo sapiens
cordon-bleu homolog (mouse), mRNA [NM_015198] |
| A_24_P307974 | <0.0001 | 3.7791 | Down | TAF8 | TAF8 RNA polymerase
II, TATA box binding protein-associated factor, 43kDa [Source: HGNC
Symbol; Acc: 17300] [ENST00000372978] |
| A_33_P3251347 | 0.0004 | 3.2952 | Down | TAB3 | TGF-β activated
kinase 1/MAP3K7 binding protein 3 [Source: HGNC Symbol; Acc: 30681]
[ENST00000378928] |
Discussion
HSCR occurs when gut neural crest cells are
disturbed or interrupted during migration, proliferation,
differentiation, survival, colonization and/or apoptosis. Lesions
occur predominantly in the distal colon and are characterized by a
lack of ganglion cells in the lesion gut. As a non-Mendelian
genetic disease, the mode of inheritance of HSCR is complex. HSCR
has varied exon expression and exhibits high phenotypic variability
with incomplete penetrance. Its clinical symptoms are predominantly
manifested as meconium discharge delay (>24 h), abdominal
distension, vomiting, malnutrition and developmental disorders
(5). Extensive studies (6–8) have
identified several key genes that regulate the development of
neural crest cells in HSCR pathogenesis, including RET, glial cell
line-derived neurotrophic factor (GDNF), GDNF family receptor α1
(GFRα1), neurturin, endothelin receptor type B, endothelin 3,
ZFHX1B, paired-like homeobox 2B, sex determining region Y-box 10
and sonic hedgehog (SHH). However, these genes mutate in only 50%
of known HSCR cases (3,9). The mechanism and association between
the various genes and signaling pathways during HSCR formation
remain to be fully elucidated, and the identification of further
gene mutations and gene mutation combinations may assist in
clarifying the etiology and pathogenesis of HSCR. Certain cases of
HSCR with the same phenotype are associated with multiple gene
mutations, and these characteristics indicate that genetic
modification or environmental factors are involved in HSCR
formation (3,7–9).
Therefore, several aspects of this disease warrant further
investigation.
With the emergence of novel genetic models and
detection tools for HSCR, novel pathogenetic mechanisms may be
suggested. In a previous study, time-lapse image analyses in an
established a mouse model demonstrated that the enteric neural
crest cells (ENCCS) reach the hindgut through mesenteric
transmembrane migration between the midgut and hindgut, rather than
a continuous migration process from the midgut to the cecum and
then to the hindgut (10).
Dysfunctions or mutations occurring during transmesenteric ENCC and
circumflex ENCC migration may lead to HSCR formation (10). This novel finding may also affect
in vitro experiments aimed at analyzing NCC colonization and
ENS formation dynamics.
HSCR can either exist independently or as part of
other complex malformation syndromes. Up to 30% of HSCR patients
present with additional abnormalities (11,12),
including palate defects (13),
congenital heart defects (14),
gastrointestinal abnormalities, central nervous system
abnormalities, urinary and reproductive system problems,
craniofacial deformities and spina bifida (3,14–17).
In addition, 2–15% of HSCR cases are associated with Down's
syndrome (17,18). HSCR is part of a group of complex
diseases affected by multiple factors and involving multiple genes,
including key genes, major gene of the associated genes and minor
genes of the associated genes. In the past, molecular biology
experiments based on electrophoresis and polymerase chain reaction
were only able to analyze the expression or mutation of one or a
few genes in each experiment, and a large-scale, high-throughput
investigation of functional genes was not achievable. Therefore,
large-scale and efficient screening for all possible genes
associated with HSCR is required in order to identify the genes
associated with human HSCR. The methods of gene expression,
sequencing, mutation and polymorphism analyses based on
electrophoresis cannot meet the above requirements, therefore, the
present study used gene chip technology. In addition to identifying
the genes responsible for HSCR and their association in the model,
an investigation with continuity is required to identify the
corresponding human gene mutations and regulatory network
mechanisms. Thus, using whole exome and whole genome sequencing of
patient specimens is ideal for screening and identifying the
mutations in these genes.
In the present study, the gene expression profiling
microarray chip was prepared with several target genes or gene
fragments, which were applied on glass using a microarray in an
orderly manner and at high densities. The samples to be assessed
were labeled with a fluorescent dye to prepare a probe and
microarray hybridization, and the hybridization signal was detected
using a laser scanner. Hybridization data similar to that of
conventional dot blot hybridization were obtained through the
computer analysis of the experimental results. Comparing the
differences in the target gene expression profiles between groups
achieves rapid, efficient, high-throughput and parallel biological
information analysis (19,20). With this technique, comparative
analysis can be performed for tissue and cell gene expression in
individuals, tissues samples, cell cycles, developmental stages,
differentiation stages and physiological states under various
stimulatory conditions (19,21).
This allows identification of changing gene cluster characteristics
and patterns in individuals, tissues, stages of development and
differentiation, diseases and stimuli, which further clarifies
synergy, cross-inhibition and mutual causality (19,21).
Therefore, the mechanism underlying disease pathogenesis may be
explained at the genetic level. Microarray is currently the most
widely used gene chip method, and is used for genetic assessment
and functional analysis, including screening for candidate genes of
certain diseases (22). Currently,
microarray has been widely used in investigations of congenital
malformations, including congenital heart disease (23).
HSCR results from ENCC migration and colonization
disorders during embryonic gut development. Several studies have
demonstrated that HSCR occurrence is associated with various genes,
particularly those associated with cell migration and development,
including GDNF, the transmembrane receptor tyrosine kinase, RET,
and GFRα1, with the signaling pathway formed by these three factors
being expressed in 50% of familial HSCR cases and ~30% of sporadic
HSCR cases (3,20,24).
Mice missing any one of these factors were found to succumb to
morality within 24 h of birth and lacked gut neurons throughout the
entire bowel, between the end of the gastrointestinal tract and the
stomach (25). Mice with mutations
in endothelin and/or its receptor lack gut neurons in the distal
colon, and exhibit neural crest cell migration delays in the gut
(26,27) and albinism (28,29).
Bone morphogenetic proteins (BMPs) are also involved in regulating
ENCC migration and ganglia formation in the enteric nervous system.
Specific enteric BMP activity inhibition affects GDNF signals and
causes delays in ENCC migration, indicating that the interaction
between BMP and GDNF is required for correct and complete formation
of the enteric nervous system (30,31).
The SHH gene is important in regulating enteric ENCC migration and
nerve plexus formation (32,33).
Contrary to the effects of GDNF on ENCC migration, the migration is
reduced predominantly by regulating the equilibrium between enteric
NCC proliferation and differentiation, and the equilibrium between
GDNF and SHH determines correct plexus colonization in the enteric
nervous system (32,33). CXCR4 is a receptor for the cell
surface chemokine pre-B cell growth-stimulating factor/stromal
cell-derived factor, which is expressed in endothelial cells and
has an indirect impact on ENCC colonization in the hindgut by
regulating vascular system development (10). Our previous study demonstrated that
mutations in these genes had important implications for HSCR
formation (34). The microarray
results also demonstrated changes in the expression levels of these
associated genes. However, the restriction and balances between
these gene and signaling pathways, and their association with HSCR
formation requires further investigation.
The present study demonstrated that HSCR occurrence
involves mutations in multiple genes. According to the heat map and
hierarchical clustering, comparative analysis of the differences in
the concurrent gene expression profiles between the control group
and HSCR patients on the same chip exhibited parallelism. The
investigation of differentially expressed human HSCR genes using
microarray analysis allows simultaneous quantification of gene
expression levels, as well as the identification of genes with
differential expression. Following initial screening for important
upstream genes [such as SHH (35),
BMP, WNT, NOTCH (36), and RET],
the primary and secondary associated genes [such as RET, CXCR4, CR,
GDNF, enolase 2 (gamma, neuronal), CAD, B cell lymphoma 2, and
glial fibrillary acidic protein] in the associated signaling
pathway were gradually screened, according to the association
between the gene and various signaling pathways. The present study
focussed on the WNT signaling pathway. WNT5A is a member of The WNT
gene family 3 (37), and has been
implicated in oncogenesis and in several developmental processes,
including regulation of cell fate and patterning during
embryogenesis (38). WNT5A and its
ligand frizzled-5 (hFz5) compose the WNT5A/hFz5 signaling pathway,
which is important for organ axis formation. Finally, several
analyses were performed to construct a network diagram of HSCR
pathogenesis. Therefore, to integrate the separated and scattered
HSCR genes and their interactions into a coherent network diagram,
genome sequencing remains the most economic option, whereas
microarray technology is an efficient and rapid screening
method.
Acknowledgments
The present study was supported by a grant from the
National Natural Science Foundation of China (grant no.
81370474).
Abbreviations:
|
HSCR
|
Hirschsprung's disease
|
|
BP
|
biological process
|
|
CC
|
cellular component
|
|
MF
|
molecular function
|
|
CXCR7
|
chemokine (C-X-C motif) receptor 7
|
|
ATF3
|
activating transcription factor 3
|
|
JUN
|
jun proto-oncogene
|
|
DCN
|
decorin
|
|
HOXD13
|
homeobox D13
|
|
FGL2
|
fibrinogen-like 2
|
|
NTN4
|
netrin 4
|
|
UBC
|
ubiquitin C
|
|
ATF1
|
activating transcription factor 1
|
|
WNT5A
|
wingless-type mouse mammary tumor
virus integration site family, member 5A
|
|
RGS5
|
regulator of G-protein signaling 5
|
|
GLI1H
|
GLI family zinc finger 1
|
|
VIM
|
vimentin
|
|
BMP3
|
bone morphogenetic protein 3
|
|
ZDHHC8
|
zinc finger, DHHC-type containing
8
|
|
ZDHHC3
|
zinc finger, DHHC-type containing
3
|
|
WHSC1
|
Wolf-Hirschhorn syndrome candidate
1
|
|
DDC
|
dopa decarboxylase (aromatic L-amino
acid decarboxylase)
|
|
GAP43
|
growth associated protein 43
|
|
PIK3CD
|
phosphoinositide-3-kinase, catalytic,
delta polypeptide
|
|
SCG2
|
secretogranin II
|
|
RTN1
|
reticulon 1
|
|
ADRA2B
|
adrenergic, alpha-2B-receptor
|
|
PKDCC
|
protein kinase domain containing,
cytoplasmic homolog (mouse)
|
|
COBL
|
cordon-bleu homolog (mouse)
|
|
TLR5
|
toll-like receptor 5
|
|
NLRP11
|
NOD-like receptor family, pyrin domain
containing 11
|
|
TAF8
|
TAF8 RNA polymerase II, TATA box
binding protein-associated factor
|
|
TAB3
|
TGF-β activated kinase 1/MAP3K7
binding protein 3
|
References
|
1
|
Theveneau E and Mayor R; Neural crest
delamination and migration: from epithelium-to-mesenchyme
transition to collective cell migration. Dev Biol. 2012 Jun
1;366(1): 34–54. View Article : Google Scholar : PubMed/NCBI
|
|
2
|
Goldberg EL: An epidemiological study of
Hirschsprung's disease. Int J Epidemiol. 13:479–485. 1984.
View Article : Google Scholar : PubMed/NCBI
|
|
3
|
Parisi MA and Kapur RP: Genetics of
Hirschsprung disease. Curr Opin Pediatr. 12:610–617. 2000.
View Article : Google Scholar : PubMed/NCBI
|
|
4
|
White Jacqueline K, Gerdin Anna-Karin,
Karp Natasha A, et al: Genome-wide Generation and Systematic
Phenotyping of Knockout Mice Reveals New Roles for Many Genes.
Cell. 2013 July 18;154(2): 452–464. View Article : Google Scholar : PubMed/NCBI
|
|
5
|
Washita T, Kruger GM, Pardal R, Kiel MJ
and Morrison SJ: Hirsch–sprung disease is linked to defecta in
neural crest cell function. Science. 2003.301(5635): 972–976.
View Article : Google Scholar
|
|
6
|
Erin Mundt, Michael D and Bate: Genetics
of Hirschsprung disease and anorectal malformations. Seminars in
Pediatric Surgery. 2010.19:107–117. View Article : Google Scholar
|
|
7
|
Angrist M, Bolk S, Halushka M, Lapchak PA
and Chakravarti A: Germline mutations in glial cell line-derived
neurotrophic factor (GDNF) and RET in a Hirschsprung disease
patient. Nat Genet. 14:341–344. 1996. View Article : Google Scholar : PubMed/NCBI
|
|
8
|
Salomon R, Attié T, Pelet A, Bidaud C, Eng
C, Amiel J, Sarnacki S, Goulet O, Ricour C, Nihoul-Fékété C, et al:
Germline mutations of the RET ligand GDNF are not sufficient to
cause Hirschsprung disease. Nat Genet. 14:345–347. 1996. View Article : Google Scholar : PubMed/NCBI
|
|
9
|
Bolk S, Pelet A, Hofstra RM, Angrist M,
Salomon R, Croaker D, Buys CH, Lyonnet S and Chakravarti A: A human
model for multigenic inheritance: Phenotypic expression in
Hirschsprung disease requires both the RET gene and a new 9q31
locus. Proc Natl Acad Sci USA. 97:268–273. 2000. View Article : Google Scholar : PubMed/NCBI
|
|
10
|
Nishiyama C, Uesaka T, Manabe T, Yonekura
Y, Nagasawa T, Newgreen DF, Young HM and Enomoto H:
Trans-mesenteric neural crest cells are the principal source of the
colonic enteric nervous system. Nat Neurosci. 15:1211–1218. 2012.
View Article : Google Scholar : PubMed/NCBI
|
|
11
|
Passarge E: The genetics of Hirschsprung's
disease. Evidence for heterogeneous etiology and a study of
sixty-three families. N Engl J Med. 276:138–143. 1967. View Article : Google Scholar : PubMed/NCBI
|
|
12
|
Spouge D and Baird PA: Hirschsprung
disease in a large birth cohort. Teratology. 32:171–177. 1985.
View Article : Google Scholar : PubMed/NCBI
|
|
13
|
Kerstjens-Frederikse WS, Hofstra RM, van
Essen AJ, Meijers JH and Buys CH: A Hirschsprung disease locus at
22q11? J Med Genet. 36:221–224. 1999.PubMed/NCBI
|
|
14
|
Ryan ET, Ecker JL, Christakis NA and
Folkman J: Hirschsprung's disease: Associated abnormalities and
demography. J Pediatr Surg. 27:76–81. 1992. View Article : Google Scholar : PubMed/NCBI
|
|
15
|
Badner JA, Sieber WK, Garver KL and
Chakravarti A: A genetic study of Hirschsprung disease. Am J Hum
Genet. 46:568–580. 1990.PubMed/NCBI
|
|
16
|
Sarioglu A, Tanyel FC, Büyükpamukçu N and
Hiçsönmez A: Clinical risk factors of Hirschsprung-associated
enterocolitis. I: Preoperative enterocolitis. Turk J Pediatr.
39:81–89. 1997.PubMed/NCBI
|
|
17
|
Amiel J and Lyonnet S: Hirschsprung
disease, associated syndromes, and genetics: A review. J Med Genet.
38:729–739. 2001. View Article : Google Scholar : PubMed/NCBI
|
|
18
|
Fu M, Lui VC, Sham MH, Cheung AN and Tam
PK: HOXB5 expression is spatially and temporarily regulated in
human embryonic gut during neural crest cell colonization and
differentiation of enteric neuroblasts. Dev Dyn. 228:1–10. 2003.
View Article : Google Scholar : PubMed/NCBI
|
|
19
|
Schena M, Shalon D, Davis RW and Brown PO:
Quantitative monitoring of gene expression patterns with a
complementary DNA microarray. Science. 270:467–470. 1995.
View Article : Google Scholar : PubMed/NCBI
|
|
20
|
Heller RA, Schena M, Chai A, Shalon D,
Bedilion T, Gilmore J, Woolley DE and Davis RW: Discovery and
analysis of inflammatory disease-related genes using cDNA
microarrays. Proc Natl Acad Sci USA. 94:2150–2155. 1997. View Article : Google Scholar : PubMed/NCBI
|
|
21
|
De Risi J, Penland L, Brave PO, et al: Use
of a cDNA microarray to analyse gene expression patterns in human
cancer. Nat Genet. 1996.14(4): 457–460. View Article : Google Scholar
|
|
22
|
Wu TD: Analysing gene expression data from
DNA microarrays to identify candidate genes. J Pathol. 195:53–65.
2001. View Article : Google Scholar : PubMed/NCBI
|
|
23
|
Miertus J and Amoroso A: Microarray-based
genetics of cardiac malformations. Ital Heart J. 2:565–567.
2001.PubMed/NCBI
|
|
24
|
Bassett DE Jr, Eisen M and Boguski MS:
Gene expression informatics it's all in your mind. Nat Genet.
1999.21(Suppl 1): 51–55. View
Article : Google Scholar : PubMed/NCBI
|
|
25
|
Tomac AC, Grinberg A, Huang SP, Nosrat C,
Wang Y, Borlongan C, Lin SZ, Chiang YH, Olson L, Westphal H and
Hoffer BJ: Glial cell line-derived neurotrophic factor receptor
alpha1 availability regulates glial cell line-derived neurotrophic
factor signaling: Evidence from mice carrying one or two mutated
alleles. Neuroscience. 95:1011–1023. 2000. View Article : Google Scholar : PubMed/NCBI
|
|
26
|
Barlow A, de Graaff E and Pachnis V:
Enteric nervous system progenitors are coordinately controlled by
the G protein-coupled receptor EDNRB and the receptor tyrosine
kinase RET. Neuron. 40:905–916. 2003. View Article : Google Scholar : PubMed/NCBI
|
|
27
|
Druckenbrod NR and Epstein ML:
Age-dependent changes in the gut environment restrict the invasion
of the hindgut by enteric neural progenitors. Development.
136:3195–3203. 2009. View Article : Google Scholar : PubMed/NCBI
|
|
28
|
Lee HO, Levorse JM and Shin MK: The
endothelin receptor-B is required for the migration of neural
crest-derived melanocyte and enteric neuron precursors. Dev Biol.
259:162–175. 2003. View Article : Google Scholar : PubMed/NCBI
|
|
29
|
Ro S, Hwang SJ, Muto M, Jewett WK and
Spencer NJ: Anatomic modifications in the enteric nervous system of
piebald mice and physiological consequences to colonic motor
activity. Am J Physiol Gastrointest Liver Physiol. 290:G710–G718.
2006. View Article : Google Scholar
|
|
30
|
Goldstein AM, Brewer KC, Doyle AM, Nagy N
and Roberts DJ: BMP signaling is necessary for neural crest cell
migration and ganglion formation in the enteric nervous system.
Mech Dev. 122:821–833. 2005. View Article : Google Scholar : PubMed/NCBI
|
|
31
|
Faure C, Chalazonitis A, Rhéaume C,
Bouchard G, Sampathkumar SG, Yarema KJ and Gershon MD:
Gangliogenesis in the enteric nervous system: Roles of the
polysialylation of the neural cell adhesion molecule and its
regulation by bone morphogenetic protein-4. Dev Dyn. 236:44–59.
2007. View Article : Google Scholar
|
|
32
|
Ramalho-Santos M, Melton DA and McMahon
AP: Hedgehog signals regulate multiple aspects of gastrointestinal
development. Development. 127:2763–2772. 2000.PubMed/NCBI
|
|
33
|
Fu M, Lui VC, Sham MH, Pachnis V and Tam
PK: Sonic hedgehog regulates the proliferation, differentiation and
migration of enteric neural crest cells in gut. J Cell Biol.
166:673–684. 2004. View Article : Google Scholar : PubMed/NCBI
|
|
34
|
Ding X, Zhao Z, Duan W, Wang S and Jin X,
Xiang L and Jin X: Expression patterns of CXCR4 in different colon
tissue segments of patients with Hirschsprung's disease. Exp Mol
Pathol. 95:111–116. 2013. View Article : Google Scholar : PubMed/NCBI
|
|
35
|
Choudhry Z, Rikani AA, Choudhry AM, Tariq
S, Zakaria F, Asghar MW, Sarfraz MK, Haider K, Shafiq AA and
Mobassarah NJ: Sonic hedgehog signalling pathway: A complex
network. Ann Neurosci. 21:28–31. 2014. View Article : Google Scholar : PubMed/NCBI
|
|
36
|
Ngan ES, Garcia-Barceló MM, Yip BH, Poon
HC, Lau ST, Kwok CK, Sat E, Sham MH, Wong KK and Wainwright BJ:
Hedgehog/Notch-induced premature gliogenesis represents a new
disease mechanism for Hirschsprung disease in mice and humans. J
Clin Invest. 121:3467–3478. 2011. View Article : Google Scholar : PubMed/NCBI
|
|
37
|
Clark CC, Cohen I, Eichstetter I,
Cannizzaro LA, McPherson JD, Wasmuth JJ and Iozzo RV: Molecular
cloning of the human proto-oncogene Wnt-5A and mapping of the gene
(WNT5A) to chromosome 3p14-p21. Genomics. 18:249–260. 1993.
View Article : Google Scholar : PubMed/NCBI
|
|
38
|
Bhatt PM and Malgor R: Wnt5a: A player in
the pathogenesis of atherosclerosis and other inflammatory
disorders. Atherosclerosis. 237:155–162. 2014. View Article : Google Scholar : PubMed/NCBI
|