Introduction
Gastric cancer (GC) is the second leading cause of
global cancer-associated mortality with a notably high incidence in
developing countries, with approximately 692,720 newly diagnosed
cases and 516,600 cases of GC-associated mortality in 2011
(1–3). Greater than 60% patients with GC were
diagnosed at an advanced stage with locally advanced or distant
metastasis, which leads to a poorer prognosis and relatively
increased mortality (4,5). Accordingly, early detection of GC
will contribute to a reduction in its mortality. Numerous genes
have been associated with the prognosis of GC; however, aside from
Her-2, few sensitive biomarkers have been reported in clinical
applications (6). In addition, a
previous study demonstrated that only 17% of patients with GC are
associated with a HER-2-positive state (7). Therefore, it is of great clinical
significance to identify specific and sensitive biomarkers for GC
early detection and effective therapeutic targets.
Several in vitro studies have indicated that
elevated lipogenesis is correlated with poor prognosis in a number
of tumor types (8–11). In addition, lipogenesis has been
demonstrated to be involved in signal transduction of tumor cells
(12–14). As a key cytosolic multifunctional
enzyme involved in de novo lipogenesis, fatty acid synthase
(FASN) is overexpressed in several types of tumor tissue and is
significantly associated with tumor prognosis (15,16).
In addition, reduction of FASN activity markedly promotes tumor
apoptosis and inhibits tumor cell growth and metastasis (17–20).
However, studies focussing upon FASN in GC are rare.
Two previous studies have provided evidence that FASN is
over-expressed in GC tissues (21)
in addition to blood serum (22).
FASN overexpression is associated with poor survival of patients
with GC, indicating that FASN serves a crucial role in the
development and progression of GC. However, the specific pro-tumor
effects of FASN, particularly the detailed correlation of FASN
expression and clinicopathological characteristics, remain unclear
in GC. Thus, in the present study, immunohistochemistry (IHC),
reverse transcription-quantitative polymerase chain reaction
(RT-qPCR) and western blotting were conducted in order to analyze
the expression levels of FASN in a total of 182 clinical gastric
specimens (167 for IHC, 12 for RT-qPCR and 3 for western blotting).
In addition, the detailed association between FASN expression and
GC clinicopathological characteristics, and clinical prognosis,
were investigated further.
Materials and methods
Patients and tissue specimens
The present study was approved by the Ethics Review
Board of Nanfang Hospital (Guangzhou, China), and written informed
consent was obtained from all patients. The present study was
conducted on tissue specimens from 167 patients who had been
histologically diagnosed as having GC at Nanfang Hospital between
2000 and 2011, and tumor staging was defined according to the
American Joint Committee on Cancer Staging Manual (23). Among them, 131 stage I–III patients
received radical resection (19, 49 and 63 for stages I, II and III,
respectively), and 36 stage-IV patients (the metastasis-affected
distant organs) underwent palliative surgery and/or chemotherapy.
Postoperative follow-up time was obtained from all patients from
0.5 to 80.0 months. A total of 12-paired tumor and corresponding
normal gastric tissues were rapidly removed during surgery and
stored immediately at −80°C until required for RNA extraction, and
3-paired tissues were used for protein extraction.
IHC assays
IHC assays were conducted in order to evaluate the
expression of FASN in gastric tissue samples according to the
standard protocols. Specimens were paraffin-embedded (Shanghai
Specimen and Model Factory, Shanghai, China) and then stored at
4°C. The paraffin-embedded sections were deparaffinized with xylene
(Guangzhou Chemical Reagent Factory, Guangzhou, China) graded
ethanol, and phosphate-buffered saline (PBS). Subsequent to
quenching the endogenous peroxidase activity with 3% hydrogen
peroxide (Hengjian Pharmaceutical Co., Ltd., Guangzhou, China) for
10 min at room temperature, the primary rabbit anti-human FASN
polyclonal antibody (1:200; 3180S; Cell Signaling Technology, Inc.,
Danvers, MA, USA) was added and incubated at 4°C overnight.
Subsequent to washing with PBS, the sections were incubated with
horseradish peroxidase (HRP)-conjugated goat anti-rabbit IgG
(PV-6001; LI-COR, Inc., Lincoln, NE, USA) for 1 h at 37°C. Antibody
binding was visualized by incubating with fresh
3,3′N-diaminobenzidine (Dako, Glostrup, Denmark) buffer. The
sections were then washed in running water and counterstained with
hematoxylin (Guangzhou Chemical Reagent Factory), followed by
dehydration using graded ethanol and mounting using neutral balsam
(Shanghai Specimen and Model Factory). Images of the sections were
then captured under the Olympus BX40 microscope (Olympus
Corporation, Tokyo, Japan).
The FASN expression level in tumor tissues was
scored using a semi-quantitative method (19). The intensity of the immunostaining
was scored as follows: 0 (negative), 1 (weak), 2 (moderate) and 3
(strong). The extent of immunostaining was quantified according to
the area percentages: 0 (no positive staining), 1 (<10%), 2
(10–50%) or 3 (>50%). The sum of the extent and intensity scores
was the final staining scores (0–6). Scores less than 3 were
considered to indicate low expression, while scores ≥4 were
considered as high expression. All slides were examined by three
experienced pathologists.
RNA extraction and RT-qPCR
A total of 12 GC tissue specimens were detected by
RT-qPCR analysis. Total RNA from the tissue samples was extracted
using TRIzol reagent (Takara Bio, Inc., Otsu, Japan). RNA samples
(20 µl) were reverse transcribed into cDNA using the Reverse
Transcription kit (Takara Bio, Inc.), according to the
manufacturer's protocol. RT-qPCR assays were performed using SYBR
Green PCR master mix on a LightCycler 480 system (Roche
Diagnostics, Basel, Switzerland). The PCR cycling conditions were
as follows: 95°C for 2 min, followed by 40 cycles of 95°C for 30
sec and 60°C for 35 sec. The FASN primers and probes (Invitrogen;
Thermo Fisher Scientific, Inc., Waltham, MA, USA) were used for the
amplification of a 20 base pair FASN-specific PCR product: Forward
primer 5′-CGACAGCACCAGCTTCGCCA-3′, reverse primer
5′-CACGCTGGCCTGCAG CTTCT-3′. Expression data were normalized to the
housekeeping gene glyceraldehyde 3-phosphate dehydrogenase (GAPDH)
to be calculated as 2−[(Cq of FASN)-(Cq of GAPDH)],
where Cq represents the quantification cycle for each transcript
(24).
Protein extraction and western
blotting
A total of three GC tissues were lysed and subjected
to western blotting as described previously (25). Briefly, the protein concentrations
of the lysates were quantified using a Bicinchoninic Acid Assay kit
(Nanjing KeyGen Biotech, Co., Ltd., Nanjing, China). Protein
samples (40 µg) were separated by 6% sodium dodecyl
sulfate-polyacrylamide gel electrophoresis (Shanghai Shenggong
Biology Engineering Technology Service, Ltd., Shanghai, China) and
were then electrophoretically transferred to a polyvinylidene
difluoride membrane (EMD Millipore, Billerica, MA, USA). Membranes
were incubated in 5% bovine serum albumin (ZSGB-BIO, Beijing,
China) in PBS for 1 h, then with rabbit anti-human FASN polyclonal
antibodies (1:1,000; 3180S; Cell Signaling Technology, Inc.),
overnight at 4°C. Membranes were then washed three times with PBS
and incubated with HRP-conjugated goat anti-rabbit IgG (1:15,000;
PV-6001; LI-COR, Inc.) for 1 h at room temperature. Antibody
complexes were detected using enhanced chemiluminescence
(PerkinElmer, Inc., Waltham, MA, USA) and the blots were scanned
using the Odyssey CLx Imaging System (LI-COR, Inc.). The intensity
of protein bands were quantified using Quantity One software,
version 4.6.2 (Bio-Rad Laboratories, Inc., Hercules, CA, USA).
Statistical analysis
All statistical analyses were conducted using SPSS
statistical software, version 20.0 (IBM SPSS, Armonk, NY, USA).
Student's t-test analysis was performed to compare the statistical
significance between two experimental groups. The association
between FASN expression and clinicopathological characteristics was
analyzed using the Chi-square test. Kaplan-Meier analyses were used
to analyze the incident of patients (diagnosis of recurrence or
mortality) and comparisons of survival distributions were evaluated
with the log-rank test. A stepwise Cox's proportional hazard model
was conducted to examine the univariate survival analyses. The
quantitative data are represented as the mean ± standard error of
three independent experiments. P<0.05 was considered to indicate
a statistically significant difference.
Results
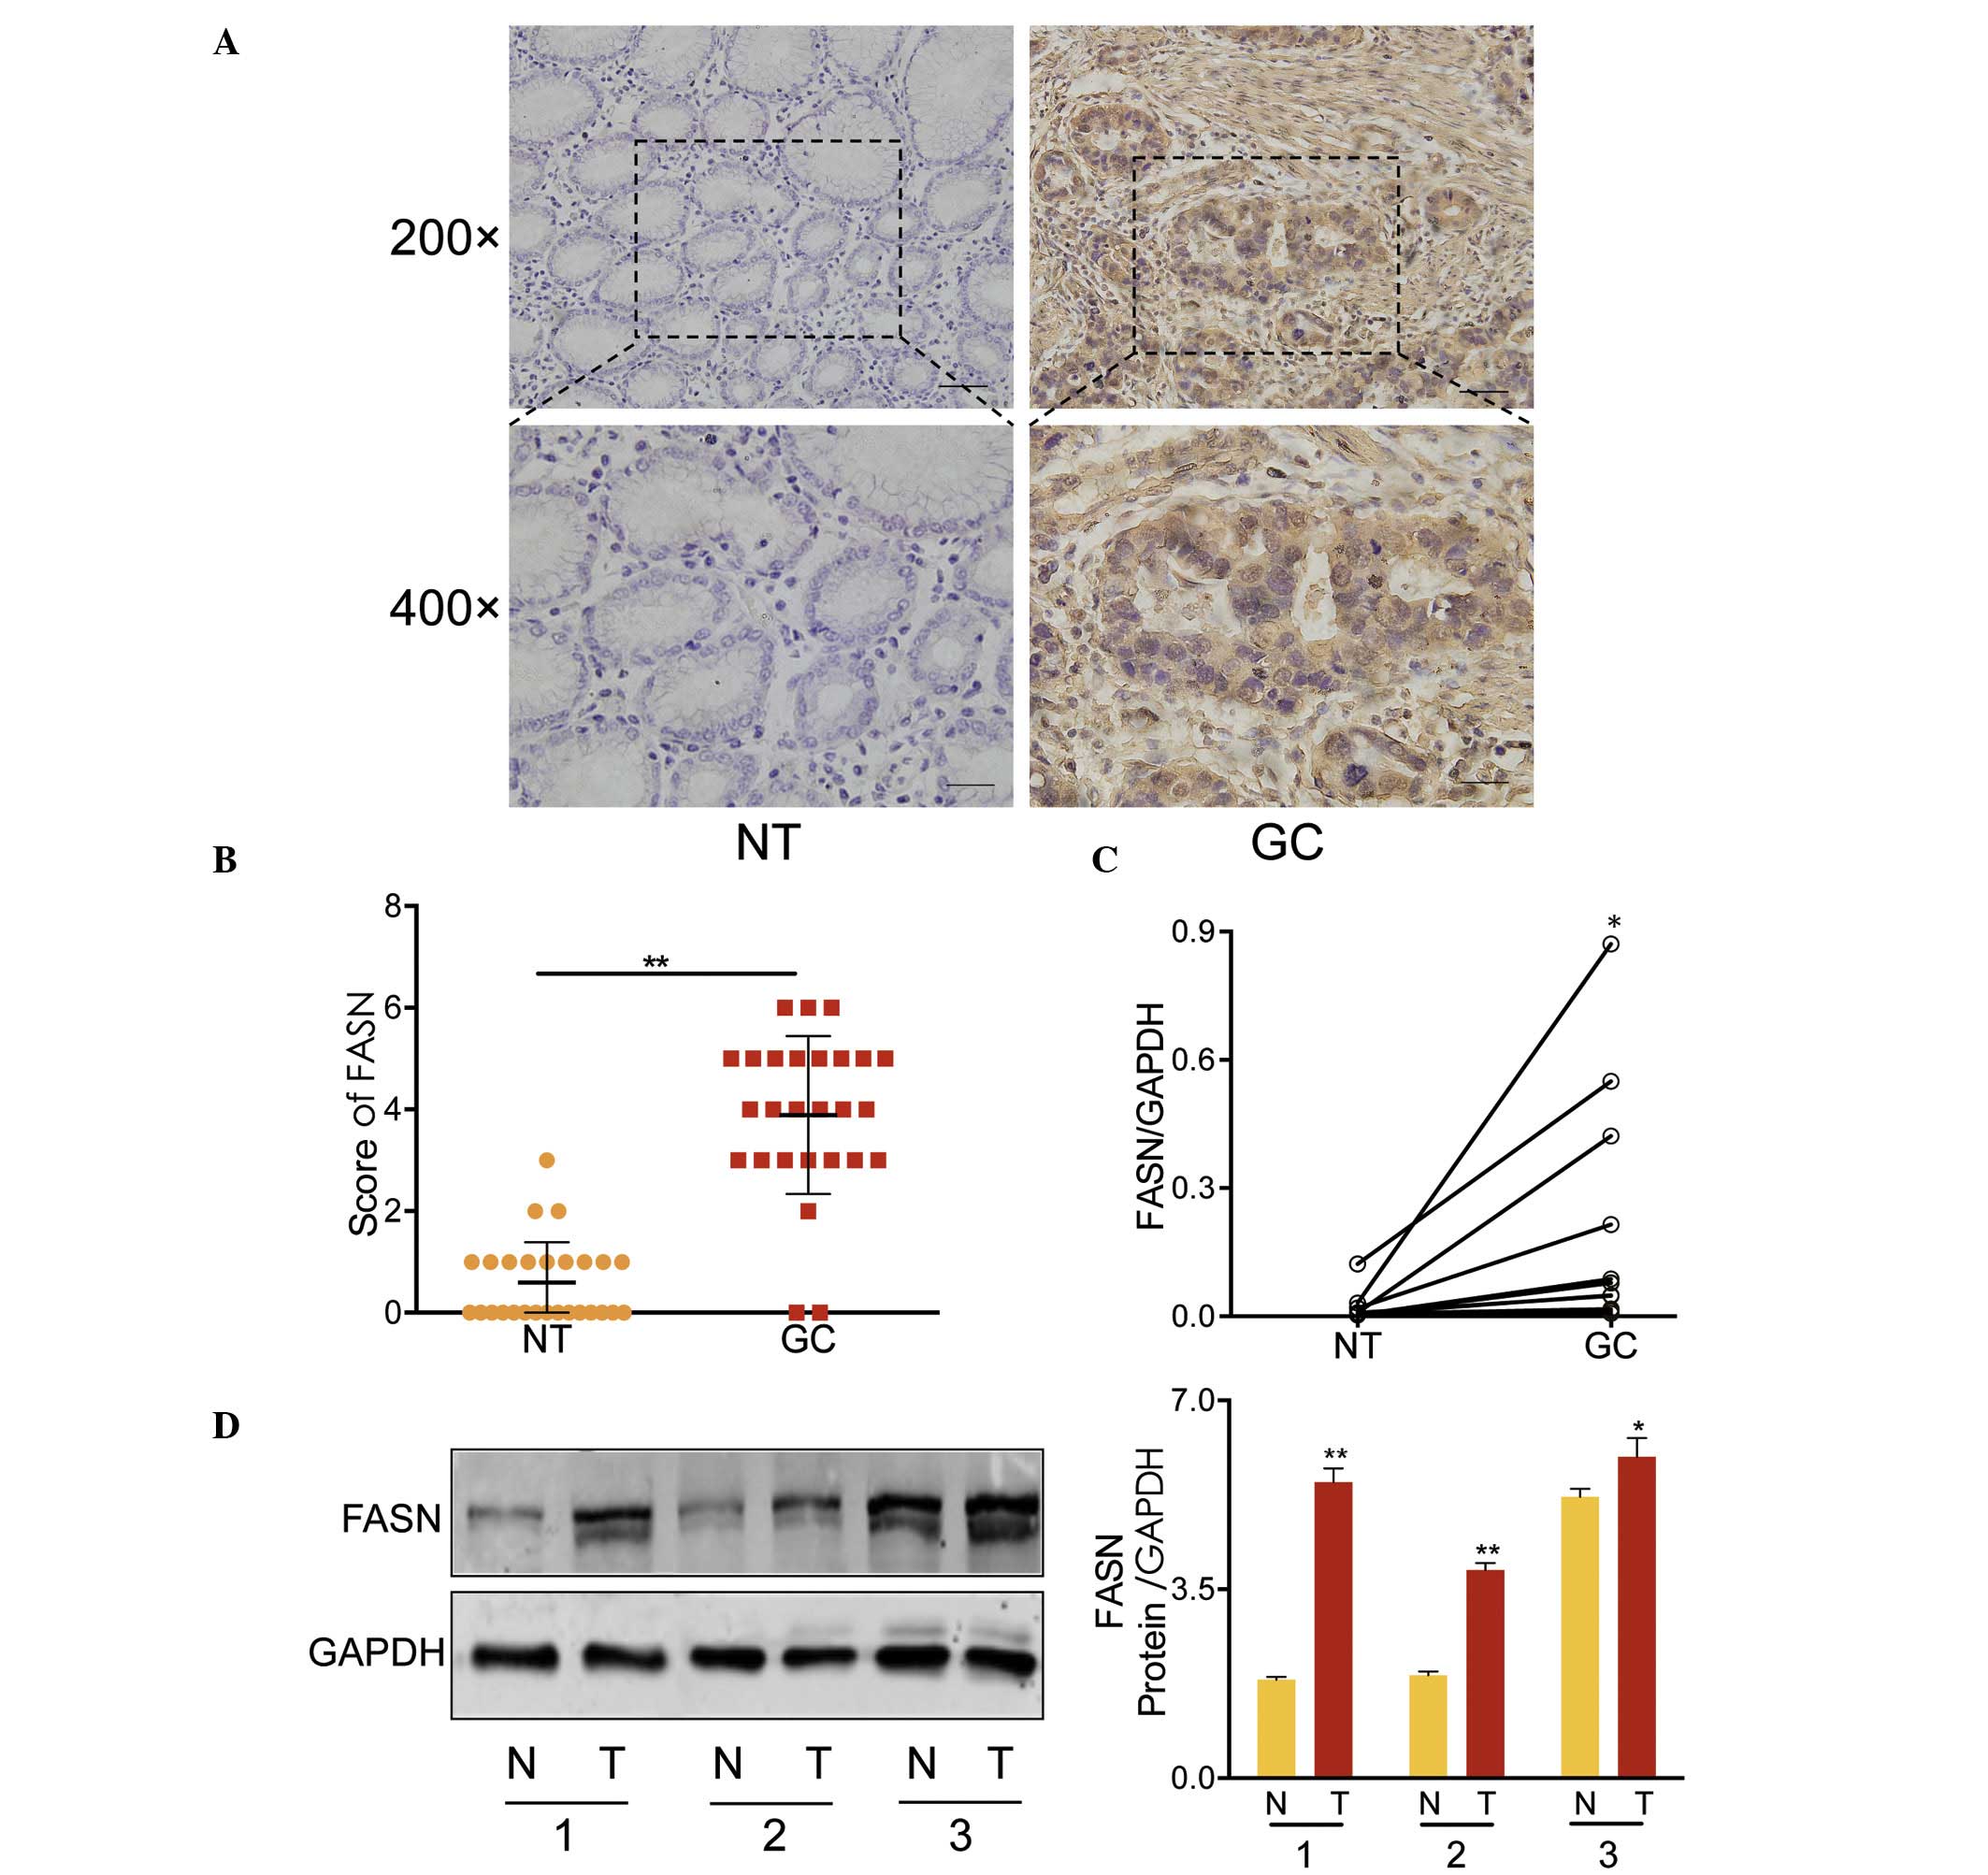
FASN was overexpressed in GC
The expression levels of FASN were assessed in 27 GC
tumor tissues and paired adjacent normal tissues (NT) by IHC. FASN
was observed to be predominantly expressed in the cytoplasm
(Fig. 1A) and infrequently in the
nucleus (data not shown). Student's t-test, identified
significantly greater expression of FASN in GC tissues when
compared with paired adjacent normal tissues (P<0.001, Fig. 1B). Similar results were also
obtained from RT-qPCR (in 12 paired GC tissues and adjacent
non-cancerous tissues; Fig. 1C)
and western blot analysis (3 paired tissues; Fig. 1D). These results strongly indicated
that FASN was overexpressed in GC tissues at mRNA and protein
levels.
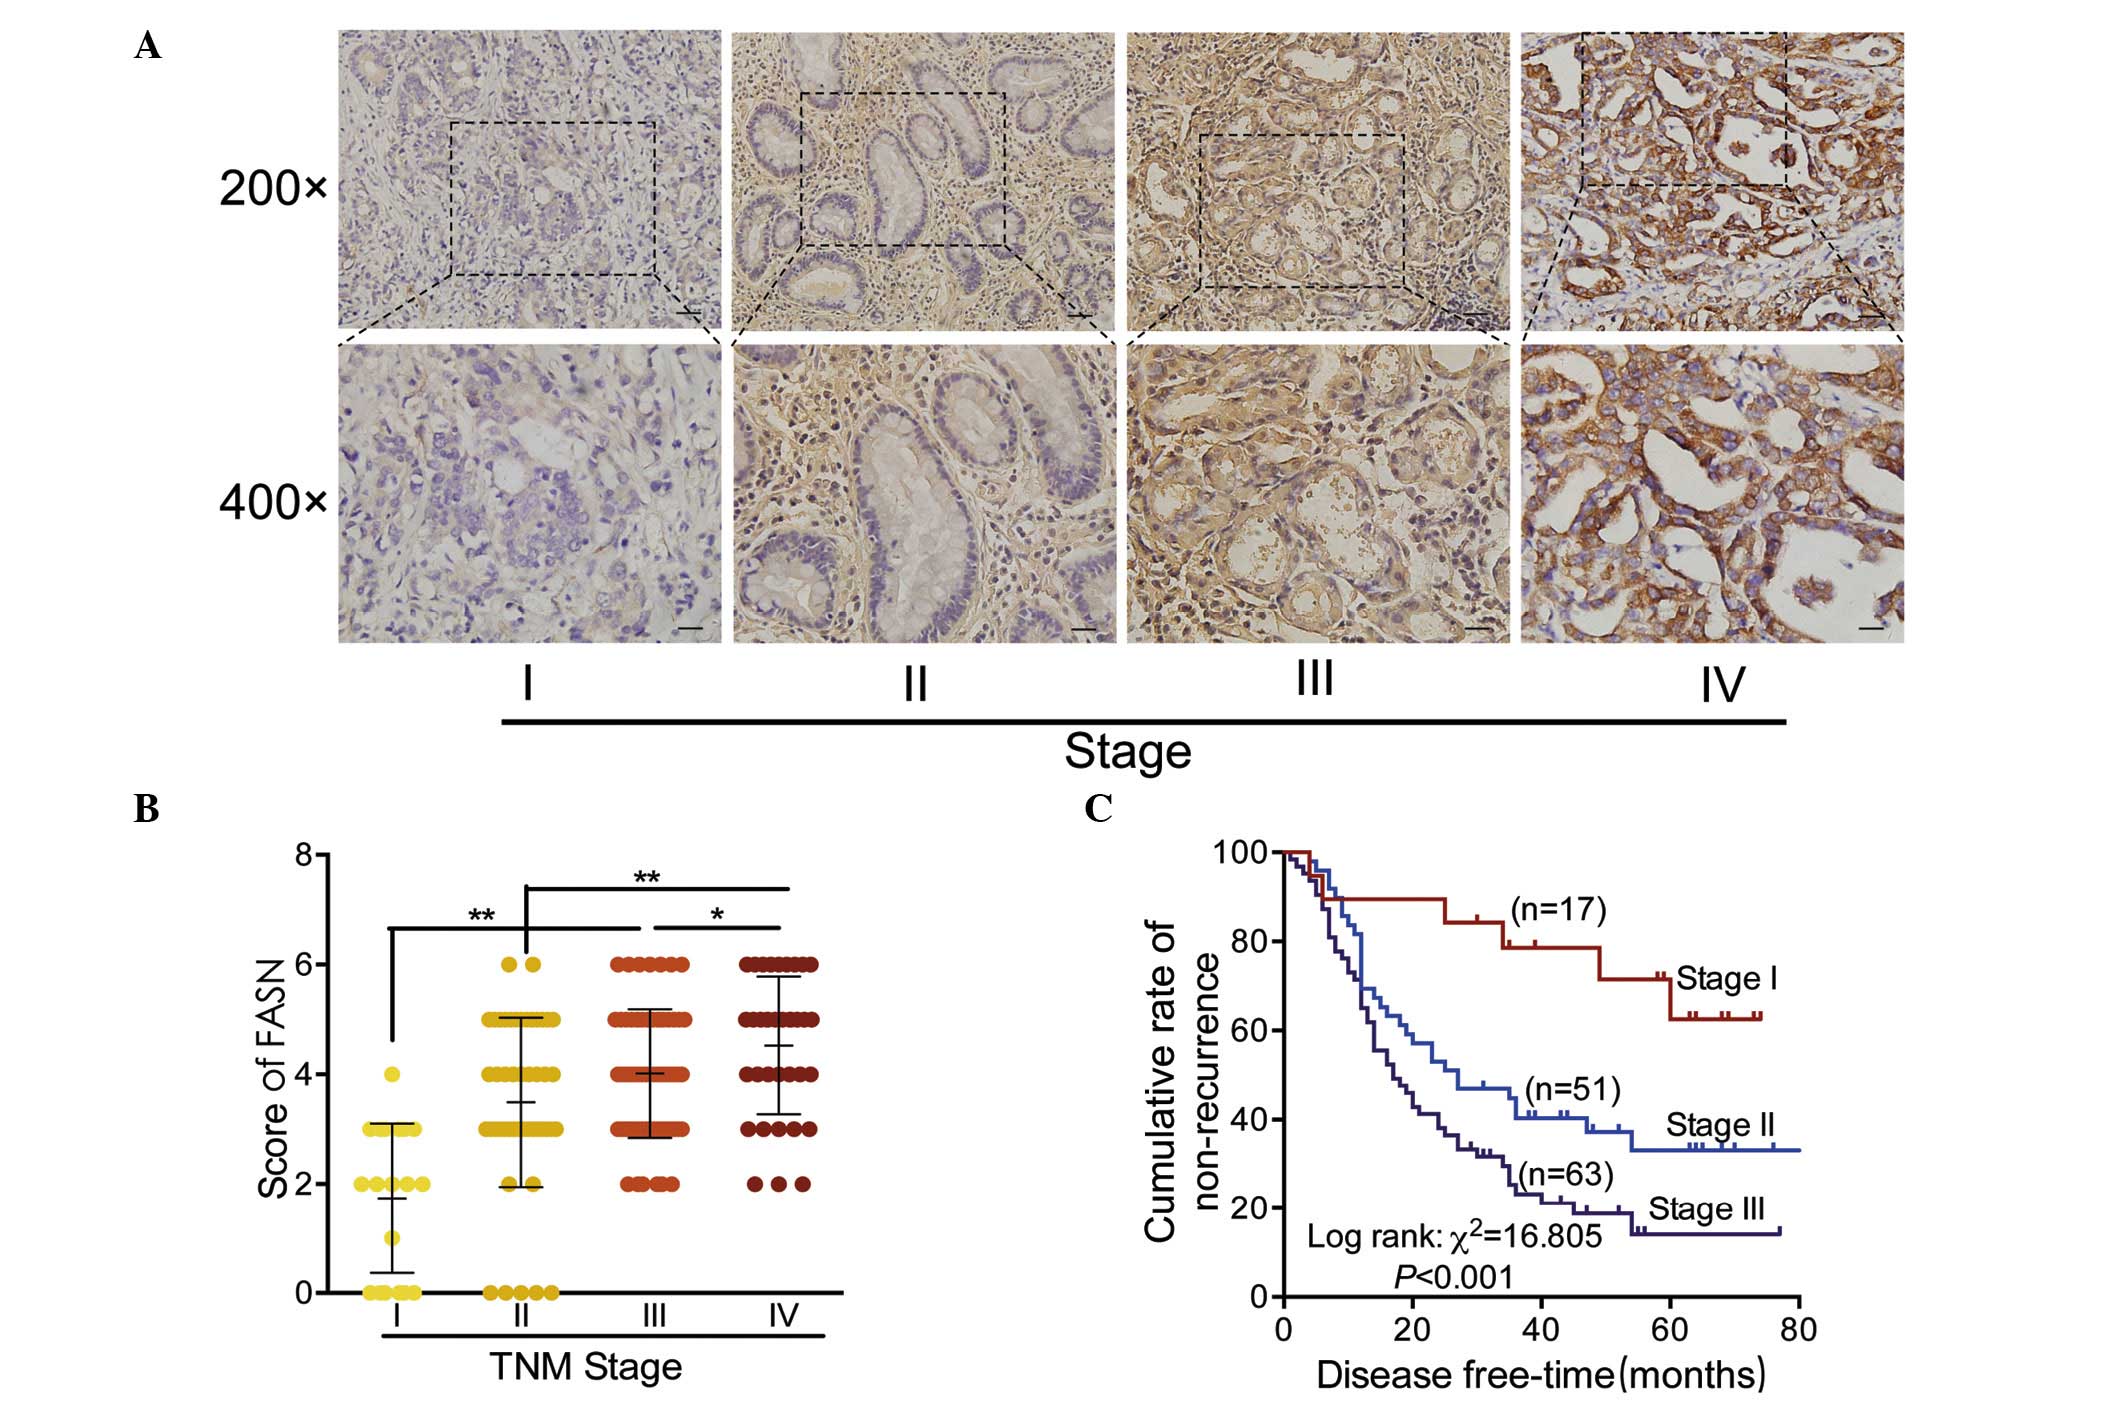
Expression of FASN was correlated with
clinicopathological characteristics in GC
In order to determine the clinical significance of
FASN, the association between FASN expression and the
clinicopathological features of GC was investigated in a
retrospective cohort of 167 cases of GC by IHC, including 19 cases
of stage I (11.4%), 49 cases of stage II (29.3%), 63 cases of stage
III (37.7%) and 36 cases of stage IV (21.6%), which were based on
TNM staging. Among the tumors, 85 (50.9%) samples presented with an
overexpression of FASN (score >3), whereas 82 (49.1%) cases were
weakly or negatively expressed (scored 0–3).
Representative results of FASN staining are
presented in Fig. 2A. Staining of
FASN protein was observed to grow from weak to strong with the
increased clinical stage of GC tissue specimens. Quantitative
analysis of IHC staining indicated that FASN expression was
positively correlated with clinical stage in primary GC tumors
(Fig. 2B). The association between
the clinical stages and prognosis in patients with GC was
additionally measured using survival analysis (Fig. 2C). As hypothesized, patients in
stage III were identified to have the lowest non-recurrent rate
(20.6%), while patients in stage I presented with the best outcome,
with a 68.4% non-recurrent rate.
Clinical features were summarized in Table I. In patients from stages I–III,
expression of FASN was observed to be positively correlated with
age (P<0.05), TNM classification (P<0.001), gastric wall
invasion (P=0.014), nodal metastasis (P<0.001) and postoperative
recurrence (including local recurrence and distant metastasis;
P<0.001). For patients in stage IV, FASN overexpression was
closely associated with the number of metastatic lesions
(P<0.001) and mortality (P=0.001). Taken together, these results
indicate that FASN expression had a strong correlation with GC
invasion, metastasis and prognosis.
 | Table IClinicopathological characteristics in
response to positive and negative gastric FASN immunohistochemical
staining. A, Recurrence in stage I–III GC |
Table I
Clinicopathological characteristics in
response to positive and negative gastric FASN immunohistochemical
staining. A, Recurrence in stage I–III GC
A, Recurrence in
stage I–III
|
|---|
| Characteristic | n (%) | FASN expression
| P-value |
|---|
| Positive n (%) | Negative n (%) |
|---|
| Gender | | | | 0.4 |
| Male | 88 (67.2) | 37 (42.0) | 51 (58.0) | |
| Female | 43 (32.8) | 20 (46.5) | 23 (53.5) | |
| Age (years) | | | | 0.032 |
| ≥55 | 77 (58.8) | 40 (51.9) | 37 (48.1) | |
| <55 | 54 (41.2) | 17 (31.5) | 37 (68.5) | |
| Stage of disease | | | | <0.001 |
| I | 19 (14.5) | 1 (5.3) | 18 (94.7) | |
| II | 49 (37.4) | 16 (32.7) | 33 (67.3) | |
| III | 63 (48.1) | 40 (63.5) | 23 (36.5) | |
| Gastric wall
invasion | | | | 0.014 |
| T1–3 | 76 (58.0) | 26 (34.2) | 50 (65.8) | |
| T4 | 55 (42.0) | 31 (56.4) | 24 (43.6) | |
| Nodal metastasis | | | | <0.001 |
| Negative | 49 (37.4) | 12 (24.5) | 37 (75.5) | |
| Positive | 82 (62.6) | 45 (54.9) | 37 (45.1) | |
| Recurrence | | | | <0.001 |
| No | 44 (33.6) | 15 (34.1) | 29 (65.9) | |
| Yes | 87 (66.4) | 42 (48.3) | 45 (51.7) | |
B, Survival in
stage IV GC
|
|---|
| Characteristic | n (%) | FASN expression
| P-value |
|---|
| Positive n (%) | Negative n (%) |
|---|
| Gender | | | | 0.182 |
| Male | 24 (66.7) | 20 (83.3) | 4 (16.7) | |
| Female | 12 (33.3) | 8 (66.7) | 4 (33.3) | |
| Age (years) | | | | 0.405 |
| ≥55 | 26 (72.2) | 21 (87.3) | 5 (12.7) | |
| <55 | 10 (27.8) | 7 (70.0) | 3 (30.0) | |
| Metastatic
lesions | | | | <0.001 |
| <3 | 17 (47.2) | 11 (64.7) | 6 (35.3) | |
| ≥3 | 19 (52.8) | 17 (89.5) | 2 (10.5) | |
| Survival | | | | 0.001 |
| No | 9 (25.0) | 5 (55.6) | 4 (44.4) | |
| Yes | 27 (75.0) | 23 (85.2) | 4 (14.8) | |
FASN overexpression was positively
associated with the number of metastatic lesions in GC
To further explore the association between FASN
expression and metastasis, IHC analyses were conducted.
Consequently, FASN was significantly overexpressed in tissues with
multiple metastatic lesions (MML) (>3), compared with less
metastatic lesions (LML) (≤3) in stage IV patients (P<0.05;
Fig. 3A and B). Besides, the
Kaplan-Meier survival curve further demonstrated that patients with
MML had a lower median survival time of 7.7 months, compared with
24 months in LML (log-rank P<0.05, Fig. 3C). These highly indicated an
important role for FASN in GC metastasis.
FASN overexpression predicted a poor
prognosis of GC
To identify the potential prognostic role of FASN in
GC, multiple analyses were conducted. Firstly, FASN expression was
examined in patients with stage I–III GC with
recurrence/non-recurrence in addition to stage IV patients with
survival/mortality by IHC staining. The results demonstrated that
FASN was significantly overexpressed in patients with recurrence
(P<0.05; Fig. 4A) or mortality
(P<0.05; Fig. 4B).
Secondly, Kaplan-Meier analyses were also performed.
As presented in Fig. 4C, the data
suggested that the FASN levels were significantly associated with
postoperative recurrence in patients with stage I–III GC. FASN
low-expression was associated with a non-recurrent rate of 39.2%,
in contrast with 26.3% for the FASN high-expression group. The
median time to recurrence was 35 months in patients with stages
I–III GC with low-expression of FASN vs. 14 months in those with
overexpression. In patients with stage IV GC, low-expression of
FASN resulted in a 5-year survival rate of 50.0%, which was reduced
to 32.1% in the FASN-overexpressed group. The median survival time
of stage IV patients with FASN overexpression was 9.5 months vs. 35
months for those with low-expression (Fig. 4D).
In Cox's regression model, clinical stage
(P<0.001; HR, 1.931; 95% CI, 1.392–2.680) was an independent
factor in predicting the risk of recurrence following radical
surgery in patients with stage I–III GC, and the number of
metastatic lesions (P=0.018; HR, 2.676; 95% CI, 1.184–6.049) was
also considered as an independent predictor of mortality for
patients with stage IV GC. More importantly, compared with patients
with low-expression of FASN, those with FASN overexpression were
observed to exhibit a significant increase in GC-postoperative
recurrence rate (P=0.014; HR, 1.705; 95% CI, 1.116–2.606), in
addition to overall mortality (P=0.008; HR, 4.412; 95% CI,
1.463–13.305; Table II). Taken
together, the results suggested a potentially promising prognostic
value of FASN for patients with GC.
| Table IIHazard analysis for recurrence
incidence and overall survival rate. |
Table II
Hazard analysis for recurrence
incidence and overall survival rate.
| Covariates | P-value | HR (Hazard
ratio) | 95% CI for HR
|
|---|
| Lower | Upper |
|---|
| Recurrence in stage
I–III GC |
| Gender (vs.
female) | 0.684 | 1.097 | 0.702 | 1.715 |
| Age (vs. <55
years) | 0.664 | 1.099 | 0.717 | 1.685 |
| Stage of
disease | <0.001 | 1.931 | 1.392 | 2.680 |
| Gastric wall
invasion | 0.342 | 1.228 | 0.804 | 1.876 |
| Nodal metastasis
(vs. No) | 0.004 | 1.969 | 1.237 | 3.134 |
| FASN expression
(vs. No) | 0.014 | 1.705 | 1.116 | 2.606 |
| Survival in stage
IV GC |
| Gender (vs.
female) | 0.351 | 1.490 | 0.645 | 3.442 |
| Age (vs. <55
years) | 0.439 | 1.439 | 0.572 | 3.619 |
| Metastatic lesions
(vs. <3) | 0.018 | 2.676 | 1.184 | 6.049 |
| FASN expression
(vs. no) | 0.008 | 4.412 | 1.463 | 13.305 |
Discussion
Tumor metabolism is a key process in cancer growth
and progression. Numerous studies have demonstrated that the
glucose metabolism is essential in cancer cell growth and invasion.
However, few studies have focussed upon the role of lipid
metabolism in tumor development (26). Thus, the current study investigated
the potential role of the lipid metabolism in GC.
FASN is a key enzyme in the lipid metabolism, the
expression of which has clear potential in aiding in the
understanding of the lipid metabolism. FASN has been previously
identified to be overexpressed in several types of solid tumors and
associated with poor prognosis of urothelial carcinoma (27), pancreatic neoplasia (28) and renal cell carcinoma (29). These studies proposed a crucial
role for FASN in tumor progression, however, reports concerning
FASN in GC remain rare. Hou et al (21) identified that FASN overexpression
was significantly correlated with poor prognosis in 90 GC
specimens. In addition, Ito et al (22) observed that FASN was detected in
the serum by enzyme-linked immunosorbent assay in patients with GC
and normal controls. In addition, they observed that FASN was
highly expressed in the serum of patients with GC compared with
those of healthy people. In the present study, the IHC staining
experiment was repeated in a larger GC sample size, and the
association between FASN and clinicopathological parameters
including age, gender, gastric wall invasion, recurrence in stage
I–III patients and survival time in stage IV patients was
investigated. Consequently, similar results were obtained,
identifying that expression of FASN was higher in GC tissues than
those in adjacent non-cancerous tissues, and FASN was significantly
associated with poor prognosis of GC, indicating that FASN
overexpression contributed to GC development.
Notably, previous studies demonstrated that FASN was
not significantly associated with nodal metastasis (21,22).
However, in the present study, the analysis demonstrated that FASN
was positively associated with lymph node metastasis. The
differences in the sample size and the individuals may contribute
to this discrepancy. FASN has however been previously observed to
be associated with nodal metastasis in several other types of tumor
(30–32), thus suggesting that the results are
reliable, and suggesting a potential role of FASN in the early
detection and lymphangiogenesis of GC. In addition, the current
study was, to the best of our knowledge, the first to provide
evidence that FASN was associated with the number of tumor
metastatic lesions, thus indicating that FASN contributes to the
development and progression of GC by promoting invasion and
metastasis of GC cells. Several previous studies have identified
that FASN overexpression promotes proliferation, invasion and
metastasis in certain types of cancer (18,33,34).
By conducting RT-qPCR and western blotting, the mRNA and protein
expression levels of FASN were detected in GC tissues, thus
providing evidence that FASN contributes to GC progression at the
transcriptional and translational levels. However, the underlying
mechanisms require further investigation. The results of the
present study suggest that FASN may serve as a novel prognostic
marker of GC. Identification of FASN as a prognostic biomarker for
GC in the current study provides insight into the mechanisms
associated with poor prognosis.
In summary, by analyzing the expression of GC
tissues and adjacent non-cancerous tissues, the current study
demonstrated that FASN may act as a novel prognostic marker.
Furthermore, lipid metabolism disorders were identified to
participate in the development and progression of GC.
Acknowledgments
The present study was supported by the National
Natural Science Foundation of China (grant no. 81472314 to
Professor Wangjun Liao; grant no. 81472317 to Professor Shi Min)
and the Special Foundation for National Clinical Specialties of
China (to the Department of Oncology, Nanfang Hospital, Southern
Medical University, Guangzhou, China).
References
|
1
|
Siegel R, Ma J, Zou Z and Jemal A: Cancer
statistics, 2014. CA Cancer J Clin. 64:9–29. 2014. View Article : Google Scholar : PubMed/NCBI
|
|
2
|
Jemal A, Bray F, Center MM, Ferlay J, Ward
E and Forman D: Global cancer statistics. CA Cancer J Clin.
61:69–90. 2011. View Article : Google Scholar : PubMed/NCBI
|
|
3
|
Bertuccio P, Chatenoud L, Levi F, Praud D,
Ferlay J, Negri E, Malvezzi M and La Vecchia C: Recent patterns in
gastric cancer: A global overview. Int J Cancer. 125:666–673. 2009.
View Article : Google Scholar : PubMed/NCBI
|
|
4
|
Blum MA, Takashi T, Suzuki A and Ajani JA:
Management of localized gastric cancer. J Surg Oncol. 107:265–270.
2013. View Article : Google Scholar : PubMed/NCBI
|
|
5
|
Rios P, Maruyama K, Sasako M, Sano T and
Katai H: The current situation and treatment strategy for gastric
cancer at the national cancer center of Tokyo, Japan. Rev
Gastroenterol Peru. 14:197–203. 1994.In Spanish.
|
|
6
|
Cidon EU, Ellis SG, Inam Y, Adeleke S,
Zarif S and Geldart T: Molecular targeted agents for gastric
cancer: A step forward towards personalized therapy. Cancers
(Basel). 5:64–91. 2013. View Article : Google Scholar
|
|
7
|
Varis A, Zaika A, Puolakkainen P, Nagy B,
Madrigal I, Kokkola A, Väyrynen A, Kärkkäinen P, Moskaluk C,
El-Rifai W and Knuutila S: Coamplified and overexpressed genes at
ERBB2 locus in gastric cancer. Int J Cancer. 109:548–553. 2004.
View Article : Google Scholar : PubMed/NCBI
|
|
8
|
Califano D, Pignata S, Losito NS, Ottaiano
A, Greggi S, De Simone V, Cecere S, Aiello C, Esposito F, Fusco A
and Chiappetta G: High HMGA2 expression and high body mass index
negatively affect the prognosis of patients with ovarian cancer. J
Cell Physiol. 229:53–59. 2014.
|
|
9
|
Bi X, Rexer B, Arteaga CL, Guo M and
Mahadevan-Jansen A: Evaluating HER2 amplification status and
acquired drug resistance in breast cancer cells using Raman
spectroscopy. J Biomed Opt. 19:0250012014. View Article : Google Scholar : PubMed/NCBI
|
|
10
|
Li W, Tai Y, Zhou J, Gu W, Bai Z, Zhou T,
Zhong Z, McCue PA, Sang N, Ji JY, et al: Repression of endometrial
tumor growth by targeting SREBP1 and lipogenesis. Cell Cycle.
11:2348–2358. 2012. View
Article : Google Scholar : PubMed/NCBI
|
|
11
|
Koochekpour S, Majumdar S, Azabdaftari G,
Attwood K, Scioneaux R, Subramani D, Manhardt C, Lorusso GD,
Willard SS, Thompson H, et al: Serum glutamate levels correlate
with Gleason score and glutamate blockade decreases proliferation,
migration, and invasion and induces apoptosis in prostate cancer
cells. Clin Cancer Res. 18:5888–5901. 2012. View Article : Google Scholar : PubMed/NCBI
|
|
12
|
Zadra G, Photopoulos C, Tyekucheva S,
Heidari P, Weng QP, Fedele G, Liu H, Scaglia N, Priolo C, Sicinska
E, et al: A novel direct activator of AMPK inhibits prostate cancer
growth by blocking lipogenesis. EMBO Mol Med. 6:519–538. 2014.
View Article : Google Scholar : PubMed/NCBI
|
|
13
|
Yang CS, Matsuura K, Huang NJ, Robeson AC,
Huang B, Zhang L and Kornbluth S: Fatty acid synthase inhibition
engages a novel caspase-2 regulatory mechanism to induce ovarian
cancer cell death. Oncogene. 34:3264–3272. 2015. View Article : Google Scholar :
|
|
14
|
Jiang L, Xiao L, Sugiura H, Huang X, Ali
A, Kuro OM, Deberardinis RJ and Boothman DA: Metabolic
reprogramming during TGFβ1-induced epithelial-to-mesenchymal
transition. Oncogene. 34:3908–3916. 2015. View Article : Google Scholar :
|
|
15
|
Ogino S, Nosho K, Meyerhardt JA, Kirkner
GJ, Chan AT, Kawasaki T, Giovannucci EL, Loda M and Fuchs CS:
Cohort study of fatty acid synthase expression and patient survival
in colon cancer. J Clin Oncol. 26:5713–5720. 2008. View Article : Google Scholar : PubMed/NCBI
|
|
16
|
Li J, Dong L, Wei D, Wang X, Zhang S and
Li H: Fatty acid synthase mediates the epithelial-mesenchymal
transition of breast cancer cells. Int J Biol Sci. 10:171–180.
2014. View Article : Google Scholar : PubMed/NCBI
|
|
17
|
Grube S, Dünisch P, Freitag D, Klausnitzer
M, Sakr Y, Walter J, Kalff R and Ewald C: Overexpression of fatty
acid synthase in human gliomas correlates with the WHO tumor grade
and inhibition with Orlistat reduces cell viability and triggers
apoptosis. J Neurooncol. 118:277–287. 2014. View Article : Google Scholar : PubMed/NCBI
|
|
18
|
Agostini M, Almeida LY, Bastos DC, Ortega
RM, Moreira FS, Seguin F, Zecchin KG, Raposo HF, Oliveira HC,
Amoêdo ND, et al: The fatty acid synthase inhibitor orlistat
reduces the growth and metastasis of orthotopic tongue oral
squamous cell carcinomas. Mol Cancer Ther. 13:585–595. 2014.
View Article : Google Scholar
|
|
19
|
Zaytseva YY, Rychahou PG, Gulhati P,
Elliott VA, Mustain WC, O'Connor K, Morris AJ, Sunkara M, Weiss HL,
Lee EY and Evers BM: Inhibition of fatty acid synthase attenuates
CD44-associated signaling and reduces metastasis in colorectal
cancer. Cancer Res. 72:1504–1517. 2012. View Article : Google Scholar : PubMed/NCBI
|
|
20
|
Tomek K, Wagner R, Varga F, Singer CF,
Karlic H and Grunt TW: Blockade of fatty acid synthase induces
ubiquiti-nation and degradation of phosphoinositide-3-kinase
signaling proteins in ovarian cancer. Mol Cancer Res. 9:1767–1779.
2011. View Article : Google Scholar : PubMed/NCBI
|
|
21
|
Hou W, Fei M, Qin X, Zhu X, Greshock J,
Liu P, Zhou Y, Wang H, Ye BC and Qin CY: High overexpression of
fatty acid synthase is associated with poor survival in Chinese
patients with gastric carcinoma. Exp Ther Med. 4:999–1004.
2012.PubMed/NCBI
|
|
22
|
Ito T, Sato K, Maekawa H, Sakurada M,
Orita H, Shimada K, Daida H, Wada R, Abe M, Hino O and Kajiyama Y:
Elevated levels of serum fatty acid synthase in patients with
gastric carcinoma. Oncol Lett. 7:616–620. 2014.PubMed/NCBI
|
|
23
|
Edge SB and Compton CC: The American Joint
Committee on Cancer: The 7th edition of the AJCC cancer staging
manual and the future of TNM. Ann Surg Oncol. 17:1471–1474. 2010.
View Article : Google Scholar : PubMed/NCBI
|
|
24
|
Livak KJ and Schmittgen TD: Analysis of
relative gene expression data using real-time quantitative PCR and
the 2-ΔΔCt method. Methods. 25:402–408. 2001. View Article : Google Scholar
|
|
25
|
Wang L, Wu Y, Lin L, Liu P, Huang H, Liao
W, Zheng D, Zuo Q, Sun L and Huang N: Metastasis-associated in
colon cancer-1 upregulation predicts a poor prognosis of gastric
cancer, and promotes tumor cell proliferation and invasion. Int J
Cancer. 133:1419–1430. 2013. View Article : Google Scholar : PubMed/NCBI
|
|
26
|
Swierczynski J, Hebanowska A and
Sledzinski T: Role of abnormal lipid metabolism in development,
progression, diagnosis and therapy of pancreatic cancer. World J
Gastroenterol. 20:2279–2303. 2014. View Article : Google Scholar : PubMed/NCBI
|
|
27
|
Hamada S, Horiguchi A, Asano T, Kuroda K,
Asakuma J, Ito K, Asano T, Miyai K and Iwaya K: Prognostic impact
of fatty acid synthase expression in upper urinary tract urothelial
carcinoma. Jpn J Clin Oncol. 44:486–492. 2014. View Article : Google Scholar : PubMed/NCBI
|
|
28
|
Walter K, Hong SM, Nyhan S, Canto M,
Fedarko N, Klein A, Griffith M, Omura N, Medghalchi S, Kuhajda F
and Goggins M: Serum fatty acid synthase as a marker of pancreatic
neoplasia. Cancer Epidemiol Biomarkers Prev. 18:2380–2385. 2009.
View Article : Google Scholar : PubMed/NCBI
|
|
29
|
Horiguchi A, Asano T, Asano T, Ito K,
Sumitomo M and Hayakawa M: Fatty acid synthase over expression is
an indicator of tumor aggressiveness and poor prognosis in renal
cell carcinoma. J Urol. 180:1137–1140. 2008. View Article : Google Scholar : PubMed/NCBI
|
|
30
|
Long QQ, Yi YX, Qiu J, Xu CJ and Huang PL:
Fatty acid synthase (FASN) levels in serum of colorectal cancer
patients: Correlation with clinical outcomes. Tumour Biol.
35:3855–3859. 2014. View Article : Google Scholar : PubMed/NCBI
|
|
31
|
Silva SD, Perez DE, Nishimoto IN, Alves
FA, Pinto CA, Kowalski LP and Graner E: Fatty acid synthase
expression in squamous cell carcinoma of the tongue:
Clinicopathological findings. Oral Dis. 14:376–382. 2008.
View Article : Google Scholar : PubMed/NCBI
|
|
32
|
Tsuji T, Yoshinaga M, Togami S, Douchi T
and Nagata Y: Fatty acid synthase expression and
clinicopathological findings in endometrial cancer. Acta Obstet
Gynecol Scand. 83:586–590. 2004. View Article : Google Scholar : PubMed/NCBI
|
|
33
|
Zaytseva YY, Elliott VA, Rychahou P,
Mustain WC, Kim JT, Valentino J, Gao T, O'Connor KL, Neltner JM,
Lee EY, et al: Cancer cell-associated fatty acid synthase activates
endothelial cells and promotes angiogenesis in colorectal cancer.
Carcinogenesis. 35:1341–1351. 2014. View Article : Google Scholar : PubMed/NCBI
|
|
34
|
Li N, Bu X, Tian X, Wu P, Yang L and Huang
P: Fatty acid synthase regulates proliferation and migration of
colorectal cancer cells via HER2-PI3K/Akt signaling pathway. Nutr
Cancer. 64:864–870. 2012. View Article : Google Scholar : PubMed/NCBI
|