Introduction
Osteosarcoma is the most common type of primary
malignant bone tumor with a high rate of metastasis (1). Furthermore, few biomarkers have been
reported for early detection and differential diagnosis; the
aggressiveness of osteosarcoma with rapid metastatic potential
contributes to the poor prognosis of patients with the metastatic
form of this disease (2,3). Multidrug regimens are used to control
tumor cells at various stages of the cell cycle, eliminate local or
distant micrometastases, and reduce the emergence of drug-resistant
cells, which prolongs the overall and progression-free survival of
patients with osteosarcoma compared with single-drug treatments,
such as vincristine (VCR) (4,5).
However, ≤40% of all human cancers develop multidrug resistance
(MDR) following an initial period of response to treatment, and
~30% of osteosarcoma patients with MDR exhibit recurrence or
metastasis during a five-year period (6–8). The
mechanisms of drug resistance are multifactorial, including
disruption of transporter pumps, oncogenes, tumor suppressor genes,
DNA repair system, mitochondrial alterations, autophagy and
epithelial-mesenchymal transition (9,10);
however, the mechanisms underlying drug resistance are complex and
require further investigation. Therefore, the associated molecular
mechanisms and biomarkers should be identified.
The aim of the present study was to analyze the gene
expression profiles of the human osteosarcoma cell line MG63
compared with VCR-resistant MG63 cells (MG63/VCR). These results
may provide novel insight into identifying chemotherapeutic targets
and developing more effective chemotherapy strategies for the
treatment of osteosarcoma with VCR resistance.
Materials and methods
Cell culture
The human VCR-resistant osteosarcoma cell line
MG63/VCR and its parental cell line MG63 were obtained from the
Scientific Research Center, China-Japan Union Hospital of Jilin
University (Jilin, China) (11).
The cells were cultured in high-glucose Dulbecco's modified Eagle's
medium (H-DMEM; Invitrogen, Thermo Fisher Scientific, Inc.,
Waltham, MA, USA) supplemented with 10% fetal bovine serum (FBS;
HyClone; GE Healthcare Life Sciences, Logan, UT, USA) in a
humidified atmosphere with 5% CO2 at 37°C; three
biological replicates were conducted using the MG63 and MG63/VCR
cells.
Cell viability assay
The cells were suspended at a density of
8×10³ cells per well and plated into 96-well plates in
100 µl H-DMEM supplemented with 10% FBS. Following incubation at
37°C for 24 h, the cells were treated with VCR (New Hualian
Pharmaceutical Co., Shanghai, China) at the following final
concentrations: 2,000, 1,000, 500, 250, 125, and 62.5 ng/ml;
drug-free medium was used as the control. MG63 cells were treated
with the following concentrations: 64, 16, 4, 1, 0.25 and 0.0625
ng/ml. The half-maximal inhibitory concentration (IC50)
of VCR in MG63/VCR and MG63 cells was reported to be 453.4 and
0.952 ng/ml, respectively (11). A
total of two groups of cells continued to culture 48 h in drug
medium at 37°C. Cell viability was examined using 10% Cell Counting
kit-8 (CCK-8; Dojindo Molecular Technologies, Inc., Kumamoto,
Japan) according to the manufacturer's protocols, and the cells
were incubated at 37°C for another 2 h. Subsequently, the optical
density (OD) was determined by measuring the absorbance at 450 nm
using a plate reader (UV8100D; LabTech, Inc., Hopkinton, MA, USA),
and the inhibition ratio was calculated using the following
formula: Inhibition
ratio=[(ODcontrol-ODexperiment)/ODcontrol]
×100%. Each experiment was performed in triplicate.
Total RNA extraction and
microarray
Total RNA was extracted from the MG63/VCR and MG63
cells using TRIzol® reagent (Invitrogen; Thermo Fisher
Scientific, Inc.). The quality of total RNA was determined using a
NanoDrop 2000 spectrophotometer (1.7<A260/A280<2.2) and the
RNA integrity (RIN) was evaluated using an Agilent Bioanalyzer 2100
(RIN≥7.0 and 28S/18S>0.7). The initial amount of total RNA
(300–500 ng) was further amplified, labeled and purified by using
the Microarray GeneChip 3′IVT Express kit (Affymetrix; Thermo
Fisher Scientific, Inc.) According to the standard hybridization
procedures and matching kit provided by Affymetrix expression chip.
RNA was then subjected to treatment with the GeneChip
Hybridization, Wash, and Stain kit reagent (Affymetrix; Thermo
Fisher Scientific, Inc.), Rolling hybridization in a Hybridization
Oven 645 for 45°C, 16 h, and washed in GeneChip Fluidics Station
450 (Affymetrix; Thermo Fisher Scientific, Inc.) according to the
manufacturer's protocols. The results of the chip were scanned with
a GeneChip Scanner 3000 system (Affymetrix; Thermo Fisher
Scientific, Inc.). Differentially expressed genes in the two cell
lines were determined using the fold change (FC) values. The gene
expression profile was presented in Excel spreadsheets (Microsoft
Corporation, Redmond, WA, USA). Volcano plot, Scatter-plot and
Clustergram were used to analyze the differential gene expression.
Gene set enrichment analysis was performed using Ingenuity Pathway
Analysis (IPA) online software (12,13).
Reverse transcription-quantitative
polymerase chain reaction (RT-qPCR)
Total RNA was extracted from the MG63/VCR and MG63
cells using TRIzol® reagent and reverse-transcribed into
cDNA using RevertAid First Strand cDNA Synthesis kit (both
Invitrogen; Thermo Fisher Scientific, Inc.) according to the
manufacturer's protocols. The primers used for RT-qPCR were listed
in Table I. qPCR was performed
using SYBR® Premix Ex Taq™ II (Takara
Biotechnology Co., Ltd., Dalian, China) on the Applied Biosystems
7500 Fast Real-Time PCR system (Applied Biosystems; Thermo Fisher
Scientific, Inc.). The conditions used for qPCR were as follows:
Denaturation at 95°C for 30 sec; annealing at 58–62°C for 30 sec;
and 30 cycles of elongation at 95°C for 15 sec, 60°C for 30 sec,
and 95°C for 15 sec. The relative expression levels of each gene,
normalized to the housekeeping gene GAPDH, was calculated
using the 2−∆∆Cq method (14).
 | Table I.Primers used for reverse
transcription-quantitative polymerase chain reaction. |
Table I.
Primers used for reverse
transcription-quantitative polymerase chain reaction.
| Gene | Forward (5′-3′) | Reverse (5′-3′) |
|---|
| GAPDH |
GCACCGTCAAGGCTGAGAAC |
TGGTGAAGACGCCAGTGGA |
| MDR1 |
ATATCAGCAGCCCACATCAT |
GAAGCACTGGGATGTCCGGT |
| IGF2BP1 |
CCACCAGTTGGAGAACCATGCC |
ATGTCCACTTGCTGCTGCTTGG |
| TES |
GCATGATGTCCTCTTGAGCAATGAAG |
CATTCTTCTTGGCAGCAACTGGATTC |
| CAII |
CTGAGCACTGGCATAAGGACTTCC |
ATACTTGGCTGTATGAGTGTCGATGTC |
| AKAP12 |
CTCCACCGAGCAGCGCAG |
GGTCCGAGGCAGCGATGG |
| COL1A2 |
TGTGATTTCTCTACTGGCGAAACC |
ACGTGTTTCTTGTCCTTGGAGC |
| ROBO1 |
ACCCAGTAACTTGGCAGTAACTGT |
TGGGCAGCTCTCCATCATCT |
| DAPK1 |
AGCACCGGCCTCCAGTATGC |
TGTCCTCGCGGCTCACACC |
| SLIT2 |
TTAACTGTAACTGCTACCTGGCTTGG |
TCATCACAAGTGAAGTCCTGAATGGC |
| FLRT3 |
GCTGTTCCTTCAAGTAGCACCTCTATC |
TTGTAGCATCCTCTGGTATTCCTGTTG |
Statistical analysis
Statistical analyses were performed using GraphPad
Prism 5 (GraphPad Software, Inc., La Jolla, CA, USA), and all data
are presented as the mean ± standard deviation. The statistical
significance of the differences between the cell lines and
treatments was analyzed by a Student's test or one-way analysis of
variance and Tukey's test. IC50 was performed using
global nonlinear regression analysis. Differential gene expression
analysis was performed using a Student's t-test. The result of the
chip analysis is the weighted average of repeated probe signals in
each group. The threshold for statistical significance was
P<0.05, |FC|>1.5. To systematically assign putative functions
to the differentially expressed genes, bioinformatics analysis was
performed with IPA. The unique statistical index of IPA is the
z-score, which represents the direction and multiplier of the
molecular changes under the existing experimental conditions. The
z-score indicates whether the results are consistent with the
references mentioned in the literature; inhibition or activation of
the molecular action process was considered when |z|>2. A
positive z-score suggests that the molecular interaction is
activated, whereas a negative z-score indicates that the molecular
interaction is inhibited.
Results
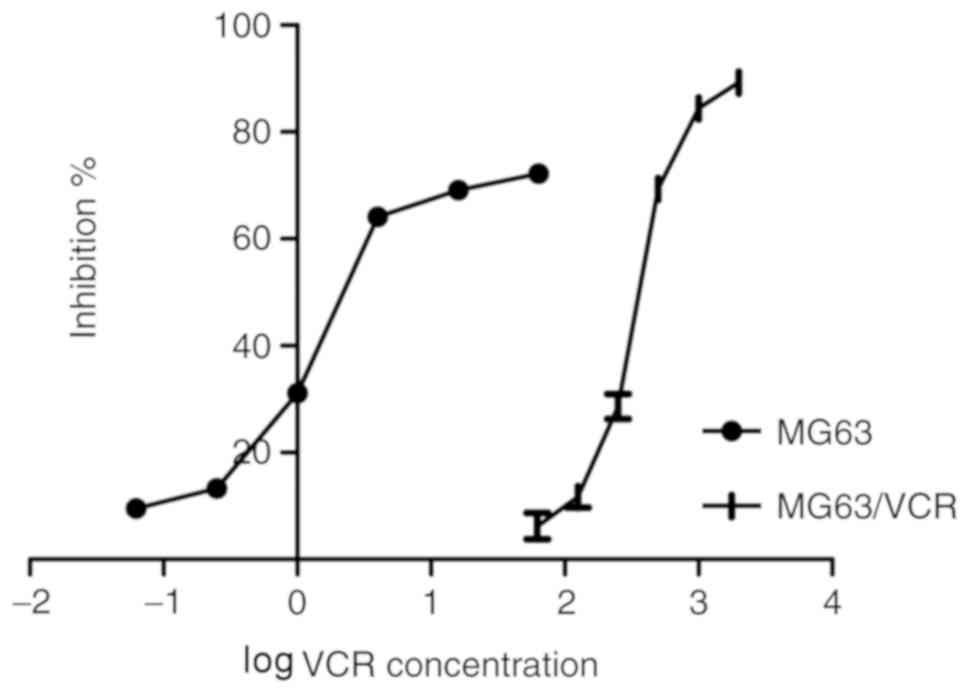
Sensitivity of MG63/VCR and MG63 cells
to vincristine
To investigate the chemosensitivity of MG63/VCR and
MG63 cells to VCR, the IC50 values in response to
treatment with different VCR concentrations were determined.
Following 48 h of culture in a VCR-containing medium, the IC50
value for MG63/VCR cells was significantly increased compared with
that of MG63 cells (493.175±4.473 vs. 1.407±0.111 ng/ml, P=0.001),
suggesting that MG63/VCR cells are more refractory to VCR compared
with the parental MG63 cell line (Fig.
1).
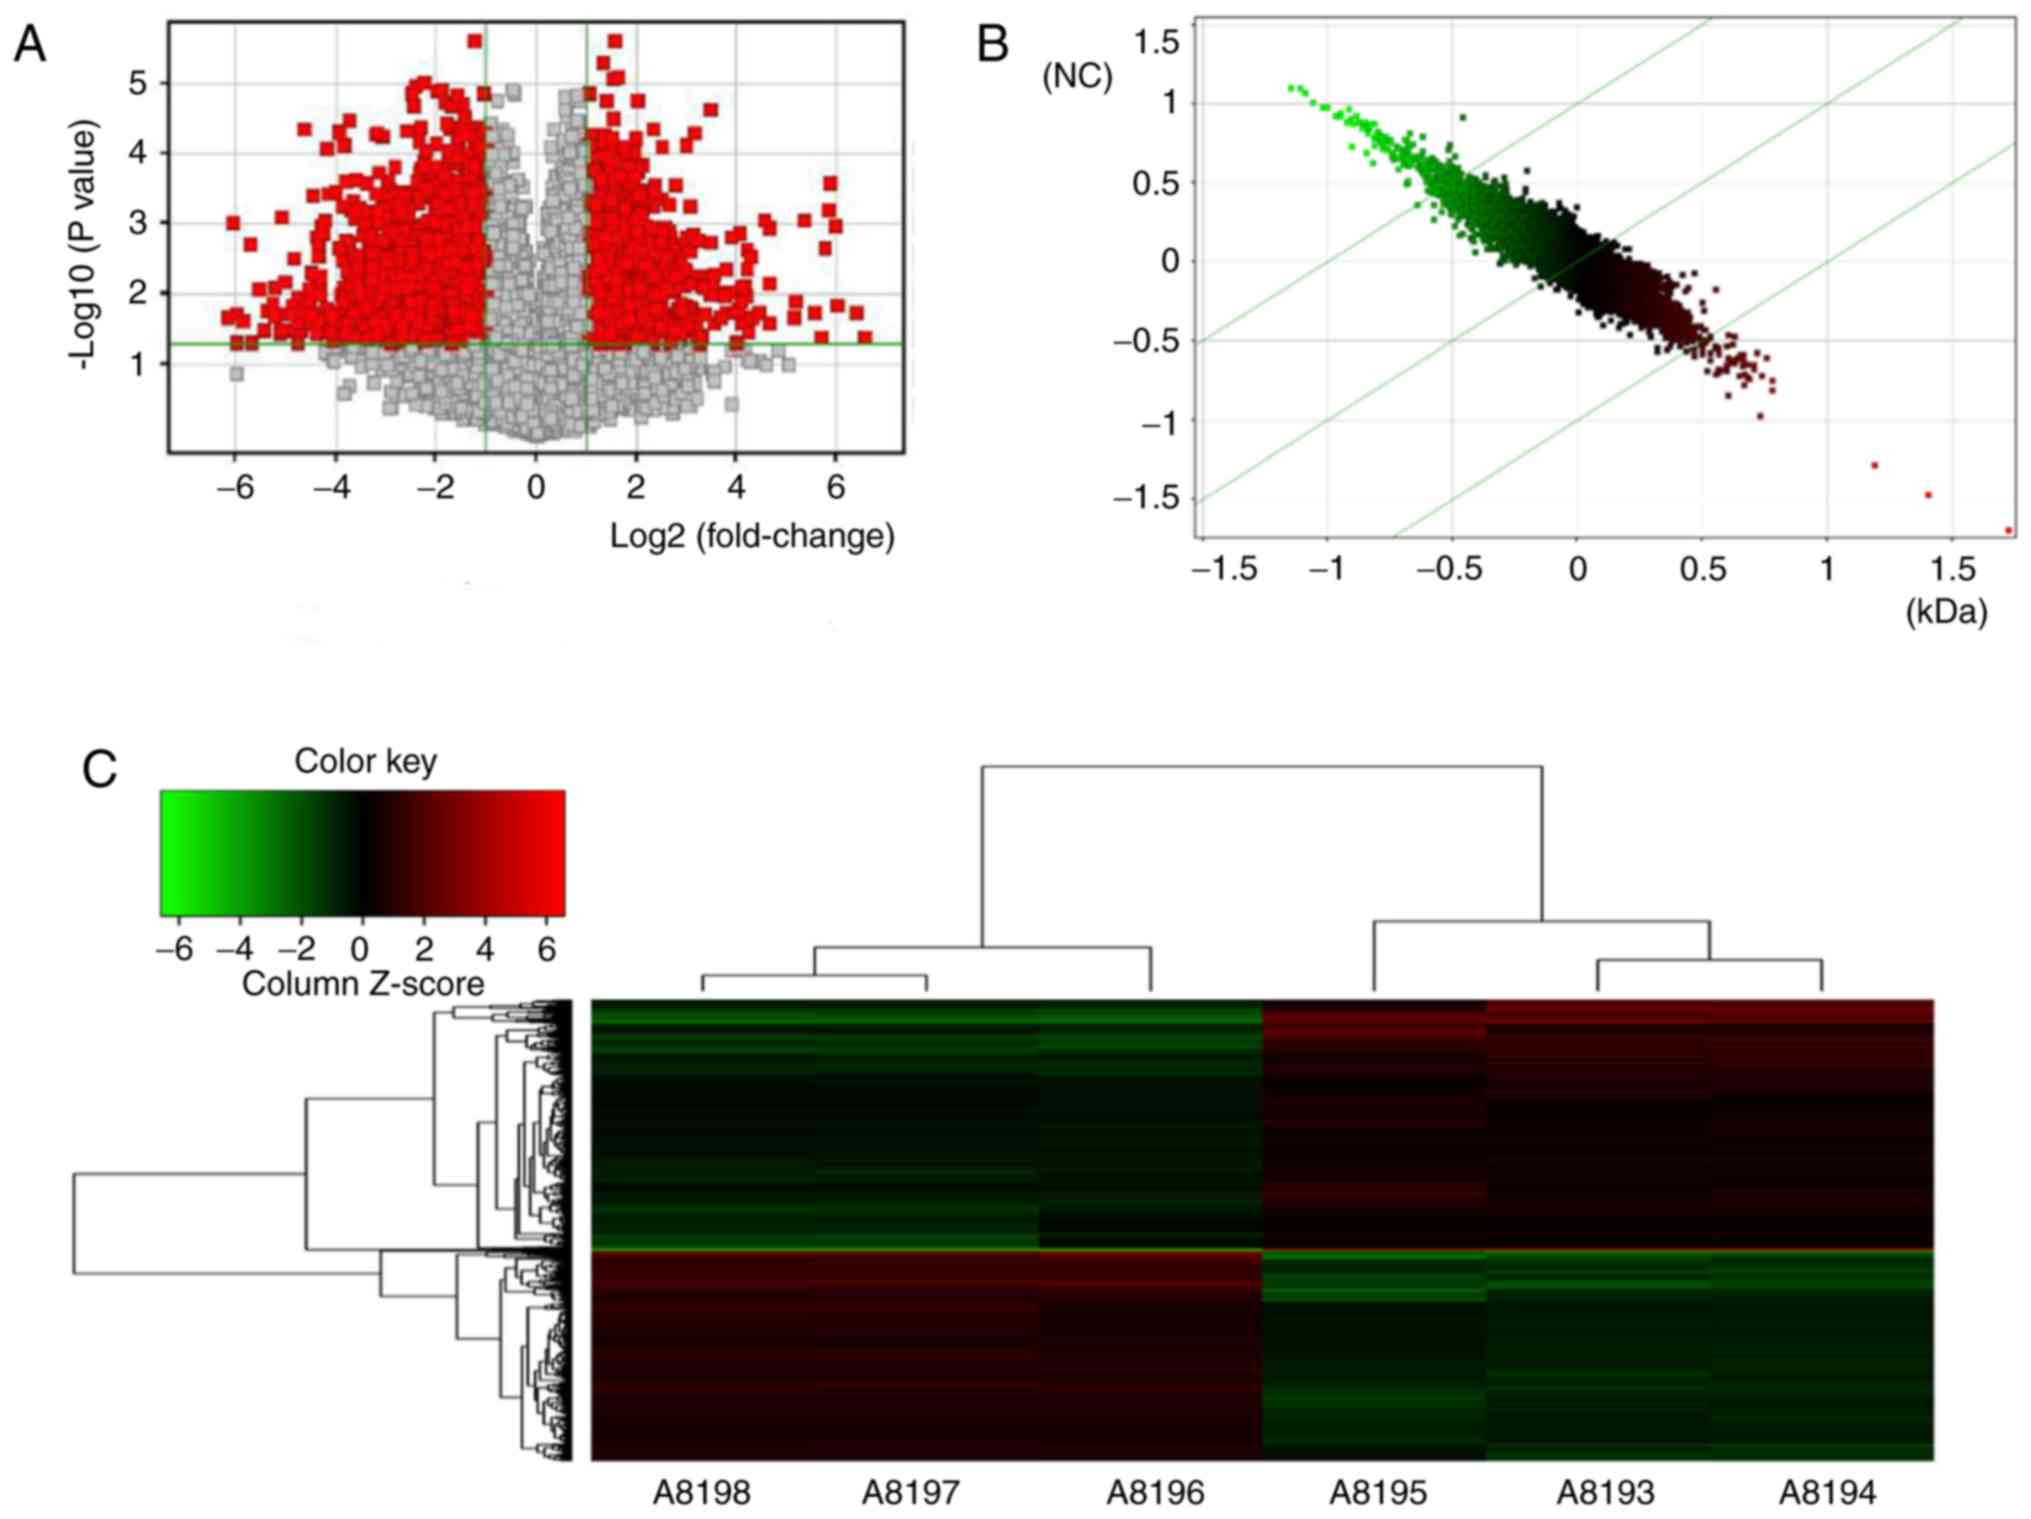
Distinct gene expression landscapes
between MG63/VCR and MG63 cells
In total, the genes that exhibited significantly
aberrant expression between the two cell lines in microarray
analysis were evaluated by volcano plot filtering (P<0.05,
FC≥1.5; Fig. 2A). A total of 602
genes were upregulated and 698 were downregulated in MG63/VCR cells
compared with MG63 cells. The scatterplot and cluster analysis
(Fig. 2B and C) revealed the
differential expression profiles of the genes.
Evaluation of the diagnostic potential
of differentially expressed genes
To evaluate the diagnostic potential of
differentially expressed genes in VCR-resistant MG63 cells, 45 of
the downregulated genes (Table
II) and 26 of the upregulated genes (Table III) with statistical significance
at P<0.05 and a ≥4-fold difference in expression levels between
the two cell lines, were selected for further analysis. Based on
their putative functions, all genes (Tables II and III) were categorized into subgroups,
including transcription factors (n=2+2), enzymes (n=7+5),
transporters (n=2+3), transmembrane receptors (n=1+3) and others
(n=33+13).
| Table II.Genes with downregulated expression in
MG63/VCR relative to MG63 cells. |
Table II.
Genes with downregulated expression in
MG63/VCR relative to MG63 cells.
| Gene | Gene name | P-value | Fold change | False discovery
rate |
|---|
| Transcription
factors |
|
|
|
|
|
TP63 | Tumor protein 63 | 0.00092 | −7.26360 | 0.00266 |
|
ZEB2 | Zinc finger E-box
binding homeobox 2 | 0.00016 | −4.23951 | 0.00145 |
| Transporters |
|
|
|
|
|
FABP5 | Fatty acid binding
protein 5 (psoriasis-associated) | <0.00001 | −66.32220 | 0.00035 |
|
ABCA8 | ATP-binding
cassette, sub-family A (ABC1), member 8 | 0.00055 | −4.11858 | 0.00220 |
| Transmembrane
receptors |
|
|
|
|
|
IL13RA2 | Interleukin 13
receptor, a2 | 0.00008 | −15.08010 | 0.00111 |
| Enzymes |
|
|
|
|
|
PLSCR4 | Phospholipase
scramblase 2 | 0.00226 | −5.89258 | 0.00442 |
|
CHI3L1 | Chitinase 3-like 1
(cartilage glycoprotein-39) | <0.00001 | −196.98900 | 0.00061 |
|
TGM2 | Transglutaminase
2 | 0.00006 | −4.85356 | 0.00106 |
|
EFEMP1 | EGF containing
fibulin-like extracellular matrix protein 1 | 0.00011 | −5.37078 | 0.00124 |
|
MSMO1 | Methylsterol
monooxygenase 1 | 0.00232 | −8.35006 | 0.00449 |
|
LOX | Lysyl oxidase | 0.00035 | −4.77463 | 0.00180 |
|
AKR1C3 | Aldo-keto reductase
family 1, member C3 | 0.00009 | −6.83914 | 0.00116 |
| Other |
|
|
|
|
|
IL15 | Interleukin 15 | 0.00427 | −4.77006 | 0.00698 |
|
CCL2 | Chemokine (C-C
motif) ligand 2 | 0.00107 | −7.26246 | 0.00288 |
|
KCNK2 | Potassium channel,
two pore domain subfamily K, member 2 | 0.00017 | −5.20959 | 0.00146 |
|
KCNJ2 | Potassium channel,
inwardly rectifying subfamily J, member 2 | 0.00017 | −4.15907 | 0.00146 |
|
DAPK1 | Death-associated
protein kinase 1 | 0.00072 | −5.37922 | 0.00242 |
|
DKK1 | Dickkopf WNT
signaling pathway inhibitor 1 | 0.00007 | −6.61779 | 0.00109 |
|
GSAP | γ-secretase
activating protein | 0.00104 | −4.12709 | 0.00283 |
| ADAMTS1 | ADAM
metallopeptidase with thrombospondin type 1 motif, 1 | <0.00001 | −4.76113 | 0.00058 |
|
SLIT2 | Slit guidance
ligand 2 | 0.00037 | −8.33081 | 0.00186 |
|
THBS2 | Thrombospondin
2 | <0.00001 | −4.12890 | 0.00047 |
|
CCDC102B | Coiled-coil domain
containing 102B | 0.00063 | −6.34919 | 0.00230 |
|
CDH2 | Cadherin 2, type 1,
N-cadherin (neuronal) | <0.00001 | −8.36960 | 0.00045 |
|
TM4SF18 | Transmembrane 4 L
six family member 18 | 0.00016 | −6.42868 | 0.00145 |
|
FLRT3 | Fibronectin leucine
rich transmembrane protein 3 | 0.00057 | −5.87903 | 0.00224 |
|
THY1 | Thy-1 cell surface
antigen | <0.00001 | −18.64350 | 0.00046 |
|
SHISA3 | Shisa family member
3 | <0.00001 | −8.51613 | 0.00035 |
|
ITGB8 | Integrin, b8 | 0.00578 | −4.32276 | 0.00873 |
|
CDH11 | Cadherin 11, type
2, OB-cadherin (osteoblast) | 0.00001 | −8.02862 | 0.00065 |
|
COL3A1 | Collagen, type III,
a1 | 0.00011 | −11.94630 | 0.00124 |
|
PCDH18 | Protocadherin
18 | 0.00109 | −4.42683 | 0.00290 |
|
LRCH2 | Leucine-rich
repeats and calponin homology (CH) domain containing 2 | 0.00129 | −5.18966 | 0.00321 |
|
SEMA6D | Sema domain,
transmembrane domain (TM), and cytoplasmic domain, (semaphorin)
6D | 0.00004 | −4.88122 | 0.00096 |
| TES | Testin LIM domain
protein | 0.00015 | −22.05530 | 0.00139 |
| LUM | Lumican | 0.00582 | −4.02085 | 0.00877 |
| SPRY1 | Sprouty RTK
signaling antagonist 1 | 0.00009 | −6.06186 | 0.00116 |
| Other |
|
|
|
|
|
CD46 | CD46 molecule,
complement regulatory protein | 0.01614 | −4.36522 | 0.01969 |
|
CCNG1 | Cyclin G1 | 0.00188 | −6.89583 | 0.00396 |
|
ABI3BP | ABI family, member
3 (NESH) binding protein | 0.00005 | −6.61567 | 0.00106 |
|
FLRT2 | Fibronectin leucine
rich transmembrane protein 2 | 0.00004 | −4.43384 | 0.00098 |
|
SNTB1 | Syntrophin, b1
(dystrophin-associated protein A1, 59kDa, basic component 1) | 0.00068 | −4.41392 | 0.00236 |
|
AIF1L | Allograft
inflammatory factor 1-like | 0.00014 | −8.21928 | 0.00138 |
|
GAL | Galanin/GMAP
prepropeptide | <0.00001 | −11.35750 | 0.00051 |
|
VCAN | Versican | 0.00019 | −12.17840 | 0.00152 |
| Table III.Genes with upregulated expression of
MG63/VCR relative to MG63 cells. |
Table III.
Genes with upregulated expression of
MG63/VCR relative to MG63 cells.
| Gene symbol | Gene name | P-value | Fold change | False discovery
rate |
|---|
| Transcriptional
regulators |
|
|
|
|
|
RBPMS | RNA-binding protein
with multiple splicing | 0.00017 | 4.21538 | 0.00147 |
|
HEY1 | Hes-related family
bHLH transcription factor with YRPW motif 1 | 0.00140 | 4.53673 | 0.00336 |
| Transporters |
|
|
|
|
|
BET1 | Bet1 Golgi
vesicular membrane trafficking protein | 0.00009 | 5.03427 | 0.00117 |
|
AKAP12 | A kinase (PRKA)
anchor protein 12 | 0.00011 | 4.74115 | 0.00124 |
|
MDR1 | ATP-binding
cassette, sub-family B (MDR/TAP), member 1 | <0.00001 | 50.25262 | 0.00036 |
| Transmembrane
receptors |
|
|
|
|
|
F3 | Coagulation factor
III (thromboplastin, tissue factor) | 0.00368 | 6.49217 | 0.00621 |
|
TNFRSF19 | Tumor necrosis
factor receptor superfamily, member 19 | 0.00037 | 7.31358 | 0.00185 |
|
ROBO1 | Roundabout guidance
receptor 1 | <0.00001 | 6.28868 | 0.00035 |
| Enzymes |
|
|
|
|
|
GNG11 | Guanine nucleotide
binding protein (G protein) g11 | 0.00001 | 4.43954 | 0.00065 |
|
RNF182 | Ring finger protein
182 | <0.00001 | 9.08702 | 0.00036 |
|
OTUB2 | OTU deubiquitinase,
ubiquitin aldehyde binding 2 | 0.00200 | 4.41107 | 0.00410 |
|
EPHX4 | Epoxide hydrolase
4 | 0.00024 | 4.63712 | 0.00160 |
|
CA2 | carbonic anhydrase
II | <0.00001 | 10.07676 | 0.00022 |
| Others |
|
|
|
|
|
IGF2BP1 | Insulin-like growth
factor 2 mRNA-binding protein I | <0.00001 | 10.19015 | 0.00051 |
|
KIAA1324L | KIAA1324-like | 0.00039 | 4.86219 | 0.00192 |
|
PTPRQ | protein tyrosine
phosphatase, receptor type, Q | 0.00256 | 7.63223 | 0.00479 |
|
FAM101B | family with
sequence similarity 101, member B | 0.00176 | 4.34868 | 0.00382 |
|
TNNT1 | Troponin T type 1
(skeletal, slow) | 0.00070 | 4.17861 | 0.00241 |
|
COL1A2 | Collagen, type I,
a2 | 0.00173 | 5.21119 | 0.00377 |
|
ESRP1 | Epithelial splicing
regulatory protein 1 | 0.01391 | 8.18397 | 0.01748 |
|
RBM48 | RNA binding motif
protein 48 | 0.00151 | 4.44897 | 0.00352 |
|
KLHL13 | Kelch-like family
member 13 | 0.00022 | 4.27967 | 0.00156 |
|
DSP | Desmoplakin | 0.00002 | 7.71674 | 0.00077 |
|
NEFL | Neurofilament,
light polypeptide | 0.00048 | 4.07517 | 0.00208 |
|
AMIGO2 | Adhesion molecule
with Ig-like domain 2 | 0.01035 | 4.29618 | 0.01381 |
|
AKAP9 | A kinase (PRKA)
anchor protein 9 | 0.00038 | 7.09333 | 0.00189 |
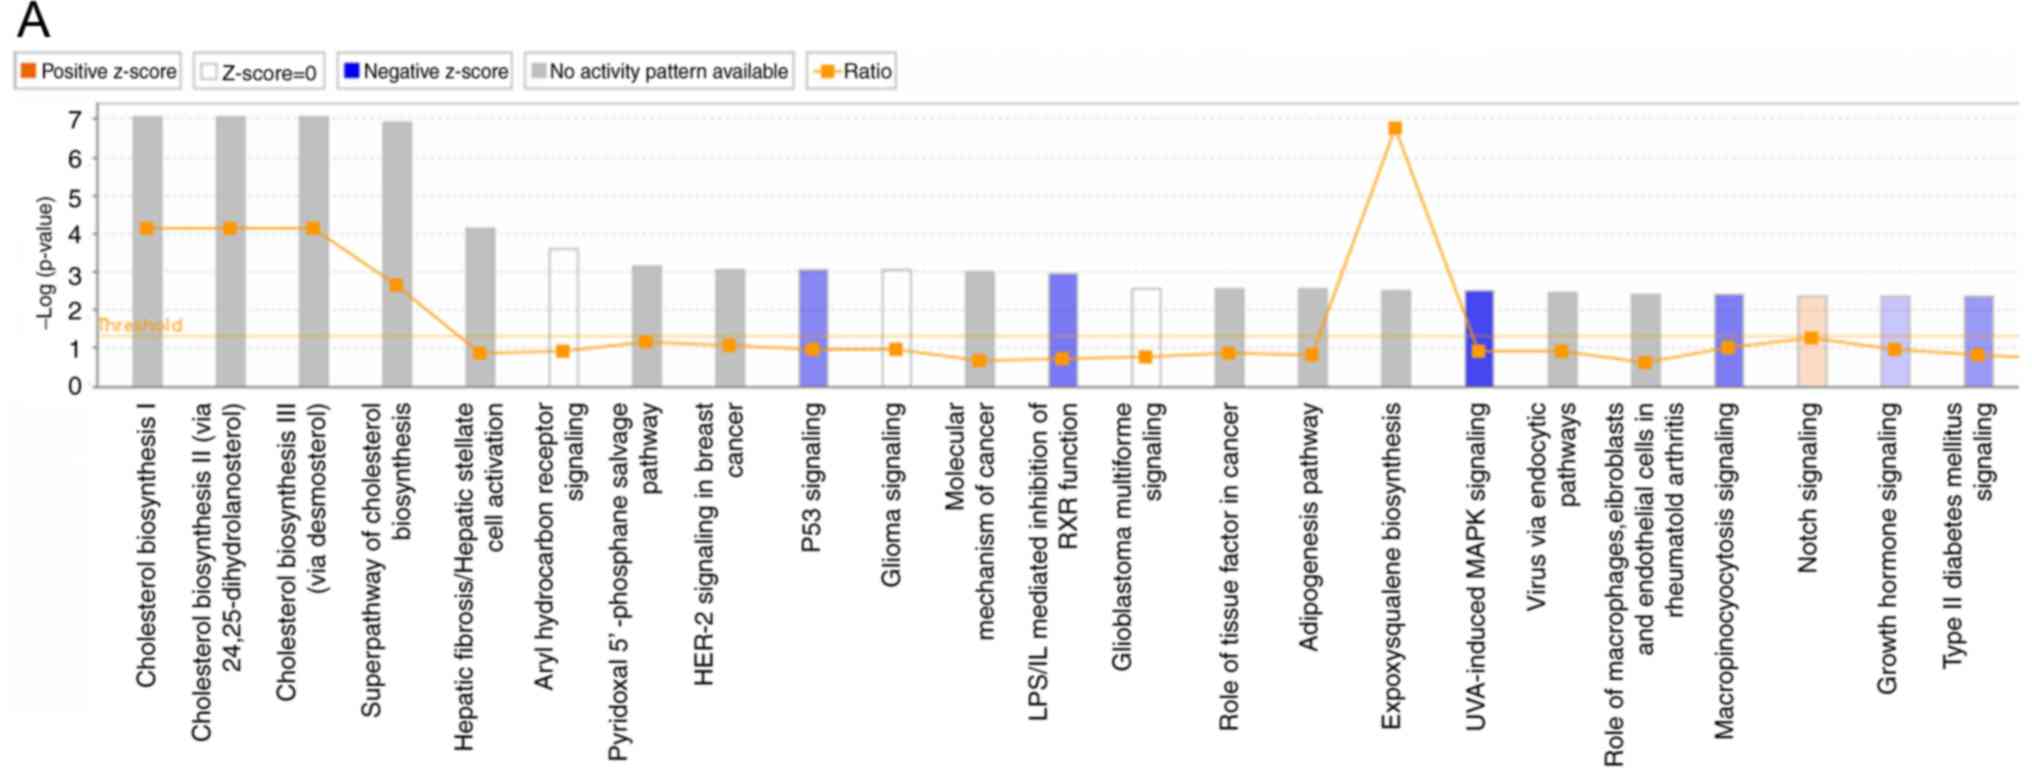
Signaling pathways analysis
To systematically assign putative functions to the
differentially expressed genes, bioinformatics analysis was
performed. Among the 800 signaling pathways identified by IPA, the
major signaling pathways regulated by the differentially expressed
genes were enriched in B-cell receptor signaling [including early
growth response protein 1, mitogen-activated protein kinases 9
(MAPK9), cell division control protein 42 homolog and protein
phosphatase 3 catalytic subunit A], ultraviolet A (UVA)-induced
MAPK signaling [including phosphoinositide-3-kinase regulatory
subunit 1, MAPK9 and epidermal growth factor receptor (EGFR)] and
Erb-B2 receptor tyrosine kinase 2/3 (ErbB2/3) signaling pathways
(including RAS related 2, signal transducer and activator of
transcription 5B and serine/threonine kinase ATM; Table IV). The first two pathways were
predicted to be inhibited, while the last pathway was predicted to
be promoted by VCR, suggesting that combination therapy with EGFR
inhibitor and VCR may be more effective compared with single-drug
therapy. The top enriched pathway was UVA-induced MAPK signaling
(Fig. 3A and B), with a z-score of
−2.309. The data, together with the predicted signaling pathways,
may provide novel insight in determining whether the aberrant
expression of these molecules, such as EGFR, may contribute to drug
resistance.
| Table IV.Canonical pathways for gene
enrichment of differentially expressed genes in MG63/VCR relative
to MG63 cells. |
Table IV.
Canonical pathways for gene
enrichment of differentially expressed genes in MG63/VCR relative
to MG63 cells.
| Canonical
Pathways | -log(P-value) | Ratio | z-score | Molecules |
|---|
| UVA-induced MAPK
signaling | 2.51 | 0.136 | −2.309 | PLCE1, RRAS2,
PIK3R1, ZC3HAV1, MAPK9, TNKS2, PLCL2, RPS6KA1, PARP14, PRKCA, ATM,
EGFR |
| Role of NFAT in
cardiac hypertrophy | 2.33 | 0.106 | −2.065 | IL6ST, PIK3R1,
MAPK9, PLCL2, HDAC6, CAMK2D, GNG11, PLCE1, RRAS2, MEF2D, PPP3R1,
IGF1R, PRKAG2, PRKCE, MEF2C, SLC8A1, PPP3CA, ATM, PRKCA |
| LPS-stimulated MAPK
signaling | 1.74 | 0.123 | −2.121 | RRAS2, CDC42,
PIK3R1, PRKCE, CD14, MAPK9, MAP3K5, PRKCA, ATM |
| 14-3-3-mediated
signaling | 1.56 | 0.103 | −2.530 | SRPK2, PLCE1,
RRAS2, PIK3R1, PRKCE, MAPK9, PLCL2, BAX, MAP3K5, RPS6KA1, PRKCA,
ATM |
| B cell receptor
signaling | 1.24 | 0.086 | −3.207 | RAP2A, PIK3R1,
EGR1, MAPK9, INPPL1, MALT1, MAP3K5, EBF1, CAMK2D, RRAS2, CDC42,
PPP3R1, MEF2C, PPP3CA, ATM |
| HGF signaling | 1.20 | 0.095 | −2.530 | RRAS2, CDC42,
PIK3R1, CDKN1A, PRKCE, MAPK9, MAP3K5, ITGA4, PRKCA, ATM |
| Role of pattern
recognition receptors in recognition of bacteria and viruses | 1.08 | 0.088 | −2.333 | PTX3, IL18, C3,
PIK3R1, DDX58, CASP1, PRKCE, MAPK9, EIF2AK2, PRKCA, ATM |
| mTOR signaling | 1.03 | 0.080 | −2.138 | NAPEPLD, ULK1,
DDIT4, PIK3R1, FKBP1A, EIF4E, RRAS2, IRS1, PRKAG2, PRKAA1, PRKCE,
RPS6KA1, ATM, RPS14, PRKCA |
| Endothelin-1
signaling | 1.03 | 0.081 | −2.111 | NAPEPLD, PIK3R1,
MAPK9, PLCL2, RRAS2, PLCE1, GNAO1, CASP1, RARRES3, PRKCE, ECE1,
CASP7, ATM, PRKCA |
| Signaling by Rho
family GTPases | 1.02 | 0.077 | −2.000 | PIK3R1, WASF3,
CDH6, MAPK9, MYLK, CDH11, LIMK1, CDH2, ARPC1A, GNG11, CDH5, CDC42,
EZR, GNAO1, ARHGEF18, ARHGEF9, ATM, ITGA4 |
| HMGB1
signaling | 0.90 | 0.083 | −2.530 | IL18, ICAM1, RRAS2,
CCL2, CDC42, PIK3R1, MAPK9, TNFRSF11B, ATM, PLAT |
| Leukocyte
extravasation signaling | 0.88 | 0.076 | −2.111 | ICAM1, PIK3R1,
THY1, MAPK9, MLLT4, CDH5, CDC42, JAM3, EZR, CD44, PRKCE, ATM,
PRKCA, ITGA4, CTNND1 |
| CNTF signaling | 0.81 | 0.096 | −2.236 | IL6ST, RRAS2,
PIK3R1, RPS6KA1, ATM |
| Role of NANOG in
mammalian embryonic stem cell pluripotency | 0.80 | 0.081 | −2.000 | IL6ST, RRAS2, WNT3,
PIK3R1, WNT2B, SMAD4, FZD1, BMP5, ATM |
| FcγRIIB signaling
in B lymphocytes | 0.73 | 0.098 | −2.000 | RRAS2, PIK3R1,
MAPK9, ATM |
| NGF signaling | 0.63 | 0.075 | −2.828 | RRAS2, CDC42,
PIK3R1, MAPK9, BAX, MAP3K5, RPS6KA1, ATM |
| CD28 signaling in T
helper cells | 0.49 | 0.068 | −2.828 | ARPC1A, CDC42,
PIK3R1, PPP3R1, MAPK9, MALT1, PPP3CA, ATM |
| RANK signaling in
osteoclasts | 0.45 | 0.068 | −2.449 | PIK3R1, PPP3R1,
MAPK9, MAP3K5, PPP3CA, ATM |
| ErbB2-ErbB3
signaling | 0.42 | 0.070 | 2.000 | RRAS2, PIK3R1,
STAT5B, ATM |
| Insulin receptor
signaling | 0.36 | 0.061 | −2.121 | RRAS2, IRS1,
PIK3R1, PRKAG2, IRS2, INPPL1, EIF4E, ATM |
| Renal cell
carcinoma signaling | 0.26 | 0.056 | −2.000 | RRAS2, CDC42,
PIK3R1, ATM |
RT-qPCR validation of differentially
expressed genes
A total of 10 of the differentially expressed genes
identified by microarray analysis were selected for further
validation using RT-qPCR, including six upregulated genes
[multi-drug resistance gene1 (MDR1), carbonic anhydrase II
(CAII), insulin-like growth factor-II binding protein 1
(IGF2BP1), A-kinase anchor protein 12 (AKAP12),
roundabout homolog 1 (ROBO1) and collagen A2
(COL1A2)], and four downregulated genes, including slit
guidance ligand 2, death-associated protein kinase 1
(DAPK1), fibronectin leucine rich transmembrane protein 3
(FLRT3) and testin LIM domain protein. As presented in
Fig. 4, the expression profiles of
the 10 genes were consistent with the microarray data; however, the
FC values varied to an extent. RT-qPCR revealed that the expression
levels of FLRT3 were increased in MG63/VCR cells, which is in
controversy with the microarray data. Thus, 9 of the 10 genes were
positively determined by RT-qPCR.
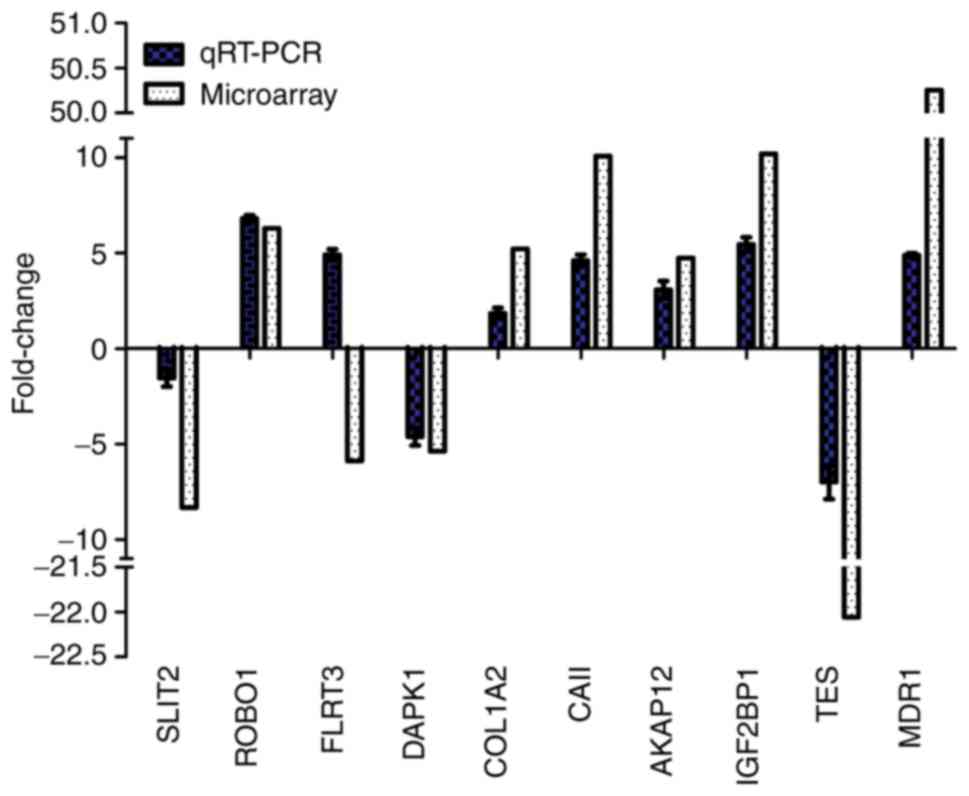 | Figure 4.RT-qPCR validation of the microarray
results for ten selected genes. Relative fold changes as determined
by RT-qPCR are plotted against the microarray data. AKAP12,
A-kinase anchor protein 12; CAII, carbonic anhydrase II; COL1A2,
collagen A2; DAPK1, death-associated protein kinase 1; FLRT3,
fibronectin leucine rich transmembrane protein 3; IGF2BP1,
insulin-like growth factor-II binding protein 1; MDR1, multi-drug
resistance gene1; ROBO1, roundabout homolog 1; RT-qPCR, reverse
transcription-quantitative polymerase chain reaction; SLIT2, slit
guidance ligand 2; TES, testin LIM domain protein. |
Discussion
Personalized chemotherapy based on biomarkers may
improve the sensitivity to chemotherapy and the clinical outcome of
patients with cancer. Thus, investigating the molecular mechanisms
underlying drug resistance is essential to develop a personalized
chemotherapy regimen and prevent drug resistance during cancer
therapy. In the present study, the roles of differentially
expressed genes in VCR resistance of osteosarcoma cells were
investigated by microarray analysis. Numerous genes determined as
differentially expressed in VCR-resistant osteosarcoma cells may
also be associated with VCR resistance in the present study, such
as MDR1 (11), which was
upregulated in MG63/VCR cells. Previous studies have indicated that
MDR1serves a key role in the proliferation and survival of
epithelial and malignant cells during tumorigenesis, as well as in
acquired drug resistance (15,16).
Few of the differentially expressed genes identified in the present
study, including CAII and IGF2BP1, have also been
reported to promote cell invasion and drug resistance (17,18);
however, some results were in conflict with previous studies. For
example, zinc finger E-box binding homeobox 2and chitinase 3-like 1
(cartilage glycoprotein-39) were downregulated in MG63/VCR cells
compared with MG63 cells, which is inconsistent with other studies
(19,20); this may be caused by experimental
errors. Different experimental conditions, including sample types,
processing methods and sampling time may result in differences in
gene expression, which may also be affected by a variety of
factors, such as PCR conditions and chip analysis. In addition,
there is a lack of data to effectively predict the functions of
some of the aberrantly expressed genes at present, including
AKAP12, DAPK1 and ROBO1, which may be the potential
genes associated with drug resistance; however, further
investigation is required.
IPA analysis can aid the investigation of novel
molecular mechanisms underlying drug resistance. For example, a
previous study revealed that the expression levels of COL1A2
and insulin like growth factor 1 receptor (IGF1R), along
with the associated pathways, were induced in ovarian cancer cells
with topotecan- and paclitaxel-resistance (21). In addition, IGF1R-induced
chemoresistance of tumor cells was associated with the signaling
pathways involved in the promotion of cell proliferation,
inhibition of apoptosis, regulation of ATP-binding cassette
transporter proteins and interactions with the extracellular matrix
(22); however, other mechanisms
underlying drug resistance require further investigation.
Furthermore, signaling pathway analysis revealed
that differently expressed genes are mainly enriched in pathways,
including B cell receptor signaling, UVA-induced MAPK signaling and
ErbB2-ErbB3 signaling, which were previously associated with drug
resistance (23–25). For instance, B-cell receptor
signaling was reported as an essential mediator of cytoskeletal
reorganization, integrin clustering and environmental-mediated drug
resistance (23). A recent study
revealed that the steroidal lactone withaferin A may serve as a
low-toxicity addition to ERBB2-targeted therapeutics, particularly
when ERBB3 induced resistance or reduced overall sensitivity
(24). Several studies have
indicated that numerous proteins are involved in UVA-induced MAPK
signaling, such as EGFR (P=0.003473, FC=1.95397), which was
upregulated in MG63/VCR cells and maybe a key regulator in the
pathways associated with VCR resistance (25,26).
EGFR is a transmembrane tyrosine kinase receptor, and is one of the
most extensively studied MDR-associated receptors (25). Inhibition of the EGFR/HER2
signaling pathway, particularly the activity of downstream PI3K,
induced a more favorable milieu for tumor immunotherapy (26). While the UVA-induced MAPK signaling
pathway was downregulated in MG63-VCR cells, EGFR was upregulated;
however, the effects of this pathway on drug resistance remain
unknown.
In conclusion, differentially expressed genes were
identified between MG63/VCR and MG63 cells in the present study.
These results revealed the potential functions of these genes,
providing novel insight into their roles in drug resistance and
associated pathways, which may aid the identification of novel
potential targets for the treatment of osteosarcoma.
Acknowledgements
Not applicable.
Funding
The present study was supported by the International
Cooperation of Jilin Provincial Science & Technology Department
(grant no. 20150101175JC) and the National Natural Science
Foundation of China (grant nos. 81172000 and 30772488).
Availability of data and materials
The datasets used or analysed during the current
study are available from the corresponding author on reasonable
request.
Authors' contributions
YW was the person in charge of this project,
responsible for overall planning and specific project
implementation. YW and RC conceived and designed the study. L-HH
has provided technical support and experimental guidance in the
construction of multidrug resistant cell sublines and is
responsible for monitoring the stability of multidrug resistant
cells. RC, Y-YG, J-ZY performed the experiments. YW and RC wrote
the paper. RC, Y-YG, J-ZY, L-HH and YW reviewed and edited the
manuscript. All authors read and approved the manuscript.
Ethics approval and consent to
participate
Not applicable.
Patient consent for publication
Not applicable.
Competing interests
The authors declare that they have no competing
interests.
References
|
1
|
Cai S, Zhang T, Zhang D, Qiu G and Liu Y:
Volume-sensitive chloride channels are involved in cisplatin
treatment of osteosarcoma. Mol Med Rep. 11:2465–2470. 2015.
View Article : Google Scholar : PubMed/NCBI
|
|
2
|
Zhang Y, Zhang L, Zhang G, Li S, Duan J,
Cheng J, Ding G, Zhou C, Zhang J, Luo P, et al: Osteosarcoma
metastasis: Prospective role of ezrin. Tumor Biol. 35:5055–5059.
2014. View Article : Google Scholar
|
|
3
|
Luetke A, Meyers PA, Lewis I and Juergens
H: Osteosarcoma treatment-where do we stand? A state of the art
review. Cancer Treat Rev. 40:523–532. 2014. View Article : Google Scholar : PubMed/NCBI
|
|
4
|
Wang Y and Teng JS: Increased multi-drug
resistance and reduced apoptosis in osteosarcoma side population
cells are crucial factors for tumor recurrence. Exp Ther Med.
12:81–86. 2016. View Article : Google Scholar : PubMed/NCBI
|
|
5
|
Wang X, Zheng H, Shou T, Tang C, Miao K
and Wang P: Effectiveness of multi-drug regimen chemotherapy
treatment in osteosarcoma patients: A network meta-analysis of
randomized controlled trials. J Orthop Surg Res. 12:522017.
View Article : Google Scholar : PubMed/NCBI
|
|
6
|
Hattinger CM, Pasello M, Ferrari S, Picci
P and Serra M: Emerging drugs for high-grade osteosarcoma. Expert
Opin Emerg Drugs. 15:615–634. 2010. View Article : Google Scholar : PubMed/NCBI
|
|
7
|
Chou AJ and Gorlick R: Chemotherapy
resistance in osteosarcoma: Current challenges and future
directions. Expert Rev Anticancer Ther. 6:1075–1085. 2016.
View Article : Google Scholar
|
|
8
|
Ottaviani G and Jaffe N: The epidemiology
of osteosarcoma. Cancer Treat Res. 152:3–13. 2009. View Article : Google Scholar : PubMed/NCBI
|
|
9
|
Brasseur K, Gévry N and Asselin E:
Chemoresistance and targeted therapies in ovarian and endometrial
cancers. Oncotarget. 8:4008–4042. 2017. View Article : Google Scholar : PubMed/NCBI
|
|
10
|
Lu C and Shervington A: Chemoresistance in
gliomas. Mol Cell Biochem. 312:71–80. 2008. View Article : Google Scholar : PubMed/NCBI
|
|
11
|
Yang JZ, Ma SR, Rong XL, Zhu MJ, Ji QY,
Meng LJ, Gao YY, Yang YD and Wang Y: Characterization of
multidrug-resistant osteosarcoma sublines and the molecular
mechanisms of resistance. Mol Med Rep. 14:3269–3276. 2016.
View Article : Google Scholar : PubMed/NCBI
|
|
12
|
Felciano RM, Bavari S, Richards DR,
Billaud JN, Warren T, Panchal R and Krämer A: Predictive systems
biology approach to broad-spectrum, host-directed drug target
discovery in infectious diseases. Pac Symp Biocomput. 17–28.
2013.PubMed/NCBI
|
|
13
|
Calvano SE, Xiao W, Richards DR, Felciano
RM, Baker HV, Cho RJ, Chen RO, Brownstein BH, Cobb JP, Tschoeke SK,
et al: A network-based analysis of systemic inflammation in humans.
Nature. 437:1032–1037. 2013. View Article : Google Scholar
|
|
14
|
Livak KJ and Schmittgen TD: Analysis of
relative gene expression data using real-time quantitative PCR and
the 2(-Delta Delta C(T)) method. Methods. 25:402–408. 2001.
View Article : Google Scholar : PubMed/NCBI
|
|
15
|
Wang Z, Xia Q, Cui J, Diao Y and Li J:
Reversion of P-glycoprotein-mediated multidrug resistance by
diallyl trisulfide in a human osteosarcoma cell line. Oncol Rep.
31:2720–2726. 2014. View Article : Google Scholar : PubMed/NCBI
|
|
16
|
Tahara T, Arisawa T, Shibata T, Hirata I
and Nakano H: Multi-drug resistance 1 polymorphism is associated
with reduced risk of gastric cancer in the Japanese population. J
Gastroenterol Hepatol. 22:1678–1682. 2007. View Article : Google Scholar : PubMed/NCBI
|
|
17
|
Zhou R, Huang W, Yao Y, Wang Y, Li Z, Shao
B, Zhong J, Tang M, Liang S, Zhao X, et al: CA II, a potential
biomarker by proteomic analysis, exerts significant inhibitory
effect on the growth of colorectal cancer cells. Int J Oncol.
43:611–621. 2013. View Article : Google Scholar : PubMed/NCBI
|
|
18
|
Faye MD, Beug ST, Graber TE, Earl N, Xiang
X, Wild B, Langlois S, Michaud J, Cowan KN, Korneluk RG and Holcik
M: IGF2BP1 controls cell death and drug resistance in
rhabdomyosarcomas by regulating translation of cIAP1. Oncogene.
34:1532–1541. 2015. View Article : Google Scholar : PubMed/NCBI
|
|
19
|
Xie XQ, Zhao QH, Wang H and Gu KS:
Dysregulation of mRNA profile in cisplatin-resistant gastric cancer
cell line SGC7901. World J Gastroentero. 23:1189–1202. 2017.
View Article : Google Scholar
|
|
20
|
Chiang YC, Lin HW, Chang CF, Chang MC, Fu
CF, Chen TC, Hsieh SF, Chen CA and Cheng WF: Overexpression of
CHI3L1 is associated with chemoresistance and poor outcome of
epithelial ovarian carcinoma. Oncotarget. 6:39740–39755. 2015.
View Article : Google Scholar : PubMed/NCBI
|
|
21
|
Januchowski R, Świerczewska M, Sterzyńska
K, Wojtowicz K, Nowicki M and Zabel M: Increased expression of
several collagen genes is associated with drug resistance in
ovarian cancer cell lines. J Cancer. 7:1295–1310. 2016. View Article : Google Scholar : PubMed/NCBI
|
|
22
|
Yuan J, Yin Z, Tao K, Wang G and Gao J:
Function of insulin-like growth factor 1 receptor in cancer
resistance to chemotherapy. Oncol Lett. 15:41–47. 2018.PubMed/NCBI
|
|
23
|
Spaargaren M, Beuling EA, Rurup ML, Meijer
HP, Klok MD, Middendorp S, Hendriks RW and Pals ST: The B cell
antigen receptor controls integrin activity through Btk and
PLCgamma2. J Exp Med. 198:1539–1550. 2003. View Article : Google Scholar : PubMed/NCBI
|
|
24
|
Liu W, Barnette AR, Andreansky S and
Landgraf R: ERBB2 overexpression establishes ERBB3-dependent
hypersensitivity of breast cancer cells to withaferin A. Mol Cancer
Ther. 15:2750–2757. 2016. View Article : Google Scholar : PubMed/NCBI
|
|
25
|
Ekstrand AJ, James CD, Cavenee WK, Seliger
B, Pettersson RF and Collins VP: Genes for epidermal growth factor
receptor, transforming growth factor, and epidermal growth factor
and their expression in human gliomas in vivo. Cancer Res.
51:2164–2172. 1991.PubMed/NCBI
|
|
26
|
Suh KJ, Sung JH, Kim JW, Han SH, Lee HS,
Min A, Kang MH, Kim JE, Kim JW, Kim SH, et al: EGFR or HER2
inhibition modulates the tumor microenvironment by suppression of
PD-L1 and cytokines release. Oncotarget. 8:63901–63910. 2017.
View Article : Google Scholar : PubMed/NCBI
|