Introduction
The incidence of pelvic organ prolapse (POP) has
increased during the last few years (1). This condition notably affects the
quality of life of many females worldwide; however, at present,
several studies have reported the lack of effective preventative
methods for patients with high risk factors of POP (2), and deficiencies in strategies to
suppress the development of POP (1–8).
Previous studies have notably focused on the clinical diagnosis and
treatment of POP, and the mechanism of action associated the
extracellular matrix (ECM) (9–13).
Few studies have investigated the proliferation and activity of
fibroblasts, which are associated with the synthesis and secretion
of procollagen (14).
Mfn2 serves an important role in signal
transduction, the prevention of sustained extensive mitochondrial
elongation, the activation of cellular senescence and the induction
of apoptosis (15–18). It is important to note that Mfn2
controls cell metabolism by limiting the production of reactive
oxygen species and by modulating the endoplasmic reticulum stress
(15). Thus, the mitochondrial
fusion protein mitofusin 2 (Mfn2) is a cellular hub that senses the
metabolic and hormonal milieu, and drives the control of metabolic
homeostasis (15). Abnormal
expression of Mfn2 can cause adverse effects. Previous studies have
reported that Mfn2 is associated with lung diseases (18,19)
and the incidence of cancer (19).
A limited number of studies have focused on pelvic floor diseases.
POP is a common disease in the elderly population, which is
associated with the damage and aging of the pelvic floor support
structure (1,20). Furthermore, Mfn2 is associated with
aging (17). Our previous study
(21) demonstrated a correlation
between Mfn2 expression levels and POP in vivo. Fibroblasts
were isolated from uterosacral ligaments using laser capture
microdissection. The results indicated that the expression levels
of Mfn2 in patients with POP increased and the expression levels of
the procollagen protein decreased compared with those of non-pelvic
organ prolapse (NPOP) samples (21). The successive study of our group
(22) demonstrated in vitro
that the proliferation of primary cultured fibroblasts and the
expression levels of procollagen protein had decreased, while the
expression levels of Mfn2 were increased in POP uterosacral
ligaments compared with NPOP samples. Following the inhibition of
Mfn2 expression, the levels of procollagen protein were increased.
Based on these previous findings, we further examined alterations
in the cellular proliferation of fibroblasts, their progression
through the various stages of the cell cycle and the expression
levels of procollagen proteins following upregulation of Mfn2. The
present study aimed to determine the possible mechanism underlying
the pathogenesis of POP.
Materials and methods
Study subjects
Uterosacral ligaments were collected from 10 POP and
10 NPOP cases during hysterectomy in the Peking University First
Hospital from September 2016 to December 2016. After hysterectomy,
fresh uterosacral ligament tissues were cut into pieces with a
diameter <0.1 cm, these tissues pieces were cultured in
Dulbecco's Modified Eagle's medium Nutrient Mixture F-12 (Ham)
(DMEM/F12; Gibco; Thermo Fisher Scientific) containing 20% FBS
(Gibco; Thermo Fisher Scientific) and 1% antibiotic solution in an
incubator at 37°C containing 5% CO2. Primary culture was
conducted until 2–4 colonies were formed, which were used for
transfection. The POP group comprised stage III to IV cases
(according to the POP-Q score) (23). The NPOP group was matched with
patients who required hysterectomy due to benign gynecological
diseases, including hysteromyoma and adenomyosis, according to age
(years; POP, 55.60±11.33 and NPOP, 50.70±7.90), body mass index
(POP, 23.57±3.33 and NPOP, 23.03±2.91), parity (POP, 1.40±0.70 and
NPOP, 1.20±0.42) and postmenopausal duration (years; POP, 5.75±9.59
and NPOP, 1.90±6.01) (n=10, P>0.05, all). All patients exhibited
no history of urinary tract infection, estrogen drugs, vaginal
surgery and/or diseases that could affect the metabolism of
collagen during the 3 month period prior to the study. The clinical
data of patients is presented in Table
I. Samples were collected after informed consent from patients
was obtained. The present study was approved by the ethics
committee of Peking University First Hospital [approval no. 2016
(1173)].
 | Table I.Comparison of clinical data between
POP and NPOP patients. |
Table I.
Comparison of clinical data between
POP and NPOP patients.
| Parameters (mean ±
standard error of the mean) | NPOP (n=10) | POP (n=10) | t-value | P-value |
|---|
| Age (year) | 50.70±7.90 | 55.60±11.33 | 1.122 | 0.277 |
| BMI
(kg/m2) | 23.03±2.91 | 23.57±3.33 | 0.348 | 0.732 |
| Age of first delivery
(years) | 27.14±3.80 | 24.75±3.45 | 1.277 | 0.224 |
| Parity (n) | 1.20±0.42 | 1.40±0.70 | 0.775 | 0.449 |
| Postmenopausal
duration (years) | 1.90±6.01 | 5.75±9.59 | 1.043 | 0.312 |
Main reagents and instruments
Anti-extracellular-signal regulated kinase 1/2
(ERK1/2; diluted 1/200, sc-135900), anti-phosphorylated (p)ERK1/2
(diluted 1/200, sc-377400), anti-Raf-1 (diluted 1/200, sc-52827),
anti-pRaf-1 (diluted 1/200, sc-293351), anti-p21waf1 (diluted
1/200, sc-90110), anti-cyclin dependent kinase 2 (CDK2; diluted
1/200, sc-136191), anti-procollagen 1A1/1A2/3A1 (diluted 1/200,
sc-133179, sc-166572, sc-16333, respectively) were purchased from
Santa Cruz Biotechnology, Inc. Anti-β-tubulin monoclonal antibody
(diluted 1/1,000, TA347064) and anti-β-actin monoclonal antibody
(diluted 1/1,000, TA-09) were obtained from ZSGB-BIO. Anti-Mfn2
monoclonal antibody (diluted 1/500, ab56889) was obtained from
Abcam. The cell cycle detection kit, myllicin mixture (KGY0023),
Pancreatin (KGY001) and Pancreatin-EDTA (KGY0012) were obtained
from Nanjing KeyGen Biotech Co., Ltd. The cell counting kit-8
(CCK-8) was purchased from Dojindo Molecular Technologies, Inc.
DMSO was obtained from AppliChem GmbH; Enhanced Chemiluminescent
Reagent was purchased from GE Healthcare Life Sciences. Fetal
bovine serum (cat. no. 10099-141) was purchased from Gibco (Thermo
Fisher Scientific, Inc.). The mouse anti-human cytokeratin
monoclonal (CK-19), horseradish peroxidase-labeled goat anti-mouse
IgG (ZB-2305) antibodies and peroxidase-conjugated goat anti-rabbit
IgG (ZB-2301) were purchased from OriGene Technologies, Inc.
Lentiviral vectors
Mfn2-overexpressing and RNA interference (RNAi)
lentiviral vectors were provided by Shanghai GeneChem Co., Ltd. The
lentiviral vectors employed for Mfn2 overexpression and
downregulation were Ubi-MCS-3FLAG-SV40-enhanced green fluorescent
protein (EGFP) and U6-MCS-Ubi-EGFP, respectively. The RNAi
sequences for Mfn2 and the negative control sample were
ACTTTGTCACTGCCAAGAA and GTTCTCCGAACGTGTCACGT, respectively.
Primary cell culture, subculture,
cryopreservation and resuscitation
Uterosacral ligament tissues were harvested during
hysterectomy. The tissue fragments possessed dimensions of
0.5×0.5×0.5 cm3. The fibroblasts could be observed under
a light microscope (magnification, ×4) after 1–2 weeks of primary
culture. The cells were collected for subculture (passage 2–4)
and/or long term storage at −80°C when the confluence of the cell
culture was ~70-80%. The procedure was conducted in a biosafety
cabinet. For resuscitation, frozen cells were removed from −80°C
and warmed rapidly in water at 37°C. The contents of the tube was
added to 10X volume of culture medium and centrifuged at 300 × g
for 5 min. The cell pellet was resuspended in medium (containing
20% FBS and 1% antibiotics) and placed in an incubator at 37°C.
Cell groups
Fibroblasts in the NPOP group were used for the
Mfn2-overexpression experiments. The cells were divided into three
groups as follows: Mfn2+ group, comprising NPOP fibroblasts
transduced with lentiviral vector containing the open reading frame
of Mfn2; Mfn2- group, NPOP fibroblasts were transduced with an
empty lentiviral vector and the control group, comprising
non-transduced NPOP fibroblasts. Concomitantly, POP fibroblasts
were used for Mfn2 knockdown experiments according to the following
three groups: Short hairpin RNA group (sh-Mfn2 group), comprising
POP fibroblasts transduced with lentiviral vector containing the
shRNA interference sequence; short hairpin RNA negative control
(sh-Mfn2-NC) group that included POP fibroblasts transduced with
lentiviral vector containing a shRNA negative control (NC) sequence
and the control group, comprising non-transduced POP
fibroblasts.
Transduction
Prior to infection, the cells in the logarithmic
growth phase that were grown in the presence of antibiotic-free
medium were prepared into a cell suspension at a concentration of
2–3×10⁴ cells/ml with pancreatin-EDTA. The cell
suspension was added to each well and cultured at 37°C, in the
presence of 5% CO2. Adherent cells that attained 20–30%
confluence were observed under an inverted microscope at a
magnification of ×4 (5 fields per view) the following day. The
virus was incubated with the cells in 10% FBS + DMEM/F12 in the
absence of antibiotics. The ratio of lentiviral particles to the
number of cells (multiplicity of infection) was 20:1. The final
concentration of the viral particles was 5 g/ml and Polybrene was
employed for transduction. During viral transfection, the cells
were washed two times with PBS and 10–12 h later, the complete
culture medium was used to replace the medium containing the virus.
The expression of GFP was observed under fluorescence microscope
(magnification, ×40; 5 fields per view) following 96 h of
incubation.
Detection of fibroblast proliferation
by a CCK-8 assay
A CCK-8 assay was conducted to detect cell
proliferation in each group 96 h following transduction with the
lentivirus. The steps were as follows: The cell suspension was
diluted to the specific cell densities, including 8×10⁴,
4×10⁴, 2×10⁴ and 1×10⁴ cells/ml,
and the cells were incubated in a 96-well plate at a volume of 100
µl/well at 37°C. Medium was added to the edge of wells. A total of
100 µl of CCK-8 containing medium (10% FBS: CCK-8=9:1) was added 24
h later. Following 2 h of incubation at 37°C, the absorbance was
measured with a microplate reader at the wavelength of 450 nm (OD).
Similarly, a standard curve was generated using the number of cells
as the abscissa (X axis) and the OD value for the vertical axis (Y
axis). A new 96-well plate was used every day and measurements were
recorded on days 1, 3, 5, 7, 9 and 11. The cell proliferation
curves were plotted according to the data obtained from these six
time points.
Cell cycle analysis
The cells were collected using 0.25% no-EDTA trypsin
for 1–2 min at 37°C following 96 h of viral infection and
subsequently washed with PBS. The samples were centrifuged at 300 ×
g at room temperature for 5 min and the supernatant was discarded.
The cells were fixed at 4°C for 4 h using 75% ethanol, centrifuged
at 500 × g for 5 min at room temperature and incubated with 100 µl
RNase A (100 µg/ml) in a 37°C water bath for 30 min in the presence
of ethidium bromide (Sigma-Aldrich; Merck KGaA). Flow cytometry
(FCM) was performed within 1 h with a flow cytometer. Each group
analysis was repeated three times and the mean value was obtained.
The results were analyzed with ModFit LT 4.1 software (Verity
Software House, Inc.).
Protein expression assays (Mfn2,
procollagen, pERK1/2, pRaf-1, p21waf1, CDK2)
The relative expression of proteins was obtained by
western blotting following protein extraction using RIPA Lysis
Buffer [RIPA (Beyotime Institute of Biotechnology): PMSF (Beyotime
Institute of Biotechnology): Phosphatase Inhibitor cocktail I
(MedChemExpress LLC): Phosphatase Inhibitor cocktail II
(MedChemExpress LLC) at a ratio of 100:1:1:1] from 106
cells. The bicinchoninic acid method was used to determine protein
concentration. The proteins (15 µg/lane) were separated by
electrophoresis using a 10% SDS-PAGE gel and transferred to a PVDF
membrane. The membrane was blocked with 5% milk in TBS-Tween-20 and
incubated with primary antibodies for the proteins Mfn2,
procollagen 1A1/1A2/3A1, pRaf-1, pERK1/2, p21waf1, CDK2 and β-actin
overnight at 4°C. The following morning, the membrane was washed
three times with TBS-T and incubated with a secondary goat anti
mouse IgG antibody conjugated with horseradish peroxidase (diluted
1:5,000) at room temperature for 1 h. Membranes were washed three
times and ECL was used for visualization. Experiments were repeated
three times. Image J for Mac (1.47d; National Institutes of Health)
was used to scan the specific bands for each protein and the ratio
of the target protein bands to the β-actin bands was
calculated.
Statistical analysis
Experiments were repeated three times and the
results were expressed as the mean ± standard deviation. SPSS 23
(IBM, Corp.) was used for analysis. Independent samples t-test and
general linear model-univariate analysis and/or one way ANOVA were
used for comparison between different groups when the data followed
normal distributions. Bonferroni correction was used when the
variance was equal and Dunnett's T3 post hoc test was used if the
variance was not equal. For non-normal distributions, between group
comparisons were assessed using Wilcoxon and/or Kruskal-Wallis
tests, and the rank sum statistic χ2 was used. P<0.05
was considered to indicate a statistically significant
difference.
Results
Inhibitory effects of Mfn2 on
fibroblast proliferation
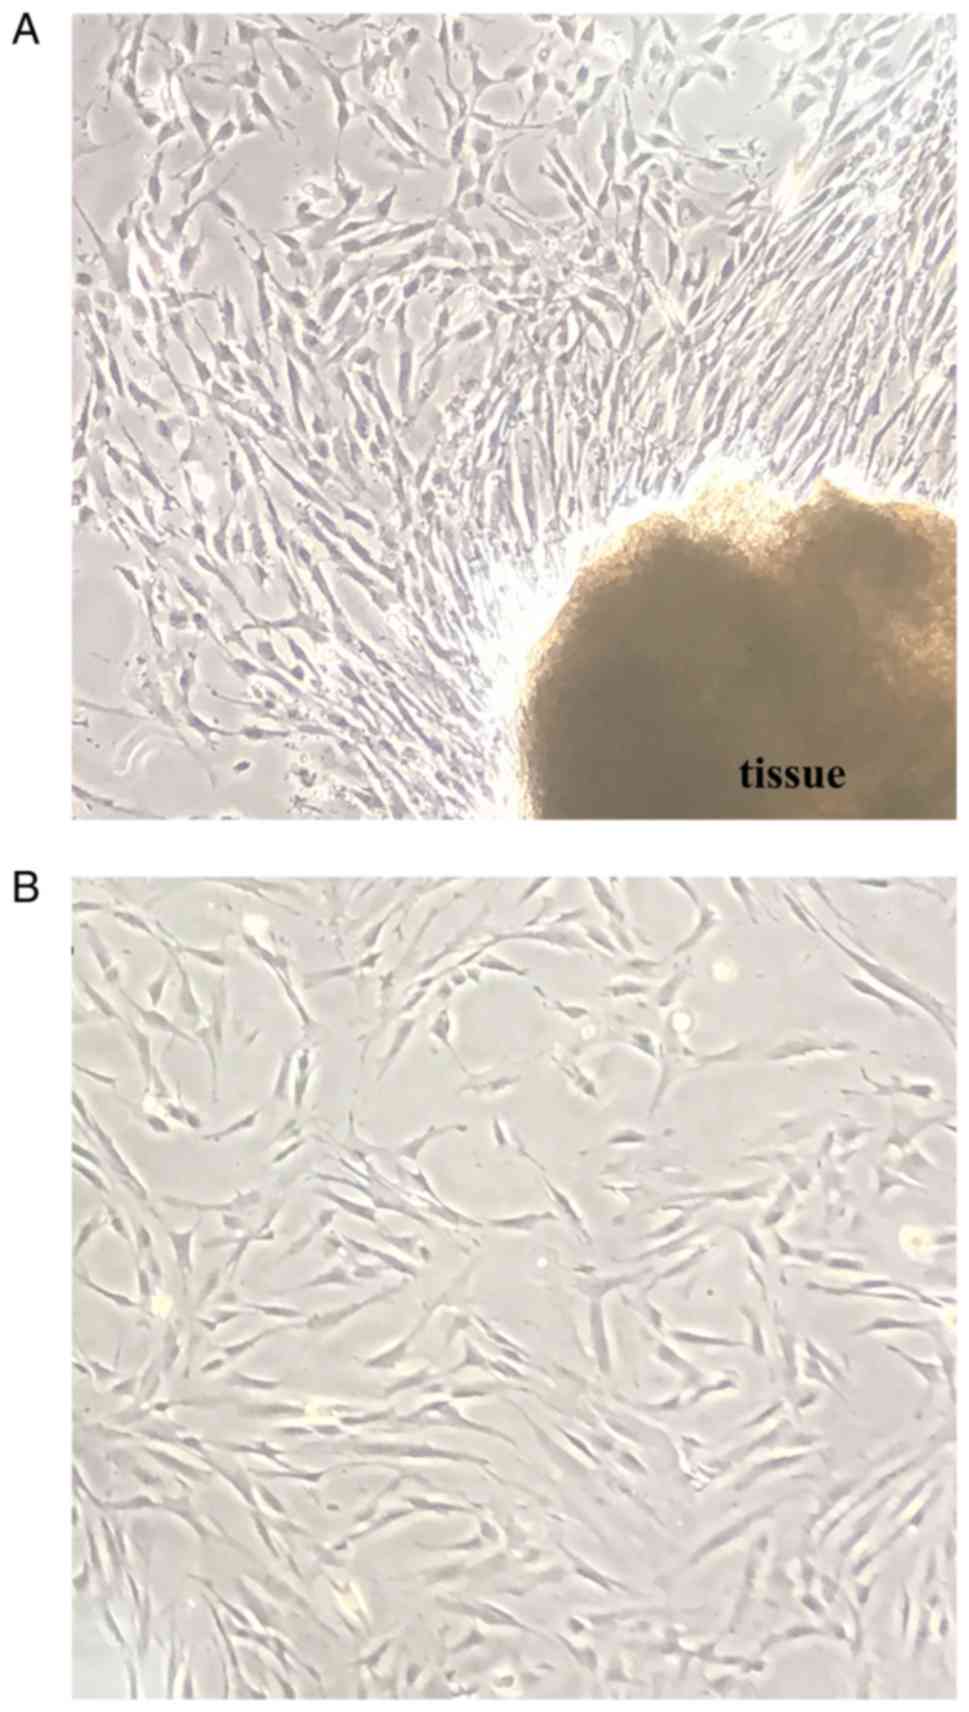
The primary fibroblasts observed via light
microscopy were presented in Fig.
1. The data verified the identification of the fibroblasts as
reported in our previous study (22). Following 11 days of the initial
cell seeding, the cell activity was significantly reduced in the
Mfn2-overexpressing model compared with that of the control and the
Mfn2- groups. The absorbance of the Mfn2+, Mfn2- and control
groups, respectively on day 1 were determined to be 0.138±0.003,
0.147±0.002 and 0.144±0.003, respectively. Similarly, the
corresponding cell proliferative activities were analyzed for the
remaining time periods and were as follows: Day 3, 0.206±0.003;
0.211±0.003 and 0.210±0.004; day 5, 0.251±0.003; 0.372±0.004 and
0.425±0.004; day 7, 0.347±0.004; 0.767±0.003 and 0.832±0.004; day
9, 0.513±0.004; 1.406 ±0.003 and 1.353±0.005 and day 11,
0.606±0.004; 1.696 ±0.005 and 1.781±0.005 for the respective Mfn2+,
Mfn2- and control groups. No significant differences were noted
between the two control groups (P>0.05). From days 5–11, the
proliferation of Mfn2+ fibroblasts was significantly reduced
compared with the control groups (Fig.
2; P<0.001).
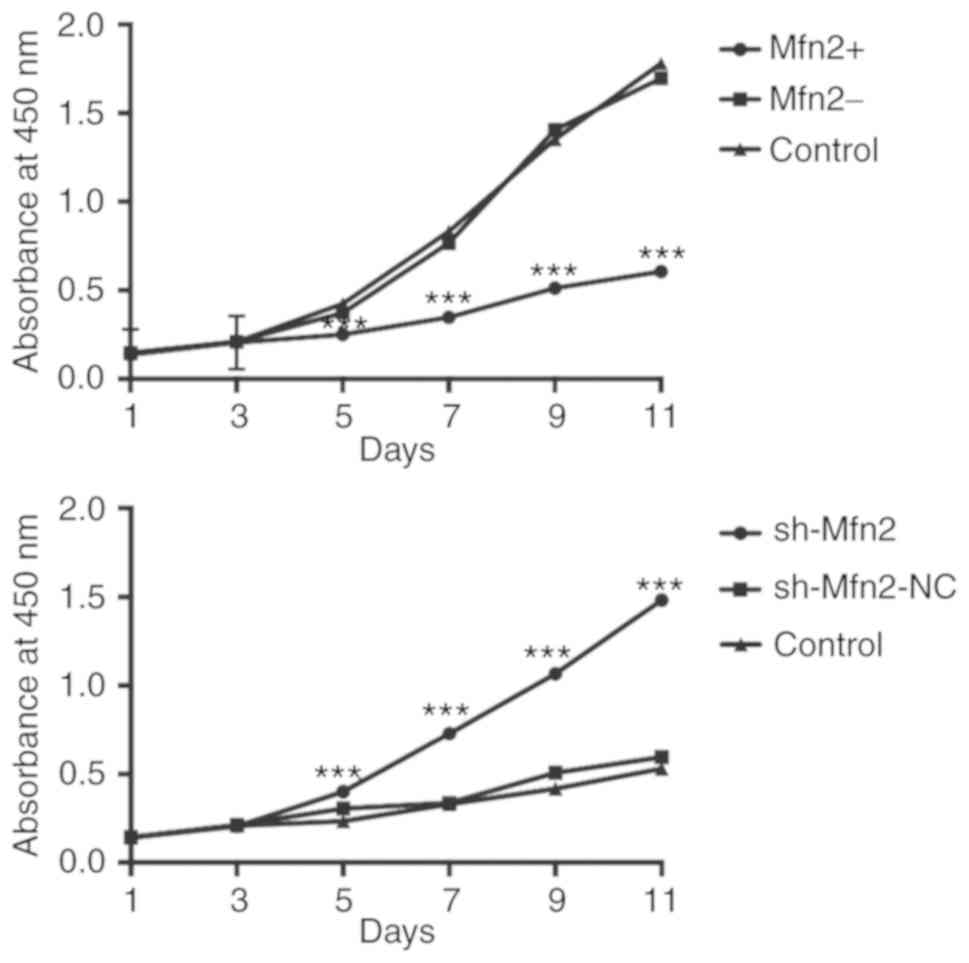 | Figure 2.Fibroblast proliferation as examined
by a Cell Counting Kit-8 assay. In Mfn2-overexpressing cells, cell
activity was significantly reduced compared with the control and
Mfn2- groups (n=10, ***P<0.001 vs. control and Mfn2-). In the
Mfn2-inhibition group, the activity of sh-Mfn2 fibroblasts was
significantly increased compared with that of the sh-Mfn2-NC and
the control groups (n=10, ***P<0.001 vs. control and
sh-Mfn2-NC). A t-test and repeated measurement data analysis of
variance were used to determine statistical significance compared
with the control groups. The experiments were repeated for three
times, indicating consistent results. GFP, green fluorescent
protein; Mfn2, mitofusin 2; NC, negative control; NPOP, non-pelvic
organ prolapse; sh, short hairpin RNA; control, non-transduced NPOP
cells (top panel), non-transfected POP cells (bottom panel); Mfn2+,
NPOP cells infected with LV-Mfn2-GFP; Mfn2-, NPOP cells transfected
with LV-GFP; sh-Mfn2, POP cells transfected with LV-sh-Mfn2-GFP;
sh-Mfn2-NC, POP cells transfected with LV-sh-Mfn2-NC-GFP. |
The activity of the sh-Mfn2 group fibroblasts was
significantly increased in the sh-Mfn2 cells compared with that of
the sh-Mfn2-NC and control groups (P<0.001, from days 5–11). The
absorbance of the sh-Mfn2, sh-Mfn2-NC and control groups,
respectively at the different time periods were as follows: Day 1,
0.142±0.003, 0.144±0.003 and 0.142±0.002; day 3, 0.206±0.004,
0.212±0.004 and 0.210±0.004; day 5, 0.401±0.004, 0.305±0.021 and
0.234±0.004; day 7, 0.729±0.004, 0.338±0.004 and 0.331±0.004; day
9, 1.067±0.004, 0.508±0.003 and 0.418±0.004, and day 11,
1.483±0.005, 0.596±0.004 and 0.530±0.004 for the respective
sh-Mfn2, sh-Mfn-NC and control groups. The proliferation of sh-Mfn2
fibroblast significantly increased from days 5–11 (P<0.001);
however, no significant difference was observed between the two
control groups (P>0.05) (Fig.
2).
Inhibitory effects of Mfn2 on
fibroblast cell cycle
The ratio of the percentage of fibroblasts at the
G0/G1 phase in the Mfn2+ group (74.939±0.562%) was markedly
increased compared with that of the Mfn2- (36.526±0.549%) and the
control groups (44.159±0.461%; n=10). Compared with the population
of the cells in the G1 phase, the proportion of cells in the S and
G2/M phases in the Mfn2+ group was markedly lower compared with
that of the control group. No differences were noted between the
two control groups (Fig. 3A).
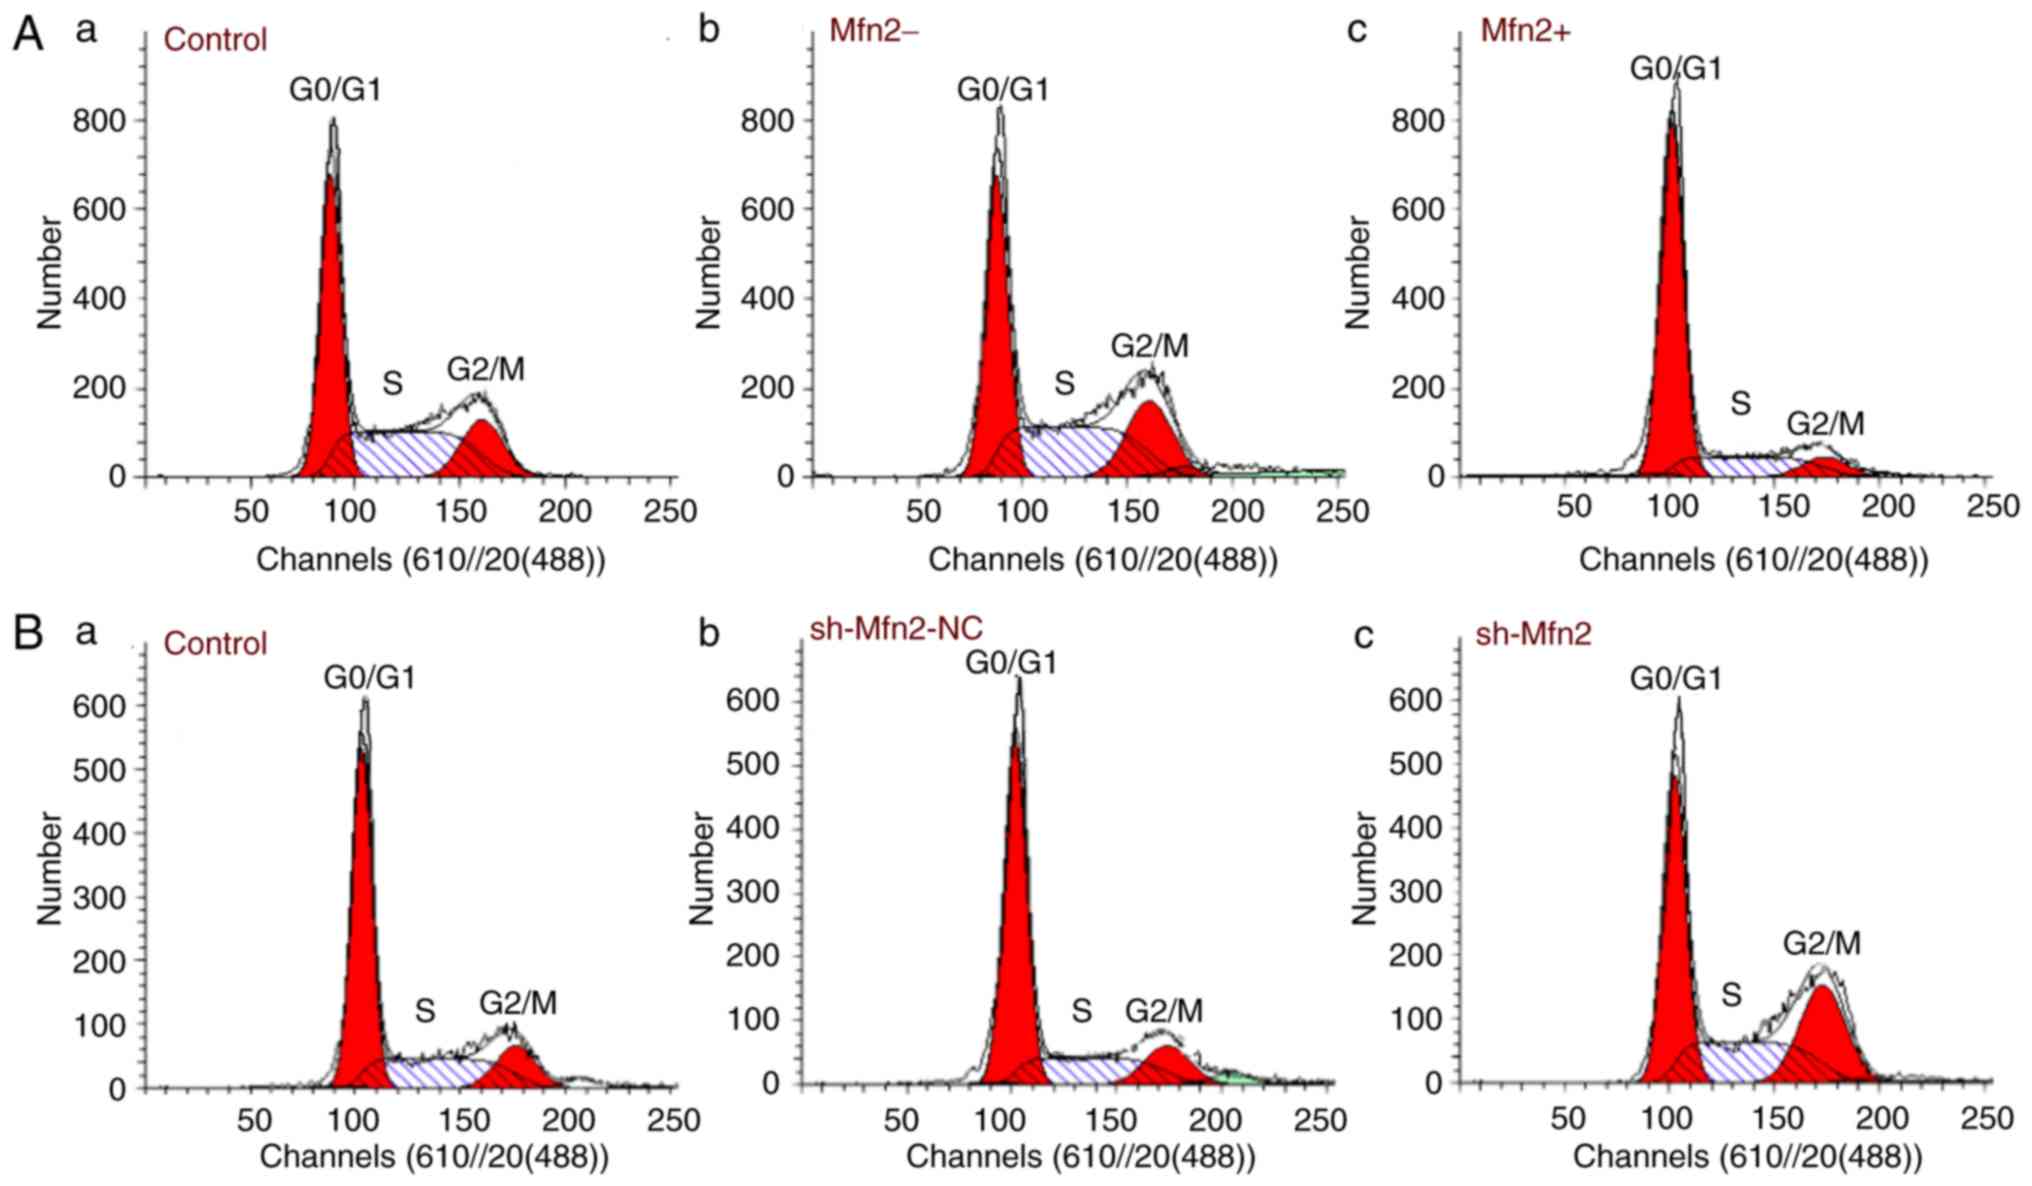 | Figure 3.Cell cycle distribution following
lentiviral transduction as detected by flow cytometry. (A)
Significant differences in S and G2/M phases were noted between the
Mfn2+ and the control groups. n=10 (P<0.05). (B) The proportion
of cells in the S and G2/M phases of the sh-Mfn2 group was
significantly higher than the control groups n=10. (P<0.05). A
t-test was used to determine statistical significance. The
experiments were repeated three times. Data are presented as the
mean ± standard error of the mean. GFP, green fluorescent protein;
Mfn2, mitofusin 2; NPOP, non-pelvic organ prolapse; sh, short
hairpin RNA; control, non-transduced NPOP cells (top panel, A-a),
non-transduced POP cells (bottom panel, B-a); Mfn2+, NPOP cells
infected with LV-Mfn2-GFP (A-c); Mfn2-, NPOP cells transduced with
LV-GFP(A-b); sh-Mfn2, POP cells transduced with
LV-sh-Mfn2-GFP(B-c); sh-Mfn2-NC, POP cells transduced with
LV-sh-Mfn2- negative control - GFP (B-b). |
In the Mfn2 knockdown group, the number of cells in
the G0/G1 phase was markedly lower (41.469±0.797%) compared with
the sh-Mfn2-NC (61.606±0.711%) and the control groups
(57.649±0.795%). By contrast, the proportion of the cells in S and
G2/M phases of the sh-Mfn2 group was markedly higher than that of
the control group. The cell percentages of the two control groups
indicated no difference (Fig.
3).
Relative expression of Mfn2 and
procollagen proteins
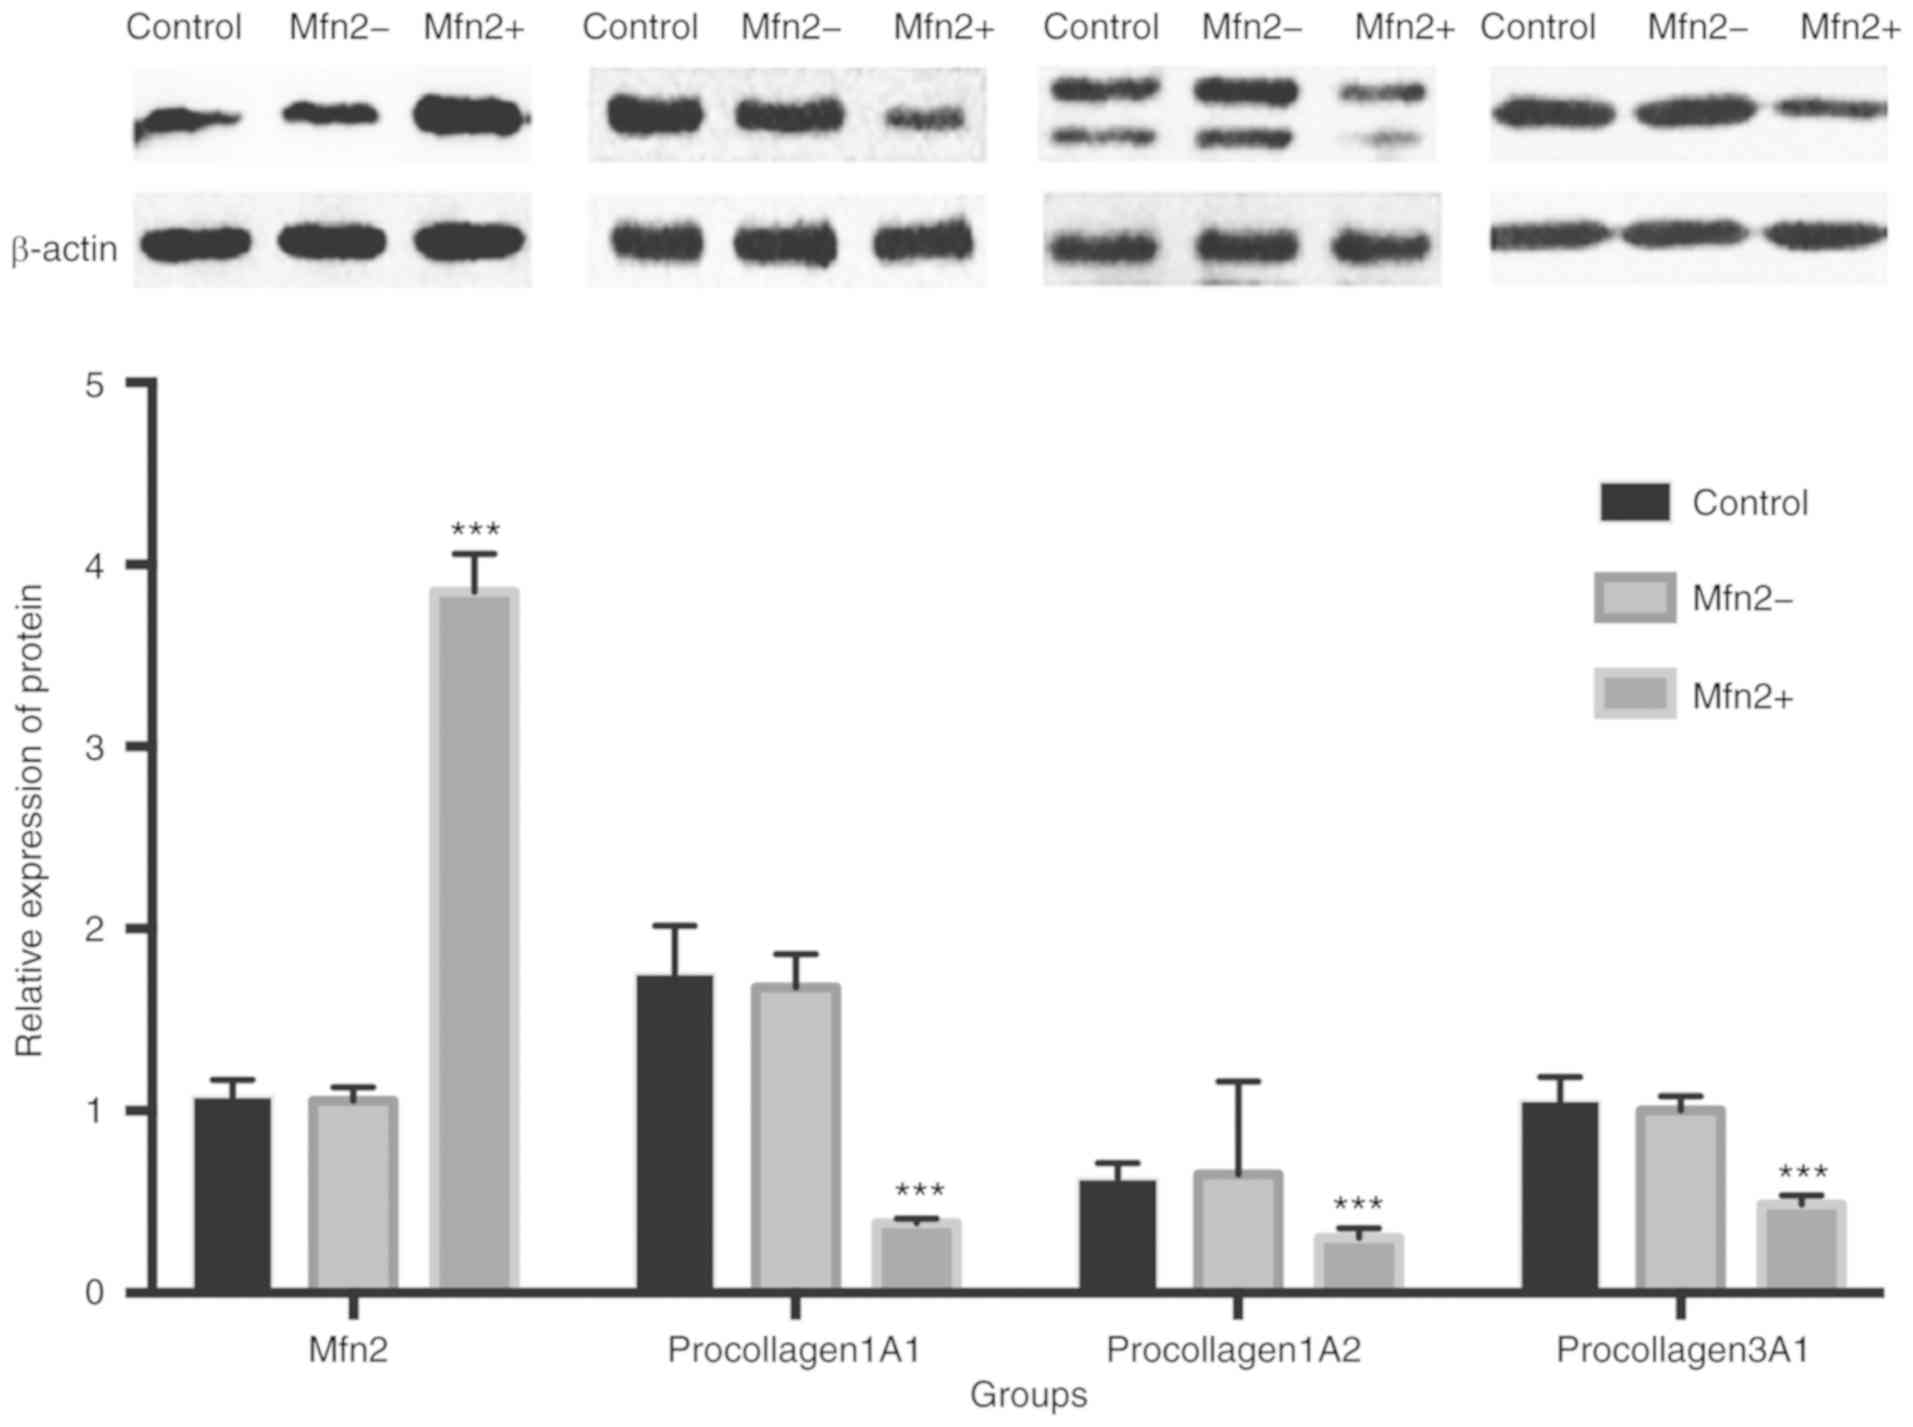
The relative expression of each protein was detected
by western blot analysis. The expression of the proteins following
the knockdown of Mfn2 in POP fibroblasts has been demonstrated in
our previous study (21). In NPOP
fibroblasts infected with lentivirus for the overexpression of
Mfn2, the relative expression of Mfn2 was 3.850±0.038 (F=4029.096),
which was significantly increased compared with the control
(1.081±0.016) and Mfn2- (1.056±0.014) groups (P<0.001). No
significant difference was noted between the two control groups
(P>0.05). In addition, the relative expression levels of
procollagen 1A1/1A2/3A1 in the Mfn2+ group (0.384±0.005,
0.303±0.010, 0.486±0.009, respectively) were significantly
decreased compared with those in the Mfn2- (1.676±0.034,
0.652±0.009, 1.003±0.014, respectively) and the control groups
(1.755±0.048, 0.630±0.015, 1.059±0.023, respectively) (P<0.001).
No significant difference was noted between the two control groups
(P>0.05) (Fig. 4).
Phosphorylation of ERK1/2 and Raf-1
proteins following Mfn2 overexpression
Following 96 h of lentiviral transfection, total
cellular protein was extracted from fibroblasts. The expression
levels of total and phosphorylated levels of ERK1/2 and Raf-1
proteins were detected by western blot analysis (Fig. 5). The levels of total ERK1/2
protein expression were notably similar in the Mfn2+, Mfn2- and
control groups (1656.461±88.422, 1642.728±61.549, 1674.064±44.134,
respectively). However, the levels of pERK1/2 proteins in the Mfn2+
group (0.120±0.014) were markedly decreased compared with the Mfn2-
(0.38±0.027) and control groups (0.353±0.021). The expression
profile of total Raf-1 expression was similar to that of ERK.
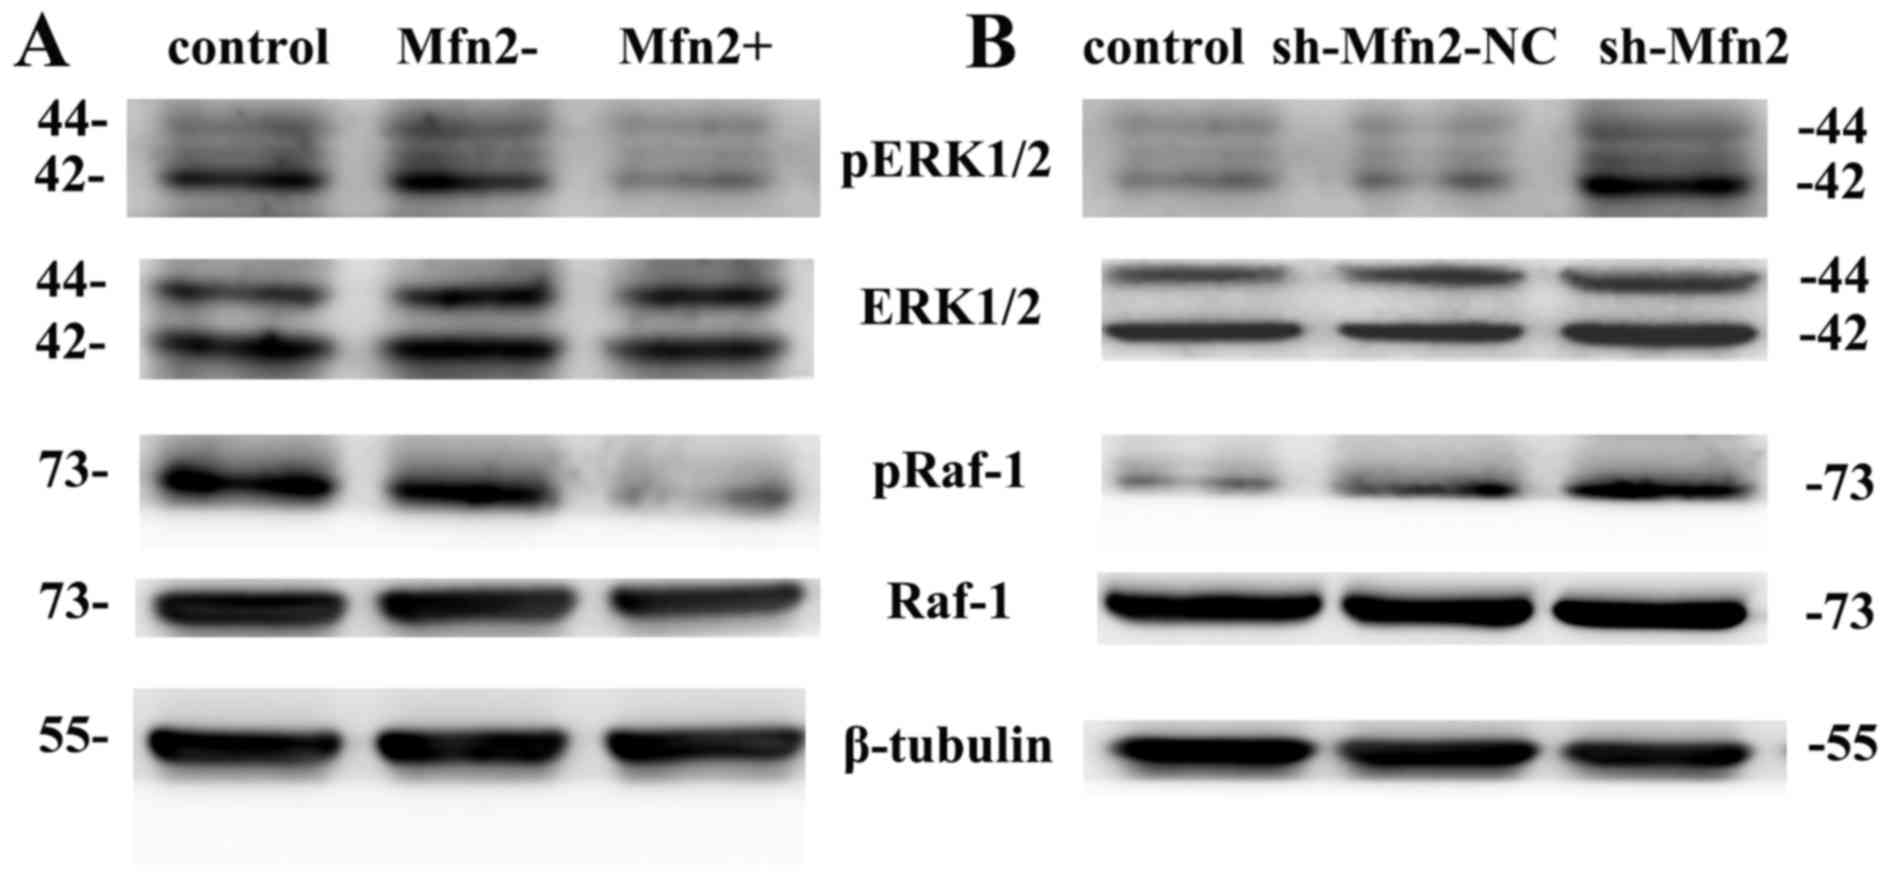 | Figure 5.Expression levels of pERK1/2 and
pRaf-1 proteins following lentiviral transfection of fibroblasts.
(A) The expression levels of pERK1/2 and pRaf-1 proteins in the
Mfn2+ group were significantly lower than in the Mfn2- and control
groups. (B) The phosphorylation levels of ERK1/2 and Raf-1 proteins
in the sh-Mfn2 group were markedly higher than in the sh-Mfn2-NC
and control groups. ERK1/2, extracellular signal-regulated
kinase1/2; GFP, green fluorescent protein; Mfn2, mitofusin 2; NC,
negative control; NPOP, non-pelvic organ prolapse; p,
phosphorylated; sh, short hairpin RNA; control, non-transduced NPOP
cells, non-transduced POP cells; Mfn2+, NPOP cells infected with
LV-Mfn2-GFP; Mfn2-, NPOP cells transduced with LV-GFP; sh-Mfn2, POP
cells transduced with LV-sh-Mfn2-GFP; sh-Mfn2-NC, POP cells
transduced with LV-sh-Mfn2-NC-GFP. |
Following the inhibition of Mfn2 expression in POP
fibroblasts, the expression levels of total ERK1/2 protein in the
sh-Mfn2, sh-Mfn2-NC and control groups markedly varied
(1491.477±37.892, 1491.639±49.668, 1482.802±34.900, respectively,
P>0.05). The levels of pERK1/2 in the sh-Mfn2 group
(0.805±0.027) were significantly increased compared with the
sh-Mfn2-NC (0.3305±0.001) and the control groups (0.5123±0.036)
(P<0.05). The trend in expression of total Raf and pRaf was
similar to that of ERK1/2 and pERK1/2, respectively (Fig. 5B).
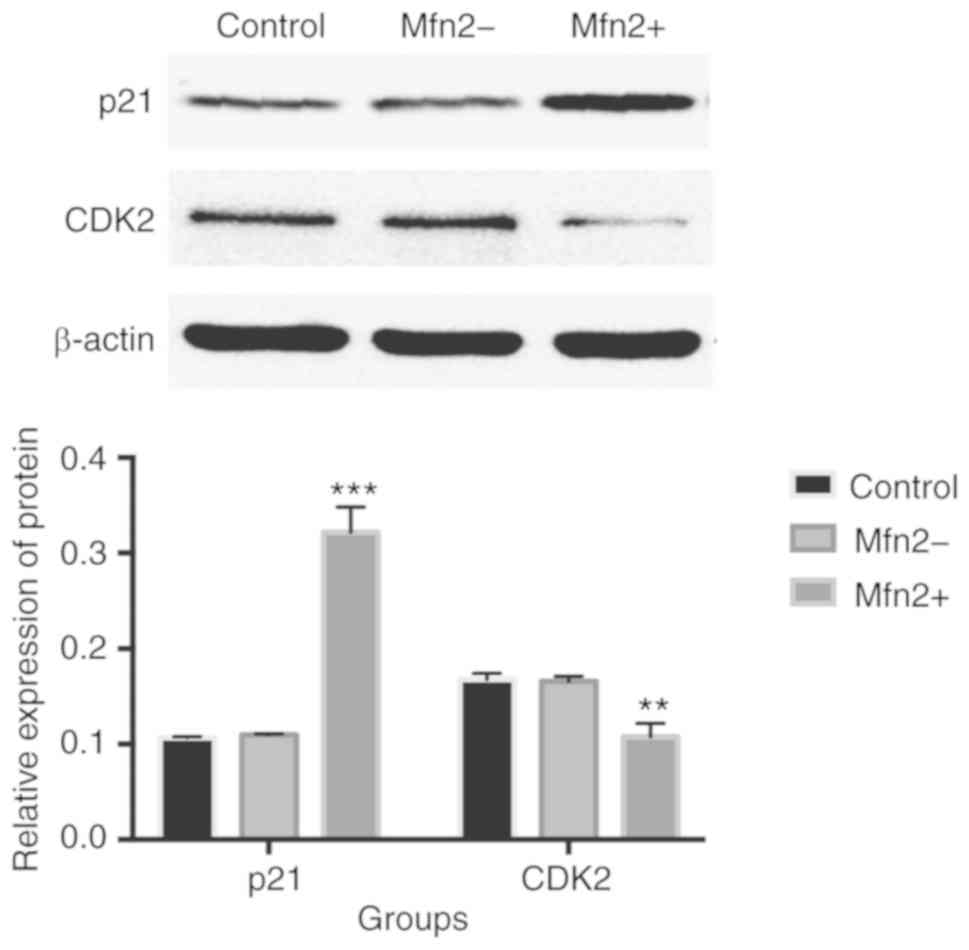
Inhibitory effects of Mfn2 on the
expression of p21waf1 and CDK-2
Following lentiviral transfection for 96 h, total
protein was extracted from fibroblasts. The relative expression
levels of p21waf1 and CDK2 were semi-quantitatively analyzed by
western blotting (Figs. 6 and
7).
In NPOP fibroblasts, the expression levels of
p21waf1 in the Mfn2+ group (0.322±0.026) were significantly
upregulated than in the Mfn2- (0.110±0.001) and control groups
(0.107±0.001) (P<0.001). No significant difference was noted
between the two control groups. In addition, the relative
expression levels of CDK2 in the Mfn2+ group (0.108±0.014) were
significantly decreased compared with the Mfn2- (0.166±0.005) and
control groups (0.168±0.006) (χ2=15.768, P<0.01). No
significant difference was noted between the two control groups
(P>0.05) (Fig. 6).
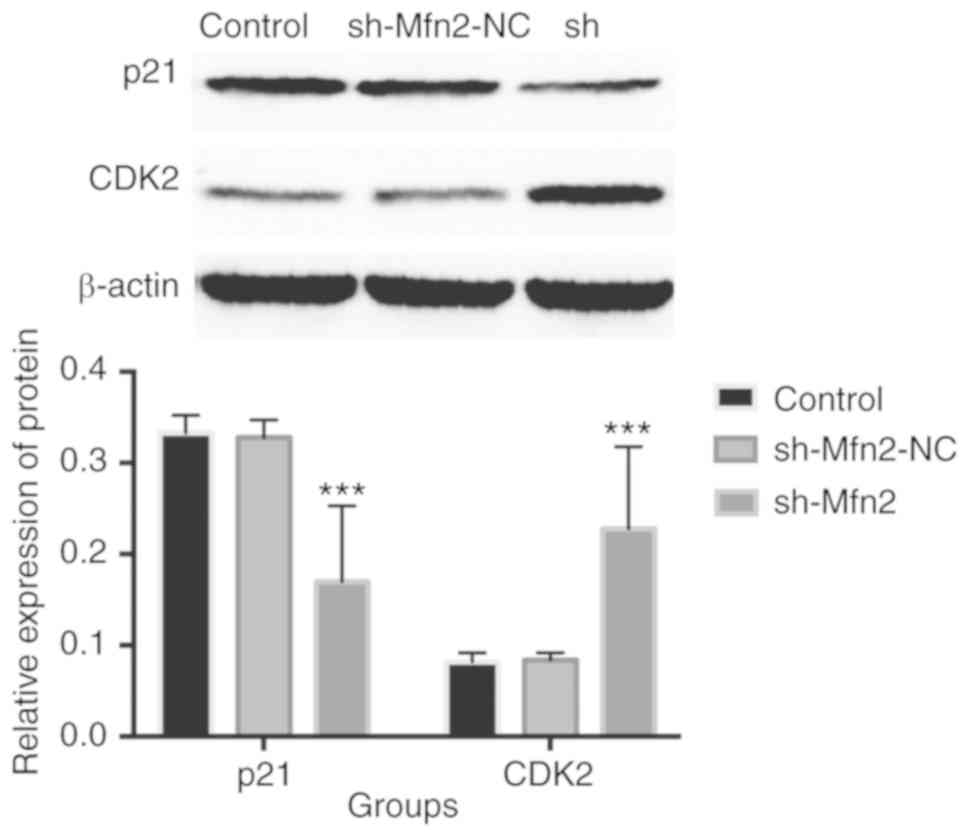
The expression levels of the p21waf1 protein in the
sh-Mfn2 group (0.170±0.015) were significantly downregulated than
in the sh-Mfn2-NC (0.328±0.003) and control groups (0.333±0.004)
following transfection of RNAi lentiviral particles in POP
fibroblasts (χ2=59.874, P<0.001) (Fig. 7). No significant difference was
reported between the sh-Mfn2-NC and control groups (P>0.05). In
addition, the relative expression levels of CDK2 in the sh-Mfn2
group (0.228±0.016) were significantly upregulated compared with
the sh-Mfn2-NC (0.084±0.001) and control groups (0.082±0.002)
(χ2=49.541, P<0.001). No significant difference was
noted between the two control groups (P>0.05).
Discussion
To examine the effects of Mfn2 on fibroblasts, we
transduced fibroblasts with lentiviral vectors for the
overexpression and knockdown of Mfn2. These vectors are suitable
for achieving stable expression of sh-Mfn2 RNA and can
significantly improve the transduction efficiency of specific cells
that are difficult to transfect, such as primary cells and stem
cells (24). In the present study,
the infection efficiencies of Mfn2 overexpressing and RNAi
lentiviral vectors were >70%, indicating that they could be used
successfully for transfection.
The CCK-8 assay is a colorimetric assay used to
measure cell proliferation. The formation of the color is directly
proportional to the proliferation of cells. The use of a microplate
reader to determine the OD indirectly reflects the number of living
cells. The present study indicated that the cell activity in the
Mfn2+ group was significantly reduced compared with that noted in
the two control groups, whereas in the sh-Mfn2 group, the activity
of the sh-Mfn2 fibroblasts was significantly higher compared with
that of the sh-Mfn2-NC and control groups. These results were
consistent with a previous study (19); however, in POP patients, increased
expression levels of Mfn2 may not be beneficial, as decreased
proliferation of fibroblasts may be associated with their
dysfunction, which could be the cause of POP.
The present study indicated that the Mfn2
gene could cause growth arrest by blocking the cell cycle at the
G0/G1 phase (25). Three major
classes of proteins are involved in the regulation of the cell
cycle: Cyclins, CDK enzymes and cyclin-dependent kinase inhibitors
(CDKI) (26). CDK2 is a key kinase
that initiates DNA replication required for the G2 phase
transition. CDKI inhibits CDK enzymes that prevent cells from
passing through the restriction point. p21 is mainly involved in
the regulation of the activity of the CDK proteins (26). The present study indicated that
overexpression of Mfn2 in NPOP fibroblasts caused a decrease in the
expression levels of CDK2, whereas the expression levels of the
p21waf1 protein were significantly increased, which is associated
with G0/G1 phase arrest. Similarly, a higher percentage of cells in
the sh-Mfn2 group were able to enter S phase required for DNA
synthesis, and G2/M phase required for mitotic division, which is
characterized by increased CDK2 and decreased p21waf1 levels
(25). This conclusion is
consistent with our previous results obtained from cell cycle
studies (21,22).
The results of the current study indicated that Mfn2
notably inhibited cell proliferation through the ERK signaling
pathway (27), which regulates a
number of important cellular biological processes, including cell
proliferation and differentiation (14). The Ras/Raf/MEK/ERK pathway
transmits various downstream signals in order to activate nuclear
proteins involved in the aforementioned biological processes
(27). Activated ERK can promote
the phosphorylation of its cytoplasmic target protein and/or
regulate the activity of other protein kinases (14). Our results suggested that the
upregulation of Mfn2 in POP fibroblasts inhibited the
phosphorylation of these proteins by affecting Ras and Raf-1
proteins, two upstream effectors of ERK1/2, thereby inhibiting cell
proliferation.
In conclusion, the present study demonstrated that
the Mfn2-overexpression group, the expression levels of the
procollagen proteins and cell proliferation were markedly decreased
compared with the controls. This indicated that the increase in the
levels of Mfn2 in POP fibroblasts inhibited the levels of
procollagen proteins, resulting in the decrease of synthesized
collagen secreted into the ECM. This could in turn lead to the
weakness of the pelvic floor support structure based on the
uterosacral ligament. These effects favor the occurrence and
development of POP. Furthermore, we also proposed that Mfn2 may
affect cell proliferation and the cell cycle via the Ras-Raf-ERK
signaling pathway, and CDK2 and p21waf1 proteins. With regards to
the causal association between the occurrence of POP and increased
Mfn2 expression, Mfn2 was upregulated in the uterosacral ligaments
in patients with POP. Our findings may provide insight into the
pathogenesis, clinical prediction, individual diagnosis and
treatment of POP; however, further investigation is required.
Acknowledgements
The authors would like to thank Dr Yu Qi from Peking
University First Hospital, for his instructive advice and useful
suggestions on the experiment design. Our abstract entitled
‘Mitofusin2 regulates the proliferation and function of
fibroblasts: Possible mechanisms of pelvic organ prolapse’ (receipt
no. 191) was selected as a non-moderated e-poster at the 43rd IUGA
Annual Meeting, which took place at the Austria Center, Vienna,
Austria on June 27–30, 2018.
Funding
The present study was supported by a grant from the
National Natural Science Foundation of China NSFC (grant no.
81401185).
Availability of data and materials
The datasets used and/or analyzed during the present
study are available from the corresponding author on reasonable
request.
Authors' contributions
YL contibuted to the conception and design of the
study, and obtained funding. CP and YZ communicated with patients,
collected samples and revised the manuscript. HC was responsible
for the acquisition of data. XqW and XxQ were responsible for the
analysis and interpretation of data. XqW drafted the
manuscript.
Ethics approval and consent to
participate
The samples were obtained following informed consent
provided by the patients and the ethics committee of the Peking
University First Hospital [2016(1173)] approved the study
protocol.
Patient consent for publication
Not applicable.
Competing interests
The authors declare that they have no competing
interests.
Glossary
Abbreviations
Abbreviations:
|
POP
|
pelvic organ prolapse
|
|
Mfn2
|
mitofusin2
|
|
NPOP
|
non-pelvic organ prolapse
|
|
p21Waf1
|
phosphoprotein 21 wild-type p53
activating fragment
|
|
CDK-2
|
cyclin-dependent kinase 2
|
|
ERK1/2
|
extracellular signal-regulated
kinase1/2
|
|
Raf-1
|
rapidly accelerated fibrosarcoma-1
|
|
Mfn2+
|
NPOP fibroblasts with lentiviral
vector of the open reading frame gene sequence of Mfn2
|
|
Mfn2-
|
NPOP fibroblasts transfected with
lentiviral unloaded vector
|
|
sh
|
short hairpin RNA group, POP
fibroblasts transfected with lentiviral vector containing shRNA
interference sequence
|
|
CCK-8
|
cell counting kit-8
|
References
|
1
|
Khan AA, Eilber KS, Clemens JQ, Wu N,
Pashos CL and Anger JT: Trends in management of pelvic organ
prolapse among female Medicare beneficiaries. Am J Obstet Gynecol.
212:e1–e8. 2015. View Article : Google Scholar
|
|
2
|
Dekker JH: Pelvic organ prolapse:
Prevention by training? Lancet. 389:336–337. 2017. View Article : Google Scholar : PubMed/NCBI
|
|
3
|
Dumoulin C, Hunter KF, Moore K, Bradley
CS, Burgio KL, Hagen S, Imamura M, Thakar R, Williams K and
Chambers T: Conservative management for female urinary incontinence
and pelvic organ prolapse review 2013: Summary of the 5th
international consultation on incontinence. Neurourol Urodyn.
35:15–20. 2016. View Article : Google Scholar : PubMed/NCBI
|
|
4
|
Alves FK, Riccetto C, Adami DB, Marques J,
Pereira LC, Palma P and Botelho S: A pelvic floor muscle training
program in postmenopausal women: A randomized controlled trial.
Maturitas. 81:300–305. 2015. View Article : Google Scholar : PubMed/NCBI
|
|
5
|
Bø K, Hilde G, Stær-Jensen J, Siafarikas
F, Tennfjord MK and Engh ME: Postpartum pelvic floor muscle
training and pelvic organ prolapse-a randomized trial of
primiparous women. Am J Obstet Gynecol. 212:38.e1–e7. 2015.
View Article : Google Scholar
|
|
6
|
Sedgwick P: What is significance? BMJ.
350:h34752015. View Article : Google Scholar : PubMed/NCBI
|
|
7
|
Sung VW, Wohlrab KJ, Madsen A and Raker C:
Patient-reported goal attainment and comprehensive functioning
outcomes after surgery compared to pessary for pelvic organ
prolapse. Am J Obstet Gynecol. 215:659.e1–659.e7. 2016. View Article : Google Scholar
|
|
8
|
Jeon MJ, Kim EJ, Lee M, Kim H, Choi JR,
Chae HD, Moon YJ, Kim SK and Bai SW: MicroRNA-30d and microRNA-181a
regulate HOXA11 expression in the uterosacral ligaments and are
overexpressed in pelvic organ prolapse. J Cell Mol Med. 19:501–509.
2015. View Article : Google Scholar : PubMed/NCBI
|
|
9
|
Ulrich D, Edwards SL, Su K, White JF,
Ramshaw JA, Jenkin G, Deprest J, Rosamilia A, Werkmeister JA and
Gargett CE: Influence of reproductive status on tissue composition
and biomechanical properties of ovine vagina. PLoS One.
9:e931722014. View Article : Google Scholar : PubMed/NCBI
|
|
10
|
Liang R, Zong W, Palcsey S, Abramowitch S
and Moalli PA: Impact of prolapse meshes on the metabolism of
vaginal extracellular matrix in rhesus macaque. Am J Obstet
Gynecol. 212:174.e1–e7. 2015. View Article : Google Scholar
|
|
11
|
Kim T, Sridharan I, Ma Y, Zhu B, Chi N,
Kobak W, Rotmensch J, Schieber JD and Wang R: Identifying distinct
nanoscopic features of native collagen fibrils towards early
diagnosis of pelvic organ prolapse. Nanomedicine. 12:667–675. 2016.
View Article : Google Scholar : PubMed/NCBI
|
|
12
|
Liang R, Knight K, Barone W, Powers RW,
Nolfi A, Palcsey S, Abramowitch S and Moalli PA: Extracellular
matrix regenerative graft attenuates the negative impact of
polypropylene prolapse mesh on vagina in rhesus macaque. Am J
Obstet Gynecol. 216:153.e1–153.e9. 2017. View Article : Google Scholar
|
|
13
|
Wirostko BM, Curtin K, Ritch R, Thomas S,
Allen-Brady K, Smith KR, Hageman GS and Allingham RR: Risk for
exfoliation syndrome in women with pelvic organ prolapse: A utah
project on exfoliation syndrome (UPEXS) study. JAMA Ophthalmol.
134:1255–1262. 2016. View Article : Google Scholar : PubMed/NCBI
|
|
14
|
Tracy LE, Minasian A and Caterson EJ:
Extracellular matrix and dermal fibroblast function in the healing
wound. Adv Skin Wound Care (New Rochelle). 5:119–136. 2016.
View Article : Google Scholar
|
|
15
|
Zorzano A, Hernández-Alvarez MI, Sebastián
D and Muñoz JP: Mitofusin 2 as a driver that controls energy
metabolism and insulin signaling. Antiox Redox Signaling.
22:1020–1031. 2015. View Article : Google Scholar
|
|
16
|
Schrepfer E and Scorrano L: Mitofusins
from mitochondria to metabolism. Mol Cell. 61:683–694. 2016.
View Article : Google Scholar : PubMed/NCBI
|
|
17
|
Sebastián D and Zorzano A: When MFN2
(mitofusin 2) met autophagy: A new age for old muscles. Autophagy.
12:2250–2251. 2016. View Article : Google Scholar : PubMed/NCBI
|
|
18
|
Zheng L, Li S, Zhao S and Fa X:
Upregulated miR-17 regulates hypoxia-mediated human pulmonary
artery smooth muscle cell proliferation and apoptosis by targeting
Mitofusin 2. Med Sci Monit. 22:3301–3308. 2016. View Article : Google Scholar : PubMed/NCBI
|
|
19
|
Lou Y, Li R, Liu J, Zhang Y, Zhang X, Jin
B, Liu Y, Wang Z, Zhong H, Wen S and Han B: Mitofusin-2
over-expresses and leads to dysregulation of cell cycle and cell
invasion in lung adenocarcinoma. Med Oncol. 32:1322015. View Article : Google Scholar : PubMed/NCBI
|
|
20
|
Wu JM, Dieter AA, Pate V and Jonsson Funk
M: Cumulative incidence of a subsequent surgery after stress
urinary incontinence and pelvic organ prolapse procedure. Obstet
Gynecol. 129:1124–1130. 2017. View Article : Google Scholar : PubMed/NCBI
|
|
21
|
Chen HY, Lu Y, Qi Y, Bai WP and Liao QP:
Relationship between the expressions of mitofusin-2 and procollagen
in uterosacral ligament fibroblasts of postmenopausal patients with
pelvic organ prolapse. Eur J Obstet Gynecol Reprod Biol.
174:141–145. 2014. View Article : Google Scholar : PubMed/NCBI
|
|
22
|
Lu Y, Chen HY, Wang XQ and Wang JX:
Correlations between Mitofusin 2 expression in fibroblasts and
pelvic organ prolapse: An in vitro study. Chin Med J (Engl).
130:2951–2959. 2017. View Article : Google Scholar : PubMed/NCBI
|
|
23
|
Bump RC, Mattiasson A, Bø K, Brubaker LP,
DeLancey JO, Klarskov P, Shull BL and Smith AR: The standardization
of terminology of female pelvic organ prolapse and pelvic floor
dysfunction. Am J Obstet Gynecol. 175:10–17. 1996. View Article : Google Scholar : PubMed/NCBI
|
|
24
|
Merten OW, Hebben M and Bovolenta C:
Production of lentiviral vectors. Mol Ther Methods Clin Dev.
3:160172016. View Article : Google Scholar : PubMed/NCBI
|
|
25
|
Asghar U, Witkiewicz AK, Turner NC and
Knudsen ES: The history and future of targeting cyclin-dependent
kinases in cancer therapy. Nat Rev Drug Discov. 14:130–146. 2015.
View Article : Google Scholar : PubMed/NCBI
|
|
26
|
Branzei D and Foiani M: Regulation of DNA
repair throughout the cell cycle. Nat Rev Mol Cell Biol. 9:297–308.
2008. View
Article : Google Scholar : PubMed/NCBI
|
|
27
|
Chen KH, Dasgupta A, Ding J, Indig FE,
Ghosh P and Longo DL: Role of mitofusin 2 (Mfn2) in controlling
cellular proliferation. FASEB J. 28:382–394. 2014. View Article : Google Scholar : PubMed/NCBI
|