Introduction
Spermatogenesis is a complex developmental process
that has spermatogonial stem cells (SSCs) at its foundation. The
SSCs niche is in the basal compartment of the seminiferous tubules.
SSCs undergo spermatogenesis to produce spermatozoa. Self-renewal
and the potential to differentiate are two properties that
distinguish stem cells from somatic cells, and SSCs are the only
germline stem cells that can undergo self-renewal division
(1). The balance between
proliferation and differentiation is therefore essential to the
normal function of SSCs and to maintain male fertility (2).
Glial cell line-derived neurotrophic factor (GDNF)
is secreted by Sertoli cells, and is an important factor in the
cell fate determination of SSCs, which was identified in the year
2000 (3). While
GDNF+/− mice have depleted stem cell reserves
(3), the overexpression of GDNF
results in the accumulation of undifferentiated spermatogonia and
in the development of testicular tumors (4), indicating that the right
concentration of GDNF is critical for the proliferation of SSCs
(5). Although GDNF has no
significant effect on the activity of SSCs at concentrations in the
range 1–100 ng/ml, GDNF at concentrations <1 ng/ml is
insufficient to maintain the proliferation of SSCs in vitro
over a period of 7 days (6).
However, the mechanisms underlying the GDNF-dependent proliferation
of SSCs remain elusive.
Metabolomics is the study of the final products of
gene expression and, as a high-throughput analysis, is considered
to be more reflective of the biological phenotype compared to
genomic, transcriptomic and proteomic studies (7). Thus, metabolomics may be particularly
well-suited to detect the dynamic modifications that occur during
complex biological processes. Metabolomics has been used in the
discovery of small molecules that are potential biomarkers of
self-renewal (8), reprogramming
(9) and differentiation (10), and it has also been previously used
to reveal metabolic mechanisms related to spermatogenesis (11,12).
In the present study, metabolomics was used to
evaluate the alterations in SSCs metabolites, including
glycylglycine and sorbitol, following GDNF deprivation, in order to
elucidate the underlying mechanisms of GDNF-dependent
proliferation.
Materials and methods
Chemicals and reagents
The following chemicals and reagents were purchased
from the respective chemical suppliers: Glycylglycine (cat. no.
G1002; purity ≥99%; Sigma-Aldrich; Merck KGaA, Darmstadt, Germany);
sorbitol (cat. no. S6021; purity ≥98%; Sigma-Aldrich; Merck KGaA);
TRIzol® (Invitrogen; Thermo Fisher Scientific, Inc.,
Waltham, MA, USA); the Cell Counting Kit-8 (CCK-8) assay kit
(Beyotime Institute of Biotechnology, Haimen, China); and the cDNA
Synthesis kit and SYBR® Green Master Mix kit (Takara
Bio, Inc., Otsu, Japan). The Cell Light™ EdU kit (cat. no. C10310)
was purchased from Guangzhou RiboBio Co., Ltd. (Guangzhou,
China).
SSCs culture
SSCs were cultured in vitro following a
previously described protocol (13), and the cells were characterized as
in a previous study (14). All
experiments involving mice were approved by the Institutional
Animal Care and Use Committee of Nanjing Medical University
(IACUC:1601247). The primary cells were isolated from 6–8 day old
male C57BL/6 mice obtained from Nanjing Medical University. The
mice were housed in groups in a polypropylene cages at 21±2°C, a
humidity of 50±10% and a 12 h light/dark cycle (lights on at 7:00
a.m.), and THY1-positive cells were enriched using
magnetic-activated cell separation (Miltenyi Biotech GmbH, Bergisch
Gladbach, Germany). Cells were plated at a density of
1.5–2.0×10⁵ cells/well on 12-well plates coated with
mitotically inactivated SIM mouse embryo-derived thioguanine- and
ouabain-resistant feeder layers (cat. no. SNLP76/7-4; American Type
Culture Collection, Manassas, VA, USA). Long-term cultures of SSCs
were supported in serum-free Minimum Essential Medium-α (Thermo
Fisher Scientific, Inc.) and supplied with 20 ng/ml GDNF (R&D
Systems China Co., Ltd., Shanghai, China), 1 ng/ml basic fibroblast
growth factor 2 (BD Biosciences, San Jose, CA, USA), and 150 ng/ml
GDNF family receptor α1 (GFRA1; R&D Systems China Co., Ltd.).
In addition, 2 mM L-glutamine (Thermo Fisher Scientific, Inc.), 2%
bovine serum albumin, 10 µg/ml transferrin, 50 µM free fatty acid
mixture (5.6 mM linolenic acid, 13.4 mM oleic acid, 2.8 mM
palmitoleic acid, 35.6 mM linoleic acid, 31 mM palmitic acid, 76.9
mM stearic acid;), 30 nM Na2SeO3, 50 µM
2-mercaptoethanol, 5 µg/ml insulin, 10 mM
4-(2-hydroxyethyl)-1-piperazineethanesulfonic acid and 60 µM
putrescine, all purchased from Sigma-Aldrich; Merck KGaA, were
added to the medium. Cells were maintained in a humidified
atmosphere at 5% CO2 and 37°C. The medium was replaced
every 2 days and cells were passaged every 5–6 days. For GDNF
deprivation, the concentration of GDNF was reduced to 0.1 ng/ml for
12 h or 24 h when SSCs were ~50% confluent. For the rescue assay,
two doses (1 and 10 µM) of each metabolite (glycylglycine and
sorbitol) were chosen for optimization (according to http://www.hmdb.ca/metabolites/HMDB0000247). Given
results from preliminary studies on the rescue effect, and the
glycylglycine and sorbitol level in the body, 10 µM was selected
for used in the subsequent experiments. After 5 days of treatment,
the SSCs were imaged using a light microscope.
Metabolomic analysis
The SSCs sample preparation for metabolomic analysis
was conducted according to a previous approach (8). Briefly, treated SSCs were washed five
times with ice cold PBS, and ~6×10⁵ SSCs/group were
collected. Following the addition of 0.3 ml 50% methanol with
internal standard, the cells were harvested by pipetting. Cells
were sonicated for 3 min (frequency, 20 kHz; power, 60%; pulses,
6/4) and centrifuged at 16,099 × g at 4°C for 15 min to remove
cellular debris. The supernatant was subjected to metabolomic
analysis. Quality control (QC) samples were prepared by mixing
equal volumes of each SSCs sample.
The metabolomic analysis was performed on an
UltiMate™ 3000 ultra high-performance liquid chromatography system
(Dionex; Thermo Fisher Scientific, Inc.), coupled to an Orbitrap
high-resolution mass spectrometer (Thermo Fisher Scientific, Inc.)
in both positive and negative modes simultaneously (15). The detailed operating procedures
was conducted according to a previous study (16). Through this approach, >70% of
differential metabolites observed in the QC sample had a percent
relative standard deviation (%RSD) of <30%, and the internal
standard had a %RSD of <20%, indicating the reliability of the
metabolomic analysis (17).
Cell viability assay and
proliferation
Cellular viability was evaluated using the CCK-8
Kit. Cells were plated at a density of 1.5×10⁴
cells/well in 96-well plates and incubated overnight (37°C, 5%
CO2). The SSCs treatment groups were: Complete medium;
GDNF deprivation; GDNF deprivation with glycylglycine rescue; and
GDNF deprivation with sorbitol rescue. On the 2nd, 3rd, 4 and 5th
days, 10 µl CCK-8 solution was added to each well, and the cells
were incubated for 2 h at 37°C in 5% CO2. The medium was
replaced every 2 days. The absorbance was determined using a TECAN
infinite M200 plate reader (Tecan Group, Ltd., Mannedorf,
Switzerland) at 450 nm.
The Cell Light™ EdU kit was used to assess SSCs
proliferation. SSCs (~8×10³ cells/well) were seeded in a
96-well plate and treated for 5 days as aforementioned. EdU (25 µM)
was added to the culture medium for an additional 10 h. The cells
were fixed with 4% formaldehyde for 30 min at room temperature and
neutralized using glycine (2 mg/ml) for 10 min at room temperature,
according to the manufacturer's instructions. Then the cells were
permeabilized using 0.5% Triton X-100 in PBS for 20 min, and
staining with Hoechst 33342 was performed. Cell images and data
were automatically obtained using High Content Screening (HCS;
Cellomics ArrayScan VTI HCS Reader; Thermo Fisher Scientific,
Inc.). Appropriate filter sets for the detection of two
fluorophores were used, and different fluorescent signals were
recorded in two different image collection channels. Channel 1
contained the blue nuclear images; channel 2 contained the red
images indicating where EdU was incorporated and which cells were
proliferating. For each treatment, three independent wells were
measured. The ×20 objective was used to collect images, and 48
fields/well were imaged. The analysis was performed after 5 days
using the Thermo Scientific HCS Studio Cell Analysis Software 3.0
(Thermo Fisher Scientific, Inc.).
Reverse transcription-quantitative
polymerase chain reaction (RT-qPCR) assay of mRNA levels of
self-renewal genes
Total RNA was isolated from SSCs using
TRIzol® and the concentration was determined using a
NanoDrop 2,000 (Thermo Fisher Scientific, Inc., Wilmington, DE,
USA). Total RNA (1 µg) was used to synthesize cDNA using the
following temperature protocol: 37°C for 15 min and 85°C for 5 sec.
The mRNA levels of self-renewal genes, namely B-cell CLL/lymphoma 6
member B (Bcl6b), ETS variant 5 (Etv5),
Gfra1 and early growth response protein 4 (Egr4) were
analyzed using the SYBR® Green Master Mix kit, according
to the manufacturer's instructions. GAPDH was used as a
reference gene. Primer sequences synthesized by Invitrogen (Thermo
Fisher Scientific, Inc.) are presented in Table I. All RT-qPCR reactions were
performed using the 7900HT Fast Real-Time PCR System (Applied
Biosystems; Thermo Fisher Scientific, Inc.) with the following
thermocycling conditions: 95°C for 30 sec followed by 40 cycles of
95°C for 5 sec and 60°C for 30 sec.
 | Table I.Sequences of primers for reverse
transcription-quantitative polymerase chain reaction. |
Table I.
Sequences of primers for reverse
transcription-quantitative polymerase chain reaction.
| Gene | Type of primer | Sequences |
|---|
| Bcl6b | Forward |
5′-GGCTACGTCCGAGAGTTCAC-3′ |
|
| Reverse |
5′-CTTGTGCGCTCTTAGGGGT-3′ |
| Etv5 | Forward |
5′-CACCATGTATCGAGAGGGGC-3′ |
|
| Reverse |
5′-GAGCAACCTCTTCCGGTTCT-3′ |
| Gfra1 | Forward |
5′-CTCGGAATCCAGCCTACGTC-3′ |
|
| Reverse |
5′-CACTTGTCCTCTCGTGTGCT-3′ |
| Egr4 | Forward |
5′-GACGCGCTTCTCTCCAAG-3′ |
|
| Reverse |
5′-CTCAAAGCCCAGCTCAAGAA-3′ |
| GAPDH | Forward |
5′-AGGTCGGTGTGAACGGATTTG-3′ |
|
| Reverse |
5′-GGGGTCGTTGATGGCAACA-3′ |
Data analysis
For the metabolomics analysis, the data were
imported into SIMCA-P software (Version 13.0; Umetrics; Sartorius
AG, Göttingen, Germany) and were unit variance-scaled and auto
log-transformed where appropriate. Orthogonal partial least square
discriminate analysis (OPLS-DA) was applied to quantitatively
assess the metabolites produced by the experimental and control
treatments. The metabolites were subsequently indexed by their
variable importance in projection (VIP). Data were validated using
the leave one out cross-validation method and the quality of model
was assessed by R2 and Q2 scores (18). The statistical significance of
metabolites identified by OPLS-DA was then calculated via Student's
t-test. VIP>1 and P<0.05 were considered to indicate a
statistically significant difference in metabolite production
(19).
The 2−ΔΔCq method was used to analyze the
results of the RT-qPCR (20).
Differences among all the treatment groups and the control group
were determined by one-way analysis of variance, followed by
Dunnett's multiple comparison test. All the statistical analyses
were performed using Stata 9.2 (StataCorp LP, College Station, TX,
USA) and presented with GraphPad Prism 5 software (GraphPad
Software, Inc., La Jolla, CA, USA). All analyses were two-sided and
date are presented as the mean ± SD. P<0.05 was considered to
indicate statistically significant difference.
Results
Metabolic modifications after GDNF
deprivation
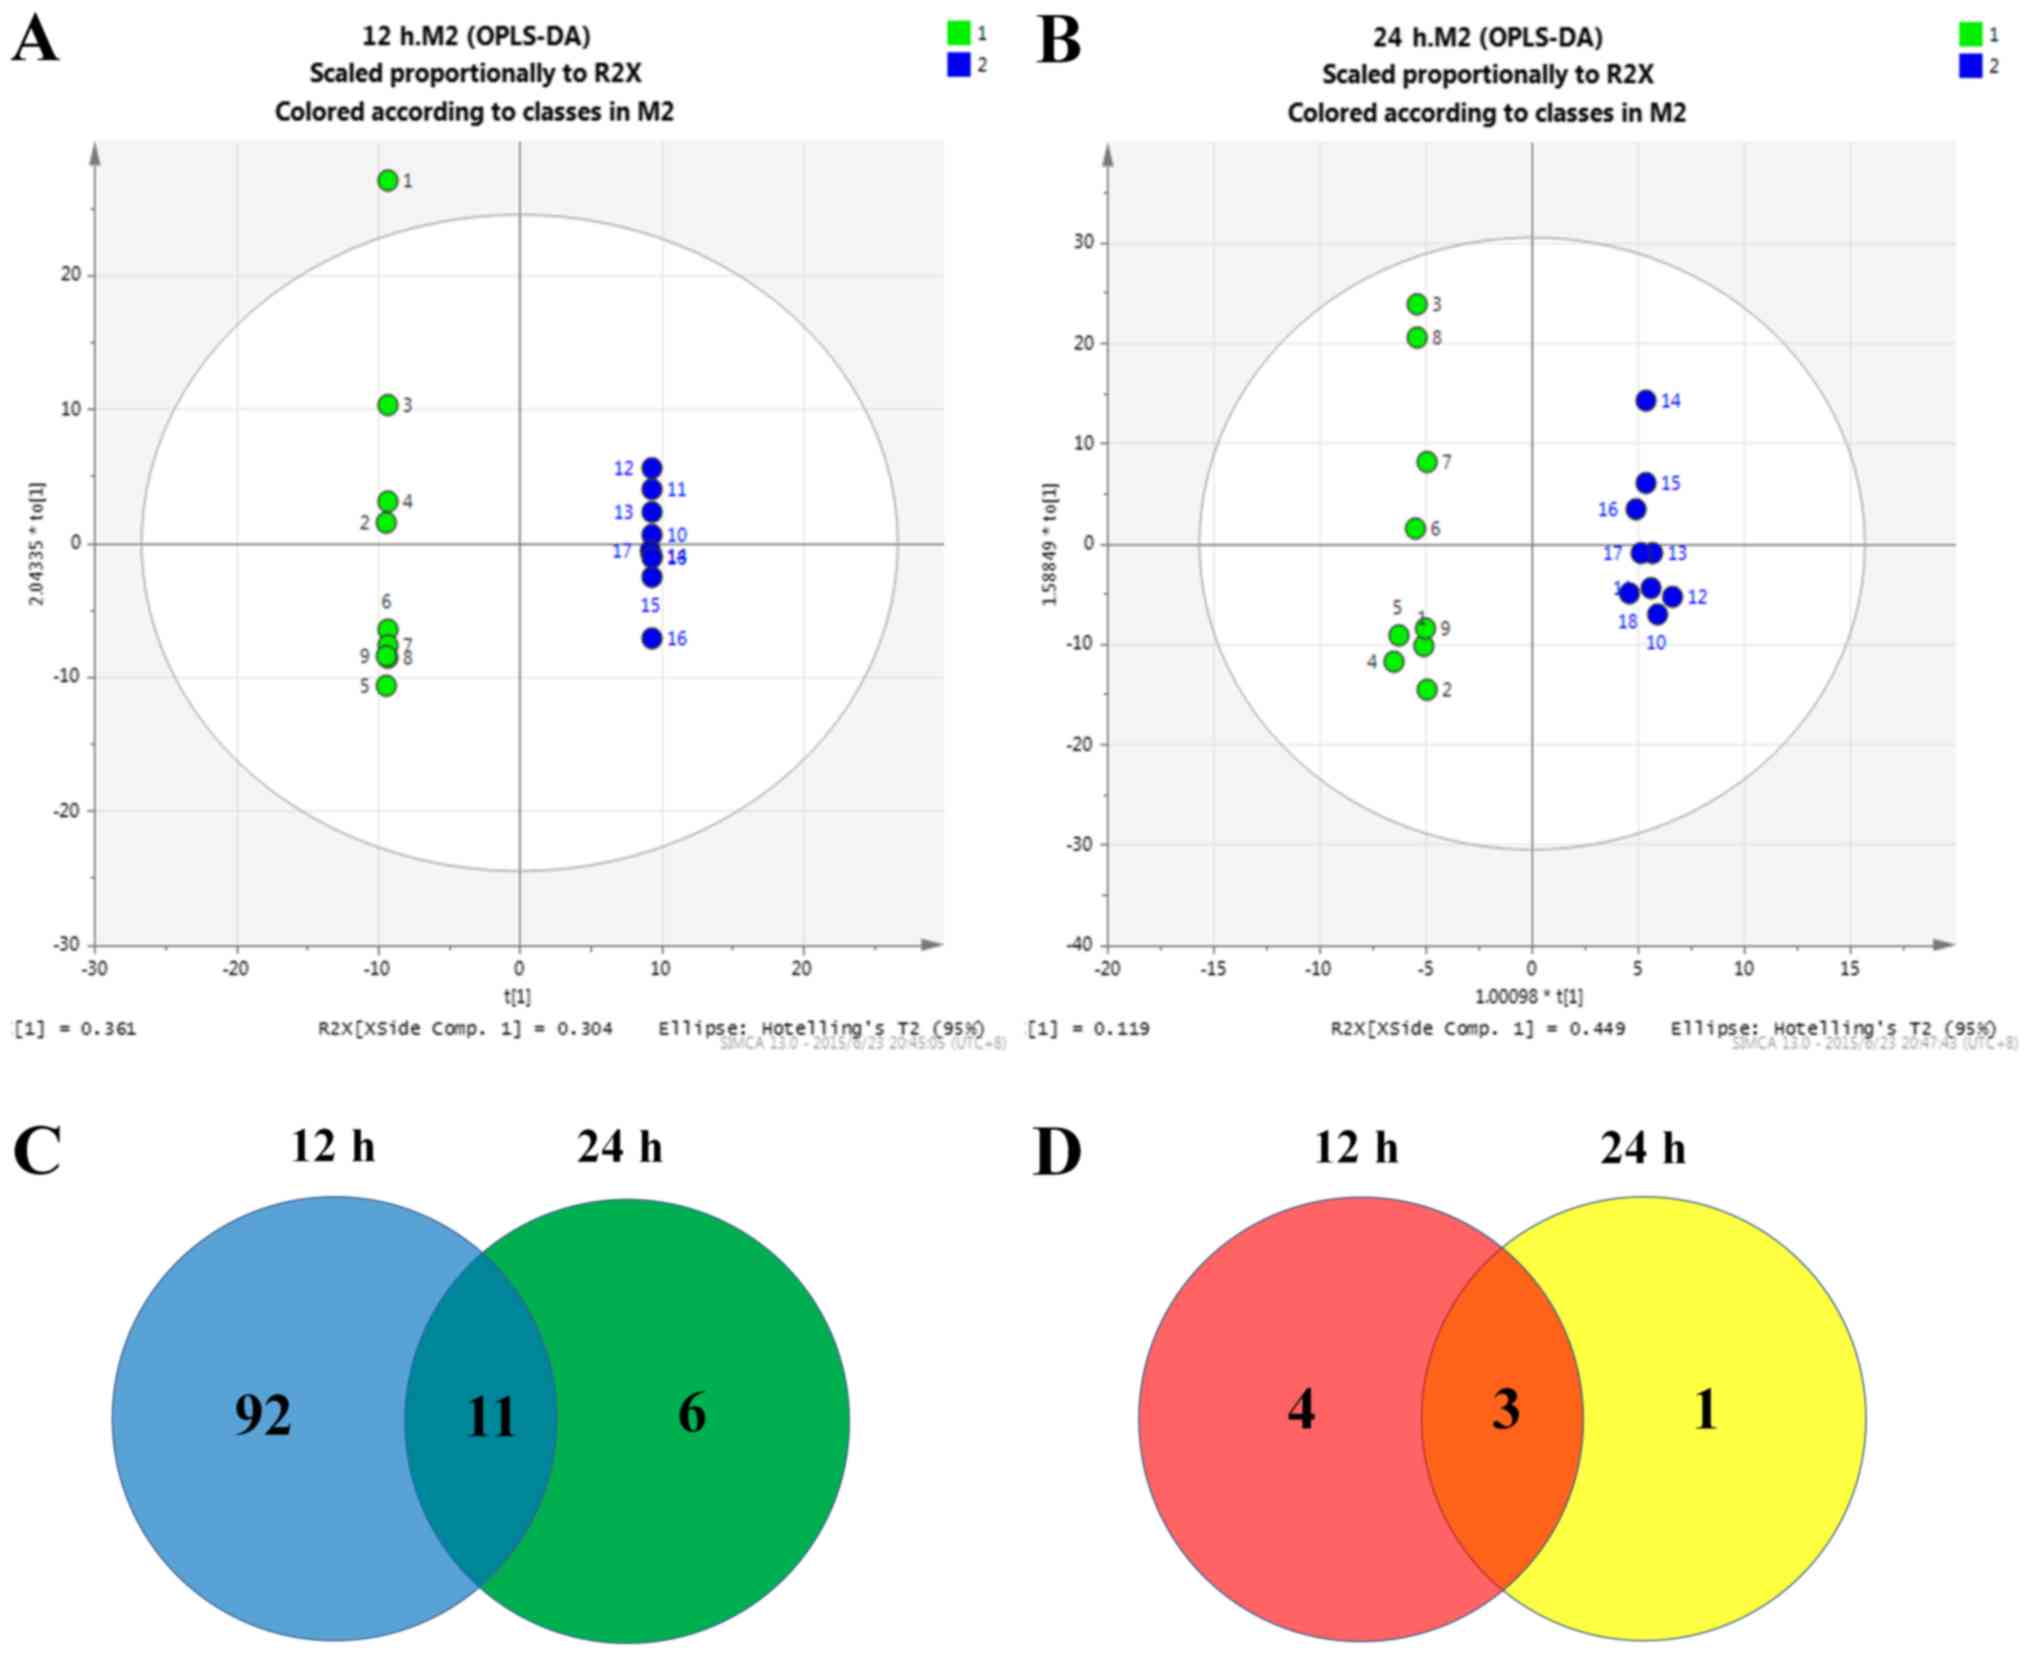
The OPLS-DA model demonstrated that GDNF deprivation
for 12 or 24 h resulted in a distinct metabolic profile compared to
the control (R2Y=99.4%, Q2=71.5% and R2Y=99.0%, Q2=53.0%,
respectively; Fig. 1A and B. R2Y
indicates the quality of fit, with an R2Y of 1 indicating a perfect
description of the data by the model. Q2 indicates the predictive
ability of the model, with a Q2 of 1 indicating complete
predictability. A total of 103 metabolites had decreased and 7 had
increased (VIP>1 and P<0.05) after 12 h of GDNF deprivation
(Table II). After 24 h of GDNF
deprivation the majority of those metabolites were restored to
normal levels, and only a total of 17 metabolites were decreased
(Fig. 1C) and 4 were increased
(Fig. 1D; Table III). A comparison of these two
lists demonstrated that there were 14 overlapping metabolites.
Among these, based on the metabolic information in the HMDB
database, glycylglycine and sorbitol were found to be the two most
significantly decreased metabolites following GDNF deprivation.
Therefore, the effects of glycylglycine and sorbitol on the
proliferation of SSCs were further assessed.
| Table II.Altered metabolites following glial
cell line-derived neurotrophic factor deprivation for 12 h. |
Table II.
Altered metabolites following glial
cell line-derived neurotrophic factor deprivation for 12 h.
| Peak | VIP | Fold change | P-value |
|---|
| Aminocaproic
acid | 1.366 | 0.176 |
3.08×10−05 |
| Taurine | 1.339 | 0.164 |
5.76×10−05 |
| Theobromine | 1.330 | 0.178 |
7.06×10−05 |
| Methylmalonic
acid | 1.306 | 0.193 |
1.17×10−04 |
| Melibiose | 1.301 | 0.107 |
4.86×10−05 |
| Sucrose | 1.301 | 0.107 |
4.86×10−05 |
| Trehalose | 1.301 | 0.107 |
4.86×10−05 |
| Biotin | 1.298 | 0.169 |
1.38×10−04 |
|
Androstenedione | 1.278 | 0.204 |
2.00×10−04 |
| Petroselinic
acid | 1.274 | 0.194 |
2.15×10−04 |
| Trans-Vaccenic
acid | 1.274 | 0.194 |
2.15×10−04 |
| Indoleacrylic
acid | 1.274 | 0.198 |
2.17×10−04 |
| Sorbitol | 1.269 | 0.195 |
2.37×10−04 |
| D-Fructose
6-phosphate disodium salt hydrate | 1.259 | 0.236 |
2.85×10−04 |
|
2-Piperidinemethanol | 1.251 | 0.198 |
3.26×10−04 |
| Guanine | 1.250 | 0.275 |
3.29×10−04 |
| Cellobiose | 1.250 | 0.107 |
4.86×10−05 |
| Formamide | 1.248 | 0.212 |
3.45×10−04 |
| D-Mannose
6-phosphate sodium salt | 1.242 | 0.393 |
4.84×10−02 |
| Cinnamaldehyde
natural | 1.241 | 0.178 |
3.88×10−04 |
| Cytosine | 1.229 | 0.200 |
4.70×10−04 |
| Quinaldic acid | 1.224 | 0.219 |
5.10×10−04 |
|
16-Alpha-hydroxyestrone | 1.221 | 0.201 |
5.39×10−04 |
| Androstenediol | 1.221 | 0.201 |
5.39×10−04 |
|
N-Acetyl-L-phenylalanine | 1.221 | 0.201 |
5.39×10−04 |
| Progesterone | 1.221 | 0.201 |
5.39×10−04 |
| Uracil | 1.221 | 0.201 |
5.39×10−04 |
|
2-Amino-1-Phenylethanol | 1.221 | 0.201 |
5.39×10−04 |
| 2-Deoxycytidine
free base | 1.221 | 0.201 |
5.39×10−04 |
|
4-Hydroxyestrone | 1.221 | 0.201 |
5.39×10−04 |
| Androsterone | 1.221 | 0.201 |
5.39×10−04 |
|
DL-alpha-Palmitin | 1.221 | 0.201 |
5.39×10−04 |
|
D-Plus-Neopterine | 1.221 | 0.201 |
5.39×10−04 |
|
L-A-Phosphatidylcholine | 1.221 | 0.201 |
5.39×10−04 |
| Linoleic acid | 1.221 | 0.201 |
5.39×10−04 |
| 4-Hydroxycinnamic
acid | 1.221 | 0.201 |
5.39×10−04 |
| Acetyl-L-carnitine
hydrochloride | 1.221 | 0.201 |
5.39×10−04 |
| Gamma-Linolenic
acid | 1.221 | 0.201 |
5.39×10−04 |
|
Indole-3-acetamide | 1.221 | 0.201 |
5.39×10−04 |
| Estrone | 1.221 | 0.201 |
5.39×10−04 |
| Theophylline | 1.221 | 0.201 |
5.39×10−04 |
|
Transtrans-farnesol | 1.221 | 0.201 |
5.39×10−04 |
| Cytidine | 1.221 | 0.417 |
2.31×10−02 |
| Riboflavin | 1.218 | 0.202 |
5.62×10−04 |
| Suberic acid | 1.217 | 0.133 |
5.70×10−04 |
| 2-methoxycinnamic
acid | 1.216 | 0.203 |
5.77×10−04 |
|
N-Acetylglutamine | 1.216 | 0.203 |
5.80×10−04 |
| 3-Methyladipic
acid | 1.215 | 0.203 |
5.93×10−04 |
| Tyramine | 1.214 | 0.196 |
5.95×10−04 |
| Octadecanamide | 1.214 | 0.296 |
5.99×10−04 |
| Guaiacol | 1.213 | 0.204 |
6.06×10−04 |
|
L-Allothreonine | 1.211 | 0.205 |
6.28×10−04 |
| L-Homoserine | 1.211 | 0.205 |
6.28×10−04 |
| Octadecanedioic
acid | 1.208 | 0.191 |
6.54×10−04 |
| Gluconolactone | 1.208 | 0.206 |
6.58×10−04 |
| Sebacic acid | 1.207 | 0.189 |
6.70×10−04 |
|
N-Oleoylethanolamine | 1.206 | 0.207 |
6.78×10−04 |
| Valeric acid | 1.206 | 0.191 |
6.78×10−04 |
| Isovaleric
acid | 1.206 | 0.198 |
2.73×10−04 |
|
345-Trimethoxycinnamic acid | 1.204 | 0.208 |
6.98×10−04 |
| Benzocaine | 1.204 | 0.211 |
6.99×10−04 |
|
3-(2-Hydroxyethyl)indole | 1.203 | 0.636 |
1.74×10−04 |
|
N-Acetyl-L-alanine | 1.198 | 0.210 |
7.64×10−04 |
| Folic acid | 1.198 | 0.211 |
7.69×10−04 |
| D-Glutamic
acid | 1.191 | 0.381 |
4.88×10−04 |
| Hydrocinnamic
acid | 1.190 | 0.176 |
8.58×10−04 |
|
1-Methyl-L-histidine | 1.182 | 0.226 |
9.68×10−04 |
|
2-Phenylacetamide | 1.177 | 0.379 |
4.75×10−05 |
| Pentadecanoic
acid | 1.171 | 0.221 |
1.13×10−03 |
| Phthalic acid | 1.169 | 0.081 |
1.01×10−02 |
| L-Pipecolic
acid | 1.169 | 0.267 |
1.16×10−03 |
| DL-O-Tyrosine | 1.164 | 0.223 |
1.24×10−03 |
| Glycylglycine | 1.157 | 0.252 |
1.62×10−03 |
| 3-Ureidopropionic
acid | 1.157 | 0.314 |
1.37×10−03 |
| Thymidine | 1.156 | 0.332 |
1.64×10−02 |
| Acetoacetic acid
lithium | 1.140 | 0.183 |
1.72×10−03 |
| Betaine | 1.140 | 0.325 |
1.72×10−03 |
| 5-Phenylvaleric
acid | 1.137 | 0.234 |
1.79×10−03 |
| Rhamnose | 1.135 | 0.282 |
1.83×10−03 |
| Cinnamic acid | 1.131 | 0.263 |
1.93×10−03 |
| Acetaminophen | 1.125 | 0.122 |
2.10×10−03 |
| Acetylglycine | 1.124 | 0.256 |
2.12×10−03 |
| Cholic acid | 1.115 | 0.244 |
2.37×10−03 |
| Terephthalic
acid | 1.113 | 0.199 |
2.42×10−03 |
|
L-Allo-isoleucine | 1.113 | 0.188 |
2.43×10−03 |
| Indoleacetic
acid | 1.100 | 0.266 |
2.85×10−03 |
| Cytidine
monophosphate | 1.097 | 0.458 |
2.97×10−03 |
| Glucose
6-phosphate | 1.092 | 0.220 |
3.12×10−03 |
|
Dehydroepiandrosterone | 1.078 | 0.258 |
3.68×10−03 |
| Mannitol | 1.073 | 0.195 |
2.37×10−04 |
| Adenine | 1.071 | 0.221 |
3.98×10−03 |
| Cuminaldehyde | 1.071 | 0.264 |
4.00×10−03 |
| Trans-Cinnamic
acid | 1.067 | 0.274 |
4.18×10−03 |
| Salicin | 1.063 | 0.264 |
4.37×10−03 |
| N-Acetylglutamic
acid | 1.061 | 0.373 |
4.44×10−03 |
| Serotonin
hydrochloride | 1.061 | 0.265 |
4.46×10−03 |
|
N-Acetylleucine | 1.056 | 0.097 |
4.70×10−03 |
| Tryptophanol | 1.049 | 0.306 |
5.10×10−03 |
| Deoxyribose | 1.039 | 0.507 |
3.23×10−02 |
|
13-Dimethyluracil | 1.037 | 0.287 |
5.77×10−03 |
| Eicosapentaenoic
acid | 1.030 | 0.287 |
6.20×10−03 |
|
L-Aspartyl-L-phenylalanine | 1.018 | 0.320 |
7.04×10−03 |
| Tryptamine | 1.015 | 0.288 |
7.26×10−03 |
| Dodecanoic
acid | 1.284 | 1.715 |
6.85×10−03 |
|
L-Phenylalanine | 1.284 |
1.885 |
5.32×10−04 |
| L-Tryptophan | 1.221 |
1.939 |
5.68×10−04 |
| L-Isoleucine | 1.217 |
2.033 |
1.80×10−04 |
| L-Leucine | 1.039 |
2.033 |
1.80×10−04 |
| Inosine | 1.020 |
2.365 |
7.24×10−03 |
| Ursodeoxycholic
acid | 1.015 | 16.743 |
5.65×10−03 |
| Table III.Altered metabolites following glial
cell line-derived neurotrophic factor deprivation for 24 h. |
Table III.
Altered metabolites following glial
cell line-derived neurotrophic factor deprivation for 24 h.
| Peak | VIP | Fold change | P-value |
|---|
| Glycylglycine | 2.347 | 0.213 |
7.17×10−04 |
| Sorbitol | 2.109 | 0.527 |
7.00×10−04 |
| Mannitol | 2.109 | 0.527 |
7.00×10−04 |
| Biotin | 2.051 | 0.337 |
1.14×10−03 |
| N-Acetylglutamic
acid | 1.913 | 0.430 |
3.13×10−03 |
| Proline | 1.633 | 0.577 |
1.57×10−02 |
|
Pyrrolidonecarboxylic acid | 1.624 | 0.542 |
1.65×10−02 |
| Indoleacetic
acid | 1.607 | 0.475 |
1.79×10−02 |
|
L-Allothreonine | 1.515 | 0.613 |
2.72×10−02 |
| L-Homoserine | 1.515 | 0.613 |
2.72×10−02 |
| D-Mannose
6-phosphate sodium salt | 1.504 | 0.656 |
2.85×10−02 |
| D-Glutamic
acid | 1.498 | 0.531 |
2.93×10−02 |
|
2-Phenylacetamide | 1.498 | 0.425 |
2.93×10−02 |
|
Methyl-L-histidine | 1.477 | 0.475 |
3.21×10−02 |
| Octadecanedioic
acid | 1.149 | 0.488 |
4.27×10−02 |
| Gluconolactone | 1.147 | 0.516 |
4.39×10−02 |
| Aminobenzoic
acid | 1.137 | 0.363 |
4.98×10−02 |
| Melibiose | 1.137 | 34.339 |
7.49×10−03 |
| Sucrose | 1.137 | 34.339 |
7.49×10−03 |
| Oxidized
glutathione | 1.104 | 1.922 |
7.84×10−04 |
| Inosine | 1.466 | 2.239 |
4.69×10−02 |
Glycylglycine rescues the
GDNF-deprivation-induced inhibition of SSCs proliferation
The effects of glycylglycine and sorbitol on the
proliferation of SSCs were investigated using a CCK-8 and an EdU
assay. SSCs were cultured in either complete medium or media
without GDNF, and treated with either glycylglycine or sorbitol.
After 5 days of treatment, the SSCs were imaged using a light
microscope (Fig. 2A). The CCK-8
assay demonstrated that the viability of SSCs decreased
significantly after GDNF deprivation. The addition of glycylglycine
partially rescued the viability of the SSCs to levels similar to
those observed in SSCs cultured in complete media, while sorbitol
treatment failed to rescue their viability (Fig. 2B). Similar results were obtained
with the EdU assay (Fig. 2C and
D).
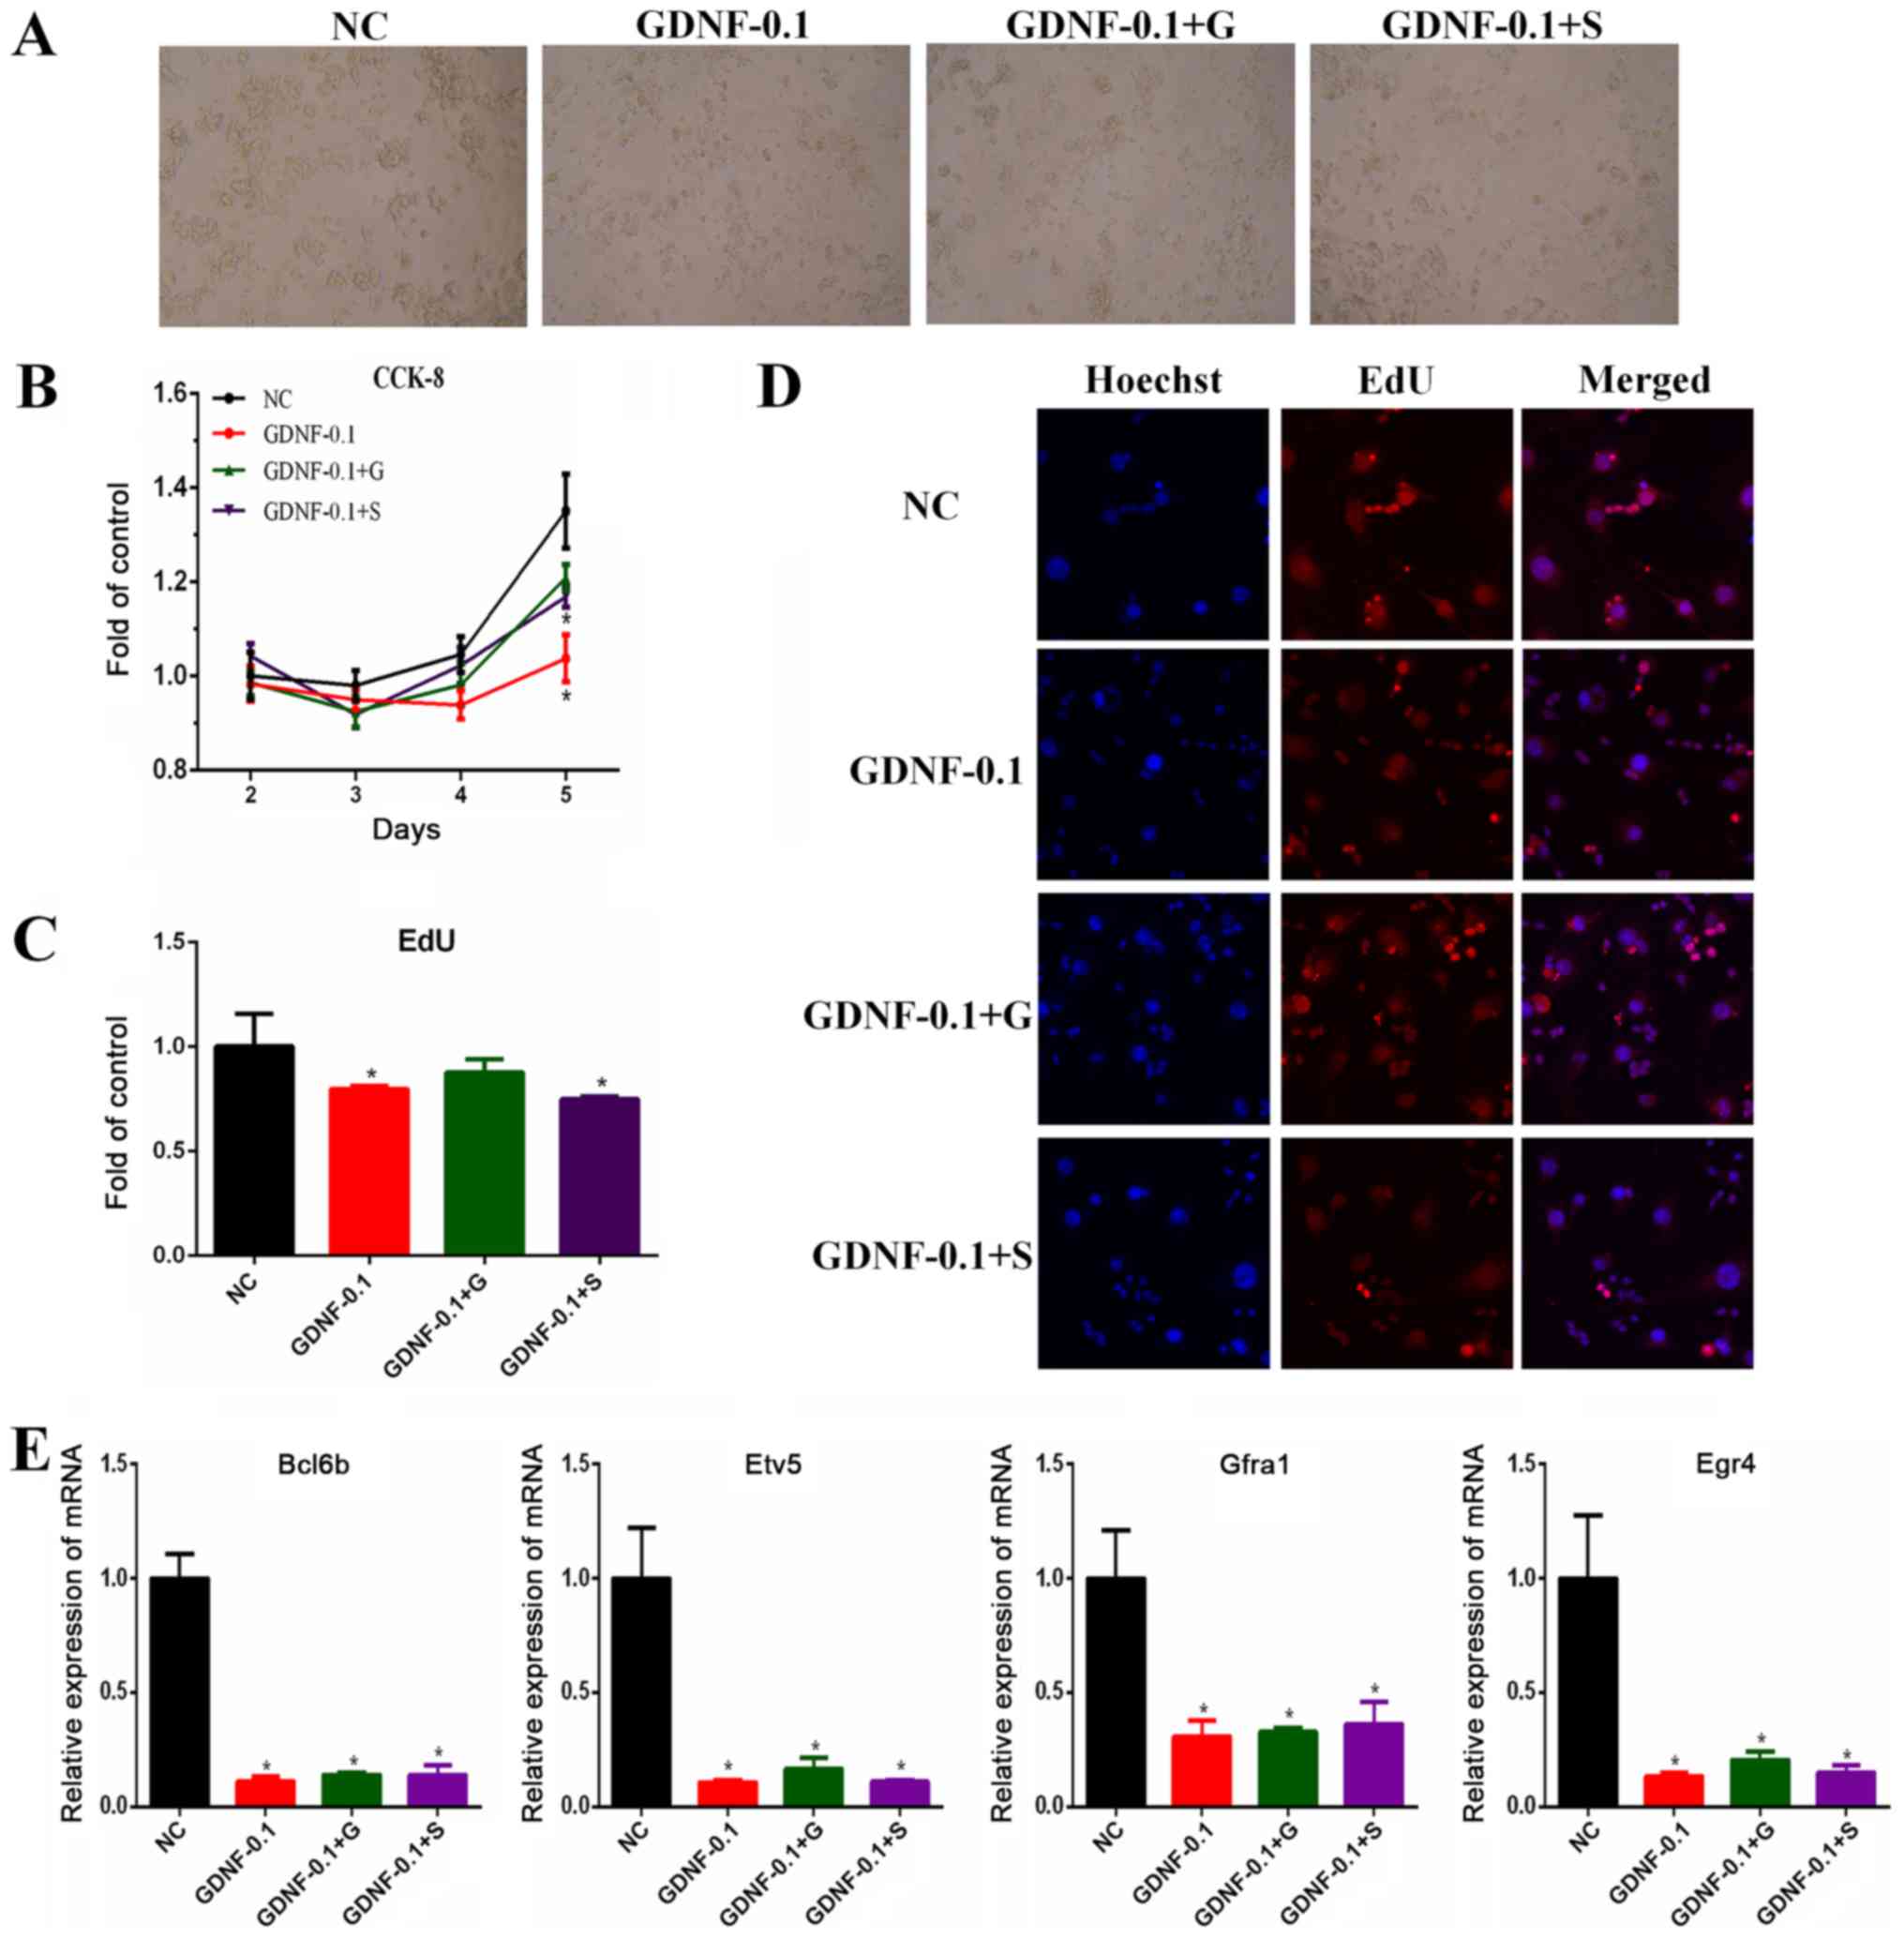 | Figure 2.Effects of glycylglycine and sorbitol
on the viability of SSCs. SSCs were exposed to complete medium
(NC), GDNF (0.1 ng/ml), GDNF (0.1 ng/ml) and glycylglycine (10 µM),
or GDNF (0.1 ng/ml) and sorbitol (10 µM). (A) Representative SSCs
images under a light microscope on day 5. Magnification, ×10
objective. (B) Cell viability was determined by CCK-8 assay. (C)
Relative cell proliferation, as assessed by EdU assay. (D) Staining
for nuclei (blue) and cell proliferation (red). Images were
acquired with the ArrayScan HCS Reader with a ×20 objective. (E)
The mRNA expression levels of self-renewal genes (Bcl6b, Etv5,
Egr4 and Gfra1) were detected by reverse
transcription-quantitative polymerase chain reaction. *P<0.05
vs. respective NC. SSCs, spermatogonial stem cells; GDNF, glial
cell line-derived neurotrophic factor; G, glycylglycine; S,
sorbitol; CCK-8, Cell Counting Kit-8; NC, control; Bcl6b,
B-cell CLL/lymphoma 6 member B; Etv5, ETS variant 5;
Egr4, early growth response protein 4; Gfra1, GDNF
family receptor α1. |
mRNA levels of self-renewal genes
(Bcl6b, Etv5, Gfra1 and Egr4) remain unaltered following rescue
with glycylglycine
The effects of glycylglycine and sorbitol on the
expression of SSCs self-renewal genes was assessed via RT-qPCR
analysis of Bcl6b, Etv5, Gfra1 and Egr4. The results
demonstrated that GDNF deprivation downregulated the expression of
the self-renewal genes of SSCs, and the addition of either
glycylglycine or sorbitol did not restore the expression of these
genes to normal levels (Fig.
2E).
Discussion
SSCs are responsible for accurately maintaining and
transmitting parental genetic information (21). The proliferation and self-renewal
of SSCs are precisely regulated by intrinsic and extrinsic signals
(22). It is well known that GDNF
serves a crucial role in regulating the proliferation of SSCs, and
that the GDNF concentration is important for maintaining the
function of SSCs (23). The
present study demonstrated that GDNF deprivation decreased the
viability of SSCs, and that this decrease in viability may be
rescued by the addition of glycylglycine.
Glycylglycine is a dipeptide of glycine, which is
the simplest amino acid. Glycine, a nonessential amino acid, is
involved in the production of DNA, phospholipids and collagen, as
well as the release of energy (24). It has also been demonstrated that
glycine serves a key role in cell proliferation, potentially
through the action of modifying enzymes (25,26).
The synthesizing enzymes serine hydroxymethyltransferase,
cytosolic, serine hydroxymethyltransferase, mitochondrial,
C-1-tetrahydrofolate synthase, cytoplasmic, and monofunctional
C1-tetrahydrofolate synthase, mitochondrial are responsible for
glycine synthesis (27).
Glycylglycine, which is used as a buffer, is a starting template
for the preparation of more complex peptides and a substrate for
the enzyme glycylglycine dipeptidase (28). Glycylglycine has been utilized in
the purification and characterization of a fructose-6-phosphate
aldolase from Escherichia coli and in the characterization
of a poly(L-malate) hydrolase from a strain of Comamonas
acidovorans (29,30). Glycylglycine has also been used in
a [35S] guanosine triphosphate-γ-S binding assay to measure the
functional coupling of G proteins with receptors (31). Sorbitol is a sugar alcohol that is
gradually metabolized by the human body (32). Previous studies reported that
sorbitol promotes proliferation in various cell types (33,34).
However, the results of the present study indicated that
glycylglycine, rather than sorbitol, may be a crucial molecule in
the GDNF-dependent proliferation of SSCs.
GDNF-induced cell signaling also serves a central
role in the self-renewal of SSCs (21). Previous studies demonstrated that
GDNF regulates self-renewal through different signaling pathways,
including but not limited to Ras/extracellular signal-regulated
kinases 1/2 (35),
mitogen-activated protein 2 kinase 1 (36) and
phosphatidylinositol-4,5-bisphosphate 3-kinase/protein kinase B
(37). Meanwhile, a number of
GDNF-associated genes, including Gfra1, Bcl6b and
Etv5, have all been determined to be involved in the
self-renewal of SSCs (36,38). The present study demonstrated that
GDNF deprivation downregulated the expression of these self-renewal
genes in cultured SSCs, and that the addition of glycylglycine or
sorbitol did not rescue their expression. Unlike what was observed
in the proliferation of SSCs, these data suggested that
glycylglycine is not involved in the self-renewal of SSCs.
Although there are various shared factors and
pathways, the proliferation and self-renewal of SSCs are regulated
differently (39). Proliferation
is an important feature of life that contributes to development and
growth via division. The self-renewal of SSCs is a unique form of
cell division in which SSCs proliferate and differentiate. This
process requires control of the cell cycle and maintenance of the
undifferentiated state (40).
In conclusion, through unbiased metabolomic
analyses, the present study identified that the production of
glycylglycine and sorbitol were significantly altered following
GDNF deprivation. While the addition of glycylglycine restored the
impaired proliferation of SSCs, the addition of sorbitol had no
effect, which suggests that glycylglycine serves an important role
in the proliferation of SSCs. This study also provided novel
insights into the mechanism underlying the proliferation of
SSCs.
Acknowledgements
The authors would like to thank Dr Lufan Li (State
Key Laboratory of Reproductive Medicine, Nanjing Medical
University) for assistance with the mouse work.
Funding
The present study was supported by the National
Natural Science Foundation (grant nos. 81602884 and 81602885); the
Science and Technology Development Foundation of Nanjing Medical
University (grant no. 2015NJMU006); and the Priority Academic
Program Development of Jiangsu Higher Education Institutions.
Availability of data and materials
The datasets generated and/or analyzed in the
present study are available from the corresponding author on
reasonable request.
Authors' contributions
BX performed the EdU experiments and drafted the
manuscript. XWe performed the experiments on spermatogonial stem
cells. MC analyzed and interpreted the metabolomic data. ZH and TD
performed the RT-qPCR experiments. KX and WH were involved in the
design of the study and manuscript revisions. YZ, KZ and XH
performed the Cell Counting Kit-8 assay, and participated in
metabolomic preparation and table preparation. XWu and YX made
substantial contributions to the study conception and design. All
authors read and approved the final manuscript.
Ethics approval and consent to
participate
This study was approved by the Animal Ethical and
Welfare Committee of Nanjing Medical University (Nanjing,
China).
Patient consent for publication
Not applicable.
Competing interests
The authors declare that they have no competing
interests.
References
|
1
|
Phillips BT, Gassei K and Orwig KE:
Spermatogonial stem cell regulation and spermatogenesis. Philos
Trans R Soc Lond B Biol Sci. 365:1663–1678. 2010. View Article : Google Scholar : PubMed/NCBI
|
|
2
|
Hofmann MC: Gdnf signaling pathways within
the mammalian spermatogonial stem cell niche. Mol Cell Endocrinol.
288:95–103. 2008. View Article : Google Scholar : PubMed/NCBI
|
|
3
|
Meng X, Lindahl M, Hyvonen ME, Parvinen M,
de Rooij DG, Hess MW, Raatikainen-Ahokas A, Sainio K, Rauvala H,
Lakso M, et al: Regulation of cell fate decision of
undifferentiated spermatogonia by GDNF. Science. 287:1489–1493.
2000. View Article : Google Scholar : PubMed/NCBI
|
|
4
|
Meng X, de Rooij DG, Westerdahl K, Saarma
M and Sariola H: Promotion of seminomatous tumors by targeted
overexpression of glial cell line-derived neurotrophic factor in
mouse testis. Cancer Res. 61:3267–3271. 2001.PubMed/NCBI
|
|
5
|
Hofmann MC, Braydich-Stolle L, Dettin L,
Johnson E and Dym M: Immortalization of mouse germ line stem cells.
Stem Cells. 23:200–210. 2005. View Article : Google Scholar : PubMed/NCBI
|
|
6
|
Kubota H, Avarbock MR and Brinster RL:
Culture conditions and single growth factors affect fate
determination of mouse spermatogonial stem cells. Biol Reprod.
71:722–731. 2004. View Article : Google Scholar : PubMed/NCBI
|
|
7
|
Horgan RP and Kenny LC:
‘Omic'technologies: Genomics, transcriptomics, proteomics and
metabolomics. Obstetrician Gynaecol. 13:189–195. 2011. View Article : Google Scholar
|
|
8
|
Ito K and Suda T: Metabolic requirements
for the maintenance of self-renewing stem cells. Nat Rev Mol Cell
Biol. 15:243–256. 2014. View
Article : Google Scholar : PubMed/NCBI
|
|
9
|
Panopoulos AD, Yanes O, Ruiz S, Kida YS,
Diep D, Tautenhahn R, Herrerias A, Batchelder EM, Plongthongkum N,
Lutz M, et al: The metabolome of induced pluripotent stem cells
reveals metabolic changes occurring in somatic cell reprogramming.
Cell Res. 22:168–177. 2012. View Article : Google Scholar : PubMed/NCBI
|
|
10
|
Yanes O, Clark J, Wong DM, Patti GJ,
Sanchez-Ruiz A, Benton HP, Trauger SA, Desponts C, Ding S and
Siuzdak G: Metabolic oxidation regulates embryonic stem cell
differentiation. Nat Chem Biol. 6:411–417. 2010. View Article : Google Scholar : PubMed/NCBI
|
|
11
|
Xu B, Chen M, Ji X, Mao Z, Zhang X, Wang X
and Xia Y: Metabolomic profiles delineate the potential role of
glycine in gold nanorod-induced disruption of mitochondria and
blood-testis barrier factors in TM-4 cells. Nanoscale. 6:8265–8273.
2014. View Article : Google Scholar : PubMed/NCBI
|
|
12
|
Shen H, Xu W, Zhang J, Chen M, Martin FL,
Xia Y, Liu L, Dong S and Zhu YG: Urinary metabolic biomarkers link
oxidative stress indicators associated with general arsenic
exposure to male infertility in a han chinese population. Environ
Sci Technol. 47:8843–8851. 2013.PubMed/NCBI
|
|
13
|
Kubota H and Brinster RL: Culture of
rodent spermatogonial stem cells, male germline stem cells of the
postnatal animal. Methods Cell Biol. 86:59–84. 2008. View Article : Google Scholar : PubMed/NCBI
|
|
14
|
Wei X, Jia Y, Xue Y, Geng L, Wang M, Li L,
Wang M, Zhang X and Wu X: GDNF-expressing STO feeder layer supports
the long-term propagation of undifferentiated mouse spermatogonia
with stem cell properties. Sci Rep. 6:367792016. View Article : Google Scholar : PubMed/NCBI
|
|
15
|
Xu B, Chen M, Ji X, Yao M, Mao Z, Zhou K,
Xia Y, Han X and Tang W: Metabolomic profiles reveal key metabolic
changes in heat stress-treated mouse Sertoli cells. Toxicol In
Vitro. 29:1745–1752. 2015. View Article : Google Scholar : PubMed/NCBI
|
|
16
|
Yuan B, Wu W, Chen M, Gu H, Tang Q, Guo D,
Chen T, Chen Y, Lu C, Song L, et al: From the Cover: Metabolomics
reveals a role of betaine in prenatal DBP exposure-induced
epigenetic transgenerational failure of spermatogenesis in Rats.
Toxicol Sci. 158:356–366. 2017. View Article : Google Scholar : PubMed/NCBI
|
|
17
|
Gika HG, Macpherson E, Theodoridis GA and
Wilson ID: Evaluation of the repeatability of ultra-performance
liquid chromatography-TOF-MS for global metabolic profiling of
human urine samples. J Chromatogr B Analyt Technol Biomed Life Sci.
871:299–305. 2008. View Article : Google Scholar : PubMed/NCBI
|
|
18
|
L Eriksson, T Byrne, E Johansson, J Trygg
and C Vikström: Multi-and megavariate data analysis basic
principles and applications.
|
|
19
|
Cai Z, Zhao JS, Li JJ, Peng DN, Wang XY,
Chen TL, Qiu YP, Chen PP, Li WJ, Xu LY, et al: A combined
proteomics and metabolomics profiling of gastric cardia cancer
reveals characteristic dysregulations in glucose metabolism. Mol
Cell Proteomics. 9:2617–2628. 2010. View Article : Google Scholar : PubMed/NCBI
|
|
20
|
Livak KJ and Schmittgen TD: Analysis of
relative gene expression data using real-time quantitative PCR and
the 2(-Delta Delta C(T)) method. Methods. 25:402–408. 2001.
View Article : Google Scholar : PubMed/NCBI
|
|
21
|
Kubota H, Avarbock MR and Brinster RL:
Growth factors essential for self-renewal and expansion of mouse
spermatogonial stem cells. Proc Natl Acad Sci USA. 101:16489–16494.
2004. View Article : Google Scholar : PubMed/NCBI
|
|
22
|
Mei XX, Wang J and Wu J: Extrinsic and
intrinsic factors controlling spermatogonial stem cell self-renewal
and differentiation. Asian J Androl. 17:347–54. 2015.PubMed/NCBI
|
|
23
|
Meng X, Lindahl M, Hyvönen ME, Parvinen M,
de Rooij DG, Hess MW, Raatikainen-Ahokas A, Sainio K, Rauvala H,
Lakso M, et al: Regulation of cell fate decision of
undifferentiated spermatogonia by GDNF. Science. 287:1489–93. 2000.
View Article : Google Scholar : PubMed/NCBI
|
|
24
|
Cao M, Zhao L, Chen H, Xue W and Lin D:
NMR-based metabolomic analysis of human bladder cancer. Anal Sci.
28:451–456. 2012. View Article : Google Scholar : PubMed/NCBI
|
|
25
|
Jain M, Nilsson R, Sharma S, Madhusudhan
N, Kitami T, Souza AL, Kafri R, Kirschner MW, Clish CB and Mootha
VK: Metabolite profiling identifies a key role for glycine in rapid
cancer cell proliferation. Science. 336:1040–1044. 2012. View Article : Google Scholar : PubMed/NCBI
|
|
26
|
Ding J, Li T, Wang X, Zhao E, Choi JH,
Yang L, Zha Y, Dong Z, Huang S, Asara JM, et al: The histone H3
methyltransferase G9A epigenetically activates the serine-glycine
synthesis pathway to sustain cancer cell survival and
proliferation. Cell Metab. 18:896–907. 2013. View Article : Google Scholar : PubMed/NCBI
|
|
27
|
Tedeschi PM, Markert EK, Gounder M, Lin H,
Dvorzhinski D, Dolfi SC, Chan LL, Qiu J, DiPaola RS, Hirshfield KM,
et al: Contribution of serine, folate and glycine metabolism to the
ATP, NADPH and purine requirements of cancer cells. Cell Death Dis.
4:e8772013. View Article : Google Scholar : PubMed/NCBI
|
|
28
|
Tsuboi KK, Penefsky ZJ and Hudson PB:
Enzymes of the human erythrocyte. III. Tripeptidase, purification
and specific properties. Arch Biochem Biophys. 68:54–68. 1957.
View Article : Google Scholar : PubMed/NCBI
|
|
29
|
Gödde C, Liebergesell M and Steinbüchel A:
Isolation of poly(beta-L-malic acid)-degrading bacteria and
purification and characterization of the PMA hydrolase from
Comamonas acidovorans strain 7789. FEMS Microbiol Lett.
173:365–372. 1999. View Article : Google Scholar : PubMed/NCBI
|
|
30
|
Schneider S, Sandalova T, Schneider G,
Sprenger GA and Samland AK: Replacement of a phenylalanine by a
tyrosine in the active site confers fructose-6-phosphate aldolase
activity to the transaldolase of Escherichia coli and human origin.
J Biol Chem. 283:30064–72. 2008. View Article : Google Scholar : PubMed/NCBI
|
|
31
|
Happe HK, Bylund DB and Murrin LC:
Agonist-stimulated [35S]GTPgammaS autoradiography: Optimization for
high sensitivity. Eur J Pharmacol. 422:1–13. 2001. View Article : Google Scholar : PubMed/NCBI
|
|
32
|
Kava R, Meister K and Kroger M:
Low-calorie sweeteners and other sugar substitutes: A review of the
safety issues. Comprehensive Rev Food Sci Food Safety. 5:35–47.
2006. View Article : Google Scholar
|
|
33
|
Graier WF, Grubenthal I, Dittrich P,
Wascher TC and Kostner GM: Intracellular mechanism of high
D-glucose-induced modulation of vascular cell proliferation. Eur J
Pharmacol. 294:221–229. 1995. View Article : Google Scholar : PubMed/NCBI
|
|
34
|
Turner JL and Bierman EL: Effects of
glucose and sorbitol on proliferation of cultured human skin
fibroblasts and arterial smooth-muscle cells. Diabetes. 27:583–588.
1978. View Article : Google Scholar : PubMed/NCBI
|
|
35
|
He Z, Jiang J, Kokkinaki M, Golestaneh N,
Hofmann MC and Dym M: Gdnf upregulates c-Fos transcription via the
Ras/Erk1/2 pathway to promote mouse spermatogonial stem cell
proliferation. Stem Cells. 26:266–278. 2008. View Article : Google Scholar : PubMed/NCBI
|
|
36
|
Ishii K, Kanatsu-Shinohara M, Toyokuni S
and Shinohara T: FGF2 mediates mouse spermatogonial stem cell
self-renewal via upregulation of Etv5 and Bcl6b through MAP2K1
activation. Development. 139:1734–1743. 2012. View Article : Google Scholar : PubMed/NCBI
|
|
37
|
Wu X, Oatley JM, Oatley MJ, Kaucher AV,
Avarbock MR and Brinster RL: The POU domain transcription factor
POU3F1 is an important intrinsic regulator of GDNF-induced survival
and self-renewal of mouse spermatogonial stem cells. Biol Reprod.
82:1103–1111. 2010. View Article : Google Scholar : PubMed/NCBI
|
|
38
|
Wu X, Goodyear SM, Tobias JW, Avarbock MR
and Brinster RL: Spermatogonial stem cell self-renewal requires
ETV5-mediated downstream activation of Brachyury in mice. Biol
Reprod. 85:1114–1123. 2011. View Article : Google Scholar : PubMed/NCBI
|
|
39
|
Puglisi MA, Tesori V, Lattanzi W,
Gasbarrini GB and Gasbarrini A: Colon cancer stem cells:
Controversies and perspectives. World J Gastroenterol.
19:2997–3006. 2013. View Article : Google Scholar : PubMed/NCBI
|
|
40
|
Chen T, Heller E, Beronja S, Oshimori N,
Stokes N and Fuchs E: An RNA interference screen uncovers a new
molecule in stem cell self-renewal and long-term regeneration.
Nature. 485:104–108. 2012. View Article : Google Scholar : PubMed/NCBI
|