Introduction
Lung cancer has both high prevalence and a high
mortality, with over 2 million new diagnoses and 1.7 million
cancer-related deaths per year (1). The most common types are lung
adenocarcinoma (LUAD) and lung squamous cell carcinoma (LUSC). LUAD
has a high prevalence (2–4) with a 40% contribution to all
diagnosed cases of lung cancer (5). Despite improvements in clinical
prognosis due to advances in diagnostic methods, surgery, and
adjuvant and molecular therapeutics (6), the five-year survival rates remain
low (7,8).
Tumor markers in patient sera are frequently
employed for the diagnosis and differential diagnosis of lung
cancer. These include carcinoembryonic antigen (CEA),
cytokeratin-19-fragment (CYFRA21-1), squamous cell carcinoma
antigen, neuron-specific enolase, and pro-gastrin-releasing peptide
(9,10). CEA and CYFRA21-1 have been revealed
to be markedly increased in the sera of patients with LUAD and to
be associated with pathological types and clinical stage (11). In addition, CYFRA21-1 or CEA in the
serum may also be used as a marker for evaluating the efficacy of
immunotherapy in LUAD (12). The
use of marker combinations can also improve the sensitivity and
accuracy of diagnosis, as well as the accuracy of distinguishing
between different tissue types (10). However, serum levels of CEA
(13) and CYFRA21-1 are often
increased in other cancers and non-cancer diseases, and the
sensitivity of a single marker for lung cancer screening was
identified to be <65% (14).
These issues may lead to false-positive/negative results.
Furthermore, other traditional diagnostic techniques lack
sufficient sensitivity and specificity for early diagnosis. These
include computed tomography, fiberoptic bronchoscopy and chest
radiography (11). Therefore, the
search for additional markers for use in combined diagnosis is of
great importance in LUAD.
Next-generation sequencing has created new avenues
for studying the genomic, transcriptomic, and epigenomic features
of tumors (15). Network analysis,
in particular, can be used to apply systems biology methodologies
for the successful integration of data from multiple large-scale
databases containing data on cancers and other complex human
diseases. It allows the investigation and analysis of processes in
terms of molecular interactions (16–19).
For instance, weighted gene co-expression network analysis (WGCNA),
a systems-biology approach, is an accurate and effective approach
for multi-gene research (20–22).
The R package ‘WGCNA’ can be used to analyze the various components
of the weighted correlation network analysis (20,23).
Associations between multiple genes or across clinical samples and
expression profiles can be examined through scale-free networking
(20). WGCNA is frequently used to
identify key hub genes and modules in multiple tumor types. A
previous study used competitive endogenous RNA (ceRNA) network
analysis and WGCNA to determine hub genes associated with breast
cancer prognosis (24). In another
study, 21 key genes that could act as possible therapeutic targets
in hepatocellular carcinoma were identified using WGCNA (25). Furthermore, in a previous study the
top 10 hub genes related to poor patient prognosis in glioblastoma
were identified using WGCNA (26).
In the present study, WGCNA was used for the identification of five
novel LUAD-associated hub genes and one was selected to verify its
biological function.
RNA sequencing data on LUAD tissues were obtained
from The Cancer Genome Atlas (TCGA), and differentially expressed
genes (DEGs) between LUAD and adjacent healthy tissue were
identified. Functions of the DEGs were examined and WGCNA was
employed to identify associations between gene expression and
clinical features. Hub genes were verified with survival analysis,
and were validated against other databases. The results of the
present study offer new insights into LUAD pathogenesis and the
five identified hub genes may have potential as markers or drug
targets for treating LUAD.
Materials and methods
Data collection and handling
Data, including information on clinical features and
RNA sequencing, were obtained from TCGA-LUAD dataset on the UCSC
Xena website (https://xena.ucsc.edu/). The RNA
sequencing data were derived from 517 tumor and 59 normal tissues.
Tissues from non-primary tumors and outlier samples were excluded
through principal component analysis (PCA), performed by ‘stats’
package in R (v. 3.6.0; developed by the R core team and
contributors worldwide). Specifically, gene expression profiling
was normalized by z-scores, and further dimensionality reduction
analysis was conducted using the ‘prcomp’ function to obtain the
corresponding matrix. Clinical parameters, including sex, smoking
history, stage and histological type, were analyzed using
chi-square tests (Table I). The
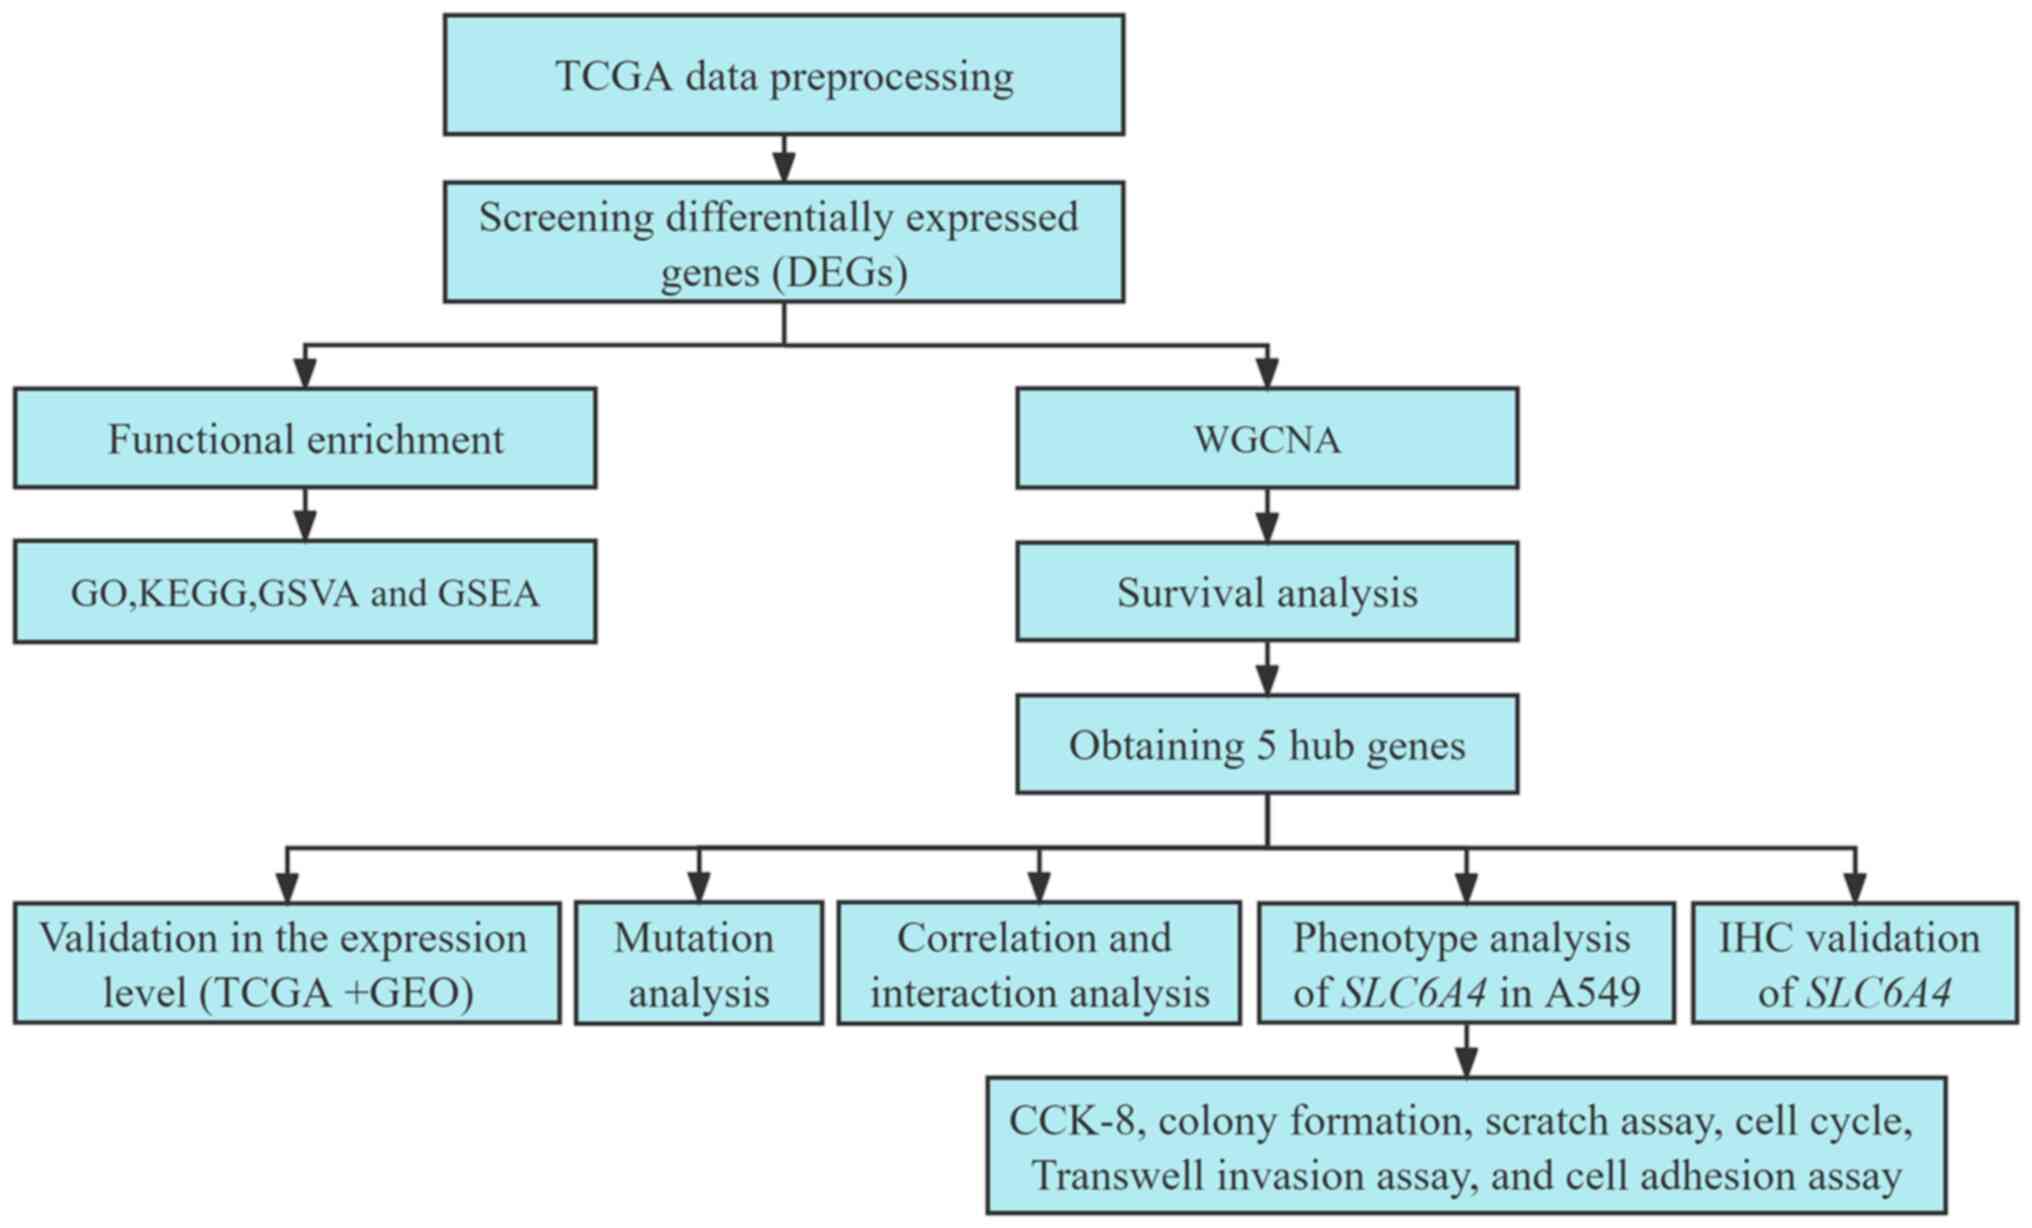
procedures used in the present study are revealed in Fig. 1.
 | Table I.Clinical data and number of samples
for The Cancer Genome Atlas lung adenocarcinoma dataset. |
Table I.
Clinical data and number of samples
for The Cancer Genome Atlas lung adenocarcinoma dataset.
| Parameters | Living (n=332) | Deceased
(n=188) | Total (n=520) | P-value |
|---|
| Age, years |
|
|
| 0.34a |
| Median
(min-max) | 66.00 (33–87) | 67.00 (40–88) | 66.00 (33–88) |
|
| Sex |
|
|
| 0.60 |
|
Female | 181 (34.81) | 98 (18.85) | 279 (53.65) |
|
|
Male | 151 (29.04) | 90 (17.31) | 241 (46.35) |
|
| Smoking
history |
|
|
| 0.74 |
|
Lifelong non-smoker | 47 (9.29) | 28 (5.53) | 75 (14.82) |
|
| Current
smoker | 79 (15.61) | 43 (8.50) | 122 (24.11) |
|
| Current
reformed smoker for >15 years | 94 (18.58) | 42 (8.30) | 136 (26.88) |
|
| Current
reformed smoker for ≤15 years | 105 (20.75) | 64 (12.65) | 169 (33.40) |
|
| Current
reformed smoker, duration not specified | 3 (0.59) | 1 (0.20) | 4 (0.79) |
|
| Stage |
|
|
|
8.80×10⁻⁹ |
| I | 210 (41.02) | 69 (13.48) | 279 (54.49) |
|
| II | 69 (13.48) | 54 (10.55) | 123 (24.02) |
|
|
III | 37 (7.23) | 47 (9.18) | 84 (16.41) |
|
| IV | 10 (1.95) | 16 (3.13) | 26 (5.08) |
|
| Histological
type |
|
|
| 0.07b |
| Lung
acinar adenocarcinoma | 16 (3.08) | 2 (0.38) | 18 (3.46) |
|
| Lung
adenocarcinoma mixed subtype | 71 (13.65) | 36 (6.92) | 107 (20.58) |
|
| Lung
adenocarcinoma-not otherwise specified | 192 (36.92) | 133 (25.58) | 325 (62.50) |
|
| Lung
bronchioloalveolar carcinoma mucinous | 4 (0.77) | 1 (0.19) | 5 (0.96) |
|
| Lung
bronchioloalveolar carcinoma non-mucinous | 14 (2.69) | 5 (0.96) | 19 (3.65) |
|
| Lung
clear cell adenocarcinoma | 2 (0.38) | 0 | 2 (0.38) |
|
| Lung
micropapillary adenocarcinoma | 2 (0.38) | 1 (0.19) | 3 (0.58) |
|
| Lung
mucinous adenocarcinoma | 2 (0.38) | 0 | 2 (0.38) |
|
| Lung
papillary adenocarcinoma | 16 (3.08) | 7 (1.35) | 23 (4.42) |
|
| Lung
signet ring adenocarcinoma | 0 | 1 (0.19) | 1 (0.19) |
|
| Lung
solid pattern predominant adenocarcinoma | 5 (0.96) | 0 | 5 (0.96) |
|
|
Mucinous (colloid)
carcinoma | 8 (1.54) | 2 (0.38) | 10 (1.92) |
|
DEG identification and functional
enrichment
The ‘limma’ package in R (v. 3.40.6), a generalized
linear model-based differential expression screening application,
was used for DEG identification (27). Gene expression was examined with
linear regression with the ‘lmFit’ function. The ‘eBayes’ function
was used to calculate moderated F-stastistics, moderated
t-statistics, and log-odds of differential expression based on the
empirical Bayes moderation of standard errors. Gene significance
levels were determined. DEGs were identified using log2
(fold change) with the criteria of |log2 (fold change)|
>1 and P<0.01. R was used for preparing volcano plots.
Functional analysis of the DEGs was undertaken with
Gene Ontology (GO) and Kyoto Encyclopedia of Genes and Genomes
(KEGG) using the ‘clusterProfiler’ (v. 3.14.3) package in R
(27). The GO database has the
following categories: Cellular component (CC), biological process
(BP), and molecular function (MF). The file containing the DEGs was
used as the foreground and the full list of genes was added as the
background along with an annotation information file. P-values
<0.05 were considered statistically significant.
To examine changes in signaling pathways between
tumors and normal tissues, Gene Set Variation Analysis (GSVA;
v.1.40.1; http://bioconductor.org/packages/release/bioc/html/GSVA.html)
was performed based on KEGG gene-set from molecular signature
database (MSigDB; http://www.gsea-msigdb.org/gsea/msigdb) using the
‘GSVA’ R package. Differences between groups in the same dataset
were analyzed with Gene Set Enrichment Analysis (GSEA; http://www.gsea-msigdb.org/gsea/index.jsp).
WGCNA
The ‘WGCNA’ package (v.1.72.1) in R was used for
construction of the DEG co-expression network (20,28).
Initially, Pearson's correlation coefficient matrices and average
linkage were created across the entirety of pair-wise gene
comparisons. Subsequently, a weighted adjacency matrix was created
employing the power function A_mn=|C_mn|^β (C_mn=Pearson's
correlation across genes m and n; A_mn=adjacency across genes m and
n). Utilizing the ‘pickSoftThreshold’ function of ‘WGCNA’ package,
a suitable soft threshold power (β) guaranteed scale-free
networking, emphasizing strong gene-gene correlations while
penalizing poor correlations. Finally, the adjacency matrix was
changed to a topological overlap matrix (TOM) to assess the
connectivity within the gene network. The related dissimilarity was
calculated as 1-TOM. Genes with the same expression patterns were
grouped by average linkage hierarchical clustering. Each gene group
contained at least 30 for incorporation into the dendrogram using
the TOM-based dissimilarity metric (29,30).
The module eigengene, obtained by performing PCA on
all genes within a module, was used to describe the overall gene
expression within that module (15). To identify clinically significant
modules, associations across module eigengenes and clinical
features were assessed. Linear correlations between clinical
parameters and gene expression profiles were attributed a gene
significance (GS) value. Module membership (MM) was obtained by
examining correlations between the expression of the genes within
the module and module eigengenes. The key genes of the module were
assumed to be connected with LUAD if the GS was highly associated
with MM (31,32). These central genes were considered
alternative hub genes.
Survival analysis
Initially, 19 hub-gene expression profiles/prognosis
datasets were obtained for 488 LUAD specimens. After integration of
survival time/status with gene expression profiles using the R
‘survival’ package (v.3.3.5; http://github.com/therneau/survival), univariate Cox
regression was performed to assess each gene's prognostic value. In
addition, survival differences between patients with increased and
decreased expression were analyzed using Kaplan-Meier survival
curves with medians as cut-offs. A gene was considered a hub gene
if the log-rank test yielded a P-value <0.05.
Bioinformatics validation
The respective levels of hub genes in the tumor and
control tissues were analyzed in datasets from TCGA/Genotype-Tissue
Expression (GTEx; v.8; http://gtexportal.org/home/). The Gene Expression
Omnibus (GEO) GSE116959 dataset (33) was used for validation.
Non-parametric tests were used with differences considered
statistically significant at P<0.05.
Correlation and interaction
analysis
Based on the expression profile used in the current
investigation, Spearman's correlation analysis was performed using
GraphPad Prism (v.8.0.2; GraphPad Software, Inc.) between the five
hub genes and tumor suppressor genes (RB1, TP53 and
PTEN). Additionally, the analysis in STRING (v. 11.5;
http://cn.string-db.org/) was conducted to
determine whether there is an interaction between them.
Mutation analysis
The LUAD dataset was accessed and analyzed on the
cBioPortal website (https://www.cbioportal.org/). To this end, 566 samples
from the ‘Lung Adenocarcinoma (TCGA; Pan-Cancer Atlas)’ dataset
were used to analyze genetic alterations and transcriptomic
expression z-scores (RNA Seq V2 RSEM) in the hub genes.
Additionally, Mutation-Mapper tools in cBioPortal were used for
visualizing the mutation landscape of the hub genes.
Immunohistochemistry (IHC)
The downregulated gene SLC6A4 with the
greatest difference was selected for immunohistochemical
verification. IHC was carried out on tumors and paired normal
tissues obtained from three patients with LUAD. Tissue sections
were purchased from Wuhan Shuangxuan Biotechnology Co., Ltd.
(http://www.whshuangxuan.com/h-pd-23.html; cat. no.
IWLT-N-106AL94). IHC on the tissue sections was performed by
Guangxi Kingmed Diagnostics Group Co., Ltd. (author JW was involved
in the staining of the tissues). The tissues were fixed in 10%
formalin (1 h, room temperature), paraffin-embedded and cut into
2–3 µm sections, which were mounted on adhesion microscope slides
(CITOGLAS; Jiangsu Shitai) and left at 70–80°C for 20 min. The
adhesion microscope slides were then deparaffinized in xylene,
followed by rehydration in an alcohol gradient and rinsing with tap
water and antigen retrieval in Tris-EDTA, pH 9.0. Following washing
with tap water, the sections were submerged in peroxidase blocking
reagent (3% H2O2) at room temperature for 20
min. The sections were incubated with an anti-SLC6A4 antibody
(1:100 dilution; cat. no. 19559-1-AP; ProteinTech Group, Inc.) for
30 min at 37°C. Antibody binding was detected using the ‘Novolink
Max Polymer Detection System’ (Leica Biosystems, Inc.), in which
incubation was performed for 30 min at 37°C using ready-to-use
HRP-conjugated secondary antibodies (cat. no. RE7161; ready to use;
Leica Biosystems, Inc.). The sections were counterstained with
hematoxylin for 1 min at room temperature. Finally, the IHC images
were captured under a light microscope.
Cell culture and transfection
Human lung adenocarcinoma A549 cells (MeisenCTCC;
cat. no. CTCC-001-0036) overexpressing SLC6A4 were cultured
in DMEM (MeisenCTCC; cat. no. CTCC-002-008). Media were enriched
with 10% fetal bovine serum (NEWZERUM, Ltd.) with 100 U/ml
penicillin and 0.1 mg/ml streptomycin. Cells were grown at 37°C in
a humid incubator plus 5% CO2. The SLC6A4
expression plasmid was constructed by subcloning PCR-amplified
SLC6A4 cDNA (YouBio; cat. no. G158402) into the pHAGE-flag
vector. For transfection, A549 cells at ~80% confluence were
transfected with plasmids with Lipofectamine™ 2000 (Invitrogen;
Thermo Fisher Scientific, Inc.) according to the manufacturer's
instructions. An empty vector was used for the control. In the
following experiments, ‘Flag_SLC6A4’ represents the exogenous
expression of SLC6A4, where ‘Flag’ (amino acid sequence:
DYKDDDDK) is a fusion tag.
Western blot analysis
Cells were collected 36–48 h after transfection.
Cells were lysed using SDS lysis buffer (0.05 mol/l Tris-HCl, pH
6.8, 2% SDS and 10% glycerol) for 10 min at 95°C. The protein
concentration was measured using a bicinchoninic acid (BCA) protein
assay kit (cat. no. BL521A; Biosharp Life Sciences). The proteins
(30–50 µg) were separated by 10% SDS-PAGE and transferred to PVDF
membranes (product no. IPVH00010; MilliporeSigma). Following
blocking with 5% skimmed milk for 1 h at room temperature, the
membranes were incubated with primary antibodies against SLC6A4
(1:1000 dilution; cat. no. 19559-1-AP; ProteinTech Group, Inc.) and
GAPDH (1:5,000 dilution; cat. no. AG8015; Beyotime Institute of
Biotechnology) overnight at 4°C. The blots were then probed with
HRP-conjugated secondary antibodies (1:2,000 dilution; cat. no.
A0208; Beyotime Institute of Biotechnology) for 60 min at room
temperature. Subsequent to washing with TBST, immunoreactive
proteins were visualized using enhanced chemiluminescent (ECL) kit
(BeyoECL Star; cat.no. P0018AM; Beyotime Institute of
Biotechnology) and imaged by chemiluminescence (Tanon 5200; Tanon
Science and Technology Co., Ltd.).
Cell Counting Kit-8 (CCK-8)
Cell proliferation was evaluated using CCK-8
(Biosharp Life Sciences), following the provided instructions.
Cells (500 per well) were added into 96-well plates. The CCK-8
solution (1:10 diluted with DMEM) was added to each well after 8 h
of incubation. At time periods spanning from 1 to 3 h after
incubation (37°C), the absorbance at 450 nm was read using a
microplate reader.
Colony formation
Colony formation was assessed in
SLC6A4-overexpressing A549 cells. For both the experimental
and control groups, the same number of cells (400/well) was seeded
into six-well plates and grown for 14 days, after which colonies
were fixed with 4% paraformaldehyde (30 min, room temperature) and
stained with 0.025% crystal violet (15 min, room temperature),
followed by two washes with PBS. The number of colonies with >50
cells was counted under a microscope. Images of colony formation
were captured using a camera (BRQ-AN00; Huawei).
Scratch assay (wound-healing
assay)
Cells were allowed to grow in six-well plates until
90% confluent. A micropipette tip (200-µl) was employed to create a
straight scratch in the monolayer, and free-floating cells and
debris were gently removed with PBS. Cells were then cultured in
serum-free medium. An inverted fluorescence microscope (MF52-N;
Guangzhou Micro-shot Technology Co., Ltd.) was used to observe and
image the cells at 0, 24 and 48 h. The results were analyzed using
ImageJ software (v.1.51; National Institutes of Health).
Cell cycle
Single cell resuspensions (1×10⁶
cells/ml) were washed with pre-cooled PBS before being gently mixed
using pre-cooled 70% ethanol and fixed for 4 h at 4°C. Following
fixation and washing, cells were stained with 500 µl PI/RNase A
(Biosharp Life Sciences) at 37°C for 30 min in the dark. Cell cycle
distributions were examined with flow cytometry (FACSCantoII; BD
Biosciences) and analyzed with Flowjo software (v.7.6.1; BD
Biosciences).
Transwell invasion assay
A Transwell chamber (Corning, Inc.) pre-coated (2 h,
37°C) with Matrigel (Beyotime Institute of Biotechnology) was used
for the Transwell invasion assay. A total of 500 µl of DMEM with
40% FBS were placed into the lower chamber, and cells
(4×10⁴ cells/well) in serum-free DMEM were placed in the
upper chamber. Following incubation for 24 h at 37°C, the cells on
the lower surface were fixed with 4% paraformaldehyde (Beijing
Solarbio Science & Technology Co., Ltd.) for 10 min at room
temperature and stained with 0.1% crystal violet for 15 min at room
temperature. Cells on the lower surface were imaged under an
inverted microscope.
Cell adhesion assay
For the cell adhesion assay, 96-well plates were
coated with 20 µg/ml fibronectin (50 µl per well, overnight at room
temperature; Beijing Solarbio Science & Technology Co., Ltd.).
After washing with PBS and the addition of 200 µl of 1%
heat-denatured BSA, the plate was allowed to stand for 1 h at 37°C.
Cells (4×10⁴ cells per well) were inoculated into the
plates and settled at 37°C for 1 h before rinsing in PBS, fixing,
staining and imaging as above in the section on the Transwell
invasion assay.
Statistical analysis
All in vitro experiments were repeated at
least 3 times. The mean ± standard deviation was used to present
the data. The unpaired t-test was performed to compare two groups
with a normal-distribution. Statistical analysis was conducted
using GraphPad Prism (v. 8.0.2; GraphPad Software, Inc.). P<0.05
was considered to indicate a statistically significant
difference.
Results
Data collection and preprocessing
Data on gene expression were obtained for 576 tissue
samples, including 59 normal and 517 tumor samples. The final
dataset was filtered using PCA, resulting in the exclusion of 17
tumor samples and 1 normal sample (Fig. S1). The first two principal
components, which accounted for 10.59% (first component, PCA1) and
5.66% (second component, PCA2) of the differences observed,
successfully distinguished tumors from normal samples. The
expression profiles of 558 specimens were then used for further
analyses.
DEG identification and enrichment
analysis
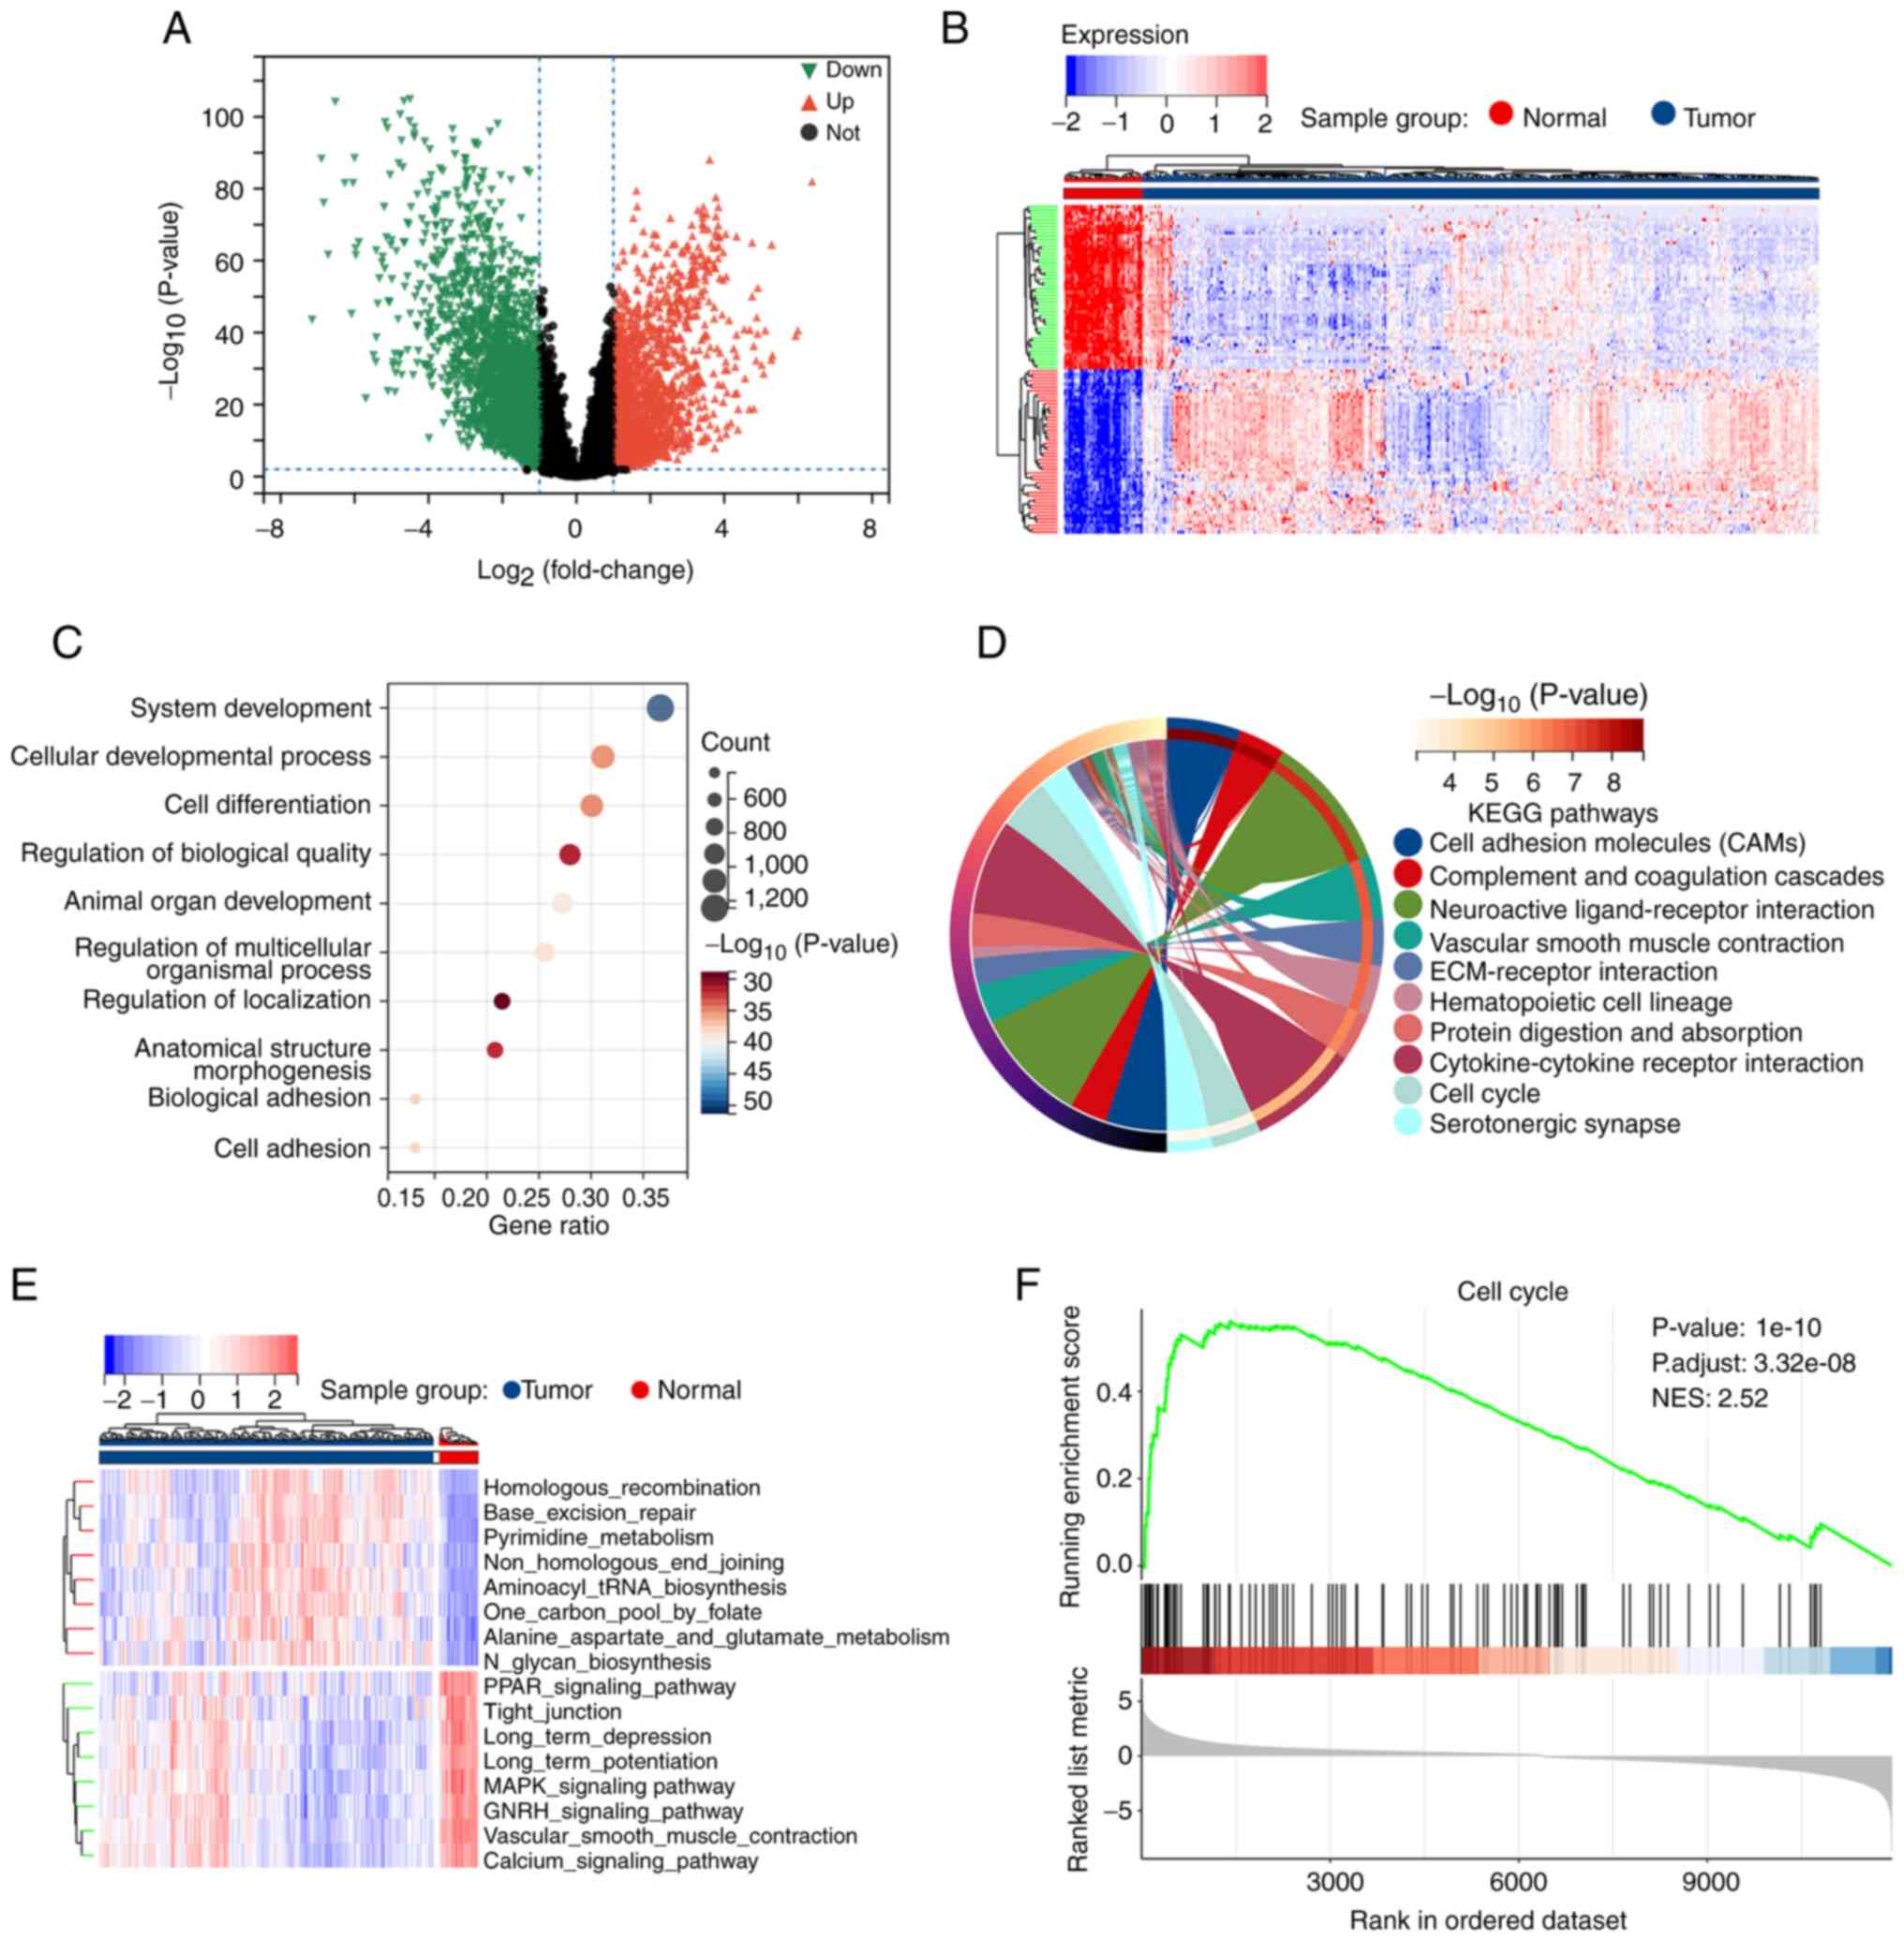
Overall, 4,485 DEGs were identified between the 58
normal and 500 tumor samples. Of these, 2,628 were downregulated
and 1,857 were upregulated (Fig. 2A
and B). GO evaluation revealed that the DEGs were primarily
enriched in the BP categories of ‘system development’, ‘cellular
development process’, ‘cell differentiation’, and ‘cell adhesion’
(Fig. 2C). In addition, they were
also enriched in several key terms in the MF and CC modules
(Fig. S2). KEGG enrichment
analysis identified signaling pathways related to ‘cell adhesion
molecules’, ‘cell cycle’, and ‘cytokine-cytokine receptor
interaction’ (Fig. 2D). For
further investigation, GSVA and GSEA were conducted and the
differences in pathway profiles between the tumor and normal
samples were analyzed. Numerous differentially expressed pathways
were identified using GSVA, including the MAPK signaling pathway,
cell cycle, and cell adhesion molecules (Fig. 2E and Table SI). GSEA revealed that the pathway
associated with cell adhesion molecules was significantly
downregulated in tumors (Fig. S3)
whereas that of the cell cycle was significantly upregulated
(Fig. 2F). These findings
supported known LUAD dysfunctions, demonstrating the accuracy of
the findings of the present study.
WGCNA
Constructing a scale-free network
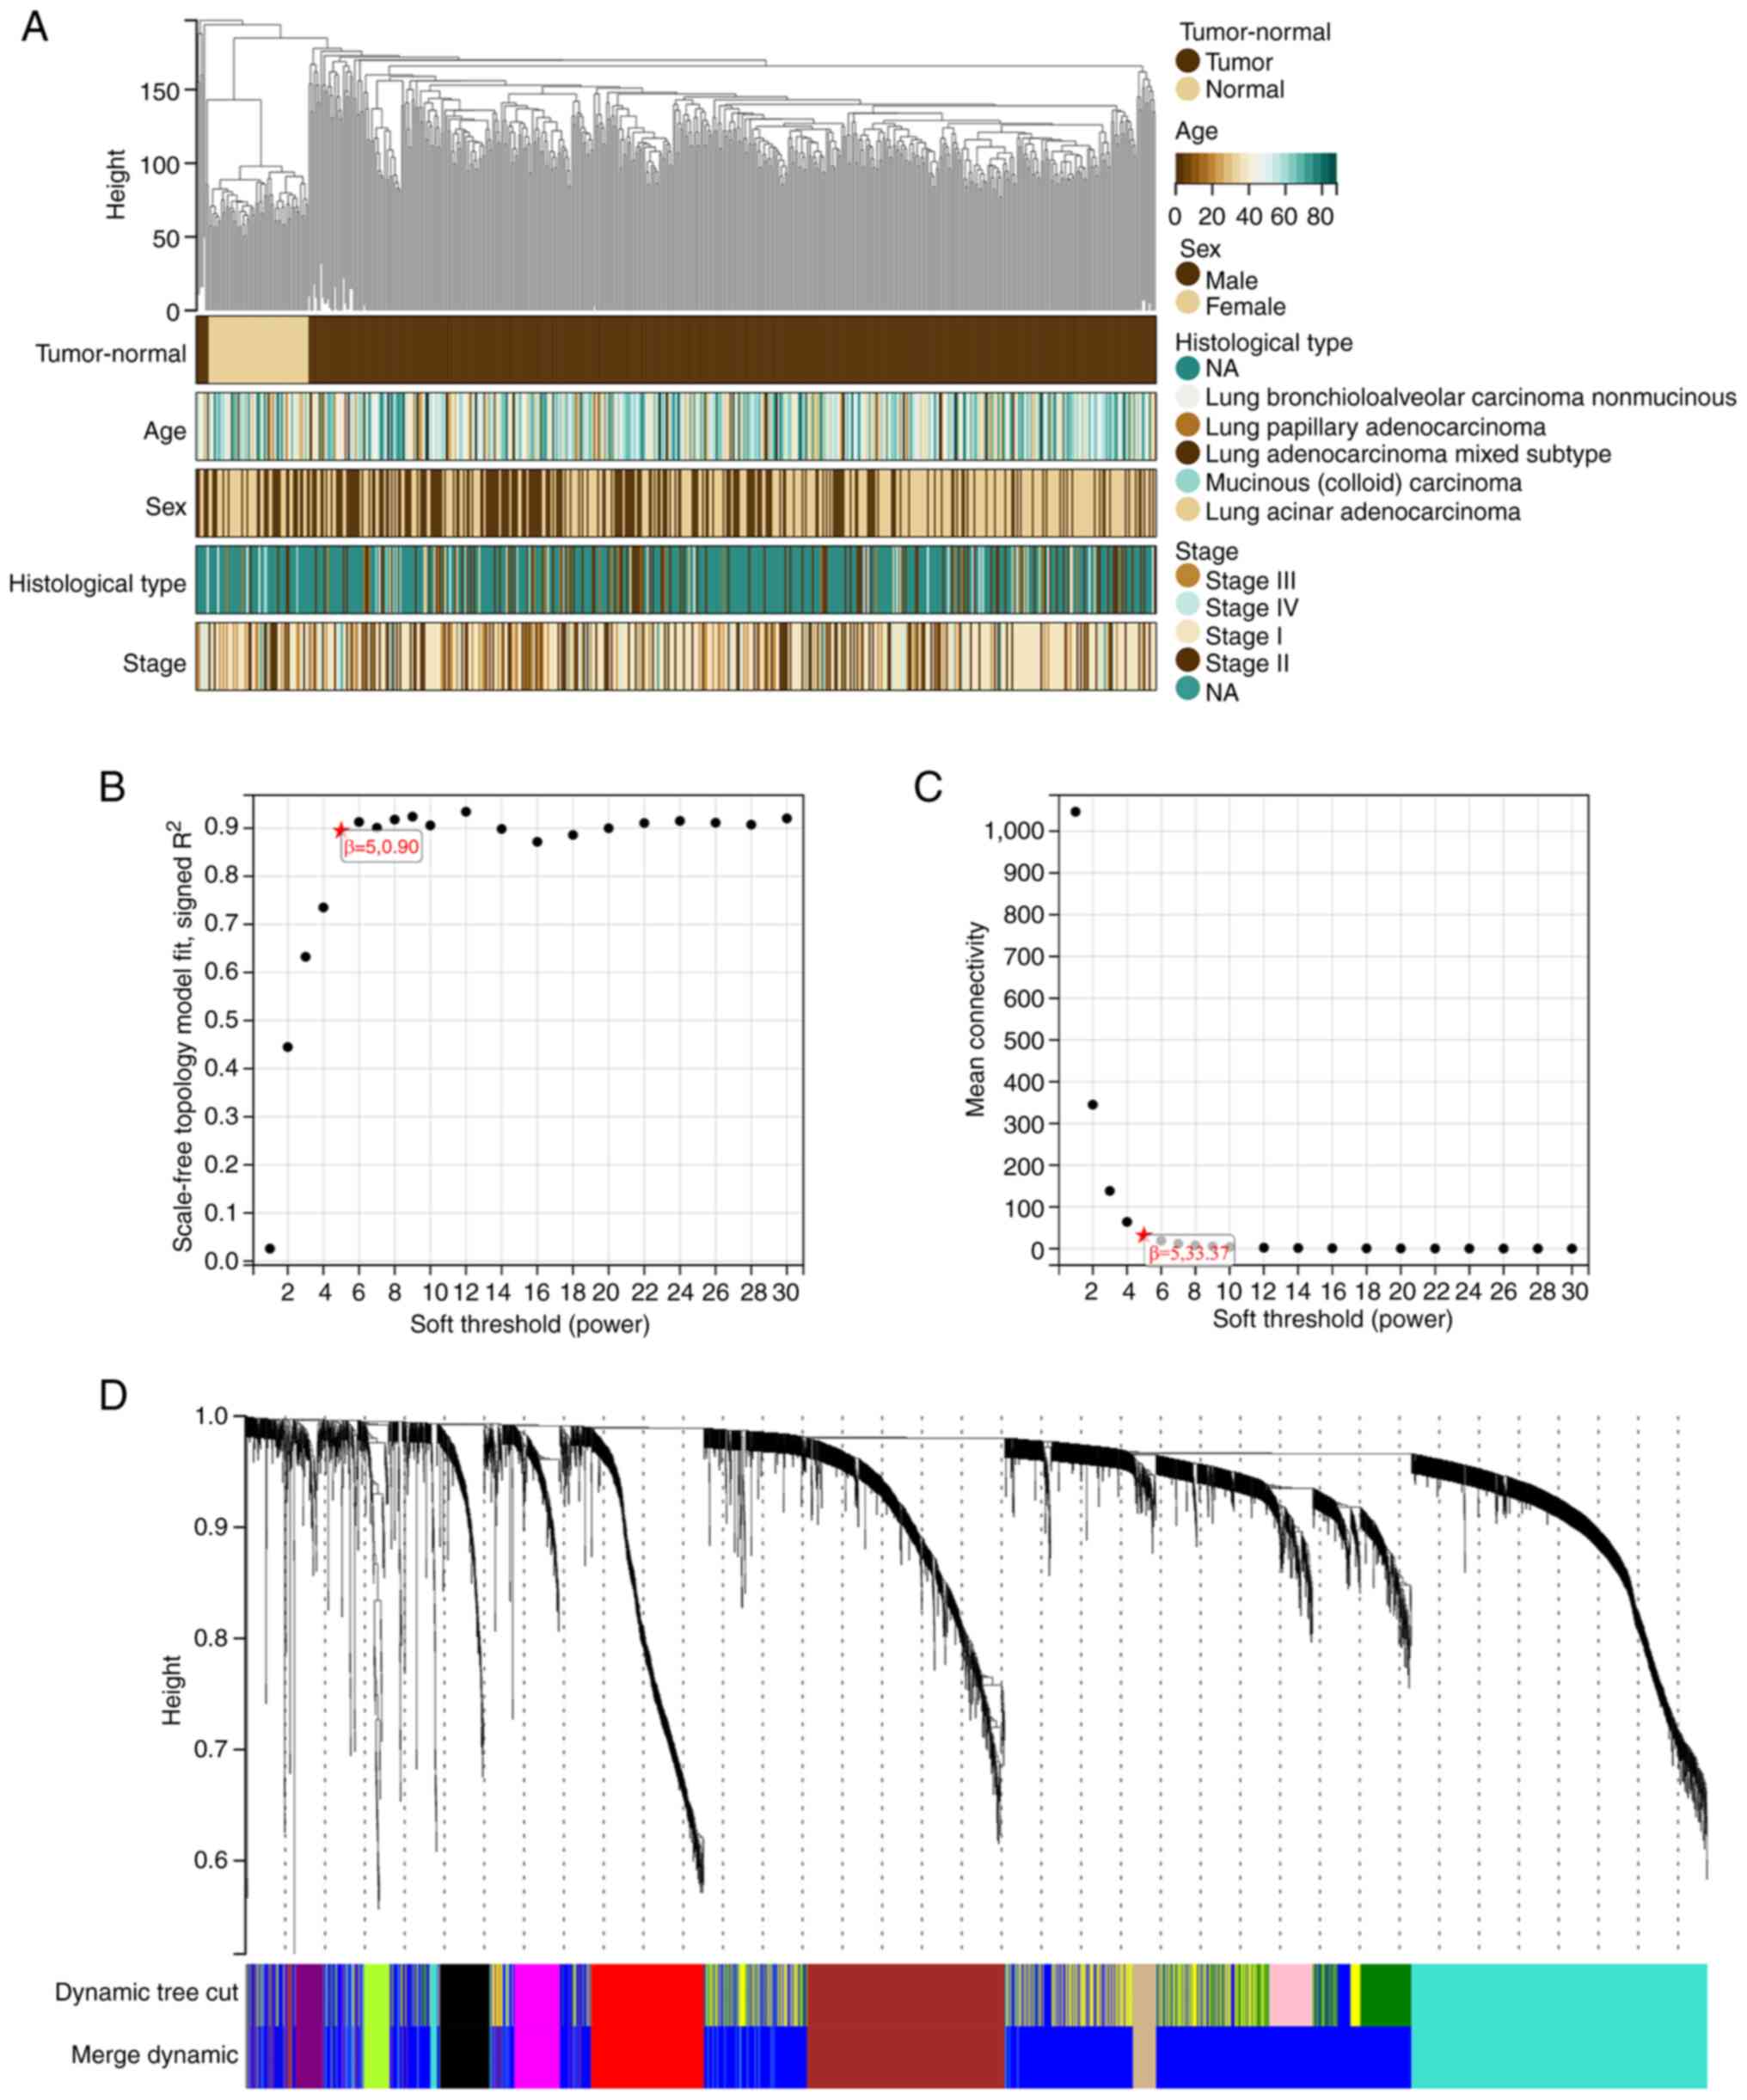
WGCNA was applied to create a network incorporating
information on the expression of the 4,485 DEGs and clinical data
from 558 LUAD samples. Cluster analysis was conducted on the 558
samples (Fig. 3A). The following
five clinical characteristics were used: status (tumor-normal),
age, sex, histological type and stage (Fig. 3A).
The independence degree was set to 0.9 and β to 5 to
create a scale-free network (Fig.
3B). The average connectivity was close to 0 (Fig. 3C). The module eigengene
dissimilarity was determined, a threshold of module dendrogram was
selected, and certain modules were merged. Modules having cut
height <0.25 were merged again. Finally, 10 co-expression
modules were obtained as black, brown, blue, grey, green-yellow,
red, magenta, purple, turquoise, and tan (Figs. 3D and S4). Genes in the grey module were not
incorporated into any other module.
Module and hub gene
identification
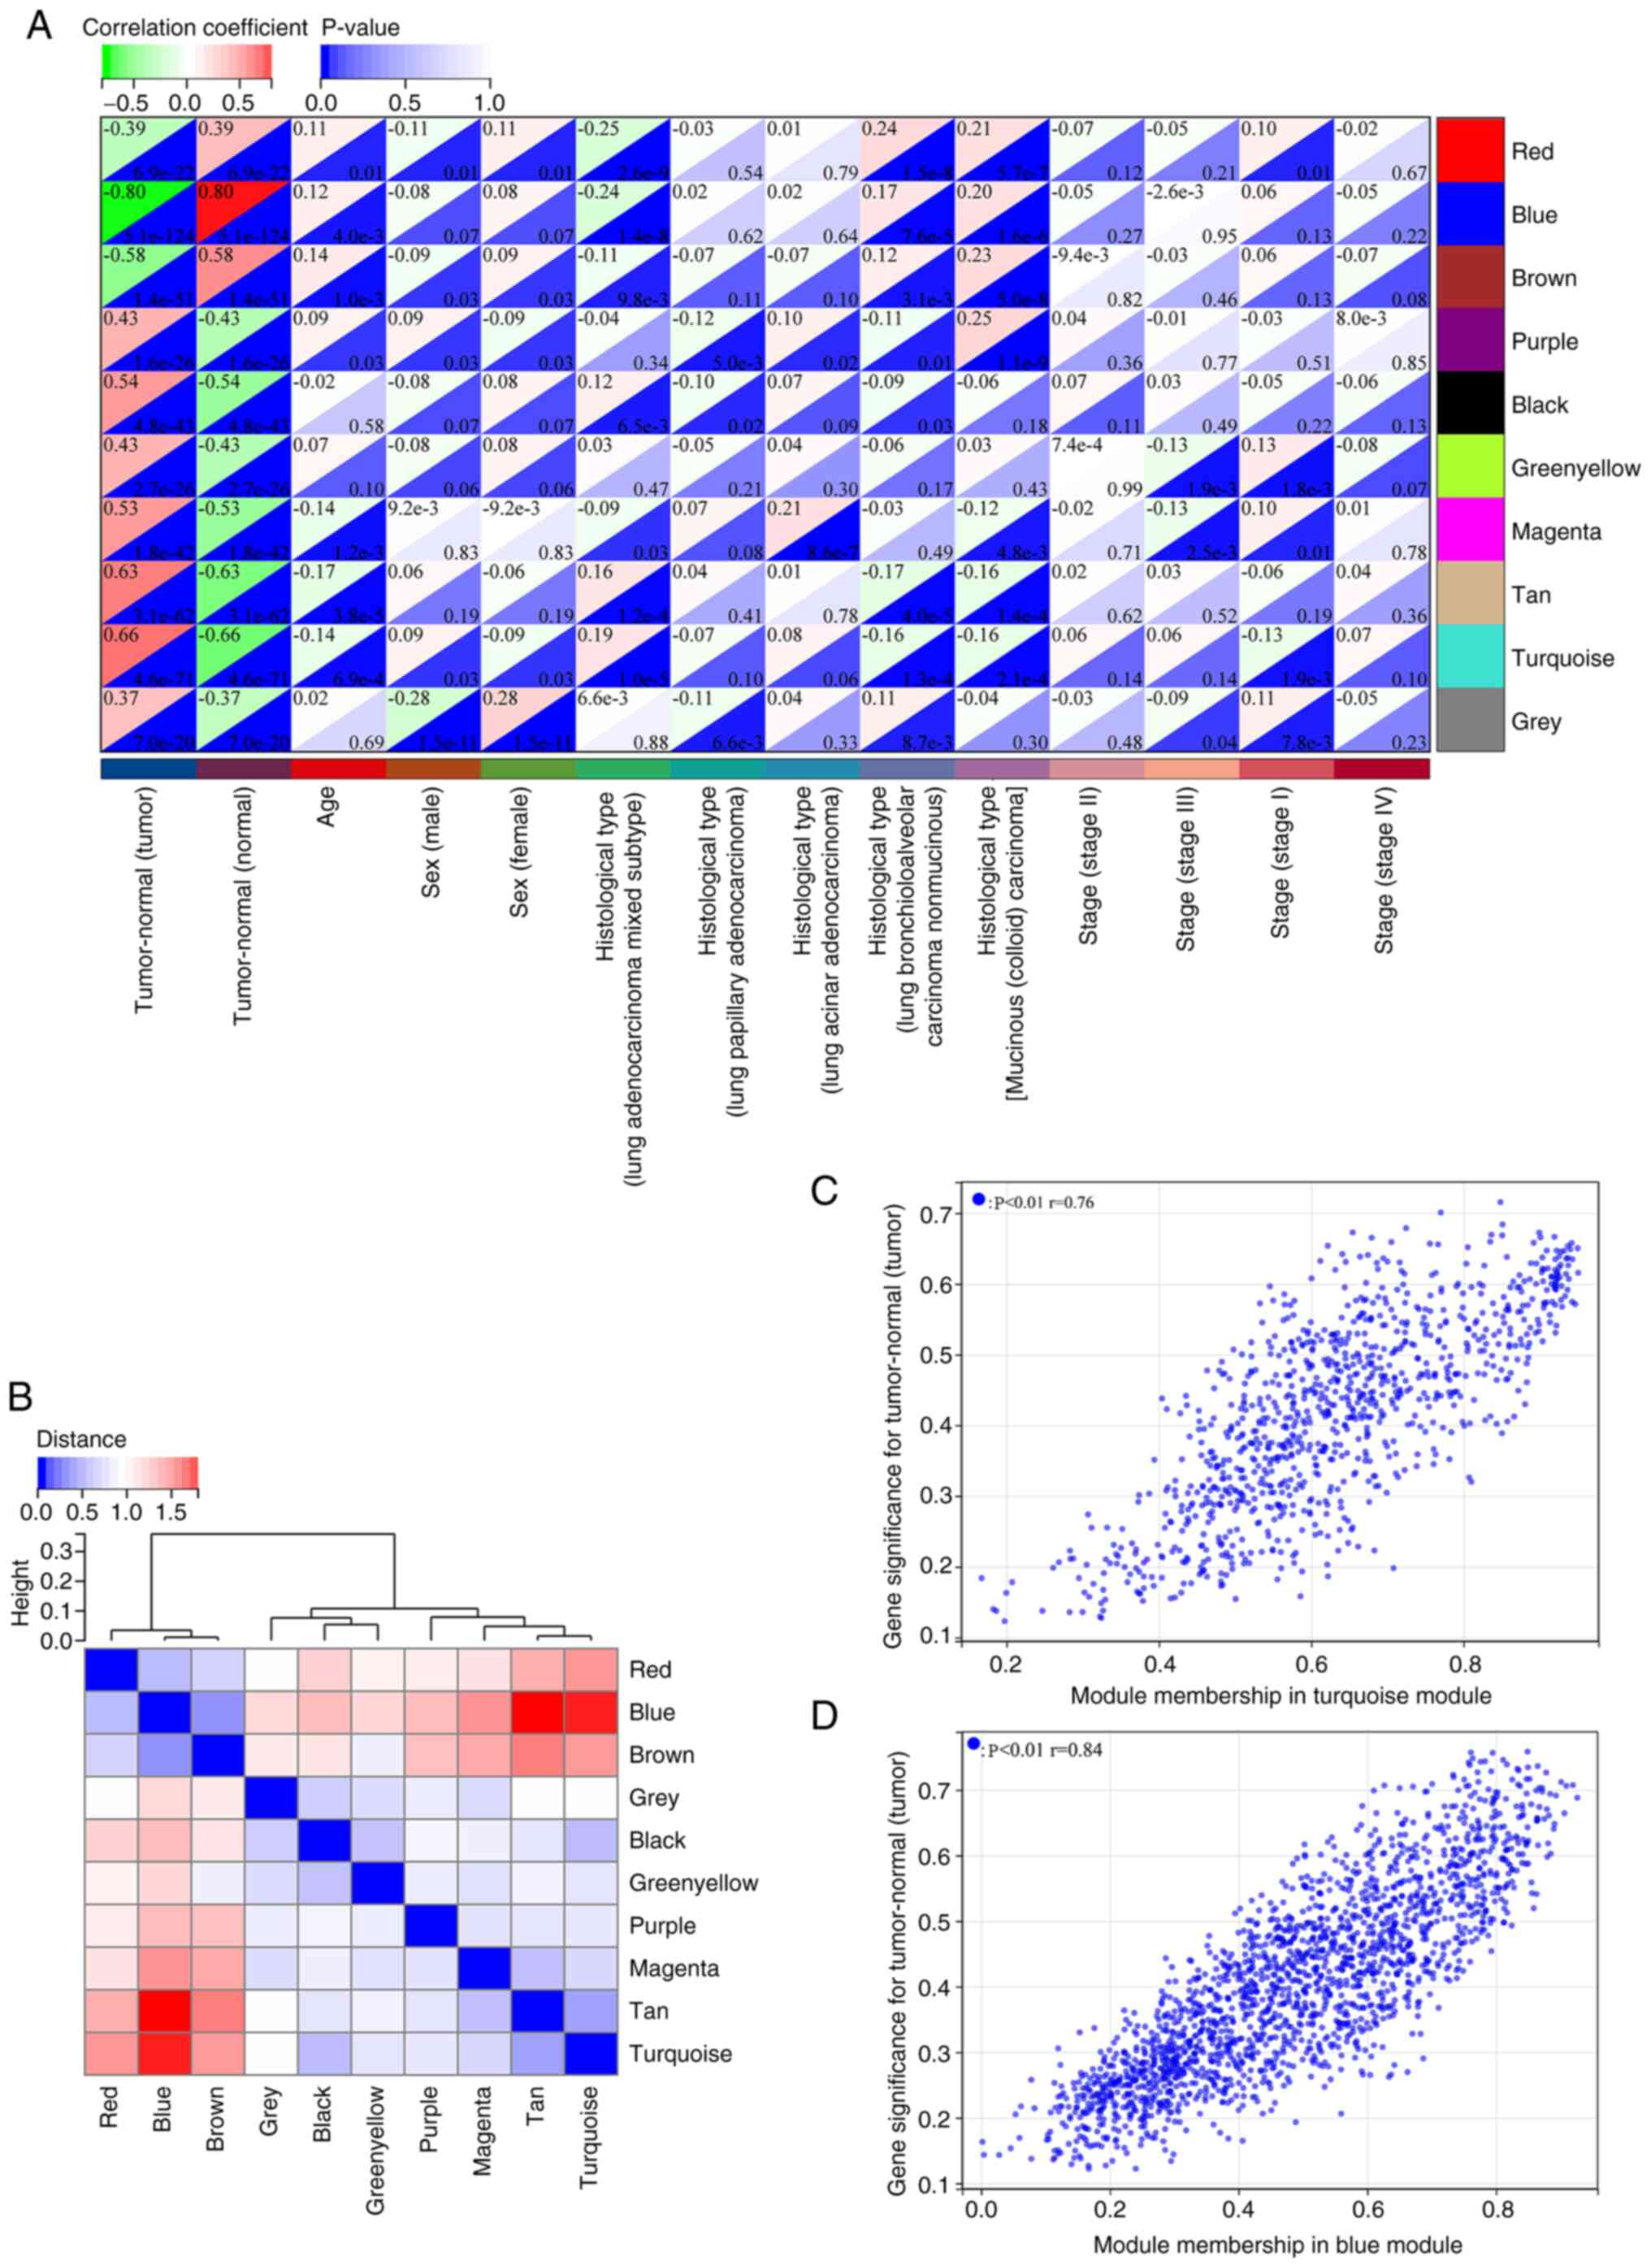
The genes in the blue module were negatively
associated with LUAD (cor=−0.80, P=5.1×10−124), and
those in the turquoise module exhibited a positive correlation with
LUAD (cor=0.66, P=4.6×10−71) (Fig. 4A). Assessments for hierarchical
clustering and heatmaps, together with adjacency links confirmed
the correlations as shown in Fig.
4B. These outcomes implied that genes in the turquoise module
could promote LUAD carcinogenesis, whereas those in the blue module
could protect against it. Consequently, the hub genes in the
turquoise and blue modules were analyzed, whereby MM/GS scores were
significantly associated with each other (Fig. 4C and D). Thresholds set to ‘MM
>0.8’ and ‘GS >0.7’ identified 19 hub genes across both
modules.
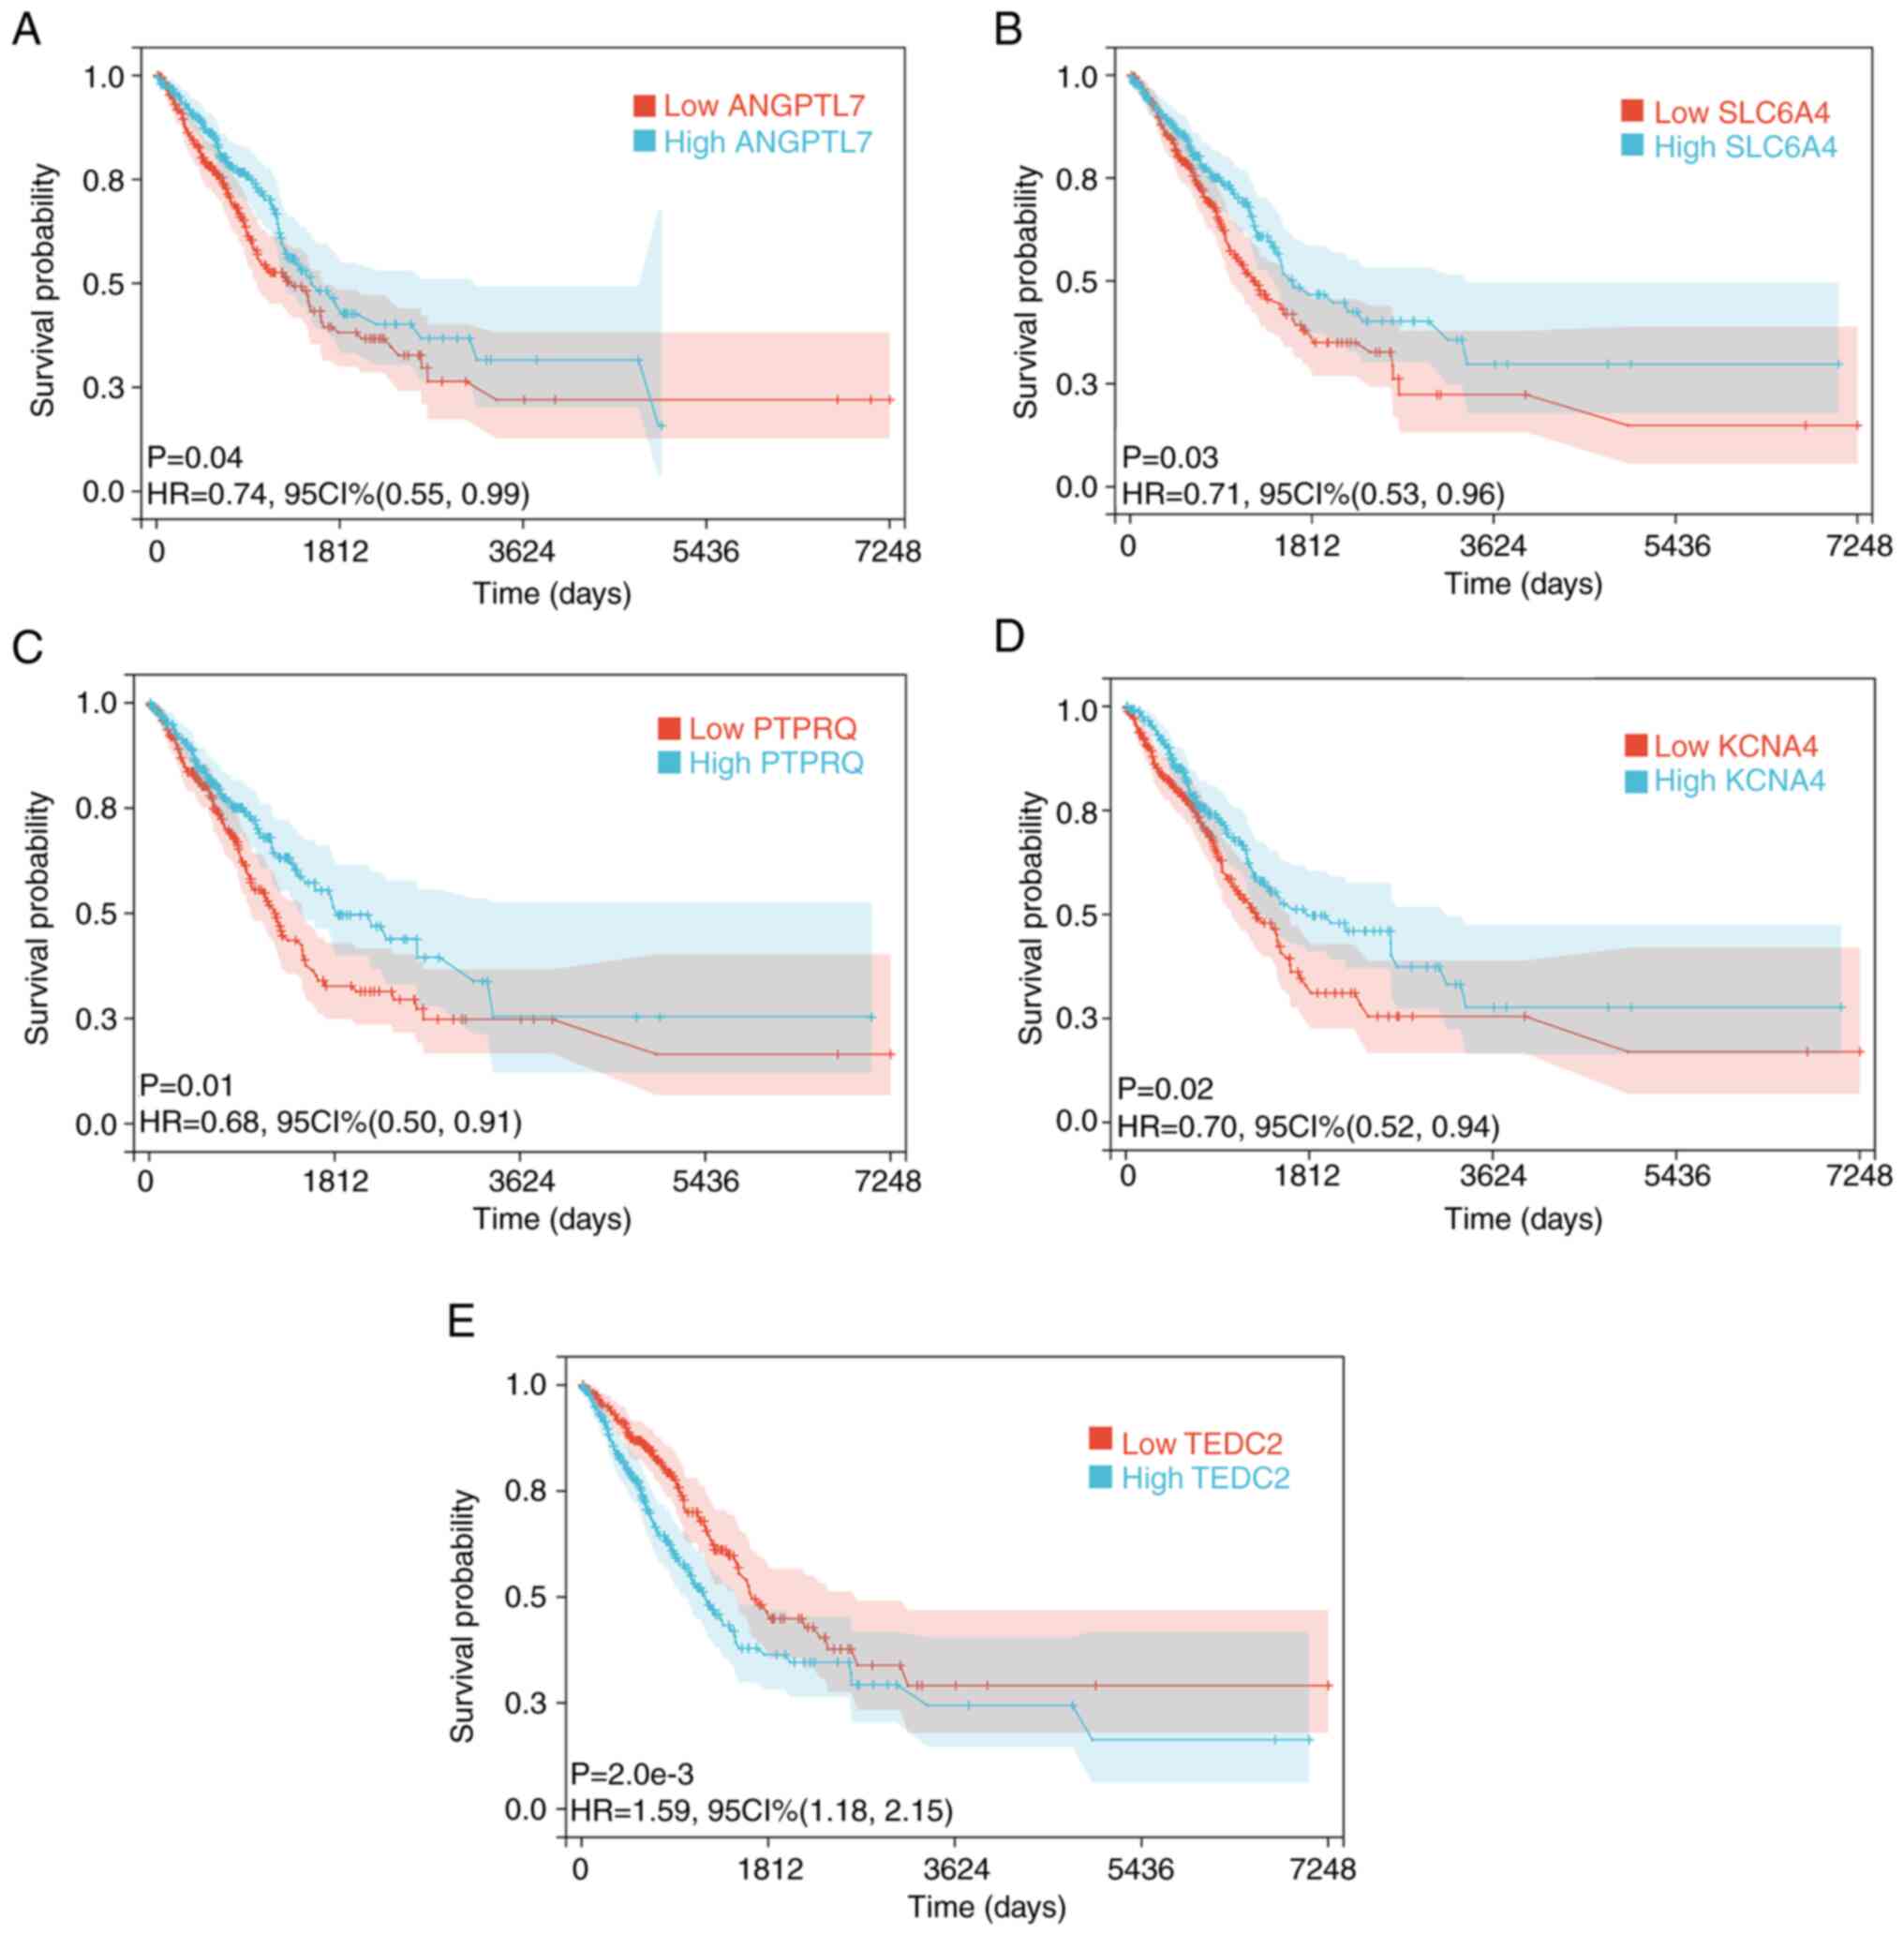
Survival analysis
Expression and clinical information from 488 LUAD
tumor samples were examined (excluding 12 samples with missing
survival information). Similarly, turquoise-/blue-module-derived
hub genes with possible associations between gene expression and
patient survival (Table SII) were
identified. ANGPTL7, SLC6A4, PTPRQ, KCNA4 and TEDC2
were identified to be associated with prognosis (Fig. 5A-E). Therefore, these were labeled
as ‘final’ hub genes.
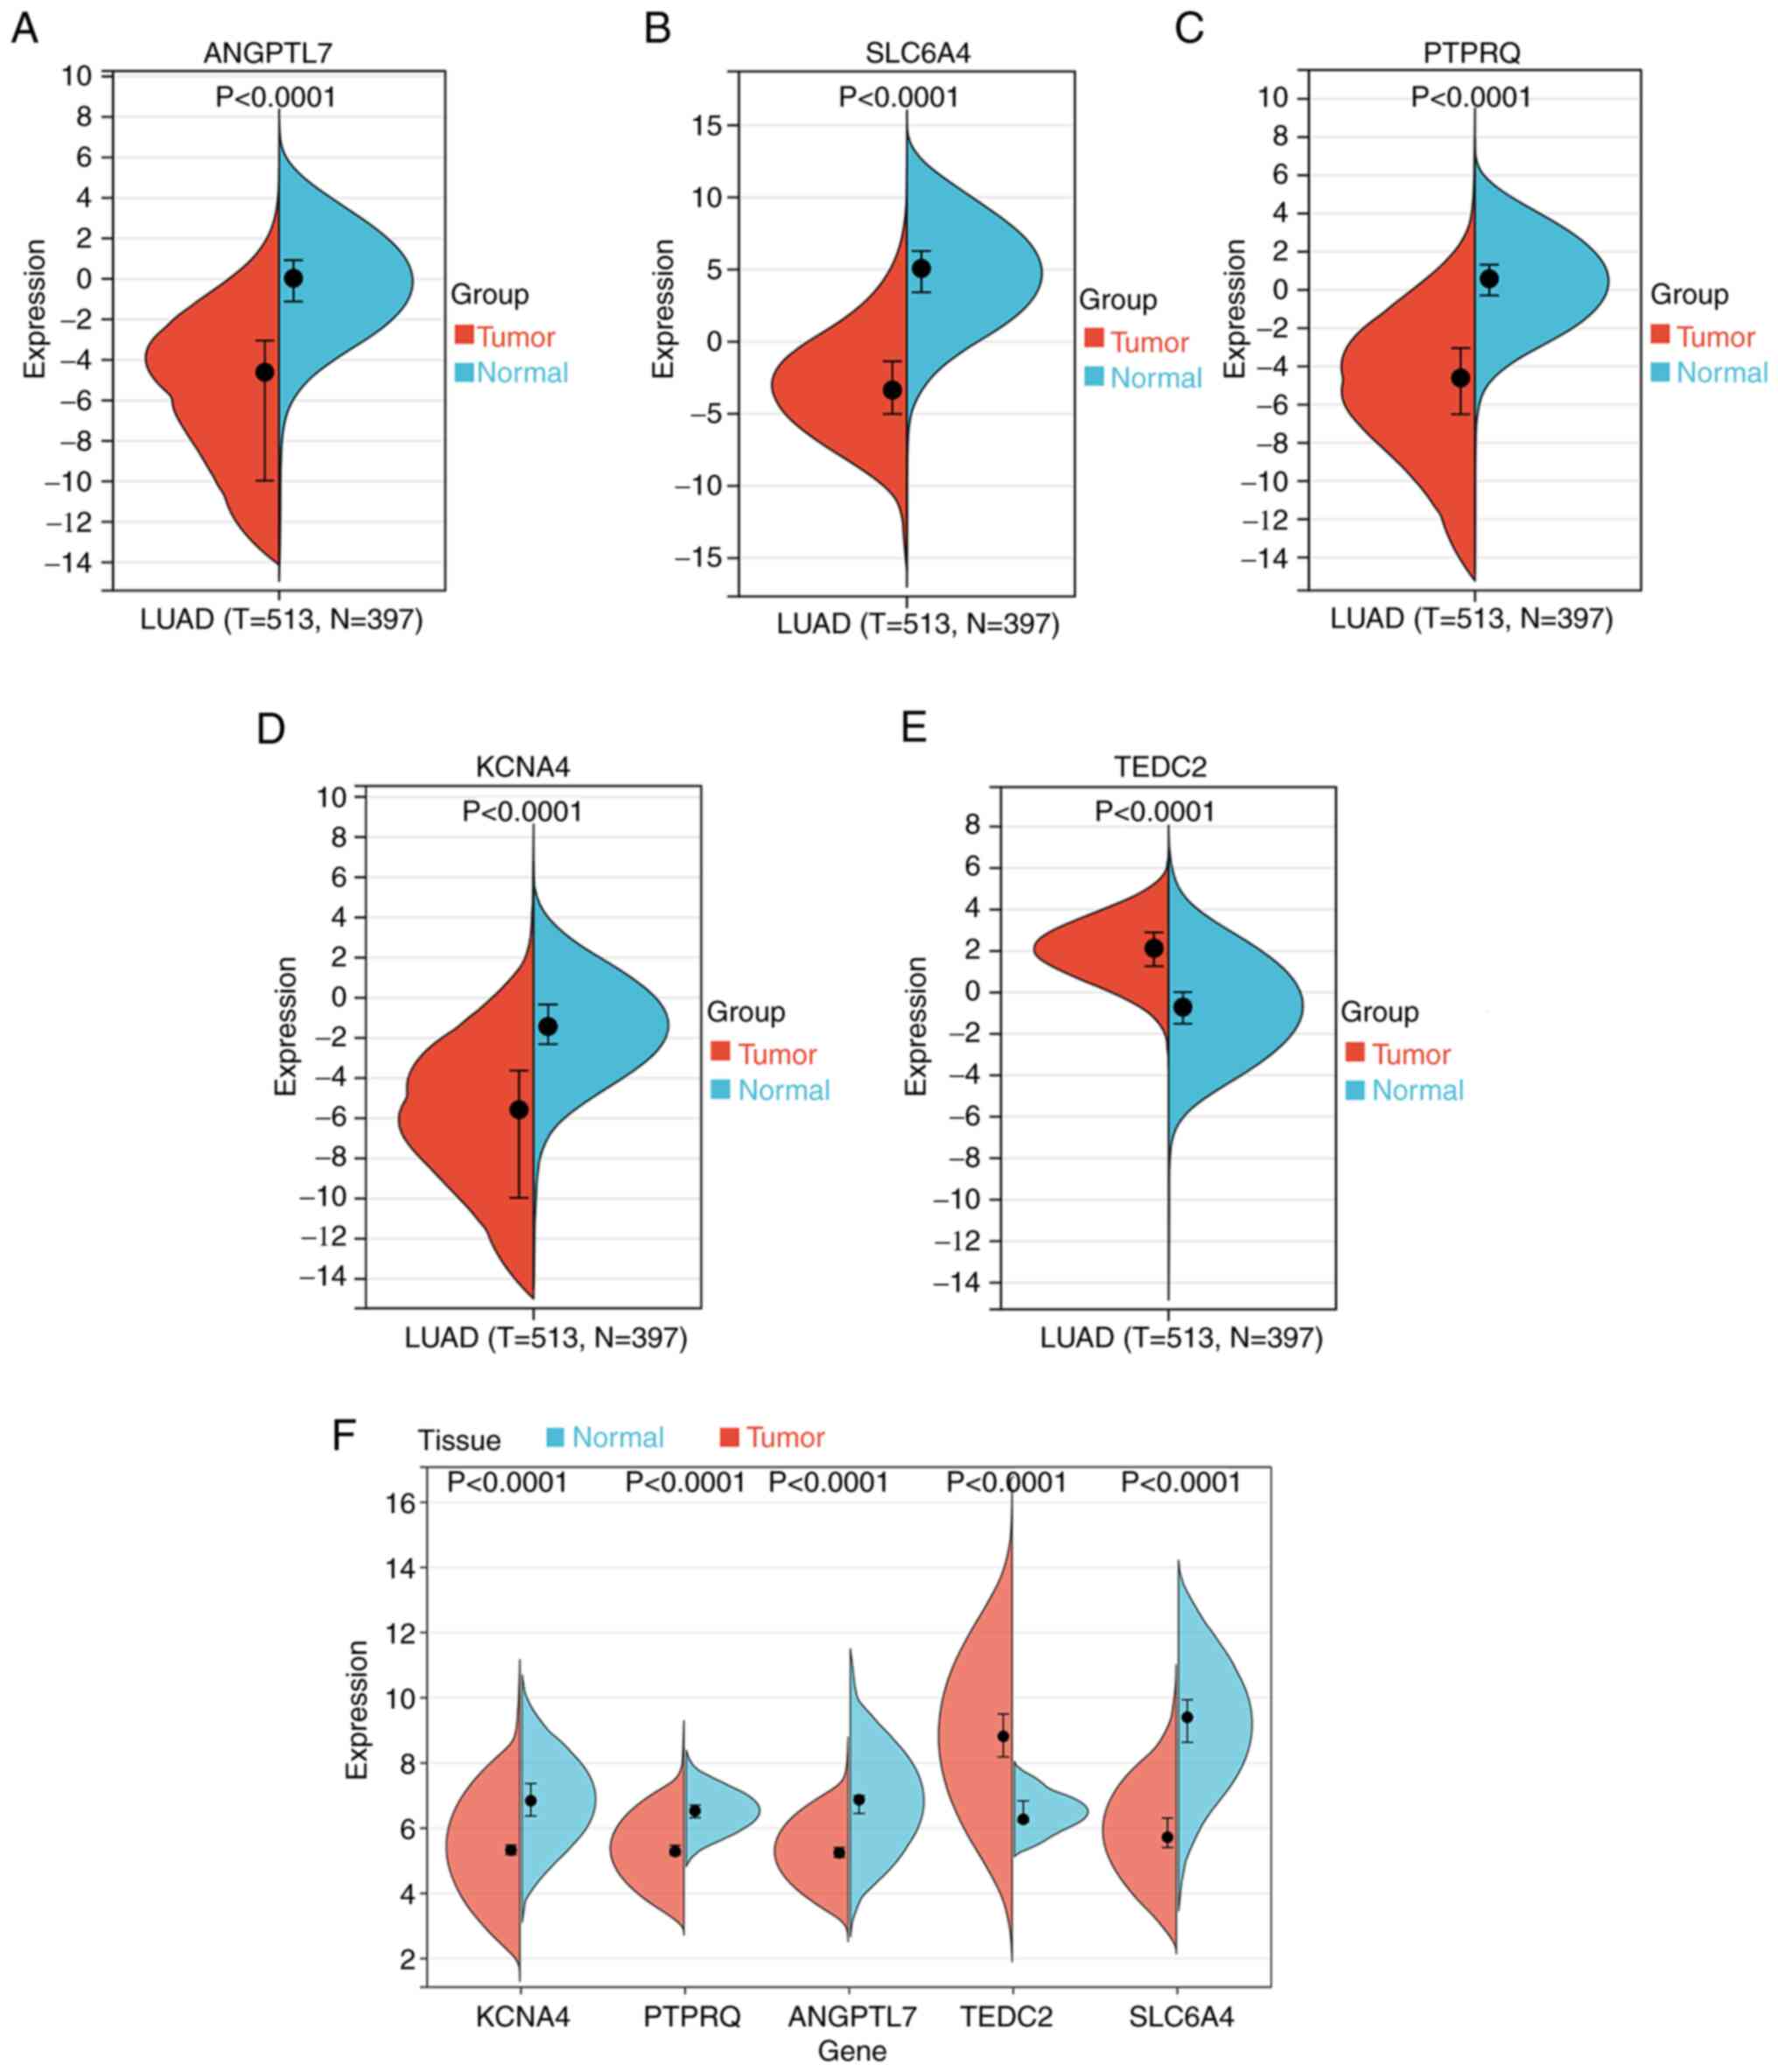
Bioinformatics validation
It was verified that hub gene levels differed
significantly between control and LUAD tissues by comparing data
from TCGA and GTEx databases (Fig.
6A-E). Apart from TEDC2, all other genes were
downregulated in LUAD. The GEO dataset GSE116959 yielded comparable
results (Fig. 6F).
Correlation and interaction
analysis
TEDC2 exhibited the strongest correlation
with tumor suppressor genes (RB1, TP53 and PTEN) of
the five hub genes (Table SIII).
As determined by data mining, SLC6A4 may interact with the
tumor suppressor genes (Fig. S5).
However, no evidence of interactions between the other hub genes
and the tumor suppressor genes was revealed.
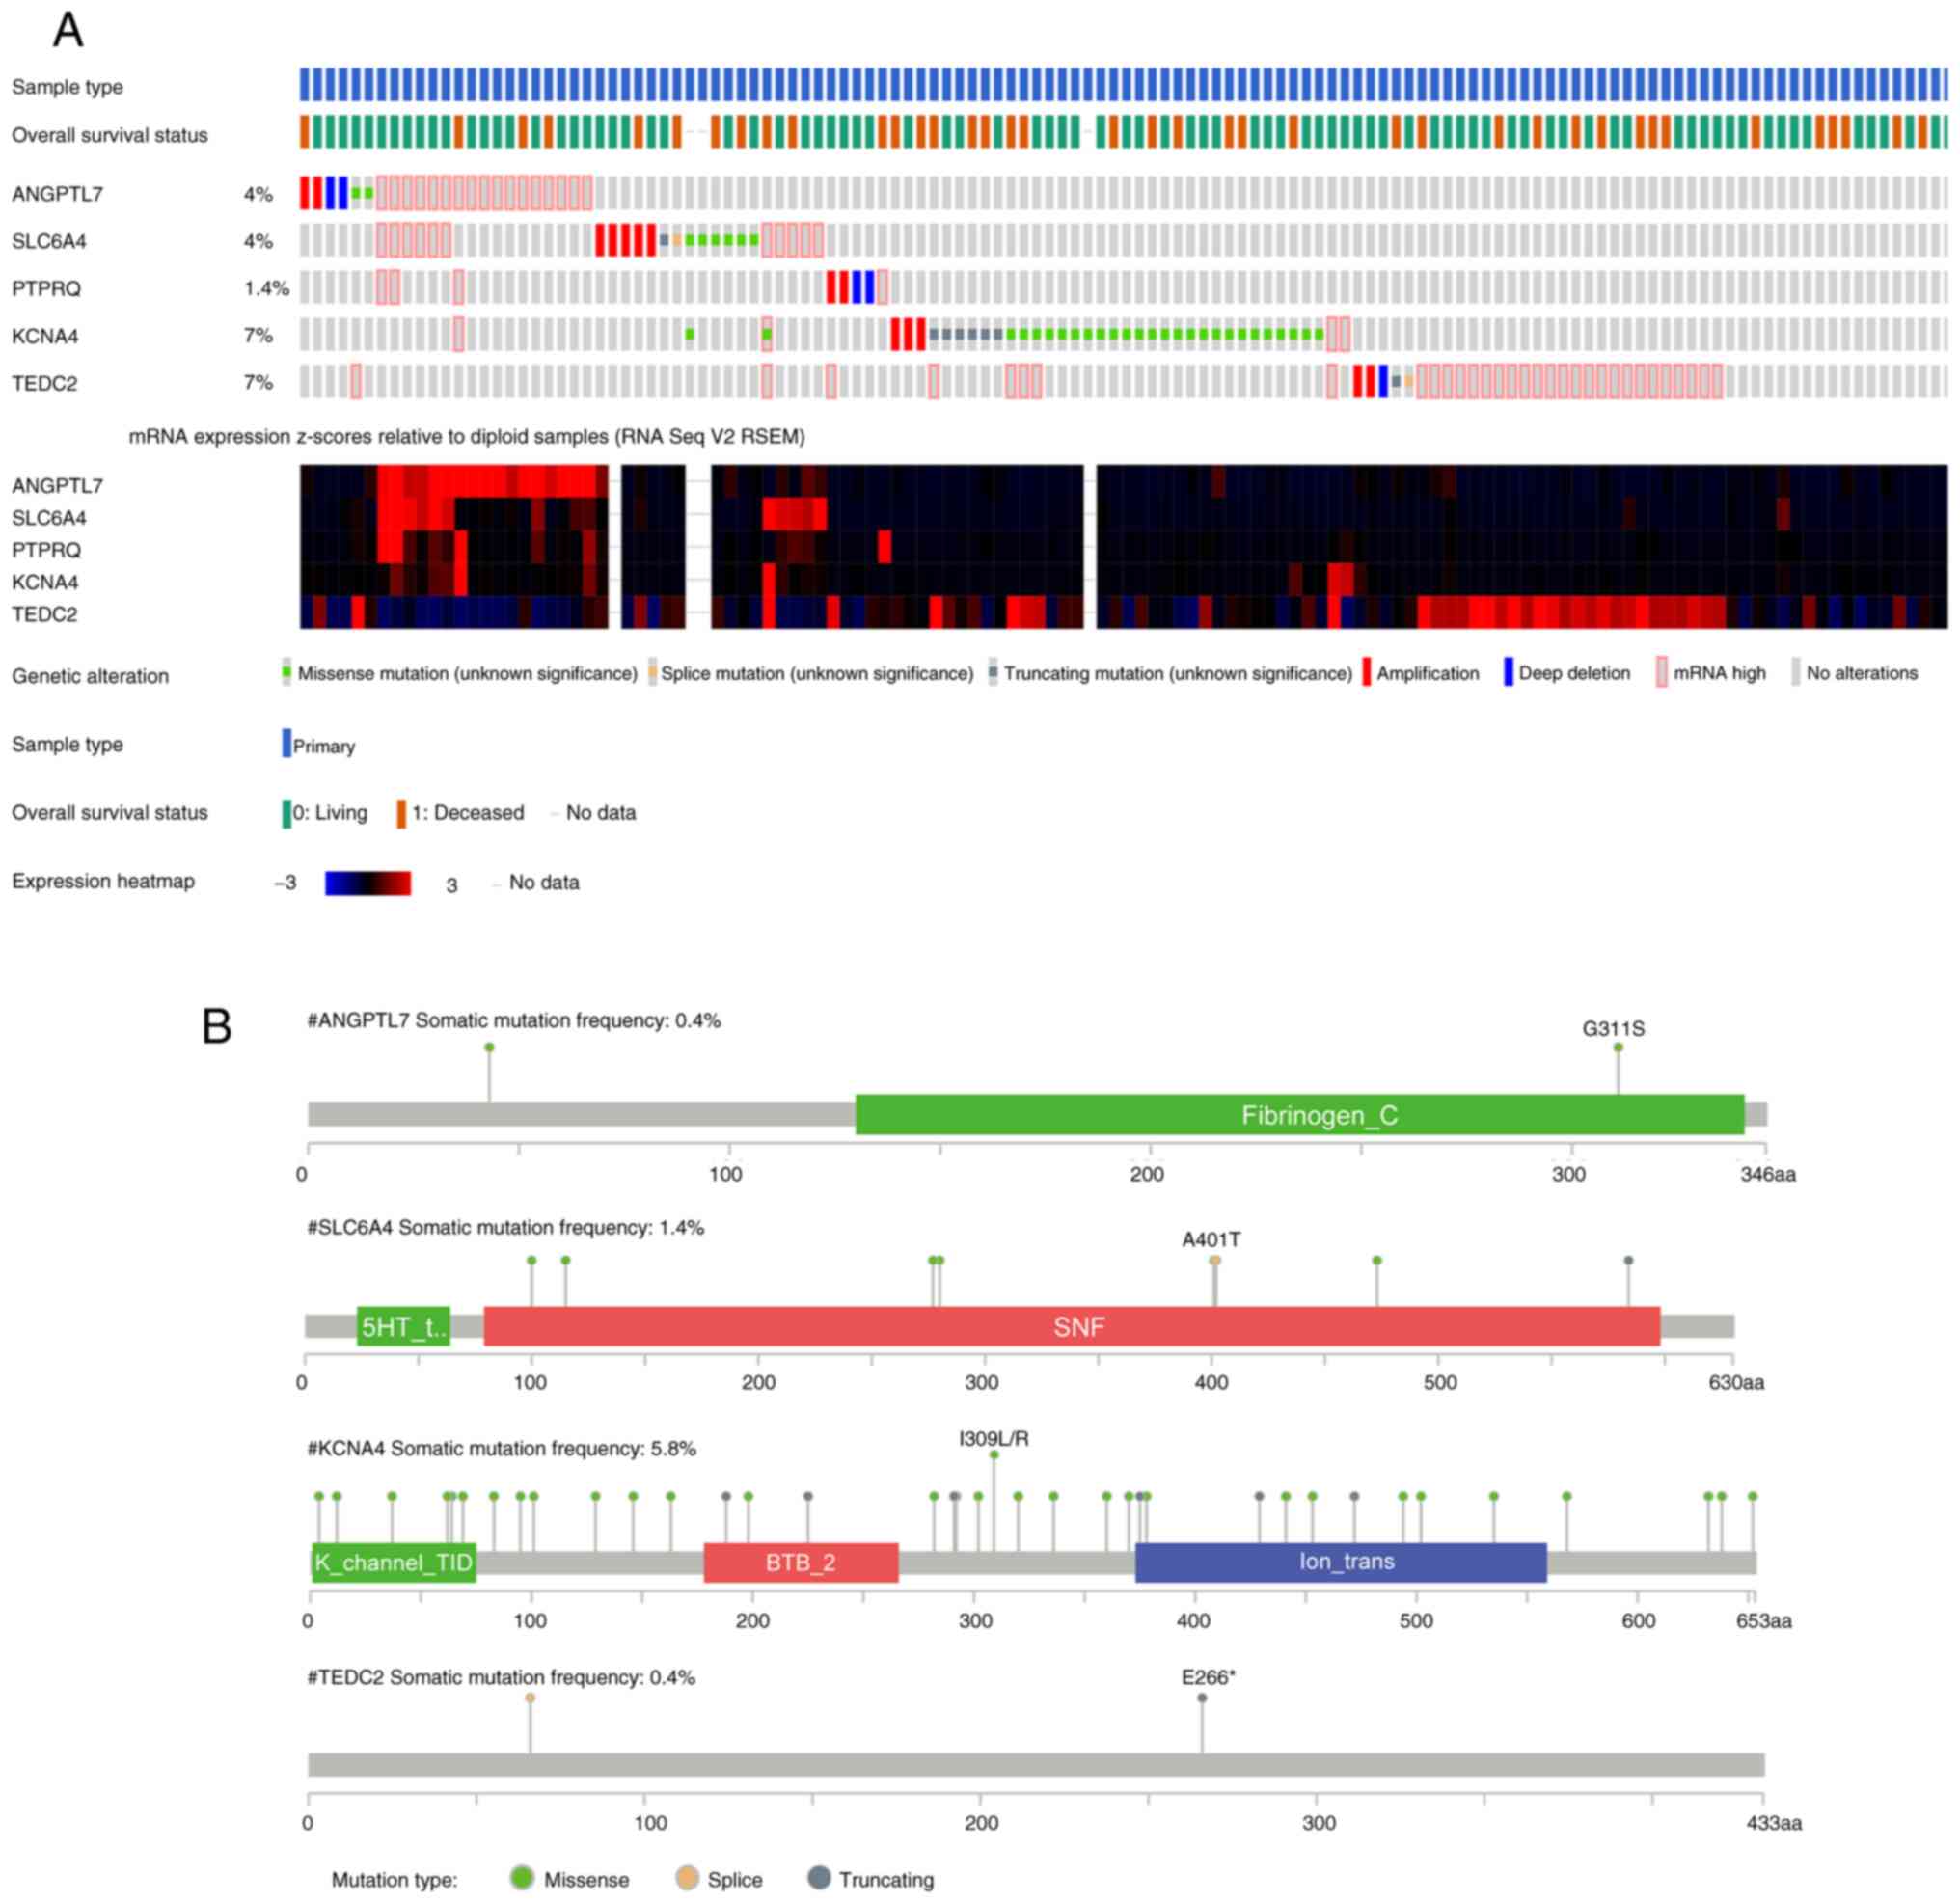
Mutation analysis
Utilizing information from 566 LUAD samples
collected from TCGA, the OncoPrint view in cBioPortal was utilized
for the identification of mutations in the five hub genes. In
total, 111 (20%) of the patients had genetic alterations in the
five hub genes. KCNA4 (7%) and TEDC2 (7%) exhibited
the highest rates of genetic modification. The most common
alterations were missense mutations in KCNA4 and high mRNA
expression in TEDC2 (Fig.
7A). The rate of somatic mutations was highest in KCNA4
(5.8%), and missense mutations were the most common type of
mutation (Fig. 7B).
IHC, CCK-8, colony formation, scratch
assay, cell cycle, Transwell invasion assay and cell adhesion
assay
Of the five hub genes, SLC6A4, ANGPTL7, PTPRQ
and KCNA4 were revealed to be downregulated in LUAD and
TEDC2 was upregulated. SLC6A4 was selected for
validation, because it is the gene with the largest difference in
downregulation.
IHC was used for further confirmation of the
clinical significance of SLC6A4 (Fig. 8A). Pan-cancer analysis revealed
that SLC6A4 exhibited differential expression in various
types of tumor cells and showed low expression levels in most
tumors. SLC6A4 was mainly localized in the cell membrane and
cytoplasm.
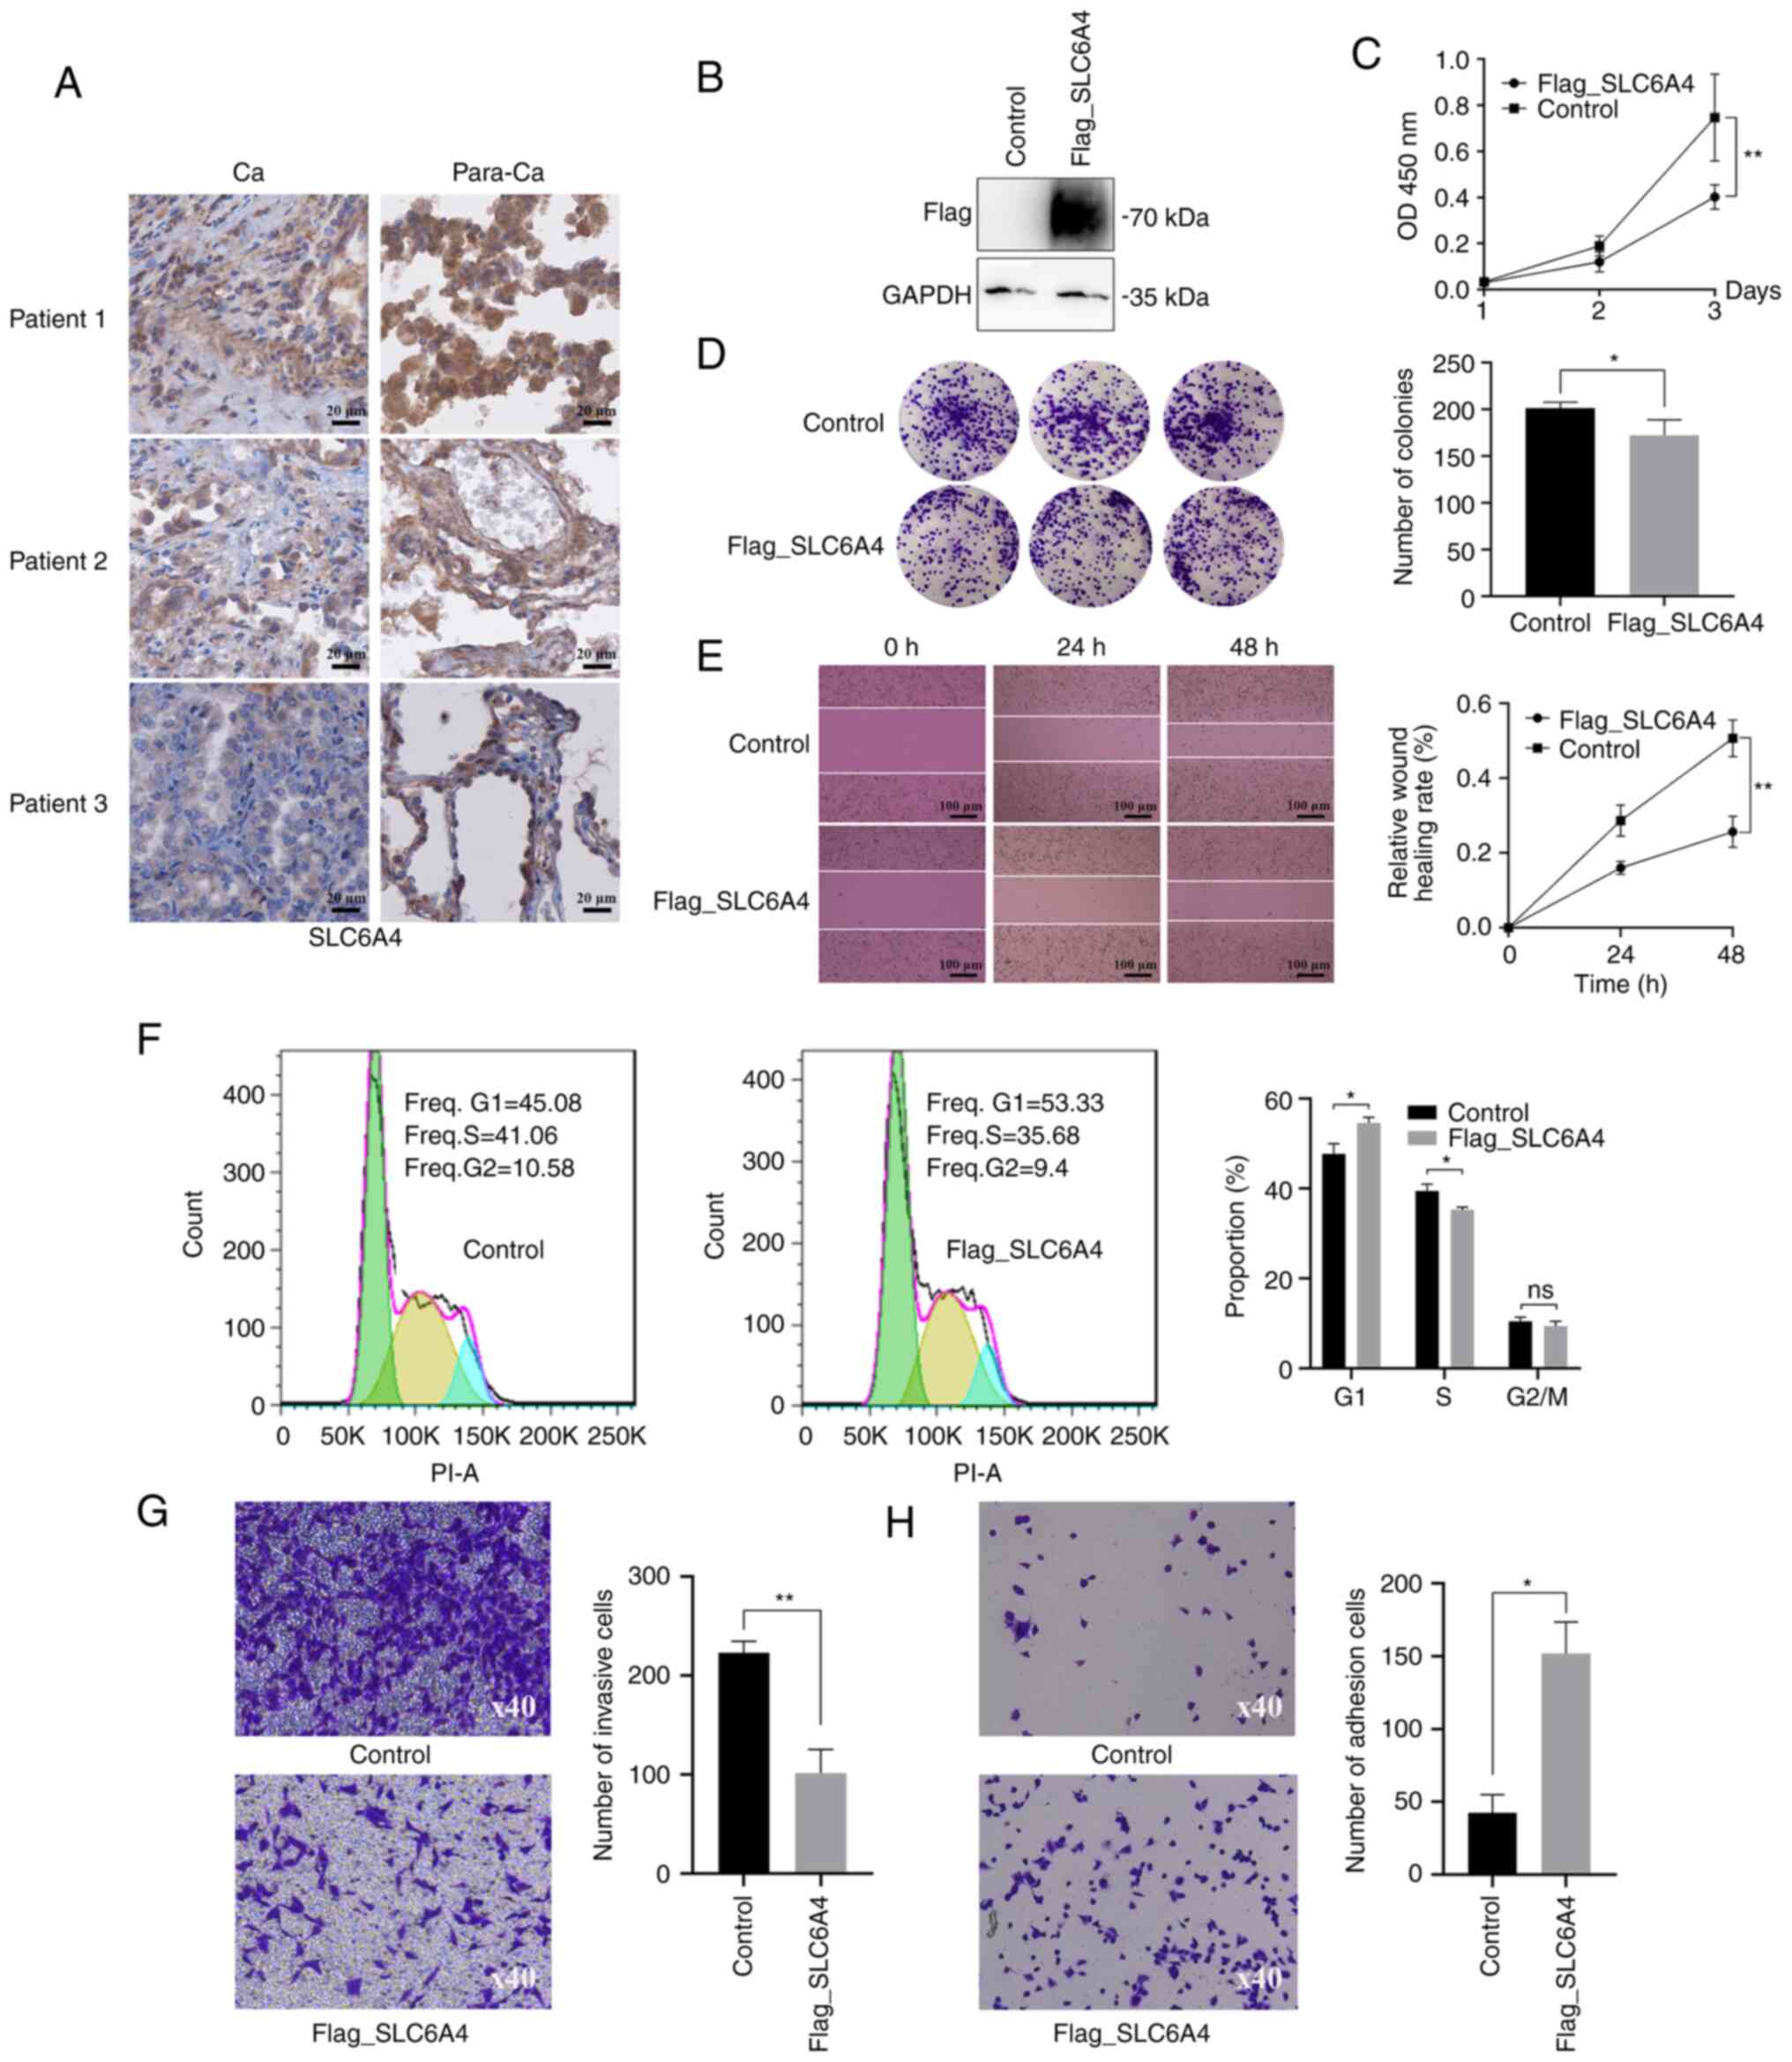 | Figure 8.Immunohistochemistry, CCK-8, colony
formation, scratch assay, cell cycle analysis, Transwell invasion
assay and cell adhesion assay. (A) Differential expression of
SLC6A4 in tumor tissue (Ca) along with paraneoplastic
healthy tissue (Para-Ca); scale bar, 20 µm. (B) Protein levels were
assessed using western blot analysis. A549 cells were transfected
with an empty vector as the negative control. GADPH was used as the
internal control. ‘Flag_SLC6A4’ represents the exogenous expression
of SLC6A4 and ‘Flag’ is a fusion tag. (C-H) SLC6A4
overexpression inhibits A549 cell growth, invasion, and migration.
A549 cells which were transfected with an empty vector were used as
the control. ‘Flag_SLC6A4’ represents the exogenous expression of
SLC6A4. Cell proliferation was analyzed using (C) CCK-8 and
(D) colony formation. (E) The effect of SLC6A4
overexpression on cell migration was assessed using scratch assays;
scale bar, 100 µm. (F) Cell cycle distribution was determined using
flow cytometry. (G) Cell invasion in the two groups was compared
using Transwell assays. (H) Cell adhesion in both cell groups
(magnification, ×40). Statistical significance was analyzed through
unpaired t-tests (n=3). *P<0.05 and **P<0.01. OD, optical
density; ns, no significance. |
To investigate the effect of SLC6A4 on LUAD
cells, A549 cells were transfected with a Flag-SLC6A4
plasmid, and subsequent expression of SLC6A4 was evaluated using
western blotting (Fig. 8B).
Various assays (CCK-8, colony formation, scratch assay, cell cycle,
Transwell assay and cell adhesion assay) were used to examine the
effects of SLC6A4 on cell growth, invasion and migration
(Fig. 8C-H). These indicated that
SLC6A4 overexpression inhibited cell growth, invasion, and
migration.
Discussion
LUAD is one of the most prevalent malignancies.
WGCNA has previously been used to determine markers linked to the
diagnosis, pathogenesis, and prognosis of LUAD (34–37).
The present study applied this approach and used bioinformatics
analysis to identify novel hub genes that could act as biological
markers or treatment targets in LUAD.
Bioinformatics analyses were conducted across
patient cohorts to identify biomarkers. In total 4,485 DEGs, of
which 1,857 were upregulated and 2,628 were downregulated, were
identified between 58 normal and 500 LUAD samples. The DEGs were
primarily related to system development, cell cycle, and cell
adhesion. The WGCNA and survival analyses together identified five
hub genes. The findings of the present study indicated that the
increased TEDC2 expression and the reduced expression of
ANGPTL7, SLC6A4, PTPRQ and KCNA4 are associated with
poor LUAD prognosis. These genes could be utilized as possible
treatment targets or biomarkers for this type of cancer. In
addition, in the present study, IHC confirmed the relatively low
expression of SLC6A4 in LUAD. It was also confirmed that its
overexpression suppressed cell proliferation, invasion, and
migration.
Numerous forms of cancer exhibit dysregulation of
the cell cycle, which has been reported in several studies
(38–40). Previous research has also indicated
that targeted modulation of the cell cycle may be a possible cancer
treatment method (41–43). Thus, investigation of the cell
cycle may aid in a better comprehension of oncogenic pathways and
LUAD treatment possibilities. In the present study, the functional
enrichment analyses revealed enrichment in cell cycle-associated
pathways. Flow cytometry demonstrated that overexpression of
SLC6A4 increased the number of cells in the G1 phase,
decreased those in the S phase, and did not affect the number of
cells in the G2 phase, indicating that overexpression of
SLC6A4 inhibited the cell cycle. This suggested the
direction of the subsequent investigation of the mechanism.
The hub modules and genes linked to LUAD were
ascertained using WGCNA. The turquoise/blue modules were determined
to be critical modules, and the genes in these modules were highly
associated with LUAD. The findings of the present study
demonstrated that an intricate gene network controls LUAD
development and growth.
Five turquoise/blue module-derived hub genes were
significantly linked to overall survival in patients with LUAD,
namely, TEDC2/C16orf59, ANGPTL7, SLC6A4, PTPRQ and
KCNA4. It is likely that TEDC2, which may be located
in centrioles and cilia, have a part in modulating signaling
pathways. Its expression is altered in hepatocellular carcinoma
(44) and laryngeal squamous cell
carcinoma (45). ANGPTL7 is
located in the extracellular region and is likely to be involved in
the negative modulation of vascular development. This gene plays a
regulatory role in multiple malignancies, including colorectal
(46), breast (47) and hepatocellular (48) cancers. Serotonin is transported
into presynaptic neurons from synaptic spaces via a membrane
protein that is encoded by SLC6A4. SLC6A4 is also
associated with colorectal cancer (49) and breast cancer (50). A type III receptor-like protein
tyrosine phosphatase is encoded by the gene PTPRQ. The
protein participates in cellular growth and differentiation by
catalyzing the dephosphorylation of phosphotyrosine and
phosphatidylinositol. This gene is a possible prognostic indicator
in renal clear cell carcinoma (51). Last but not least, KCNA4
encodes a member from the voltage-gated, potassium channel, and
shaker-related subfamily. It is involved in glioma (52) and gastric cancer (53). However, research on these genes in
the context of LUAD has been limited.
In contrast to LUAD-related genes reported in past
studies, the hub genes identified in the analysis of the present
study were different. In a previous study, the mRNA levels of all
known m6A-associated genes were analyzed in the TCGA-LUAD dataset,
and were then further verified using GEO datasets, expression
profiling tissue microarrays, and IHC. Subsequently, through
analysis of overall and recurrence-free survival data, three genes
(METTL3, YTHDF1 and YTHDF2) associated with the
prognosis of LUAD were discovered (54). These m6A-related genes play
important roles in mRNA processing, transport and stability. Based
on a GEO dataset (GSE118370), the second study identified a total
of 609 DEGs (|log2 fold-change|>2 and P<0.05). In
the BP module, the downregulated DEGs were mostly found in pathways
related to ‘angiogenesis’, ‘immune response’ and ‘cell adhesion’,
while the upregulated DEGs were primarily enriched in the ‘collagen
catabolic process’, ‘extracellular matrix disassembly’ and
‘chemokine-mediated signaling’ pathways. Various hub genes
(ADCY4, S1PR1, FPR2, PPBP, NMU and PF4, together with
GCG) were identified using protein-protein interaction
networks and prognostic survival analysis (55). Another study revealed that NSD2
mediates the dimethylation of H3K36, which in turn regulates
multiple oncogenic programs, including KRAS signaling, to promote
the malignant transformation of LUAD (56). In the present study, a total of
4,485 DEGs (|log2 fold-change| >1 and P<0.01) were
identified based on the TCGA dataset, and were determined to be
primarily enriched in ‘system development’, ‘cell cycle’ and ‘cell
adhesion’. Using a combination of WGCNA, survival analysis, and
dataset cross-validation, five hub genes, namely,
TEDC2/C16orf59, ANGPTL7, SLC6A4, PTPRQ and KCNA4 were
finally identified. The differences in the results of these studies
could be due to different methods of analysis, data sources,
screening conditions, molecular markers and biological
processes.
The emergence and progression of malignancies is
often regulated by an intricate network of genes, thus it is
possible that genes from other modules in the analysis of the
present study are also involved in LUAD. In addition, the fact that
only the downregulated gene SLC6A4 was validated in the
present study is a drawback, particularly the absence of
TEDC2 (the only upregulated gene among the hub genes).
Likewise, it should be noted that the biological function of the
gene was only verified in vitro, but not in vivo.
Despite these limitations, the present study could provide useful
information that could guide the treatment and diagnosis of LUAD in
the future. Other hub genes should be further verified and
investigated in the future to elucidate the gene networks
associated with LUAD.
Supplementary Material
Supporting Data
Supporting Data
Acknowledgements
Not applicable.
Funding
The present study was supported by grants from the National
Natural Science Foundation of China (NSFC) (grant no. 81602450),
the Natural Science Foundation of Hunan Province, China (grant no.
2018JJ3337), the Hunan Provincial Health Commission Project (grant
no. 202202084830), the Key Project of Developmental Biology and
Breeding from Hunan Province (grant no. 2022XKQ0205), and the Key
Project of Education Department of Hunan Province (grant
no.20A308).
Availability of data and materials
The data used to be analyzed in the present study
was obtained from an online database (https://xenabrowser.net/datapages/). The GSE116959
dataset used to be validated was collected from the GEO database
(https://www.ncbi.nlm.nih.gov/geo/).
Authors' contributions
LH participated in the conceptualization,
methodology, investigation, data analysis, visualization, and
writing-original draft. HZ participated in the study design,
rvision of the manuscript, funding acquisition and provision of
resources. AZ and JW performed experiments and analysis of data. CT
and ML participated in the analysis of data. SY and XZ participated
in the conceptualization, methodology and provision of resources.
LH and HZ confirm the authenticity of all the raw data. All authors
have read and approved the final manuscript.
Ethics approval and consent to
participate
Research involving human tissues was approved by the
Ethics Committee of Hunan Normal University (approval no.
2022-563).
Patient consent for publication
Not applicable.
Competing interests
The authors declare that they have no competing
interests.
Glossary
Abbreviations
Abbreviations:
|
LUAD
|
lung adenocarcinoma
|
|
TCGA
|
The Cancer Genome Atlas
|
|
DEGs
|
differentially expressed genes
|
|
WGCNA
|
weighted gene co-expression network
analysis
|
|
IHC
|
immunohistochemistry
|
|
TOM
|
topological overlap matrix
|
|
PCA
|
principal component analysis
|
|
GS
|
gene significance
|
|
MM
|
module membership
|
|
GTEx
|
Genotype-Tissue Expression
|
|
GEO
|
Gene Expression Omnibus
|
References
|
1
|
Bade BC and Dela Cruz CS: Lung Cancer
2020: Epidemiology, etiology, and prevention. Clin Chest Med.
41:1–24. 2020. View Article : Google Scholar : PubMed/NCBI
|
|
2
|
Xu F, He L, Zhan X, Chen J, Xu H, Huang X,
Li Y, Zheng X, Lin L and Chen Y: DNA methylation-based lung
adenocarcinoma subtypes can predict prognosis, recurrence, and
immunotherapeutic implications. Aging (Albany NY). 12:25275–25293.
2020. View Article : Google Scholar : PubMed/NCBI
|
|
3
|
Ferlay J, Colombet M, Soerjomataram I,
Dyba T, Randi G, Bettio M, Gavin A, Visser O and Bray F: Cancer
incidence and mortality patterns in Europe: Estimates for 40
countries and 25 major cancers in 2018. Eur J Cancer. 103:356–387.
2018. View Article : Google Scholar : PubMed/NCBI
|
|
4
|
Cao M, Li H, Sun D and Chen W: Cancer
burden of major cancers in China: A need for sustainable actions.
Cancer Commun (Lond). 40:205–210. 2020. View Article : Google Scholar : PubMed/NCBI
|
|
5
|
Kerdidani D, Chouvardas P, Arjo AR,
Giopanou I, Ntaliarda G, Guo YA, Tsikitis M, Kazamias G, Potaris K,
Stathopoulos GT, et al: Wnt1 silences chemokine genes in dendritic
cells and induces adaptive immune resistance in lung
adenocarcinoma. Nat Commun. 10:14052019. View Article : Google Scholar : PubMed/NCBI
|
|
6
|
Xu F, Huang X, Li Y, Chen Y and Lin L:
m6A-related lncRNAs are potential biomarkers for
predicting prognoses and immune responses in patients with LUAD.
Mol Ther Nucleic Acids. 24:780–791. 2021. View Article : Google Scholar : PubMed/NCBI
|
|
7
|
Zhang C, Zhang J, Xu FP, Wang YG, Xie Z,
Su J, Dong S, Nie Q, Shao Y, Zhou Q, et al: Genomic landscape and
immune microenvironment features of preinvasive and early invasive
lung adenocarcinoma. J Thorac Oncol. 14:1912–1923. 2019. View Article : Google Scholar : PubMed/NCBI
|
|
8
|
Jurisic V, Vukovic V, Obradovic J,
Gulyaeva LF, Kushlinskii NE and Djordjević N: EGFR polymorphism and
survival of NSCLC patients treated with TKIs: A systematic review
and meta-analysis. J Oncol. 2020:19732412020. View Article : Google Scholar : PubMed/NCBI
|
|
9
|
Gao J, Zhang L, Peng K and Sun H:
Diagnostic value of serum tumor markers CEA, CYFRA21-1, SCCAg, NSE
and ProGRP for lung cancers of different pathological types. Nan
Fang Yi Ke Da Xue Xue Bao. 42:886–891. 2022.(In Chinese).
PubMed/NCBI
|
|
10
|
Li Q and Sang S: Diagnostic value and
clinical significance of combined detection of serum markers
CYFRA21-1, SCC Ag, NSE, CEA and ProGRP in Non-small cell lung
carcinoma. Clin Lab. 662020.
|
|
11
|
Ma L, Xie XW, Wang HY, Ma LY and Wen ZG:
Clinical evaluation of tumor markers for diagnosis in patients with
non-small cell lung cancer in China. Asian Pac J Cancer Prev.
16:4891–4894. 2015. View Article : Google Scholar : PubMed/NCBI
|
|
12
|
Dal Bello MG, Filiberti RA, Alama A,
Orengo AM, Mussap M, Coco S, Vanni I, Boccardo S, Rijavec E, Genova
C, et al: The role of CEA, CYFRA21-1 and NSE in monitoring tumor
response to Nivolumab in advanced non-small cell lung cancer
(NSCLC) patients. J Transl Med. 17:742019. View Article : Google Scholar : PubMed/NCBI
|
|
13
|
Hao C, Zhang G and Zhang L: Serum CEA
levels in 49 different types of cancer and noncancer diseases. Prog
Mol Biol Transl Sci. 162:213–227. 2019. View Article : Google Scholar : PubMed/NCBI
|
|
14
|
Yang Q, Zhang P, Wu R, Lu K and Zhou H:
Identifying the best marker combination in CEA, CA125, CY211, NSE,
and SCC for lung cancer screening by combining ROC curve and
logistic regression analyses: Is It Feasible? Dis Markers.
2018:20828402018. View Article : Google Scholar : PubMed/NCBI
|
|
15
|
Zhang Y, Luo J, Liu Z, Liu X, Ma Y, Zhang
B, Chen Y, Li X, Feng Z, Yang N, et al: Identification of hub genes
in colorectal cancer based on weighted gene co-expression network
analysis and clinical data from The Cancer Genome Atlas. Biosci
Rep. 41:BSR202112802021. View Article : Google Scholar : PubMed/NCBI
|
|
16
|
Kuenzi BM and Ideker T: A census of
pathway maps in cancer systems biology. Nat Rev Cancer. 20:233–246.
2020. View Article : Google Scholar : PubMed/NCBI
|
|
17
|
Barabási AL, Gulbahce N and Loscalzo J:
Network medicine: A network-based approach to human disease. Nat
Rev Genet. 12:56–68. 2011. View Article : Google Scholar : PubMed/NCBI
|
|
18
|
Tian Y, Wang SS, Zhang Z, Rodriguez OC,
Petricoin E III, Shih IeM, Chan D, Avantaggiati M, Yu G, Ye S, et
al: Integration of Network biology and imaging to study cancer
phenotypes and responses. IEEE/ACM Trans Comput Biol Bioinform.
11:1009–1019. 2014. View Article : Google Scholar : PubMed/NCBI
|
|
19
|
Joshi A, Rienks M, Theofilatos K and Mayr
M: Systems biology in cardiovascular disease: a multiomics
approach. Nat Rev Cardiol. 18:313–330. 2021. View Article : Google Scholar : PubMed/NCBI
|
|
20
|
Langfelder P and Horvath S: WGCNA: An R
package for weighted correlation network analysis. BMC
Bioinformatics. 9:5592008. View Article : Google Scholar : PubMed/NCBI
|
|
21
|
Fuller T, Langfelder P, Presson A and
Horvath S: Review of Weighted Gene Coexpression Network Analysis.
Handbook of Statistical Bioinformatics. Lu HH-S, Schölkopf B and
Zhao H: Springer; Berlin Heidelberg, Berlin, Heidelberg: pp.
369–388. 2011, View Article : Google Scholar
|
|
22
|
van Dam S, Võsa U, van der Graaf A, Franke
L and de Magalhães JP: Gene co-expression analysis for functional
classification and gene-disease predictions. Brief Bioinform.
19:575–592. 2018.PubMed/NCBI
|
|
23
|
Wan Q, Tang J, Han Y and Wang D:
Co-expression modules construction by WGCNA and identify potential
prognostic markers of uveal melanoma. Exp Eye Res. 166:13–20. 2018.
View Article : Google Scholar : PubMed/NCBI
|
|
24
|
Yin X, Wang P, Yang T, Li G, Teng X, Huang
W and Yu H: Identification of key modules and genes associated with
breast cancer prognosis using WGCNA and ceRNA network analysis.
Aging (Albany NY). 13:2519–2538. 2020. View Article : Google Scholar : PubMed/NCBI
|
|
25
|
Bai KH, He SY, Shu LL, Wang WD, Lin SY,
Zhang QY, Li L, Cheng L and Dai YJ: Identification of cancer stem
cell characteristics in liver hepatocellular carcinoma by WGCNA
analysis of transcriptome stemness index. Cancer Med. 9:4290–4298.
2020. View Article : Google Scholar : PubMed/NCBI
|
|
26
|
Zhou J, Guo H, Liu L, Hao S, Guo Z, Zhang
F, Gao Y, Wang Z and Zhang W: Construction of co-expression modules
related to survival by WGCNA and identification of potential
prognostic biomarkers in glioblastoma. J Cell Mol Med.
25:1633–1644. 2021. View Article : Google Scholar : PubMed/NCBI
|
|
27
|
Ritchie ME, Phipson B, Wu D, Hu Y, Law CW,
Shi W and Smyth GK: limma powers differential expression analyses
for RNA-sequencing and microarray studies. Nucleic Acids Res.
43:e472015. View Article : Google Scholar : PubMed/NCBI
|
|
28
|
Chen L, Yuan L, Wang Y, Wang G, Zhu Y, Cao
R, Qian G, Xie C, Liu X, Xiao Y and Wang X: Co-expression network
analysis identified FCER1G in association with progression and
prognosis in human clear cell renal cell carcinoma. Int J Biol Sci.
13:1361–1372. 2017. View Article : Google Scholar : PubMed/NCBI
|
|
29
|
Nakamura H, Fujii K, Gupta V, Hata H,
Koizumu H, Hoshikawa M, Naruki S, Miyata Y, Takahashi I, Miyazawa
T, et al: Identification of key modules and hub genes for
small-cell lung carcinoma and large-cell neuroendocrine lung
carcinoma by weighted gene co-expression network analysis of
clinical tissue-proteomes. PLoS One. 14:e02171052019. View Article : Google Scholar : PubMed/NCBI
|
|
30
|
Chen X, Hu L, Wang Y, Sun W and Yang C:
Single Cell Gene Co-expression network reveals FECH/CROT signature
as a prognostic marker. Cells. 8:6982019. View Article : Google Scholar : PubMed/NCBI
|
|
31
|
Di Y, Chen D, Yu W and Yan L: Bladder
cancer stage-associated hub genes revealed by WGCNA co-expression
network analysis. Hereditas. 156:72019. View Article : Google Scholar : PubMed/NCBI
|
|
32
|
Song Y, Pan Y and Liu J: The relevance
between the immune response-related gene module and clinical traits
in head and neck squamous cell carcinoma. Cancer Manag Res.
11:7455–7472. 2019. View Article : Google Scholar : PubMed/NCBI
|
|
33
|
Leon LM, Gautier M, Allan R, Ilié M,
Nottet N, Pons N, Paquet A, Lebrigand K, Truchi M, Fassy J, et al:
Correction: The nuclear hypoxia-regulated NLUCAT1 long non-coding
RNA contributes to an aggressive phenotype in lung adenocarcinoma
through regulation of oxidative stress. Oncogene. 40:26212021.
View Article : Google Scholar : PubMed/NCBI
|
|
34
|
Yu DH, Ruan XL, Huang JY, Liu XP, Ma HL,
Chen C, Hu WD and Li S: Analysis of the interaction network of Hub
miRNAs-Hub genes, being involved in idiopathic pulmonary fibers and
its emerging role in Non-small cell lung cancer. Front Genet.
11:3022020. View Article : Google Scholar : PubMed/NCBI
|
|
35
|
Wu Y, Yang L, Zhang L, Zheng X, Xu H, Wang
K and Weng X: Identification of a Four-gene signature associated
with the prognosis prediction of lung adenocarcinoma based on
integrated bioinformatics Analysis. Genes (Basel). 13:2382022.
View Article : Google Scholar : PubMed/NCBI
|
|
36
|
Liao Y, Wang Y, Cheng M, Huang C and Fan
X: Weighted gene coexpression network analysis of features that
control cancer stem cells reveals prognostic biomarkers in lung
adenocarcinoma. Front Genet. 11:3112020. View Article : Google Scholar : PubMed/NCBI
|
|
37
|
Deng L, Long F, Wang T, Dai L, Chen H,
Yang Y and Xie G: Identification of an immune classification and
prognostic genes for lung adenocarcinoma based on immune cell
signatures. Front Med (Lausanne). 9:8553872022. View Article : Google Scholar : PubMed/NCBI
|
|
38
|
Kar S: Unraveling cell-cycle dynamics in
cancer. Cell Syst. 2:8–10. 2016. View Article : Google Scholar : PubMed/NCBI
|
|
39
|
Icard P, Fournel L, Wu Z, Alifano M and
Lincet H: Interconnection between Metabolism and Cell Cycle in
Cancer. Trends Biochem Sci. 44:490–501. 2019. View Article : Google Scholar : PubMed/NCBI
|
|
40
|
Evan GI and Vousden KH: Proliferation,
cell cycle and apoptosis in cancer. Nature. 411:342–348. 2001.
View Article : Google Scholar : PubMed/NCBI
|
|
41
|
Suski JM, Braun M, Strmiska V and Sicinski
P: Targeting cell-cycle machinery in cancer. Cancer Cell.
39:759–778. 2021. View Article : Google Scholar : PubMed/NCBI
|
|
42
|
Colak S and Ten Dijke P: Targeting TGF-β
signaling in cancer. Trends Cancer. 3:56–71. 2017. View Article : Google Scholar : PubMed/NCBI
|
|
43
|
Ingham M and Schwartz GK: Cell-cycle
therapeutics come of age. J Clin Oncol. 35:2949–2959. 2017.
View Article : Google Scholar : PubMed/NCBI
|
|
44
|
Deng Z, Huang K, Liu D, Luo N, Liu T, Han
L, Du D, Lian D, Zhong Z and Peng J: Key candidate prognostic
biomarkers correlated with immune infiltration in hepatocellular
carcinoma. J Hepatocell Carcinoma. 8:1607–1622. 2021. View Article : Google Scholar : PubMed/NCBI
|
|
45
|
Huang C, He J, Dong Y, Huang L, Chen Y,
Peng A and Huang H: Identification of novel prognostic markers
associated with laryngeal squamous cell carcinoma using
comprehensive analysis. Front Oncol. 11:7791532021. View Article : Google Scholar : PubMed/NCBI
|
|
46
|
Liu HY and Zhang CJ: Identification of
differentially expressed genes and their upstream regulators in
colorectal cancer. Cancer Gene Ther. 24:244–250. 2017. View Article : Google Scholar : PubMed/NCBI
|
|
47
|
Yang H, Zhang M, Mao XY, Chang H,
Perez-Losada J and Mao JH: Distinct clinical impact and biological
function of angiopoietin and angiopoietin-like proteins in human
breast cancer. Cells. 10:25902021. View Article : Google Scholar : PubMed/NCBI
|
|
48
|
Beaufrère A, Caruso S, Calderaro J, Poté
N, Bijot JC, Couchy G, Cauchy F, Vilgrain V, Zucman-Rossi J and
Paradis V: Gene expression signature as a surrogate marker of
microvascular invasion on routine hepatocellular carcinoma
biopsies. J Hepatol. 76:343–352. 2022. View Article : Google Scholar : PubMed/NCBI
|
|
49
|
Ouyang X, Zhang G, Pan H and Huang J:
Susceptibility and severity of cancer-related fatigue in colorectal
cancer patients is associated with SLC6A4 gene single nucleotide
polymorphism rs25531 A>G genotype. Eur J Oncol Nurs. 33:97–101.
2018. View Article : Google Scholar : PubMed/NCBI
|
|
50
|
Wesmiller SW, Bender CM, Sereika SM,
Ahrendt G, Bonaventura M, Bovbjerg DH and Conley Y: Association
between serotonin transport polymorphisms and postdischarge nausea
and vomiting in women following breast cancer surgery. Oncol Nurs
Forum. 41:195–202. 2014. View Article : Google Scholar : PubMed/NCBI
|
|
51
|
Yang Q, Chu W, Yang W, Cheng Y, Chu C, Pan
X, Ye J, Cao J, Gan S and Cui X: Identification of RNA transcript
makers associated with prognosis of kidney renal clear cell
carcinoma by a competing endogenous RNA network analysis. Front
Genet. 11:5400942020. View Article : Google Scholar : PubMed/NCBI
|
|
52
|
Weng JY and Salazar N: DNA Methylation
analysis identifies patterns in progressive glioma grades to
predict patient survival. Int J Mol Sci. 22:10202021. View Article : Google Scholar : PubMed/NCBI
|
|
53
|
Zheng Y, Chen L, Li J, Yu B, Su L, Chen X,
Yu Y, Yan M, Liu B and Zhu Z: Hypermethylated DNA as potential
biomarkers for gastric cancer diagnosis. Clin Biochem.
44:1405–1411. 2011. View Article : Google Scholar : PubMed/NCBI
|
|
54
|
Zhang Y, Liu X, Liu L, Li J, Hu Q and Sun
R: Expression and prognostic significance of m6A-related
genes in lung adenocarcinoma. Med Sci Monit.
26:e9196442020.PubMed/NCBI
|
|
55
|
Yu Y and Tian X: Analysis of genes
associated with prognosis of lung adenocarcinoma based on GEO and
TCGA databases. Medicine (Baltimore). 99:e201832020. View Article : Google Scholar : PubMed/NCBI
|
|
56
|
Sengupta D, Zeng L, Li Y, Hausmann S,
Ghosh D, Yuan G, Nguyen TN, Lyu R, Caporicci M, Morales Benitez A,
et al: NSD2 dimethylation at H3K36 promotes lung adenocarcinoma
pathogenesis. Mol Cell. 81:4481–4492.e4489. 2021. View Article : Google Scholar : PubMed/NCBI
|