Introduction
Gastrointestinal stromal tumors (GISTs) are amongst
the most common types of non-epithelial tumors of the
gastrointestinal tract with an annual incidence of one or two cases
per 100,000 individuals. In ~80% of the cases, patient age is
between 55 and 65 years with a slight male predominance (60, vs.
40%) (1,2).
Prognostic risk stratification is based on
conventional tumor characteristics, such as tumor size, involved
lymph nodes and metastases (according to the 7th TNM guidelines)
(3). Additionally, the mitotic
activity on hematoxylin and eosin (H&E)-stained slides
discriminates low and high mitotic GISTs (4). However, it is time-intensive to screen
the recommended 50 high-power fields (HPFs) in the pathologist’s
daily workflow, and the corresponding area (mm2) depends
on the microscope setup, which is often not calibrated. The
interobserver quality for the detection of mitosis is poor in GISTs
and soft tissue sarcoma (5,6), since the mitotic figures are extremely
heterogeneous and variably distributed. A useful approach is to
detect mitosis with cell cycle markers, such as Ki-67 and
phosphohistone H3 (PHH3), which highlight cells in all mitotic
phases [without G0 (7) or in the
late G2 and M cell cycle phases, respectively (8)]. However, instructions for the
evaluation of proliferation based on immunohistochemistry (IHC)
currently use heterogeneous cut-off values (9), semi-quantitative scoring of positive
cells (10) or counting of 1,000
cells (11,12). Thus, a definitive method of cell
counting remains to be established (13) or is unrealistic for the
pathologist’s workload. Combining an automated image analysis with
quantification tools, standardized instructions may simplify and
accelerate the assessment of the mitotic rate in GISTs and other
tumors.
Therefore, the current study quantitatively
investigated the PHH3- and Ki-67-based mitotic/proliferation
activity in GISTs, using IHC and automatic image analysis, to
estimate the H&E-based mitosis rate by a linear regression
model.
Materials and methods
Patient characteristics
The present study included 154 formalin-fixed and
paraffin-embedded (FFPE) tissue samples of primary resected GIST
between 1997 and 2012 with complete histopathological records
(spindle-shaped, epitheloid and mixed morphological types) and
classification according to TNM (for details see Table I) (3). The range of fixation time of the
obtained specimens was between 12 and 24 h in 4% phosphate-buffered
saline solution to avoid false-positive or -negative
immunohistochemical staining patterns due to under- or
over-fixation (14,15).
 | Table IClinical characteristics of GIST cases
and distribution of mitosis in H&E-stained specimens and
PHH3-/Ki-67-based mitotic/proliferation rates. |
Table I
Clinical characteristics of GIST cases
and distribution of mitosis in H&E-stained specimens and
PHH3-/Ki-67-based mitotic/proliferation rates.
| Characteristics | GISTs | Esophageal | Gastric | Small intestinal | Rectal |
|---|
| n (%) | 154 (100) | 1 (0.6) | 96 (62.3) | 54 (35.1) | 3 (1.9) |
| Female | 91 (59.1) | - | 55 (57.3) | 34 (63.0) | 2 (66.7) |
| Male | 63 (40.9) | 1 (100.0) | 41 (42.7) | 20 (37.0) | 1 (33.3) |
| Age, years (mean ±
SD) | 66.6±14.8 | 64.1c | 67.6±11.9 | 64.1±16.6 | 59.1±7.2 |
| Female | 65.6±14.8 | - | 67.6±13.0 | 62.8±17.2 | 57.7±9.5 |
| Male | 67.1±12.1 | 64.1c | 67.7±10.5 | 66.3±15.5 | 62c |
| Growth
patterna, s/e/m | 92/31/31 | 1/0/0 | 53/22/21 | 36/8/10 | 2/1/0 |
| Size, cm (mean ±
SD) | 4.9±3.8 | 3.0c | 4.9±4.0 | 4.9±3.4 | 2.9±2.1 |
| T stagingb, 1-2-3-4 | 30-81-29-14 | 0-1-0-0 | 18-51-19-8 | 11-27-10-6 | 1-2-0-0 |
| Mitotic activity,
low/highb | 99/55 | 1/0 | 62/34 | 34/20 | 2/1 |
| H&E mitotic rate,
% (mean ± SD per 50 HPFs, per mm2) | 10.8±26.0 | 1c | 9.0±27.4 | 14.8±25.7 | 3.0±2.6 |
| 0.71±1.73 | 0.06c | 0.58±1.79 | 0.96±1.68 | 0.19±0.17 |
| PHH3-associated
mitotic rate, % (mean ± SD per 50 HPFs, per mm2) | 31±70 | 7c | 31±83 | 32±44 | 8±6 |
| 10±23 | 2c | 10±27 | 10±14 | 2±2 |
| Ki-67-associated
proliferation rated, % (mean ± SD
per 50 HPFs, per mm2) | 612±737 | 133c | 548±699 | 736±810 | 600±517 |
| 204±245 | 44c | 182±233 | 245±270 | 200±172 |
| 2.16±3.88 | 0.67c | 1.89±3.56 | 2.78±4.47 | 0.05±0.04 |
Morphology
Based on conventional 5-μm H&E-stained FFPE
sections, mitotic cells were counted in 50 consecutive HPFs
according to previous studies (3,4) on a
Leica DM2000 microscope (Leica Microsystems, Vienna, Austria) by
two independent investigators.
IHC
IHC was performed using an Autostainer Plus (Dako
Österreich GmbH, Vienna, Austria), routinely, according to the
manufacturer’s instructions (16).
This involved using heat-induced epitope retrieval in pH 9.0
antigen retrieval buffer (Dako Österreich GmbH) at 95ºC for 40 min
for the Ki-67 (mouse monoclonal; 1:500; Dako Österreich GmbH) and
PHH3 (rabbit polyclonal; 1:200; Cell Marque Corporation, Rocklin,
CA, USA) antibodies.
Interpretation of IHC
PHH3-positive cells were counted manually in 50
HPFs. The Ki-67-based proliferation rate was assessed by the
optimized particle analysis module according to the software manual
(ImageAccess 9 Enterprise; Imagic Bildverarbeitung AG, Glattbrugg,
Switzerland) on three digitized hot spot areas and associated with
50 HPFs per mm2 tissue section area, as well as the
total number of cells.
Ethics
The present study was conducted following our
national and institutional guidelines, as well as in accordance
with the Declaration of Helsinki (1964). Based on the retrospective
nature of this study and full anonymization of the patient data,
the current study was not subject to formal approval of the
appropriate local ethics comitee.
Statistical analysis
Statistical analysis was performed using
IBM® SPSS® 20.0 (IBM Corporation, New York,
NY, USA). Kendall’s rank two-tailed test, Spearman’s rank
correlation test and a linear regression analysis were used for
correlation analysis and for the development of a prognostic model
for the mitosis rate on H&E sections. The distribution of
mitosis and proliferation rate was analyzed by Kolmogorov-Smirnov
test as well as by Monte Carlo sequence analysis. The interobserver
agreement for mitosis rate on H&E sections was calculated using
the κ-statistic. The Wilcoxon signed-rank test/Student’s t-test and
univariate analysis of variance (ANOVA) were applied for
differences between two or more groups of tissue samples,
respectively. For survival analysis, cases with a missing date of
mortality were excluded. Univariate survival analysis was performed
by the Kaplan-Meier method comparing the survival curves with the
log-rank test. P<0.05 was considered to indicate a statistically
significant difference.
Results
Patient characteristics and their
association with H&E-based mitosis rate and PHH3-/Ki-67-based
mitotic/proliferation count
According to Table
I, the majority of the 154 GISTs were of gastric origin (n=96;
62.3%) with a mean tumor size of 4.90±3.81 cm [mostly pT2 according
to TNM (3)], and predominantly with
spindle-shaped cell pattern (n=92; 59.7%), low mitotic activity
(4) and affecting more females
(n=91; 59.1%) than males.
Assessment of the mitotic and proliferation rate
revealed a significant increase between the observed
H&E-stained mitotic rate and the PHH3-based mitotic rate and,
particularly, the Ki-67-based proliferation rate (P<0.001),
whereby the calculated range was relatively high as reflected by
the standard deviation (Table I).
Overall, no normal distribution of mitotic and proliferation rate
was observed (Kolmogorov-Smirnov test). Additionally, the H&E
mitosis rate revealed a random distribution (for ~96% of the GIST
cases; Monte Carlo sequence analysis). The interobserver agreement
for detection of H&E mitosis was moderate (κ=0.562).
The mitotic/proliferation rate differed
significantly between spindle-shaped and epithelioid morphologies
(ANOVA; P<0.05). Furthermore, comparison of the clinical and
morphological results revealed a significant difference in
H&E-based mitosis and Ki-67-based proliferation rates (ANOVA;
P<0.05) between T1 and T3 stages, whereas no differences in
mitosis and proliferation were observed with regard to primary
tumor localizations.
Correlation analysis of mitotic and
proliferation rate
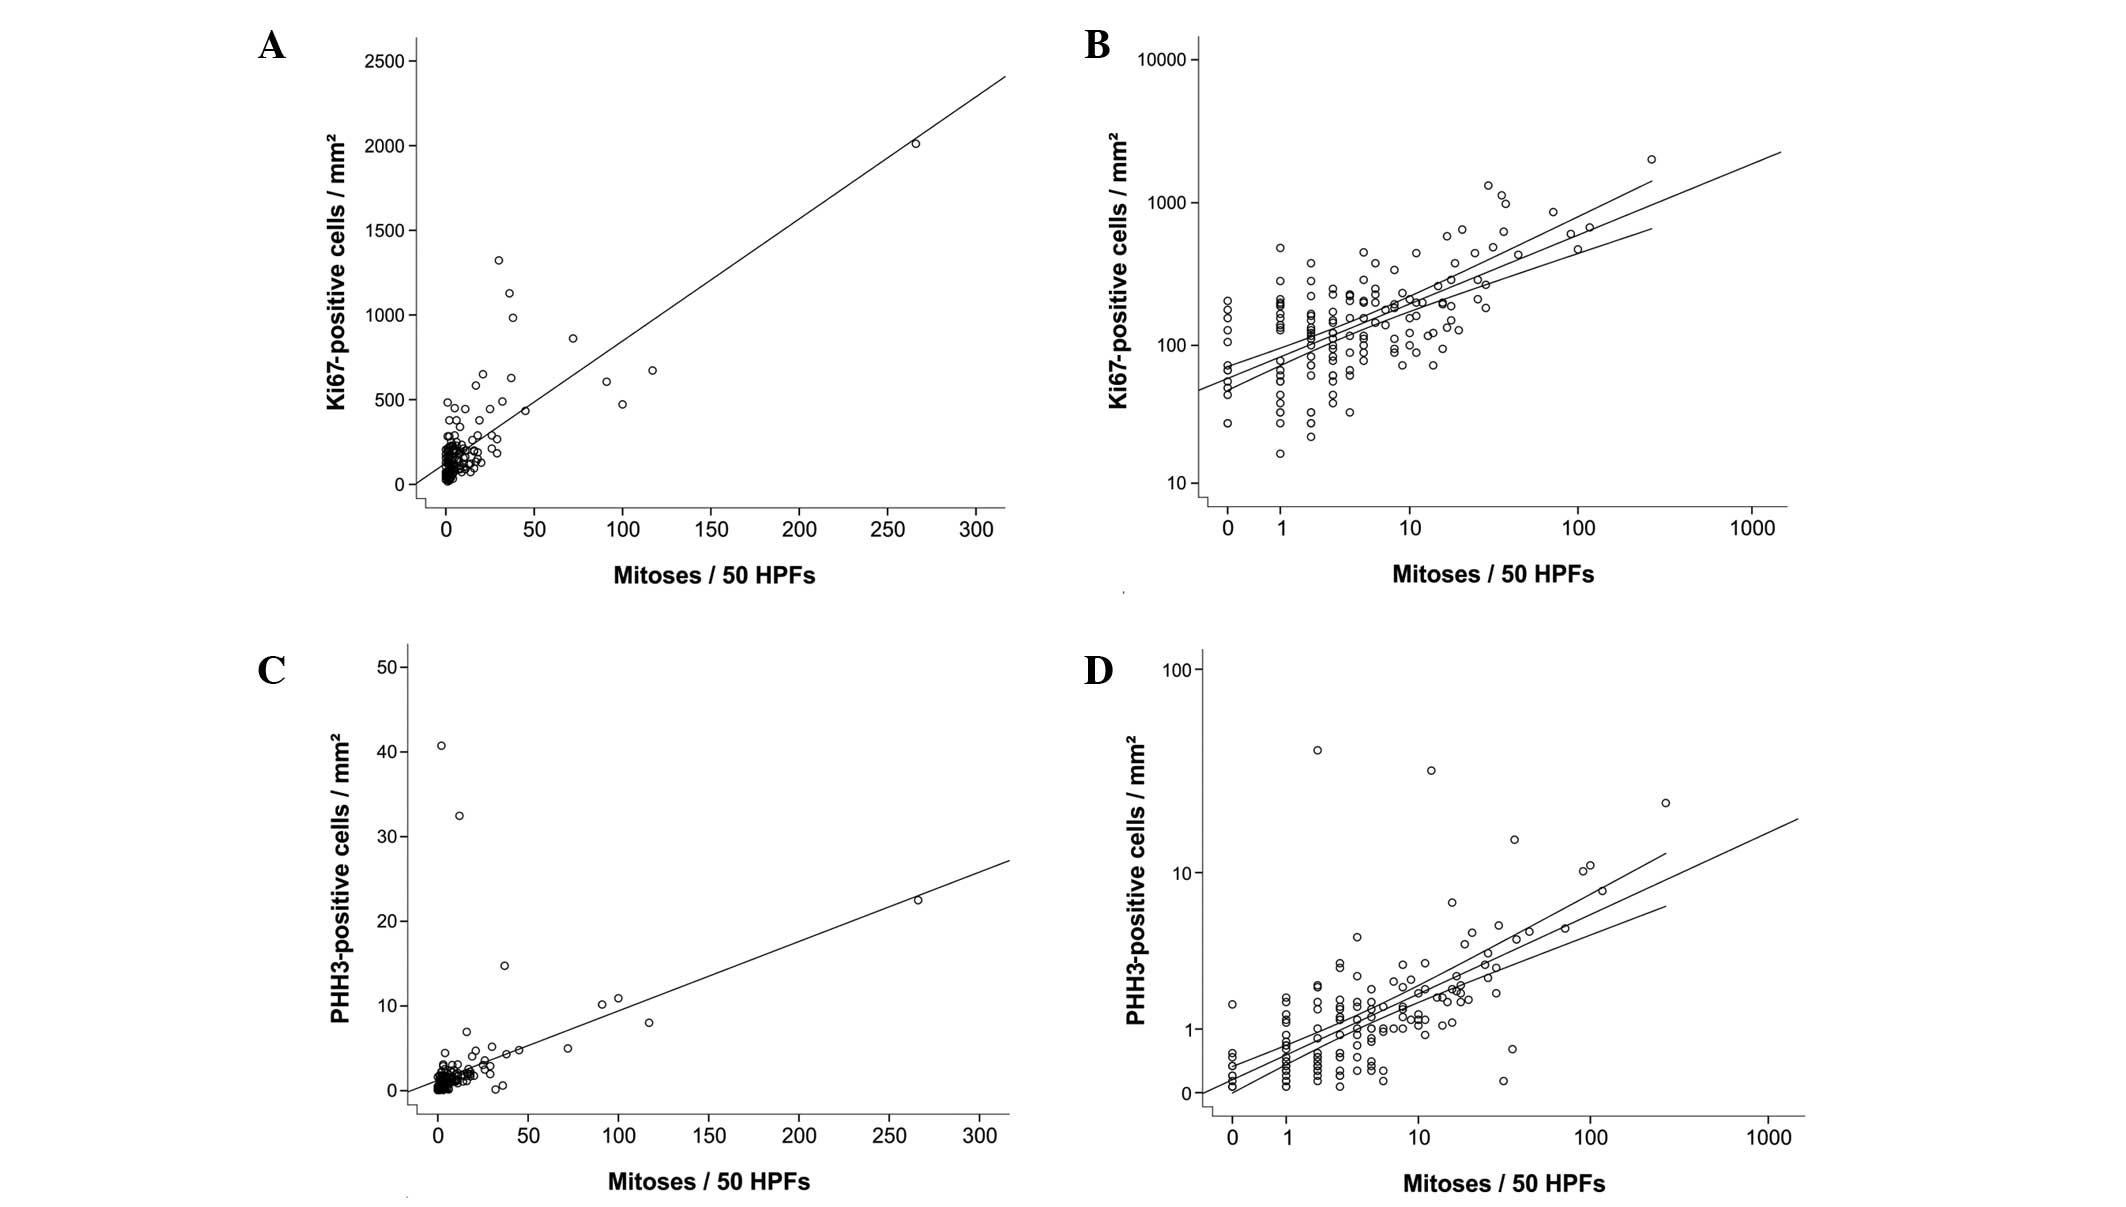
Correlation analysis highlighted a significant
correlation between H&E-based mitosis rate and PHH3- (Pearson’s
product moment correlation coefficient; r=0.457; P<0.01) or
Ki-67-based proliferation status per 50 HPFs or mm2,
respectively (r=0.780; P<0.01).
Linear regression model for H&E
mitotic rate
Linear regression analysis reached high significance
levels (ANOVA; P<0.001) with a combination of the two IHC
markers or Ki-67 alone, whereas the highest significance levels for
the intercept term and slope value of the linear regression were
reached using the Ki-67 expression analysis per mm2
using the following equation: f(x) = 0.084x – 6.328 (Table II and Fig. 1). Using the published cut-off of 5
per 50 HPFs, discriminating GISTs with low (<5 per HPF) and high
(>5 per HPF) mitotic rates (4)
as variables, the equation was re-calculated as follows: 5=0.084x –
6.328, where x= 134.8 per mm2. Therefore, GISTs with low
or high proliferation rates may be classified with a threshold
value of 134.8 Ki-67-positive cells per mm2 and this
mathematical model may be used for the rapid calculation of the
H&E-based mitotic rate.
| Table IIOverview of applied linear regression
models for H&E mitotic rate. |
Table II
Overview of applied linear regression
models for H&E mitotic rate.
| ANOVA | | Intercept | Slope |
|---|
|
| |
|
|
|---|
| Variable | F | P-value | R | Coefficient | P-value | Coefficient | P-value |
|---|
| PHH3/50 HPFs | 40.1 | <0.001 | 0.457 | 5.5 | 0.009 | 0.171 | <0.001 |
|
PHH3/mm2 | 40.1 | <0.001 | 0.457 | 5.5 | 0.009 | 2.547 | <0.001 |
| Ki-67, % | 46.1 | <0.001 | 0.482 | 3.7 | 0.086 | 3.301 | <0.001 |
| Ki-67a/mm2 | 235.6 | <0.001 | 0.780 | −6.328 | <0.001 | 0.084 | <0.001 |
Correlation between recurrence,
metastases and survival, and mitotic and proliferation rates
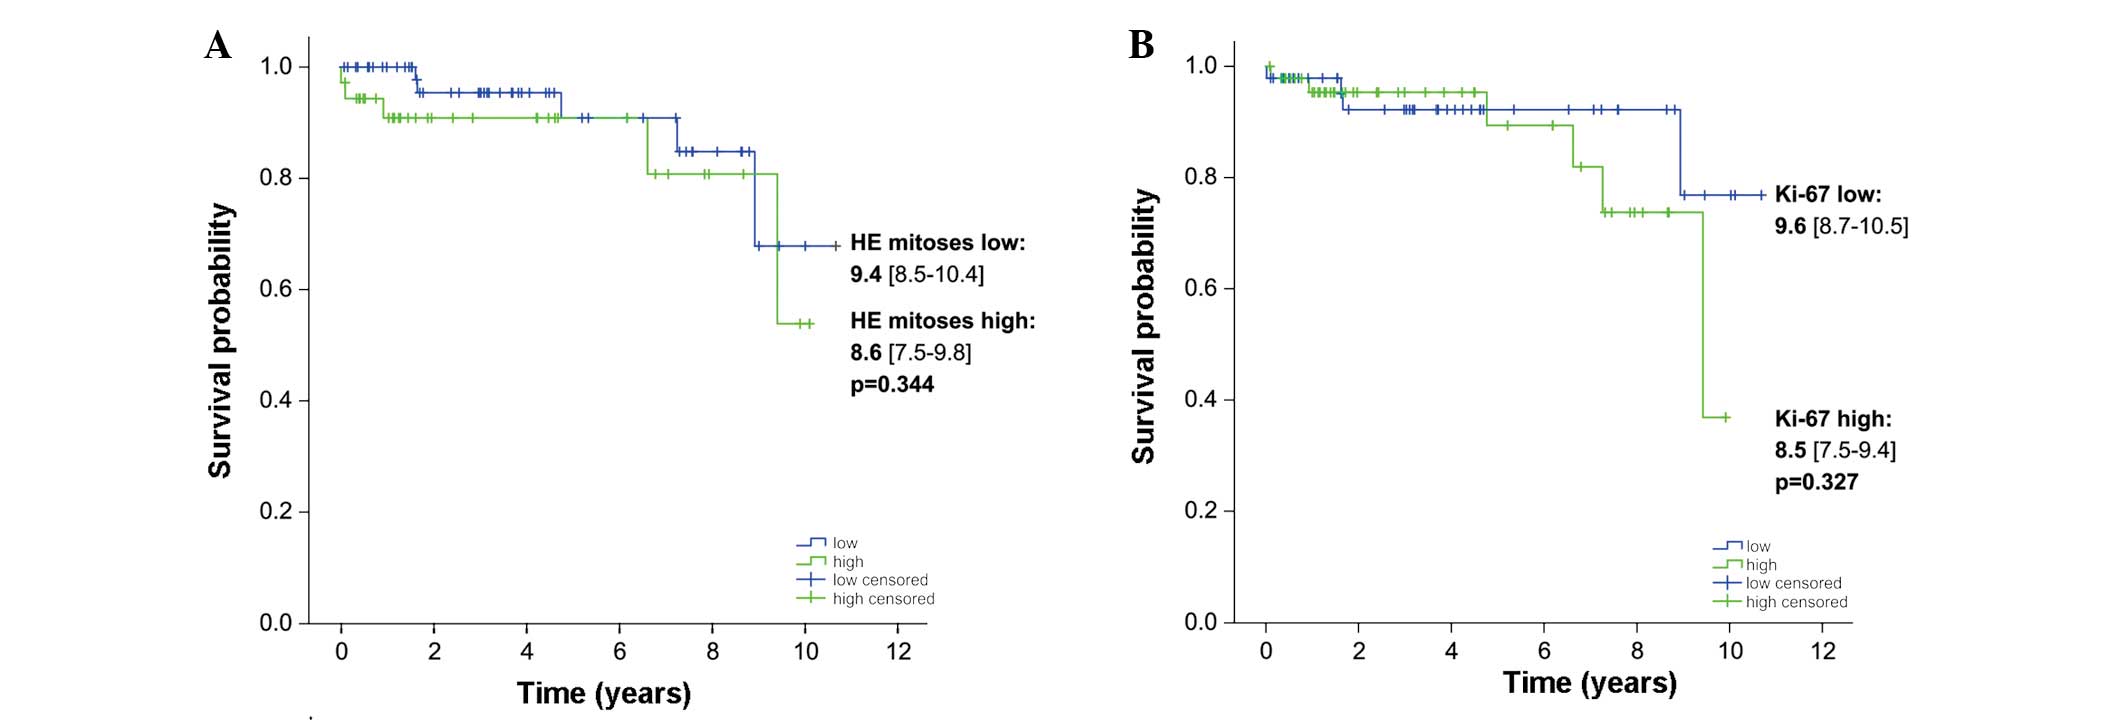
The statistical analysis of the rate of recurrence
and metastases indicated that Ki-67 exhibits a higher prognostic
impact on the recurrence and metastases of GISTs compared with pHH3
or H&E (P<0.01; Table
III). Although the Kaplan-Meier survival analysis revealed no
significant difference in the survival rate of patients with GIST
using the classical cut-off of 5 H&E mitoses per 50 HPFs or the
threshold value of 134.8 Ki-67-positive cells per mm2
(Fig. 2), the statistical analysis
showed by trend an improved prognosis based on the image analysis
of only three hot spots of Ki-67 IHC in Ki-67-low cases.
| Table IIICorrelation between recurrence,
metastases and survival, and mitotic and proliferation rates. |
Table III
Correlation between recurrence,
metastases and survival, and mitotic and proliferation rates.
| Variable | n (%) | H&E mitotic
rate (mean ± SD per 50 HPFs) | PHH3-based mitotic
rate (mean ± SD per mm2) | Ki-67-based
proliferation rate (mean ± SD per mm2) |
|---|
| Recurrence |
| Yes | 14 (9.1) | 14.6±15.1 | 2.8±3.8 | 461.5±418.7c |
| No | 140 (90.9) | 10.5±27.4 | 2.0±4.8 | 178.3±206.9c |
| Metastases |
| Yes | 14 (9.1) | 42.1±73.5b | 4.3±6.0b | 469.4±557.0c |
| No | 140 (90.9) | 7.7±12.8b | 1.8±4.5b | 177.5±172.5c |
| Survivala |
| Yes | 10 (6.5) | 8.6±15.3 | 1.9±4.5 | 187.4±186.4 |
| No | 144 (93.5) | 42.9±84.1 | 4.0±7.2 | 444.4±638.4 |
Discussion
The quantitative investigation of mitotic and
proliferative activity in 154 GISTs revealed the following: i)
H&E-based mitotic activity correlates better with Ki-67-based
proliferation than with PHH3-based mitotic status; and ii) we
provided a mathematical model for H&E-associated mitotic rate
assessment based on Ki-67 IHC on three hot spots per
mm2.
As consensually discussed (4), the prognosis of GIST depends on
location, size and mitotic activity. For mitotic activity
particularly, it is currently recommended to analyze 50 independent
HPFs, which is a rather time-consuming approach. The interobserver
κ-values of mitosis are poor for GIST (as demonstrated in the
present study) or other soft tissue sarcomas, and even lower for
other markers of mitotic/proliferative activity (5,6). This
is possibly caused by a non-standardized definition of mitosis, as
previously suggested by Miettinen and Lasota (13). As mitoses on H&E staining are
randomly distributed throughout the 50 HPFs in >95% of GIST
cases, an investigation of only 10–20 HPFs is likely to result in
considerable sampling errors. Additionally, HPF size depends on the
microscope used and is not usually described in the diagnosis
report.
As PHH3 and Ki-67 marked higher proportions of
mitotic cells, the investigation of 50 HPFs in 154 GIST cases (i.e.
7,700 HPFs) yielded a calculating prediction model for
H&E-based mitotic rate by PHH3 and/or Ki-67. The present study
defined a cut-off value of 134.8 Ki-67-positive cells per
mm2 for discriminating low versus high proliferative
GISTs, according to the TNM classification. Currently, no standards
for the quantification of Ki-67 have been accepted or recommended
(13), as available published data
describe only semi-quantitative (9,10) or
impossible approaches (11,12). Notably, Ki-67 exhibits an improved
prognostic value compared with PHH3 on the rate of recurrence and
metastasis of GIST. This supports the impact of the quantitative
assessment of Ki-67-associated proliferation as shown in other
tumor entities, such as breast cancer or malignant melanoma
(17,18).
Nevertheless, the recommended method must be
validated by further studies prior to replacing the classical
histological study of the mitotic index in GIST. Using the formula
developed in the current study, a (semi-) automatic imaging and
image analysis system is likely to provide an alternative and more
rapid and reliable (based on three IHC hot spots) assessment of the
mitosis rate in GISTs compared with the time-consuming
H&E-based approach.
Acknowledgements
The expert technical assistance of Mrs. Berta
Lechner, Mrs. Monika Prinz, Mrs. Ines Grob-Achleitner and Mr. Brian
van Merkestijn is gratefully acknowledged. Dr. Tobias Kiesslich was
supported by a research grant from the research fund of Paracelsus
Medical University (grant no. R-10/04/17-KIE) and the
Wissenschaftlicher Verein der Pathologie Salzburg/Austria.
Abbreviations:
|
GIST
|
gastrointestinal stromal tumor
|
|
H&E
|
hematoxylin-eosin
|
|
HPF
|
high power field
|
References
|
1
|
Tran T, Davila JA and El-Serag HB: The
epidemiology of malignant gastrointestinal stromal tumors: an
analysis of 1,458 cases from 1992 to 2000. Am J Gastroenterol.
100:162–168. 2005. View Article : Google Scholar : PubMed/NCBI
|
|
2
|
Miettinen M and Lasota J: Histopathology
of gastrointestinal stromal tumor. J Surg Oncol. 104:865–873. 2011.
View Article : Google Scholar : PubMed/NCBI
|
|
3
|
Tannapfel A and Wittekind C: The current
TNM system for gastrointestinal tumors part II. Pathologe.
31:348–352. 2010.(In German).
|
|
4
|
Fletcher CD, Berman JJ, Corless C, et al:
Diagnosis of gastrointestinal stromal tumors: A consensus approach.
Hum Pathol. 33:459–465. 2002. View Article : Google Scholar : PubMed/NCBI
|
|
5
|
Yamaguchi U, Hasegawa T, Sakurai S, et al:
Interobserver variability in histologic recognition, interpretation
of KIT immunostaining, and determining MIB-1 labeling indices in
gastrointestinal stromal tumors and other spindle cell tumors of
the gastrointestinal tract. Appl Immunohistochem Mol Morphol.
14:46–51. 2006. View Article : Google Scholar
|
|
6
|
Hasegawa T, Yamamoto S, Nojima T, et al:
Validity and reproducibility of histologic diagnosis and grading
for adult soft-tissue sarcomas. Hum Pathol. 33:111–115. 2002.
View Article : Google Scholar
|
|
7
|
Brown DC and Gatter KC: Ki67 protein: the
immaculate deception? Histopathology. 40:2–11. 2002. View Article : Google Scholar
|
|
8
|
Hendzel MJ, Wei Y, Mancini MA, et al:
Mitosis-specific phosphorylation of histone H3 initiates primarily
within pericentromeric heterochromatin during G2 and spreads in an
ordered fashion coincident with mitotic chromosome condensation.
Chromosoma. 106:348–360. 1997. View Article : Google Scholar
|
|
9
|
Wang X, Mori I, Tang W, et al: Helpful
parameter for malignant potential of gastrointestinal stromal
tumors (GIST). Jpn J Clin Oncol. 32:347–351. 2002. View Article : Google Scholar : PubMed/NCBI
|
|
10
|
Seidal T and Edvardsson H: Expression of
c-kit (CD117) and Ki67 provides information about the possible cell
of origin and clinical course of gastrointestinal stromal tumours.
Histopathology. 34:416–424. 1999. View Article : Google Scholar
|
|
11
|
Nakamura N, Yamamoto H, Yao T, et al:
Prognostic significance of expressions of cell-cycle regulatory
proteins in gastrointestinal stromal tumor and the relevance of the
risk grade. Hum Pathol. 36:828–837. 2005. View Article : Google Scholar
|
|
12
|
Wong NA, Young R, Malcomson RD, et al:
Prognostic indicators for gastrointestinal stromal tumours: a
clinicopathological and immunohistochemical study of 108 resected
cases of the stomach. Histopathology. 43:118–126. 2003. View Article : Google Scholar : PubMed/NCBI
|
|
13
|
Miettinen M and Lasota J: Gastrointestinal
stromal tumors: pathology and prognosis at different sites. Semin
Diagn Pathol. 23:70–83. 2006. View Article : Google Scholar : PubMed/NCBI
|
|
14
|
Illig R, Fritsch H and Schwarzer C:
Breaking the seals: efficient mRNA detection from human archival
paraffin-embedded tissue. RNA. 15:1588–1596. 2009. View Article : Google Scholar : PubMed/NCBI
|
|
15
|
Illig R, Fritsch H and Schwarzer C:
Spatio-temporal expression of HOX genes in human hindgut
development. Dev Dyn. 242:53–66. 2013. View Article : Google Scholar : PubMed/NCBI
|
|
16
|
Kemmerling R, Stintzing S, Muhlmann J, et
al: Primary testicular lymphoma: A strictly homogeneous
hematological disease? Oncol Rep. 23:1261–1267. 2010.PubMed/NCBI
|
|
17
|
Yerushalmi R, Woods R, Ravdin PM, et al:
Ki67 in breast cancer: prognostic and predictive potential. Lancet
Oncol. 11:174–183. 2010. View Article : Google Scholar : PubMed/NCBI
|
|
18
|
Gould Rothberg BE and Rimm DL: Biomarkers:
the useful and the not so useful--an assessment of molecular
prognostic markers for cutaneous melanoma. J Invest Dermatol.
130:1971–1987. 2010.
|