Introduction
Ovarian cancer is the fifth leading cause of
cancer-associated mortality in the Western world, the second most
common cause of gynecological cancer and the leading cause of
mortality due to gynecological malignancies (1). Epithelial ovarian cancer (EOC), which
accounts for 85–90% of ovarian types of cancer, does not follow a
traditional metastatic route via the bloodstream (2). The metastatic process occurs by two
alternate pathways as follows: By direct extension to adjacent
organs (for example extra-ovarian pelvic organs, colon, bladder and
liver), or by exfoliation of EOC cells from the primary tumor
(2). The latter pathway leads to
aggregation into multicellular spheroids carried by the peritoneal
tumor fluid, ascites, to the surrounding organs in the peritoneal
cavity (2).
Largely asymptomatic, ≥70% of patients with ovarian
cancer have reached an advanced stage of the disease by the time of
initial diagnosis, and the overall five-year survival rate for
these patients is <30% (3). The
current regimen of chemotherapy for ovarian cancer consists of a
taxane and platinum based therapy (4). This strategy for the treatment of
advanced-stage ovarian cancer results in an initial remission for
≤80% of patients (4). However,
following a short remission period (usually 6–22 months),
recurrence occurs in almost all patients (3). The lack of effective diagnostic and
prognostic tools for ovarian cancer renders this particular type of
cancer challenging to manage, and the majority of patients develop
chemotherapy resistant tumors and relapse (3).
The carbohydrate antigen 125 (CA125) is the most
widely used tumor marker in ovarian cancer (5,6). However,
the sensitivity and specificity of CA125 are disadvantages as its
expression level is increased in ~80% of all EOC cells and in 30%
of stage I EOC cells (5,6). Furthermore, positive values may also be
identified in numerous physiological phenomena and benign diseases,
including benign pelvic tumors or pelvic inflammatory diseases.
CA125 is useful for the follow-up of high-risk patients (including
breast cancer 1 positive patients) and for assessing the response
to chemotherapy. However, CA125 alone is not a sufficient marker
for the diagnosis of ovarian cancer (5,6). Human
epididymis protein 4 (HE4), a relatively novel marker for ovarian
carcinoma, may provide an improved correlation with the presence of
ovarian and endometrial cancer, compared with CA125 (7). Ultimately, the combination of markers
including CA125 and HE4, may be the best way to improve the
diagnosis of EOC (7). The data
suggest that markers with increased effectiveness remain to be
identified.
During previous decades, proteomics has become an
extensively developed technique used for biomarker identification
in various human diseases, including ovarian cancer (8). Proteomics may also improve the
understanding of ovarian cancer at the molecular level (8). It may provide an image of a proteome,
that may allow identification of the mechanisms underlying the
initiation of ovarian cancer, and reveal novel directions for the
treatment of the disease (8).
Certain previous studies have analyzed the proteomic
profiles of ovarian tumor tissues, cell lines, urine, ascites fluid
and blood samples (8–14). Analysis of the ovarian cancer cell
line secretome has also provided information on potential markers
(11,15). However, these studies were based on
cancer cell line comparison analyses, and the in vivo
physiological and pathological relevance was questionable. In order
to overcome these difficulties, a recent study used primary ovarian
cells instead of ovarian cell lines (16). From this study, three proteins were
selected and validated by immunoassay in blood samples as potent
markers for ovarian cancer. However, for proteomic and immunoassay
investigations, no patients with benign disease of the ovary were
included. This group of patients is useful for validating the
specificity of ovarian cancer markers. Furthermore, ovarian cancer
samples from various histological types were pooled into a single
ovarian cancer group, whereas those samples led to alternate
pathologies based on their origin. The present study investigated
the proteome of secreted proteins from the ovarian control (CTRL),
benign ovarian lesion (BOL) and high-grade serous ovarian carcinoma
(HGSOC) cells in order to identify novel specific markers easily
measurable in patients' sera.
Materials and methods
Patient characteristics
The present study was approved be Ethics Committee
of Maternity and Pediatrics, University Hospital of Geneva (Geneva,
Switzerland). Written informed consent was obtained from all
patients prior to enrollment in the present study (between 2009 and
2011). All tissue samples were separated into three alternate
groups of epithelial ovarian cells. For the CTRL group (n=4), the
tissue extraction and the purification of cells was performed on
ovaries without significant histological modification. BOL cells
were obtained from patients with BOL pathology (n=3). For the final
group, cancer cells were isolated from ascites (n=8) in patients
with HGSOC, International Federation of Gynecology and Obstetrics
stage IIIC. Furthermore, no significant differences were identified
in mean age between the CTRL (64.25±7.59), BOL (52.33±11.5) and
HGSOC (55.38±12.49) groups.
Purification of cancer cells
Ascites were centrifuged at 600 × g for 8 min at
room temperature (RT). The cell pellets were washed in Hanks'
balanced salt solution (HBSS; Gibco; Thermo Fisher Scientific,
Inc., Waltham, MA, USA) substituted with 25 mM HEPES (Gibco; Thermo
Fisher Scientific, Inc.) and 0.05 mg/ml gentamicin (Invitrogen;
Thermo Fisher Scientific, Inc.), filtered through a 100 µm mesh (BD
Biosciences, San Jose, CA, USA) and centrifuged again at 600 × g
for 8 min at RT. The resulting pellets were resuspended in
Dulbecco's modified Eagle's medium (DMEM; Sigma-Aldrich; Merck
Millipore, Darmstadt, Germany) substituted with 10% fetal bovine
serum (FBS; Biochrom, Ltd., Cambridge, UK) and 25 µg/ml plasmocin
(InvivoGen; San Diego, CA, USA). This cell suspension was loaded
onto a Percoll® (GE Healthcare Life Sciences, Chalfont,
UK) gradient (4 layers of Percoll® diluted in 10, 30, 40
and 70% HBSS) and centrifuged at 1,200 × g for 20 min at RT.
Subsequently, the cellular ring between Percoll® layers
40 and 20% were collected, diluted in DMEM and centrifuged at 600 ×
g for 8 min at RT. The pellets were resuspended and cells were
seeded at a density of 5×10⁵ in a 3-cm petri-dish.
Purification of BOL and CTRL
cells
Ovarian tissue was digested using 4 mg/ml dispase
(Gibco; Thermo Fisher Scientific, Inc.) in HBSS-HEPES (filtered on
0.22 µm) substituted with 1 µg/ml deoxyribonuclease (Roche
Diagnostics GmbH, Mannheim, Germany) for 30 min at 37°C. Ovarian
tissues and supernatants were plated into a 10-cm petri-dish, and
the tissue was scraped using a scalpel. Subsequently, the
supernatant was collected, neutralized with 5% FBS and centrifuged
at 600 × g for 8 min at RT. The resulting pellet was resuspended in
DMEM with 10% FBS-0.05 mg/ml gentamicin-25 µg/ml plasmocin.
Cell culture
Cells from the CTRL, BOL and HGSOC groups were
cultured in DMEM substituted with 10% FBS, 0.05 mg/ml gentamicin
and 25 µg/ml plasmocin for 24 h, followed by 48 h in culture medium
without FBS at 37°C (5% CO2). Subsequently, the
supernatants were collected, centrifuged at 600 × g for 8 min at RT
and stored at −20°C until they were prepared for analysis.
Proteomic analysis
Supernatant concentration
Cell culture supernatants were concentrated using
Vivaspin® 500 3 kDa (GE Healthcare Life Sciences),
according to the manufacturer's protocol. The protein
concentrations were evaluated using the Bio-Rad Protein assay
(Bio-Rad Laboratories, Inc. Hercules, CA, USA), according to the
manufacturer's protocol.
Liquid digestion of proteins
For each sample, 10 µg total proteins were dissolved
in 100 µl 6 M urea and 50 mM ammonium bicarbonate (AB), and the
mixture was incubated at 37°C for 30 min. Subsequently, 2 µl of 50
mM dithioerythritol (diluted in distilled water) was added, and the
reduction was carried out at 37°C for 1 h. Alkylation was performed
by adding 2 µl of 400 mM iodoacetamide (in distilled water), prior
to incubation for 1 h at RT in the dark whilst being agitated. The
samples were subsequently diluted 3 times in 50 mM AB and 5 µl 200
ng/µl trypsin porcine solution (sequence grade modified; Promega
Corporation, Madison, WI, USA) and the digestion was performed
overnight at 37°C. Finally, the samples were desalted using a C18
microspin column (Harvard Apparatus, Holliston, MA, USA), dried and
dissolved in 5% CH3CN/0.1% formic acid (FA) prior to
liquid chromatography (LC)-electrospray ionization (ESI)-mass
spectrometry (MS)/MS analysis.
Peptide fragmentation sequencing
LC-ESI-MS/MS was performed using a linear trap
quadrupole (LTQ) Orbitrap Velos (Thermo Fisher Scientific, Inc.)
equipped with a NanoAcquity system (Waters Corporation, Milford,
MA, USA). Peptides were trapped on a 5 µm 200 Å Magic C18 AQ
(Bruker-Michrom, Auburn, CA, USA) 0.1×20 mm pre-column, and were
separated using a commercial 0.075×150 mm analytical nanocolumn
(C18, 5 µm, 100 Å; Nikkyo Technos Co., Ltd., Tokyo, Japan). The
analytical separation was performed for 65 min using a gradient of
H2O/FA 99.9%/0.1% (solvent A) and CH3CN/FA
99.9%/0.1% (solvent B). The gradient was performed as follows: 0–1
min 95% A and 5% B, subsequently 65% A and 35% B for 55 min and
finally 20% A and 80% B for 65 min, at a flow rate of 220 nl/min.
ESI was performed at atmospheric pressure in a positive ionization
mode, without nebulizing gas. For MS analysis, the orbitrap
resolution was set at 60,000 and the ion population was set at
5×10⁵ with an m/z window of 400–2,000. For protein
identification, ≤8 precursor ions were selected for
collision-induced dissociation (CID) in the LTQ. The ion population
was set at 1×10⁴ (isolation width of 2 m/z), whereas for
MS/MS detection in the orbitrap, it was set at 1×10⁵
with an isolation width of 2 m/z units. The normalized collision
energies were set to 35% for CID.
Protein identification
Peak lists (MGF file format) were generated from raw
orbitrap data using the EasyProtConv conversion tool (version 1.6)
from the EasyProt software platform (17). The peak list files were searched
against the SwissProt database (release 15.10 of 21-Sept-2011)
using Mascot (version 2.2.0; Matrix Science, Ltd., London, UK).
Human taxonomy (20,323 sequences) was specified for database
searching. The parent ion tolerance was set to 10 ppm. Variable
amino acid modifications were oxidized using methionine and
carbamidomethyl cysteine. Trypsin was selected as the enzyme, with
one potential missed cleavage, and the normal cleavage mode was
used. The Mascot search was validated using Scaffold 3.6.5
(Proteome Software, Portland, OR, USA). Proteins matching two
alternate peptides with a minimum probability score of 95% were
selected for further analysis.
RT-qPCR
Cells from CTRL, BOL and HGSOC groups were cultured
for 72 h, prior to total RNA extraction using a
PureLink® RNA Mini kit (Ambion; Thermo Fisher
Scientific, Inc.), according to the manufacturer's instructions.
Reverse transcription was performed with 1 µg total RNA in a final
volume of 20 µl, using the High Capacity cDNA Reverse Transcription
kit (Applied Biosystems; Thermo Fisher Scientific, Inc.). The
quantitative detection of the PCR product was performed using a
KAPA SYBR® FAST Universal qPCR kit (KAPA Biosystems,
Inc., Wilmington, MA, USA). The relative expression levels of
gelsolin, Dickkopf protein 3 (DKK3), heat shock protein 10 kDa
(HSP-10) and mRNA were normalized to the housekeeping gene,
hypoxanthine phosphoribosyltransferase 1. The primer sequences are
presented in Table I.
 | Table I.Primer sequences. |
Table I.
Primer sequences.
| Primer | Sequence |
|---|
| hHPRT1-F | 5′-ATG ACC AGT CAA
CAG GGG AC-3′ |
| hHPRT1-R | 5′-TGC CTG ACC AAG
GAA AGC AA-3′ |
| hDKK3-F | 5′-CTG TGT GTC TGG
GGT CAC TG-3′ |
| hDKK3-R | 5′-GCT CTA GCT CCC
AGG TGA TG-3′ |
| hHSP-10-F | 5′-TTG GAT CGG GTT
CTA AAG GA-3′ |
| hHSP-10-R | 5′-TGC CTC CAT ATT
CTG GGA GA-3′ |
| hgelsolin-F | 5′-CCC TCA AAA CAG
CCT CTG AC-3′ |
| hgelsolin-R | 5′-TCT GCT TGG GGT
AGT CCA TC-3′ |
ELISA
The expression levels of gelsolin, DKK3 and HSP-10
in serum from the CTRL (n=19) or HGSOC patients (n=18) were
quantified by ELISA. ELISA's for gelsolin (Aviscera Bioscience,
Santa Clara, CA, USA), DKK3 (Sigma-Aldrich; Merck Millipore) and
HSP-10 (Uscn Life Sciences, Inc., Wuhan, China) were performed
according to the manufacturer's instructions.
Statistical analysis
Data are expressed as the mean ± standard error of
the mean of various samples. For RT-qPCR, the experiments were
performed in triplicate. P-values were calculated using the
Student's t-test (Microsoft Office Excel 2007). P<0.05 was
considered to indicate a statistically significant difference.
Potential clinical value of the nine significant
secreted proteins identified between CTRL/BOL and HGSOC cells using
two datasets
The PROGgene website (watson.compbio.iupui.edu/chirayu/proggene/database)
was used to investigate the correlation between the mRNA expression
levels of the nine significant secreted proteins identified in
CTRL/BOL and HGSOC cells, and the survival rate in ovarian cancer,
in the TCGA-OVAD and GSE13876 datasets.
Results
Global overview
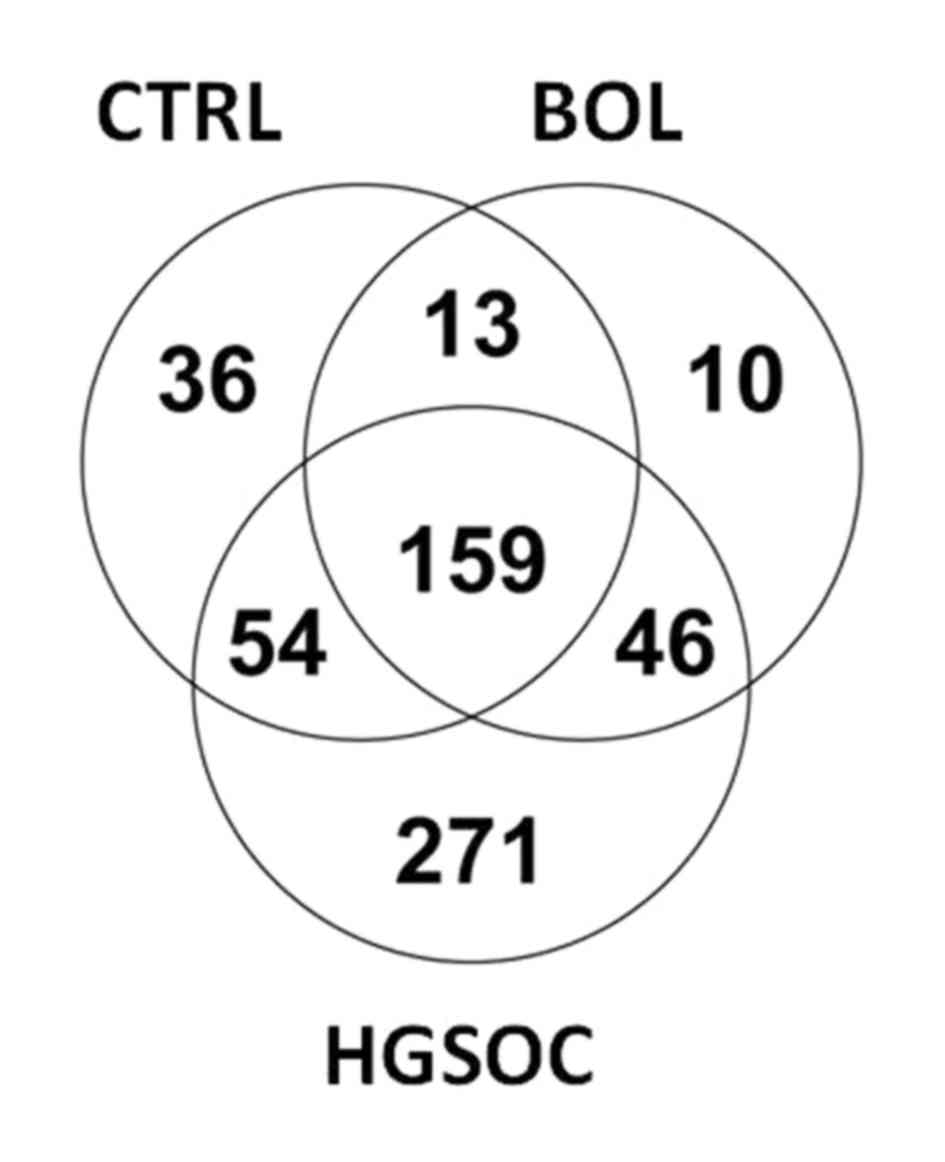
By LC-ESI-MS/MS analysis, a total of 589 proteins
were identified, as presented in Fig.
1. The Venn diagrams revealed that 159 proteins were identified
to be mutually expressed in the three groups (CTRL, BOL and HGSOC).
A total of 271 proteins were exclusively secreted by HGSOC cells,
36 by CTRL cells and 10 by BOL cells. These assays allowed the
identification of proteins exclusively secreted by CTRL/BOL cells,
compared with HGSOC cells. Finally, 13 proteins common to the CTRL
and BOL groups are not secreted by the HGSOC group.
Identification of the proteins
significantly and differentially secreted by HGSOC cells, compared
with CTRL cells and BOL cells
Among the 589 proteins identified, 64 were revealed
to be significantly and differentially secreted in CTRL cells
compared with HGSOC cells (P<0.05). The 32 most relevant
proteins are presented in Table II.
As presented in Table III, 21
proteins were revealed to be significantly and differentially
secreted from HGSOC cells compared with BOL cells. The majority
were not present in the list of proteins differentially secreted by
CTRL cells in comparison with HGSOC cells.
| Table II.Proteins significantly and
differentially secreted in CTRL and HGSOC cells. |
Table II.
Proteins significantly and
differentially secreted in CTRL and HGSOC cells.
|
|
|
| Quantification
value |
|---|
|
|---|
| Proteins | Accession no. | P-value | CTRL | HGSOC |
|---|
|
Fibulin-5a | Q9UBX5 | <0.001 | 4.25±-0.5 | 0.3±0.3 |
| Insulin-like growth
factor-binding protein 2b | P18065 | <0.001 | 2.3±2.3 | 15.25±0.9 |
| 72 kDa type IV
collagenasea | P08253 | <0.001 | 52.5±7 | 11.4±2.9 |
| IgG superfamily
containing leucine-rich repeat proteina | O14498 | <0.001 | 8.5±2 | 0.0 |
|
Fibulin-1a | P23142 | <0.001 | 11.8±2.5 | 0.5±0.5 |
| Latent-transforming
growth factor β-binding protein 2a | Q14767 | <0.001 | 13±2 | 1±1 |
| Procollagen-lysine,
2-oxoglutarate 5-dioxygenase 1a | Q02809 | <0.001 | 5.8±0.8 | 0.8±0.5 |
|
Nidogen-1a | P14543 | <0.001 | 12.5±3.5 | 0.0 |
| Collagen α-3 (VI)
chaina | P12111 | <0.001 | 40.3±12.6 | 0.0 |
|
Thrombospondin-1a | P07996 |
0.001 | 18.3±3.3 | 3.1±1.7 |
| Ezrinb | P15311 |
0.001 | 2.5±0.5 | 14.5±1.8 |
| Collagen alpha-2
(VI) chaina | P12110 |
0.001 | 5.3±0.8 | 0.9±0.6 |
| Connective tissue
growth factora | P29279 |
0.001 | 4±1.4 | 0.0 |
| Keratin, type II
cytoskeletal 8b | P05787 |
0.001 | 0.0 | 24.5±3.8 |
|
Stromelysin-3a | P24347 |
0.001 | 7±2.4 | 0.0 |
| Procollagen
C-endopeptidase enhancer 1a | Q15113 |
0.002 | 13.5±4.9 | 0.0 |
| Brain acid soluble
protein 1b | P80723 |
0.002 | 0.0 | 2.5±0.4 |
| Vimentin OS=Homo
sapiensa | P08670 |
0.002 | 36.3±5.7 | 12.8±3 |
| Extracellular
matrix protein 1a | Q16610 |
0.003 | 7.3±2.7 | 0.0 |
|
EMILIN-1a | Q9Y6C2 |
0.003 | 3.5±1.3 | 0.0 |
|
Endosialina | Q9HCU0 |
0.003 | 2.3±0.9 | 0.0 |
|
Stanniocalcin-1a | P52823 |
0.003 | 2.3±0.9 | 0.0 |
| Malate
dehydrogenase, mitochondrialb | P40926 |
0.003 | 1.5±0.5 | 7.9±1.1 |
| Keratin, type I
cytoskeletal 19b | P08727 |
0.003 | 0.5±05 | 17.4±3 |
| Complement
C3b | P01024 |
0.003 | 7.3±3.3 | 77.1±12.5 |
| Macrophage
colony-stimulating factor 1b | P09603 |
0.004 | 0.5±0.5 | 2.6±0.3 |
| Pigment
epithelium-derived factora | P36955 |
0.004 | 3±1.2 | 0.0 |
|
Stromelysin-1a | P08254 |
0.005 | 27.3±11.1 | 0.3±0.3 |
| Keratin, type II
cytoskeletal 7b | P08729 |
0.005 | 0.0 | 20.5±3.9 |
| Collagen α-1 (I)
chaina | P02452 |
0.005 | 58.8±13.8 | 18.3±4.6 |
|
Gelsolina | P06396 |
0.006 | 8.5±1.7 | 2.9±1.7 |
| Cathepsin
Ka | P43235 |
0.008 | 2.8±1.3 | 0.0 |
| Table III.Proteins significantly and
differentially secreted in BOL and HGSOC cells. |
Table III.
Proteins significantly and
differentially secreted in BOL and HGSOC cells.
|
|
|
|
| Quantification
value |
|---|
|
|---|
| Proteins | Accession no. | MW, kDa | P-value | BOL | HGSOC |
|---|
| Insulin-like growth
factor-binding protein 2a | P18065 | 35 | <0.001 | 5.3±2 | 15.3±0.9 |
| Insulin-like growth
factor-binding protein 7b | Q16270 | 29 | <0.001 | 28±2.9 | 15±1.3 |
| Macrophage
colony-stimulating factor 1a | P09603 | 60 | <0.001 | 0 | 2.6±0.3 |
| Connective tissue
growth factorb | P29279 | 38 |
0.006 | 4±2 | 0 |
| Neuroblastoma
suppressor of tumorigenicity 1b | P41271 | 19 |
0.006 | 1.3±0.7 | 0 |
| Dickkopf-related
protein 3b | Q9UBP4 | 38 |
0.010 | 11.7±2.2 | 3.8±1.3 |
| Keratin, type II
cytoskeletal 1a | P04264 | 66 |
0.013 | 4.7±0.3 | 10.4±1.1 |
| Monocyte
differentiation antigen CD14b | P08571 | 40 |
0.021 | 6.3±3.5 | 0.6±0.4 |
| SPARCb | P09486 | 35 |
0.021 | 53±8.2 | 32.6±3.4 |
|
Tenascin-Xb | P22105 | 464 |
0.023 | 36.6±20.3 | 4.6±1.9 |
| Inter-α-trypsin
inhibitor heavy chain H5b | Q86UX2 | 105 |
0.023 | 2.7±1.8 | 0 |
|
Tenascinb | P24821 | 241 |
0.023 | 5.3±3.5 | 0 |
|
Fibronectinb | P02751 | 263 |
0.024 | 162.7±65.5 | 59.1±6.9 |
|
Gelsolinb | P06396 | 86 |
0.027 | 6.3±0.3 | 2.9±0.8 |
| 10 kDa heat shock
protein, mitochondrialb | P61604 | 11 |
0.030 | 0 | 1.6±0.4 |
| Malate
dehydrogenase, mitochondriala | P40926 | 36 |
0.031 | 2.7±1.5 | 7.9±1.1 |
|
α-2-HS-glycoproteina | P02765 | 39 |
0.036 | 1.7±0.9 | 3.3±0.3 |
|
Vimentinb | P08670 | 54 |
0.037 | 26.7±4.8 | 12.8±3 |
| Prostaglandin-H2
D-isomerasea | P41222 | 21 |
0.038 | 1±1 | 4±0.7 |
|
Peroxiredoxin-2a | P32119 | 22 |
0.043 | 0 | 3.9±1 |
| Sulfhydryl oxidase
1a | O00391 | 83 |
0.048 | 6.7±1.9 | 15.8±2.3 |
Common proteins differentially
secreted by CTRL and BOL cells, compared with HGSOC cells
A total of nine proteins were significantly and
differentially secreted in CTRL and BOL cells, in comparison with
HGSOC cells (Table IV). These
proteins were evaluated for their potential clinical value by
analyzing the association between their expression level and
survival, using publically available datasets (Table V). The connective tissue growth factor
(CTGF) mRNA expression level was revealed to be associated with the
survival rate of patients with ovarian cancer in the TCGA-OVAD
database but not in the GSE13876 database. In the GSE13876
database, insulin like growth factor binding protein 2 (IGFBP2) and
vimentin mRNA expression levels demonstrated an association with
the rate of survival. Furthermore, all the evaluated genes
[gelsolin, DKK3, CTGF, IGFBP2, IGFBP7, colony stimulating factor 1
(CSF1), malate dehydrogenase 2 (MDH2) and vimentin] demonstrated a
significant association with the rate of survival using this
database. Subsequently, the present study focused on three of these
proteins: Gelsolin, DKK3 and HSP-10. Gelsolin and DKK3 demonstrated
significantly lower secretion in HGSOC cells, in comparison with
CTRL and BOL cells (Tables II and
III). Conversely, HGSOC cells
secreted greater levels of HSP-10 proteins, compared with CTRL or
BOL cells (Tables II and III).
| Table IV.Common proteins significantly and
differentially secreted in CTRL and BOL cells, vs. HGSOC cells. |
Table IV.
Common proteins significantly and
differentially secreted in CTRL and BOL cells, vs. HGSOC cells.
| Proteins | Accession no. | MW, kDa |
|---|
| 10 kDa heat shock
protein, mitochondrial | P61604 | 11 |
| Connective tissue
growth factor | P29279 | 38 |
| Dickkopf-related
protein 3 | Q9UBP4 | 38 |
| Gelsolin | P06396 | 86 |
| Insulin-like growth
factor-binding protein 2 | P18065 | 35 |
| Insulin-like growth
factor-binding protein 7 | Q16270 | 29 |
| Macrophage
colony-stimulating factor 1 | P09603 | 60 |
| Malate
dehydrogenase, mitochondrial | P40926 | 36 |
| Vimentin | P08670 | 54 |
| Table V.The nine significantly secreted
proteins identified in control/benign and ovarian cancer cells were
evaluated for their potential clinical value by analyzing the
association between their mRNA expression levels and patient
mortality, using two alternate publically available datasets. |
Table V.
The nine significantly secreted
proteins identified in control/benign and ovarian cancer cells were
evaluated for their potential clinical value by analyzing the
association between their mRNA expression levels and patient
mortality, using two alternate publically available datasets.
| Genes | TCGA-OVAD database
P-value | GSE13876 database
P-value |
|---|
| Gelsolin | 0.434 | 0.589 |
| Dickkopf-related
protein 3 | 0.083 | 0.241 |
| Connective tissue
growth factor | 0.008a | 0.962 |
| Insulin-like growth
factor-binding protein 2 | 0.221 | 0.013a |
| Insulin-like growth
factor-binding protein 7 | 0.871 | 0.568 |
| Macrophage
colony-stimulating factor 1 | 0.356 | ND |
| Malate
dehydrogenase, mitochondrial | 0.496 | 0.193 |
| Vimentin | 0.305 | 0.018a |
| 10 kDa heat shock
protein | ND | ND |
| Sum of these
genes | 0.18 | 0.048a |
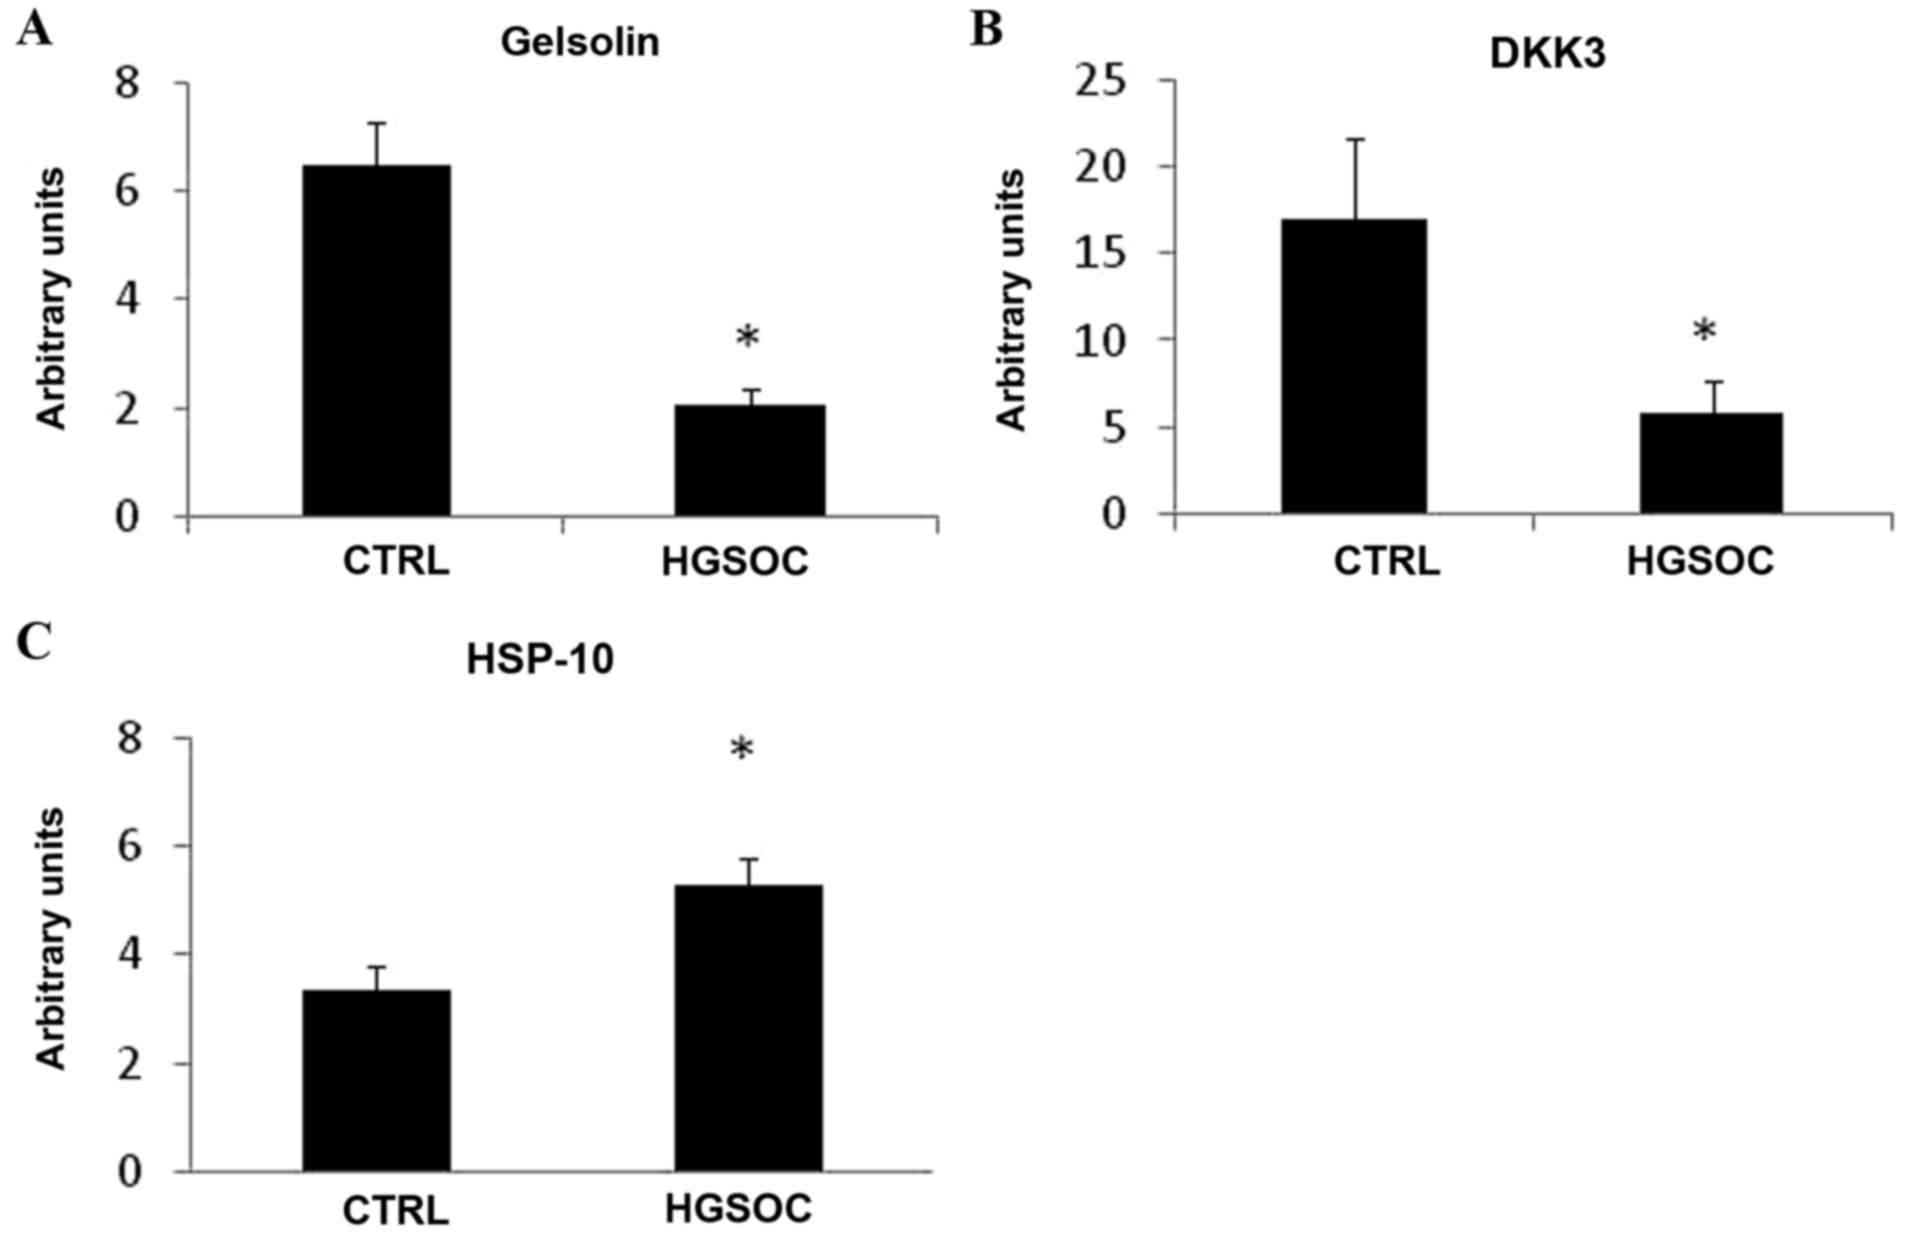
Gelsolin, DKK3 and HSP-10 mRNA
expression levels in HGSOC and CTRL cells
In order to determine if gelsolin, DKK3 and HSP-10
expression levels are modified in cancer cells, the present study
analyzed their mRNA expression levels in HGSOC and CTRL cells.
Gelsolin and DKK3 mRNA demonstrated significantly lower expression
levels in HGSOC cells, compared with in CTRL cells (Fig. 2A and B). However, HGSOC cells
expressed higher levels of HSP-10 mRNA, compared with CTRL cells
(Fig. 2C).
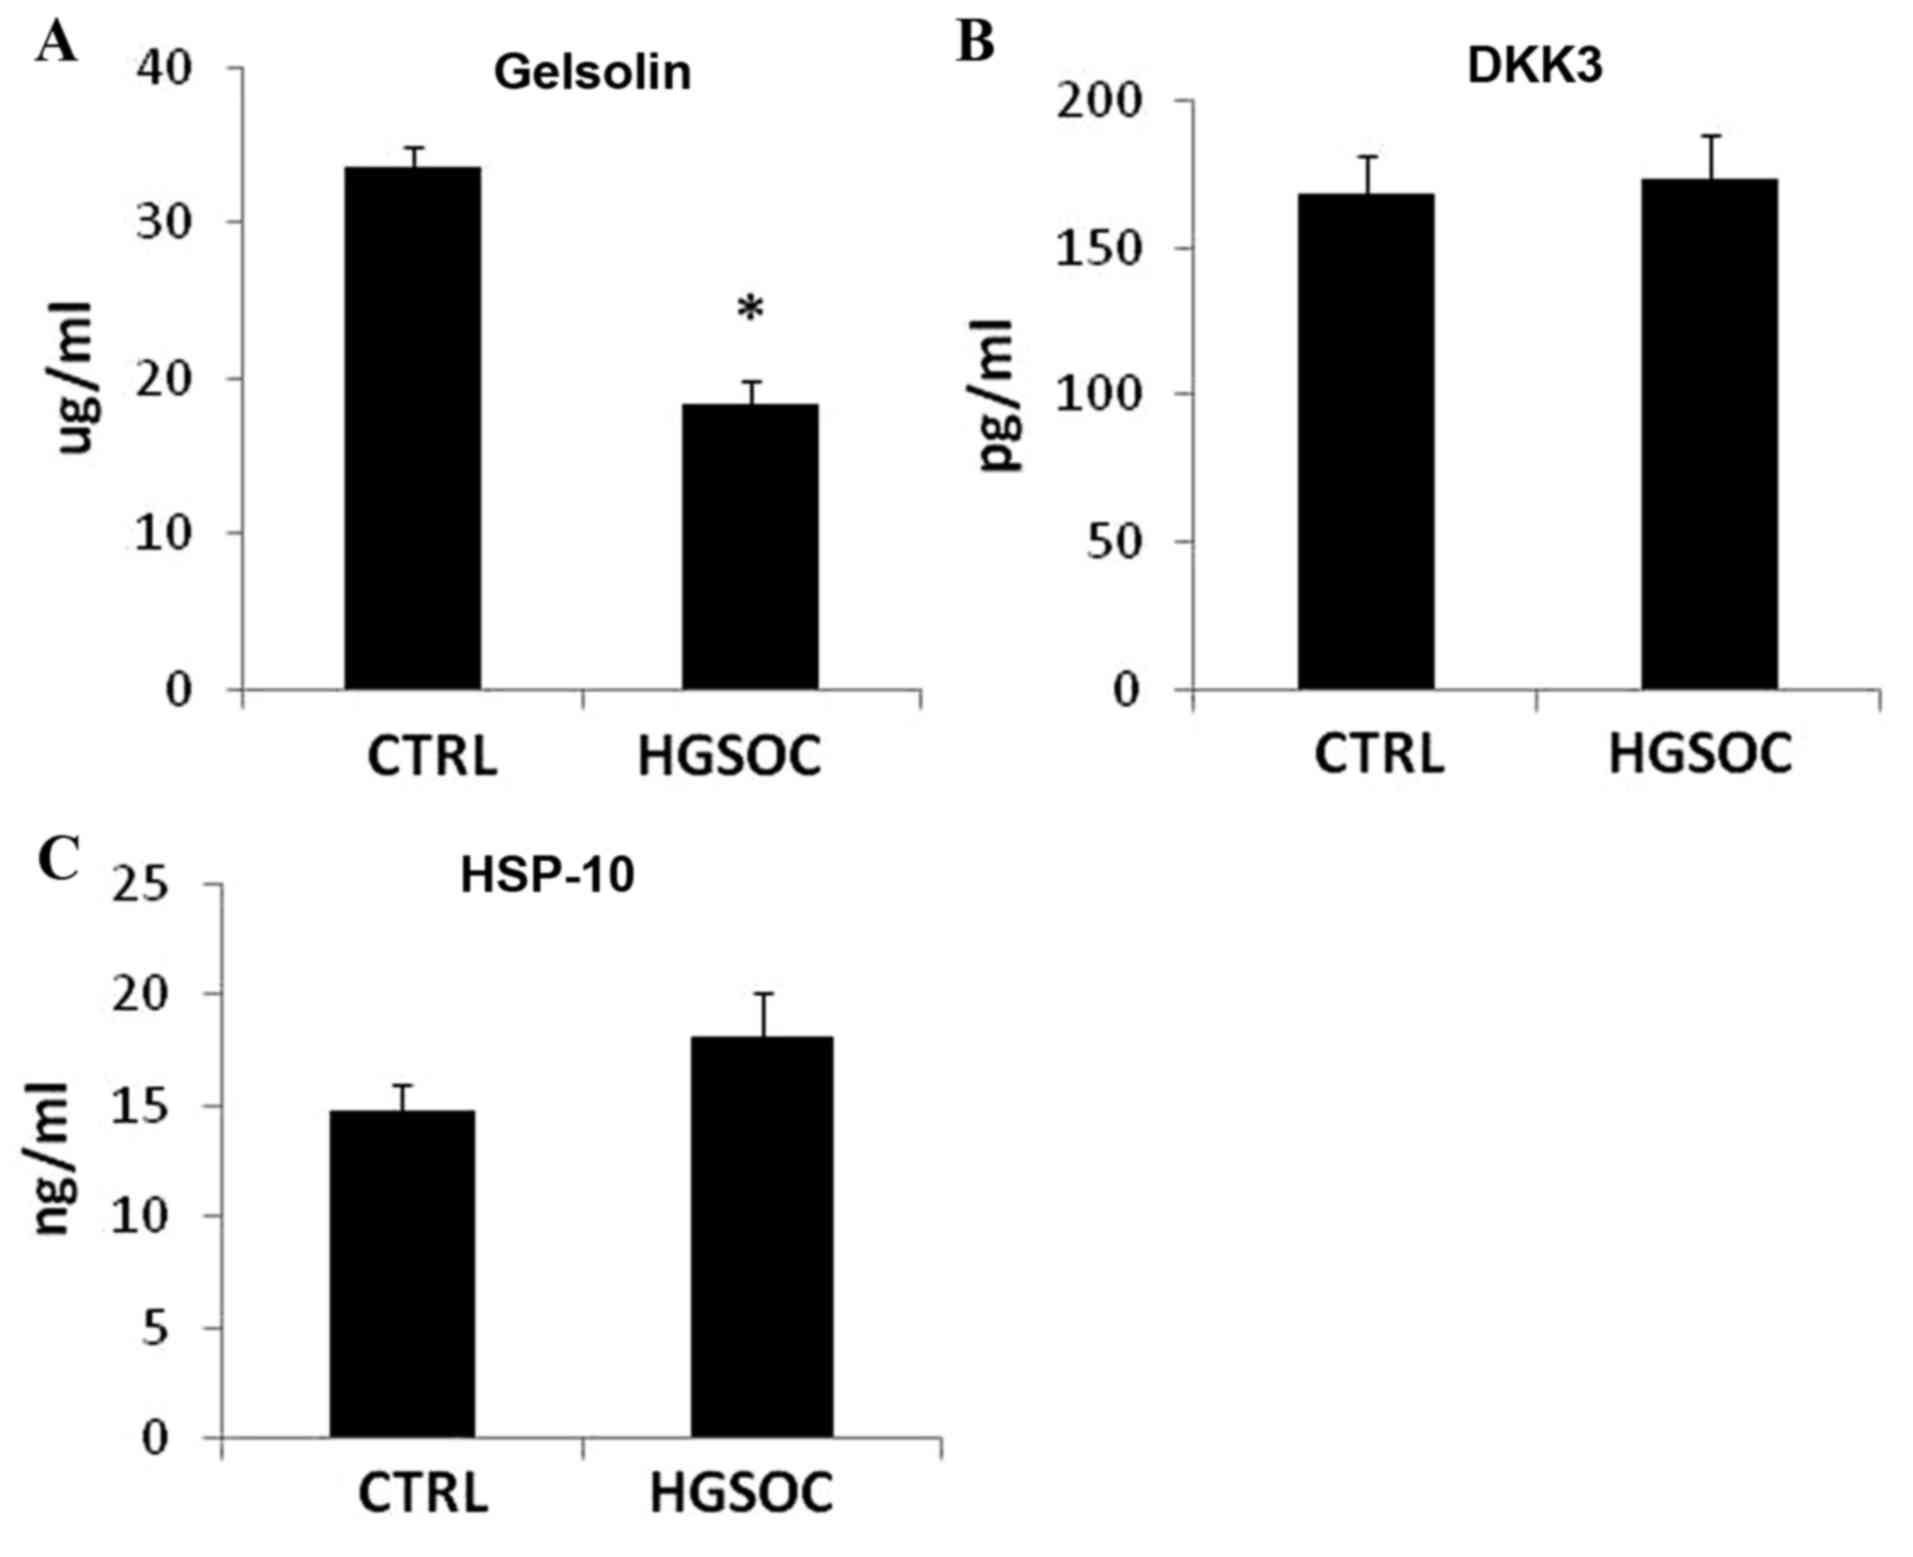
Analysis of the selected secreted
proteins in the sera of patients with HGSOC and the CTRL
cohort
The expression levels of gelsolin, DKK3 and HSP-10
were evaluated in the serum of the CTRL group and patients with
HGSOC. As demonstrated in Fig. 3,
circulating DKK3 does not alternate between the two groups. The
expression level of HSP-10 was observed to be higher in the serum
of the HGSOC group compared with CTRL patients; however, this
increase was not statistically significant (Fig. 3). The serum expression level of
gelsolin was significantly different in the healthy cohort vs. the
HGSOC cohort of patients (P<0.001), with decreased expression
levels observed in the patients with HGSOC (Fig. 3).
Discussion
Secreted proteins are circulating proteins
detectable in blood samples using highly sensitive techniques,
including immunological methods (ELISA) (18). Although in vitro culture
conditions may not fully reflect the in vivo conditions,
identification of ovarian proteins differentially secreted by
malignant cells may be a first step towards the elucidation of
ovarian cancer markers in blood samples. In this context, secretome
analysis of ovarian cancer cell lines has contributed to the
establishment of a list of potent biomarkers (11,15,16).
However, the pathological relevance of the cell line secretome is
debatable. Previously, Zhang et al (16) analyzed the conditioned media of cells
purified from normal ovarian tissues and tumor tissues, and
established an ovarian cancer-associated conditioned media protein
database. Certain proteins differentially secreted by ovarian
cancer cells in comparison with normal cells, may be secreted as a
general response to an acute condition and they must not be
considered as tumor specific. In order to avoid this bias, the
present study performed a proteomic analysis of secreted proteins
from normal and BOL cells, compared with serous cancer cells
purified from ovarian tissues and ascites. A total of 589 proteins
secreted in the supernatant of cultured ovarian cells were
identified as a result. Spectral counts, used as an evaluation of
abundance, coupled with comparison of proteins identified in the
supernatant of cells purified from the ovarian tissues of each
group of patients, allowed the identification of proteins
differentially secreted by cancer cells. Among these 589 proteins,
64 were significantly and differentially secreted by ovarian cancer
cells, in comparison with normal cells. Certain proteins, including
metallopeptidase inhibitor 2 (TIMP-2) and nidogen 1, had previously
been identified by analysis of secreted proteins from normal and
cancer cells, and validated in the serum of healthy volunteers and
patients with ovarian cancer (16).
However, despite nidogen 1 and TIMP-2 exhibiting higher expression
levels in the serum of ovarian cancer patients in comparison with
healthy patients, the present study's proteomic analysis on
conditioned media revealed the opposite. Furthermore, these
proteins were not identified to be differentially secreted from
HGSOC cells compared with BOL cells, suggesting that they may be
secreted as a general response to an acute condition and they
should not be considered as tumor specific.
A total of 21 proteins were revealed to be
significantly and differentially secreted by HGSOC cells compared
with BOL cells. However, only nine of the proteins identified
matched those in the list of the 64 proteins differentially
secreted by cancer cells in comparison with normal cells. The
present study evaluated the potential of these nine proteins by
analyzing the association between their mRNA expression levels and
the survival rate, using publically available datasets. The
evaluated genes were determined to have a significant clinical
value using the GSE13876 database. However, analysis of certain
genes revealed contrary results depending on the database used,
thus limiting the use of these databases for the evaluation of gene
clinical potential. In particular, the mRNA expression level may
not be associated with the protein expression level and/or
secretion.
Among the nine significantly secreted proteins
identified between CTRL/BOL and HGSOC cells, four were revealed to
have an increased rate of secretion from HGSOC cells compared with
BOL and CTRL cells, including, HSP-10, IGFBP-2, macrophage CSF-1
and malate dehydrogenase. These proteins have previously been
studied in ovarian cancer cells (19–23).
CSF-1 may serve an important role in ovarian carcinogenesis,
as it has the capacity to increase the invasive ability of ovarian
cancer cells (24) and to promote
metastasis (25). Furthermore, high
expression levels of CSF-1 are associated with poor patient
outcome, suggesting that this protein may be a potential biomarker
and prognostic factor (20,21). IGFBP-2 also serves a significant role
in EOC pathogenesis and may represent an additional serum biomarker
with utility in the detection and monitoring of EOC (23,26).
HSP-10 is known to serve a role in the mechanism underlying
mitochondrial protein-folding. HSP-10 is also present in additional
subcellular compartments, following stress induction, and may be
identified in the extracellular space and in the bloodstream, where
it may be a critical factor in the suppression of T cell activation
(27). HSP-10 was present in the
serum of patients with ovarian cancer, whereas it was not detected
in the serum of healthy patients, suggesting that it may be
secreted by ovarian cancer cells (19). In the present study, it was
demonstrated that the HSP-10 mRNA expression level was
significantly lower in healthy ovarian cells, compared with in
malignant cells. HSP-10 was also revealed to have a higher
expression level in the serum of patients with malignant cancer,
compared with in the sera of healthy patients, but this was not
significant.
Subsequently, the present study investigated two
additional proteins, gelsolin and DKK3, as potential markers of
ovarian cancer as they exhibited a significantly lower level of
secretion from ovarian cancer cells, compared with the normal and
BOL cells. The Dickkopf family consists of four main secreted
proteins, which are known to be antagonists of the Wnt signaling
pathway (28). However, the
functional role of DKK3 in the Wnt/β-catenin signaling pathway
remains unknown (28). DKK3 was
previously described as a pro-angiogenic factor implicated in
neovascularization during tumor development (28). There are currently few studies on the
expression of DKK3 in ovarian cancer (29). A previous study by Jiang et al
(30) suggested that this protein may
be used as biomarker of ovarian cancer. Although the present study
demonstrated that DKK3 is under-expressed and under-secreted by
HGSOC cells compared with CTRL cells, this marker was not validated
in the serum of patients.
Gelsolin is a calcium-activated actin-linked
protein, present in the cytoplasm or secreted by cells (31). The secreted form of gelsolin differs
from the intracellular structure by a 25-amino acid signaling
peptide and the presence of a disulfide bond between cysteine
residues at positions 188 and 201 (31). In mutant mice, this protein is
associated with a number of pathologies, including inflammation and
cancer (32). Gelsolin is involved in
cell motility, phagocytosis, apoptosis, platelet formation and
activation (31). Loss of gelsolin
expression in human ovarian carcinoma was previously demonstrated
by Noske et al (33), and it
was suggested that it may be associated with tumor grade. This
decreased expression level may be mediated by epigenetic
modification (33). Despite the
relatively small number of tissues and ascites samples investigated
in the present study, decreased mRNA expression levels of
gelsolin were revealed in HGSOC cells compared with CTRL
cells, and a decrease in the level of gelsolin secreted from HGSOC
cells, compared with CTRL and BOL cells, in vitro was also
demonstrated. It was also revealed that the transfection of
gelsolin into HGSOC cells induced a reduction in colony
formation, suggesting it may have growth suppressive activity in
HGSOC cells. Thus, reconstitution of gelsolin expression levels in
HGSOC cells may be a promising therapeutic intervention for ovarian
cancer (33). Furthermore, gelsolin
expression levels were demonstrated to be significantly reduced in
the serum of patients with ovarian cancer, compared with healthy
patients, suggesting that gelsolin may be a useful biomarker of
ovarian cancer.
In conclusion, the proteomic approach remains a
useful tool for the investigation of potential biomarkers by
comparison of protein expression patterns between the CTRL and
HGSOC samples. Despite the relatively small number of tissue and
ascites specimens studied, the majority of proteins identified in
the present study as being significantly differentially secreted
from malignant and CTRL cell samples had been detected in previous
studies (8–16), confirming their potent and important
role. To the best of our knowledge, proteins including HSP-10 and
DKK3, had not previously been identified by a proteomic approach,
but had been suggested as potent markers using alternate approaches
(19,30); however the present study was unable to
confirm their utility as biomarkers of serous ovarian cancer by the
immunological method. Conversely, gelsolin may be a successful
potential biomarker of serous ovarian cancer or a therapeutic
target.
Acknowledgements
The present study was supported by the Swiss
National Science Foundation (grant no. 31003A-127392). The authors
thank Mrs. Ginette Rosseel for enrolling patients and collecting
ascites, and Mrs. Patrizia Arboit and Mrs. Aurore Britan for the
technical assistance provided.
References
|
1
|
Torre LA, Bray F, Siegel RL, Ferlay J,
Lortet-tieulent J and Jemal A: Global Cancer statistics, 2012. Ca
Cancer J Clin. 65:87–108. 2015. View Article : Google Scholar : PubMed/NCBI
|
|
2
|
Latifi A, Luwor RB, Bilandzic M,
Nazaretian S, Stenvers K, Pyman J, Zhu H, Thompson EW, Quinn MA,
Findlay JK and Ahmed N: Isolation and characterization of tumor
cells from the ascites of ovarian cancer patients: Molecular
phenotype of chemoresistant ovarian tumors. PLoS One. 7:e468582012.
View Article : Google Scholar : PubMed/NCBI
|
|
3
|
Su Z, Graybill WS and Zhu Y: Detection and
monitoring of ovarian cancer. Clin Chim Acta. 415:341–345. 2013.
View Article : Google Scholar : PubMed/NCBI
|
|
4
|
Têtu B, Popa I, Bairati I, L'Esperance S,
Bachvarova M, Plante M, Harel F and Bachvarov D:
Immunohistochemical analysis of possible chemoresistance markers
identified by micro-arrays on serous ovarian carcinomas. Mod
Pathol. 21:1002–1010. 2008. View Article : Google Scholar : PubMed/NCBI
|
|
5
|
Li J, Dowdy S, Tipton T, Podratz K, Lu WG,
Xie X and Jiang SW: HE4 as a biomarker for ovarian and endometrial
cancer management. Expert Rev Mol Diagn. 9:555–566. 2009.
View Article : Google Scholar : PubMed/NCBI
|
|
6
|
Rein BJ, Gupta S, Dada R, Safi J, Michener
C and Agarwal A: Potential markers for detection and monitoring of
ovarian cancer. J Oncol. 2011:4759832011. View Article : Google Scholar : PubMed/NCBI
|
|
7
|
Nguyen L, Cardenas-Goicoechea SJ, Gordon
P, Curtin C, Momeni M, Chuang L and Fishman D: Biomarkers for early
detection of ovarian cancer. Womens Health (Lond). 9:171–187. 2013.
View Article : Google Scholar : PubMed/NCBI
|
|
8
|
Toss A, de Matteis E, Rossi E, Casa LD,
Iannone A, Federico M and Cortesi L: Ovarian cancer: Can proteomics
give new insights for therapy and diagnosis? Int J Mol Sci.
14:8271–8290. 2013. View Article : Google Scholar : PubMed/NCBI
|
|
9
|
An HJ, Kim DS, Park YK, Kim SK, Choi YP,
Kang S, Ding B and Cho NH: Comparative proteomics of ovarian
epithelial tumors. J Proteome Res. 5:1082–1090. 2006. View Article : Google Scholar : PubMed/NCBI
|
|
10
|
Cortesi L, Rossi E, Casa L Della,
Barchetti A, Nicoli A, Piana S, Abrate M, La Sala GB, Federico M
and Iannone A: Protein expression patterns associated with advanced
stage ovarian cancer. Electrophoresis. 32:1992–2003. 2011.
View Article : Google Scholar : PubMed/NCBI
|
|
11
|
Faça VM, Ventura AP, Fitzgibbon MP,
Pereira-Faça SR, Pitteri SJ, Green AE, Ireton RC, Zhang Q, Wang H,
O'Briant KC, et al: Proteomic analysis of ovarian cancer cells
reveals dynamic processes of protein secretion and shedding of
extra-cellular domains. PLoS One. 3:e24252008. View Article : Google Scholar : PubMed/NCBI
|
|
12
|
Jackson D, Craven RA, Hutson RC, Graze I,
Lueth P, Tonge RP, Hartley JL, Nickson JA, Rayner SJ, Johnston C,
et al: Proteomic profiling identifies afamin as a potential
biomarker for ovarian cancer. Clin Cancer Res. 13:7370–7379. 2007.
View Article : Google Scholar : PubMed/NCBI
|
|
13
|
Li XQ, Zhang SL, Cai Z, Zhou Y, Ye TM and
Chiu JF: Proteomic identification of tumor-associated protein in
ovarian serous cystadenocarinoma. Cancer Lett. 275:109–116. 2009.
View Article : Google Scholar : PubMed/NCBI
|
|
14
|
Petri AL, Simonsen AH, Yip TT, Hogdall E,
Fung ET, Lundvall L and Hogdall C: Three new potential ovarian
cancer biomarkers detected in human urine with equalizer bead
technology. Acta Obstet Gynecol Scand. 88:18–26. 2009. View Article : Google Scholar : PubMed/NCBI
|
|
15
|
Gunawardana CG, Kuk C, Smith CR, Batruch
I, Soosaipillai A and Diamandis EP: Comprehensive analysis of
conditioned media from ovarian cancer cell lines identifies novel
candidate markers of epithelial ovarian cancer. J Proteome Res.
8:4705–4713. 2009. View Article : Google Scholar : PubMed/NCBI
|
|
16
|
Zhang Y, Xu B, Liu Y, Yao H, Lu N, Li B,
Gao J, Guo S, Han N, Qi J, et al: The ovarian cancer-derived
secretory/releasing proteome: A repertoire of tumor markers.
Proteomics. 12:1883–1891. 2012. View Article : Google Scholar : PubMed/NCBI
|
|
17
|
Gluck F, Hoogland C, Antinori P, Robin X,
Nikitin F, Zufferey A, Pasquarello C, Fétaud V, Dayon L, Muller M,
et al: EasyProt-an easy-to-use graphical platform for proteomics
data analysis. J Proteomics. 79:146–160. 2013. View Article : Google Scholar : PubMed/NCBI
|
|
18
|
Epiney M, Ribaux P, Arboit P, Irion O and
Cohen M: Comparative analysis of secreted proteins from normal and
preeclamptic trophoblastic cells using proteomic approaches. J
Proteomics. 75:1771–1777. 2012. View Article : Google Scholar : PubMed/NCBI
|
|
19
|
Akyol S, Gercel-Taylor C, Reynolds LC and
Taylor DD: HSP-10 in ovarian cancer: Expression and suppression of
T-cell signaling. Gynecol Oncol. 101:481–486. 2006. View Article : Google Scholar : PubMed/NCBI
|
|
20
|
Chambers SK: Role of CSF-1 in progression
of epithelial ovarian cancer. Future Oncol. 5:1429–1440. 2009.
View Article : Google Scholar : PubMed/NCBI
|
|
21
|
Chambers SK, Kacinski BM, Ivins CM and
Carcangiu ML: Overexpression of epithelial macrophage
colony-stimulating factor (CSF-1) and CSF-1 receptor: A poor
prognostic factor in epithelial ovarian cancer, contrasted with a
protective effect of stromal CSF-1. Clin Cancer Res. 3:999–1007.
1997.PubMed/NCBI
|
|
22
|
Lim HY, Ho QS, Low J, Choolani M and Wong
KP: Respiratory competent mitochondria in human ovarian and
peritoneal cancer. Mitochondrion. 11:437–443. 2011. View Article : Google Scholar : PubMed/NCBI
|
|
23
|
Wang H, Rosen DG, Wang H, Fuller GN, Zhang
W and Liu J: Insulin-like growth factor-binding protein 2 and 5 are
differentially regulated in ovarian cancer of different histologic
types. Mod Pathol. 19:1149–1156. 2006. View Article : Google Scholar : PubMed/NCBI
|
|
24
|
Chambers SK, Wang Y, Gertz RE and Kacinski
BM: Macrophage colony-stimulating factor mediates invasion of
ovarian cancer cells through urokinase. Cancer Res. 55:1578–1585.
1995.PubMed/NCBI
|
|
25
|
Toy EP, Azodi M, Folk NL, Zito CM, Zeiss
CJ and Chambers SK: Enhanced ovarian cancer tumorigenesis and
metastasis by the macrophage colony-stimulating factor. Neoplasia.
11:136–144. 2009. View Article : Google Scholar : PubMed/NCBI
|
|
26
|
Lancaster JM, Sayer RA, Blanchette C,
Calingaert B, Konidari I, Gray J, Schildkraut J, Schomberg DW,
Marks JR and Berchuck A: High expression of insulin-like growth
factor binding protein-2 messenger RNA in epithelial ovarian
cancers produces elevated preoperative serum levels. Int J Gynecol
Cancer. 16:1529–1535. 2006. View Article : Google Scholar : PubMed/NCBI
|
|
27
|
David S, Bucchieri F, Corrao S, Czarnecka
AM, Campanella C, Farina F, Peri G, Tomasello G, Sciumè C, Modica
G, et al: Hsp10: Anatomic distribution, functions, and involvement
in human disease. Front Biosci. 5:768–778. 2013. View Article : Google Scholar
|
|
28
|
Niehrs C: Function and biological roles of
the Dickkopf family of Wnt modulators. Oncogene. 25:7469–7481.
2006. View Article : Google Scholar : PubMed/NCBI
|
|
29
|
Veeck J and Dahl E: Targeting the Wnt
pathway in cancer: The emerging role of Dickkopf-3. Biochim Biophys
Acta. 1825:18–28. 2012.PubMed/NCBI
|
|
30
|
Jiang T, Huang L, Wang S and Zhang S:
Clinical significance of serum Dkk-3 in patients with gynecological
cancer. J Obstet Gynaecol Res. 36:769–773. 2010. View Article : Google Scholar : PubMed/NCBI
|
|
31
|
Silacci P, Mazzolai L, Gauci C,
Stergiopulos N, Yin HL and Hayoz D: Gelsolin superfamily proteins:
Key regulators of cellular functions. Cell Mol Life Sci.
61:2614–2623. 2004. View Article : Google Scholar : PubMed/NCBI
|
|
32
|
Spinardi L and Witke W: Gelsolin and
diseases. Subcell Biochem. 45:55–69. 2007. View Article : Google Scholar : PubMed/NCBI
|
|
33
|
Noske A, Denkert C, Schober H, Sers C,
Zhumabayeva B, Weichert W, Dietel M and Wiechen K: Loss of Gelsolin
expression in human ovarian carcinomas. Eur J Cancer. 41:461–469.
2005. View Article : Google Scholar : PubMed/NCBI
|