Introduction
At present, hepatocellular carcinoma (HCC) is the
second most common cause of cancer-related death in China, and the
incidence of HCC in recent several years has shown an increasing
trend (1,2). The mortality rate of HCC is high.
Hepatitis, cirrhosis and liver cancer belong to the trilogy of
liver disease, and most patients with HCC often have varying
degrees of cirrhosis (3,4).
The key factor for the high mortality rate of HCC is
the immature early diagnosis of HCC. HCC in early stages usually
shows no specific symptoms, and most patients are diagnosed at
advanced stages, leading to the high mortality rate (5,6).
Therefore, early diagnosis and treatment remain crucial in the
treatment of HCC. Previous findings showed that hepatitis,
cirrhosis and HCC are accompanied with different changes in liver
volume (7). In addition, the
occurrence of HCC is directly related to the inactivation of tumor
suppressor genes and abnormal cell proliferation (8). p53 is a major tumor suppressor gene
associated with most malignancies, including HCC (9,10).
In the present study, the volume of whole liver,
left lateral lobe and caudate lobe was measured by 16-slice spiral
CT and the correlations between those features and liver function
were examined. Expression of p53 in liver tissue of patients with
hepatitis, cirrhosis and HCC was detected. The specificity and
sensitivity of diagnosis of liver cancer were improved by combining
the two different indexes.
Materials and methods
Inclusion and exclusion criteria
Patients with HCC, cirrhosis and chronic hepatitis
at the Zhengzhou Central Hospital Affiliated to Zhengzhou
University (Henan, China) were selected between December, 2015 and
December, 2016. The patients were diagnosed by pathological
examinations according to the diagnostic criteria established by
WHO. This study was approved by the Ethics Committee of Zhengzhou
Central Hospital Affiliated to Zhengzhou University (Henan, China),
and all patients signed written informed consent.
Inclusion criteria for the study were: patients
received surgical treatment; patients received no radiotherapy or
chemotherapy before surgery; patients with primary HCC; patients
with complete clinical record. Exclusion criteria for the study
were: patients without accurate pathological diagnosis; patients
treated with radiotherapy or chemotherapy before surgery; patients
with metastatic liver cancer; patients with contraindications for
surgery.
Clinical data
Clinical data of those patients were collected.
These patients were selected using the Hospital Information System
(HIS), diagnosed by Pathematology and conformed to the standard.
There were 40 patients with HCC, 30 patients with cirrhosis and 30
patients with chronic hepatitis. At the same time, normal liver
tissues collected from 30 patients with hepatic hemangioma were
used as the normal control group. All normal liver tissues were
observed under a microscope (Olympus Corporation, Tokyo, Japan),
and no inflammatory cell infiltration, fibrosis and regeneration
nodules and hemangioma lesions were observed.
Methods
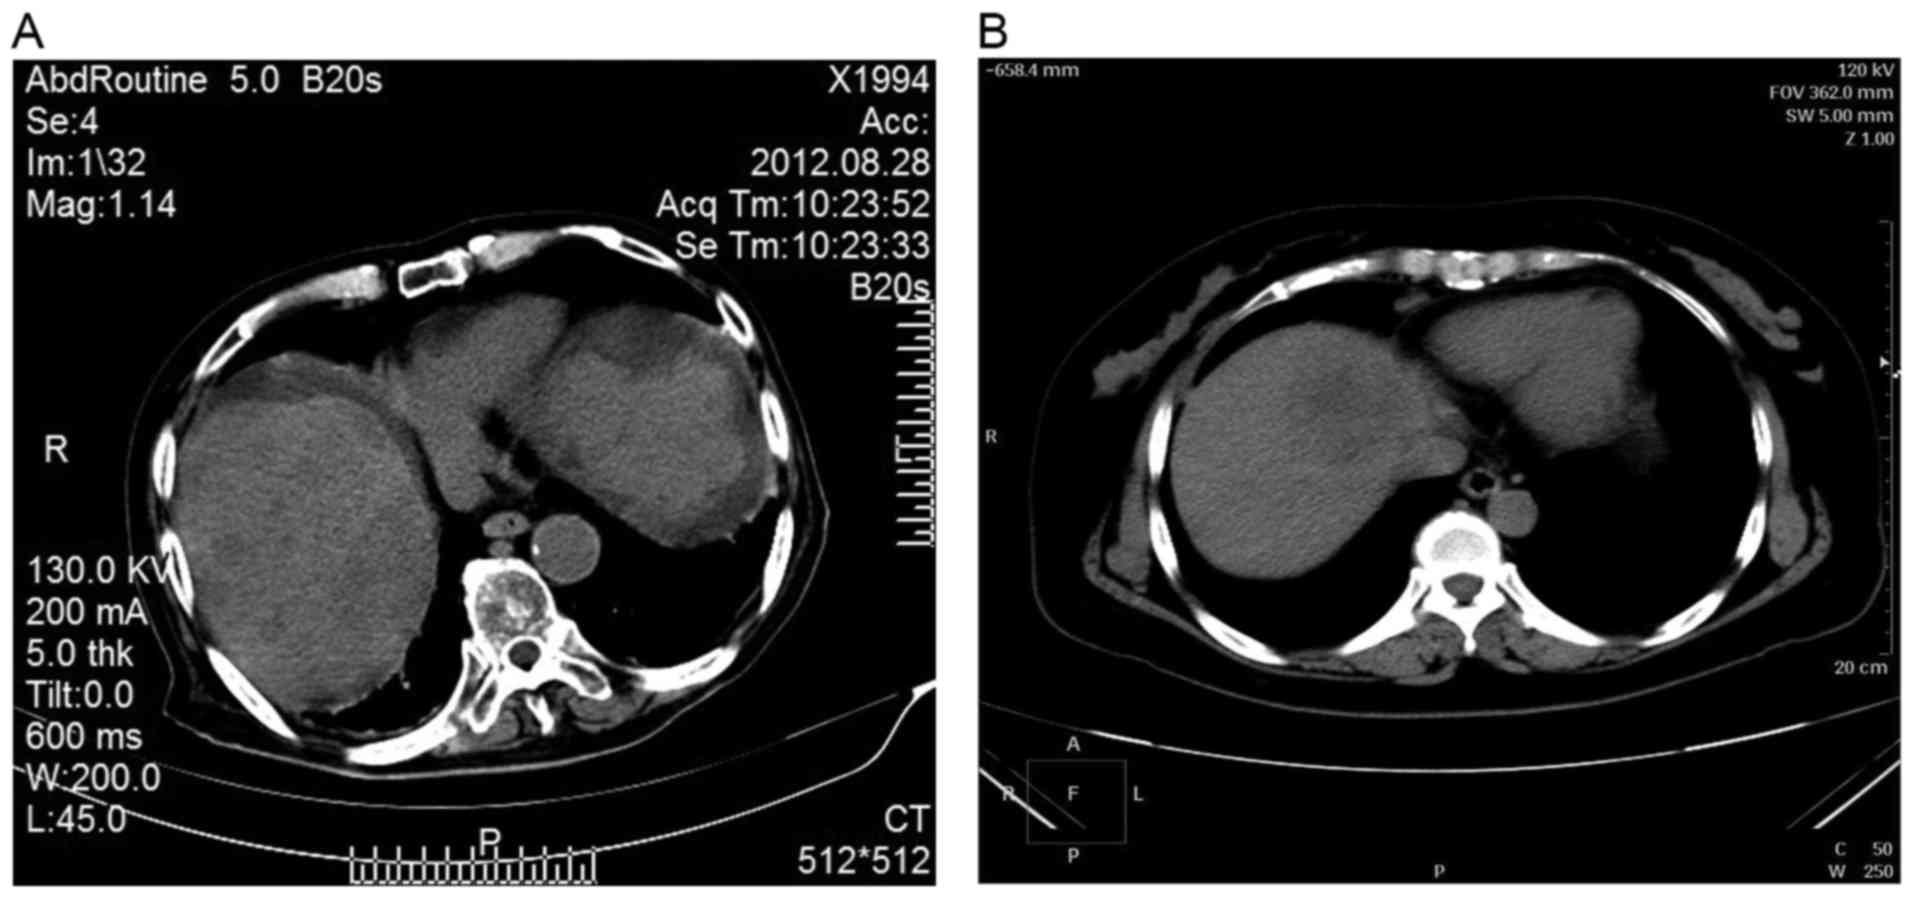
Measurement of liver volume
Siemens Sensation 16 spiral CT scanner was used for
conventional double-phase scanning. The area from the top of the
diaphragm to the lower edge of liver and spleen was scanned within
a breath-hold. During scanning, bolus injection of 80–100 ml
non-ionic contrast agent elixir was performed at a speed of 2.5–3.0
ml/sec. Spiral collimation was 1.5 mm, moving speed was 12 mm/sec,
scanning layer thickness was 7.00 mm and reconstruction interval
was 5.00 mm. After scanning, the original data were subjected to 5
mm portal venous phase reconstruction, and were imported into
Volume software. Edge of the liver lobes was identified from top of
the septum to the lower edge of the liver and gallbladder and
inferior vena cava were avoided. The volume of the liver was
calculated with the threshold of 30–300 HU (Fig. 1).
Observation index
Before CT examination, the patient's height and
weight were recorded to calculate body surface area. In order to
avoid individual differences, volume of the whole liver, left outer
lobe and caudate lobe per unit body surface was calculated.
Liver function test
Biochemical indexes of liver function were tested
using TBA-120FR automatic biochemical analyzer (Toshiba, Tokyo,
Japan).
Immunohistochemical detection of p53
expression
Tissues were fixed in 10% neutral formalin, followed
by paraffin-embedding and slicing. Tissue sections were transferred
to glass slides and baked at 70°C overnight. The slides were
deparaffinized 3 times using xylene, and passed a graded
concentrations ethanol for hydration. Citric acid buffer was used
for antigen retrieval. After washing 3 times with
phosphate-buffered saline (PBS), sections were incubated with 3%
H2O2 for 15 min at room temperature. The
sections were incubated with primary rabbit anti-human P53
monoclonal antibody (1:700; cat. no. 2527; Cell Signaling
Technology, Inc., Danvers, MA, USA) overnight at 4°C in a wet box.
After washing 3 times with PBS, sections were incubated with
secondary goat anti-rabbit monoclonal antibody (1:1,000; cat. no.
8114; Cell Signaling Technology, Inc.) for 30 min at room
temperature. After washing 3 times with PBS, DAB color development
was performed in a wet box, and color development was stopped by
rinsing with tap water. The sections were soaked in hematoxylin for
1–3 min, and after washing, the sections were soaked in
hydrochloric acid alcohol for 10–20 sec. The sections were rinsed,
dehydrated, vitrificated and sealed with neutral resin.
Statistical analysis
SPSS 20.0 statistical software (IBM, Armonk, NY,
USA) was used for the statistical analysis. Measurement data were
expressed as mean ± standard deviation (SD), and subjected to
one-way ANOVA with LSD as the post hoc test. Intragroup comparisons
were performed using t-test. Countable data were expressed as a
percentage (%), and comparisons were performed using a
χ2 test. P<0.05 was considered to indicate a
statistically significant difference.
Results
Changes in liver volume and
correlations with liver disease
Calculated body surface area of each group was
substituted into the formula for the calculation of standard liver
volume. No significant differences in calculated liver volume were
found between patient groups and control group (P>0.05).
However, liver volume and volume index measured by CT in HCC groups
were significantly lower than those in other group. Liver volume
change rate in HCC group was 33.79 ± 5.04%, which was significantly
higher than that in other three groups (P<0.05) (Table I).
 | Table I.Changes in liver volume and
correlations with liver disease. |
Table I.
Changes in liver volume and
correlations with liver disease.
| Groups | Cases | Formula volume
(cm3) | CT volume
(cm3) | Volume index | Volume change rate
(%) |
|---|
| Hepatitis group | 30 | 1196.27±131.35 | 1109.35±136.42 | 0.93±0.27 | 8.03±3.31 |
| Cirrhosis group | 30 | 1217.54±105.46 | 1043.92±94.57 | 0.86±0.28 |
14.34±4.52a |
| HCC group | 40 | 1213.08±119.48 |
798.29±92.69a |
0.65±0.15a |
33.79±5.04a |
| Control group | 30 | 1109.99±122.26 | 1089.65±100.69 | 0.95±0.19 | 8.25±2.25 |
| t-test | – | 2.139 | 6.096 | 6.982 | 8.296 |
| P-value | – | 0.341 | 0.002 | 0.005 | 0.000 |
Comparison of liver lobe between
patient groups and control group
No significant differences in total liver volume and
unit surface area were found between the hepatitis, cirrhosis and
control groups (P>0.05), but significantly reduced values were
found in the HCC group (P<0.05). Left outer lobe volume and unit
surface area volume in the hepatitis, HCC and cirrhosis groups were
significantly larger than those in the control group (P<0.05).
Caudate lobe volume and unit surface area volume in the hepatitis
group were significantly larger than those in the remaining groups,
and no significant differences were found among the cirrhosis, HCC
and control groups (P>0.05). No significant differences in the
proportions of left outer lobe and caudate lobe to the whole liver
were found among the groups (P>0.05) (Tables II and III).
| Table II.Liver volume of each group. |
Table II.
Liver volume of each group.
| Groups | Cases | Total liver volume
(cm3) | Total liver
volume/body surface volume (cm3) | Left outer lobe
volume | Left outer lobe
volume/body surface volume (cm3) | Caudate lobe volume
(cm3) | Caudate lobe
volume/body surface volume (cm3) |
|---|
| Hepatitis group | 30 | 1109.88±336.68 | 647.52±182.82 |
315.39±105.78a |
185.32±62.37a |
36.26±22.48a |
21.65±13.11a |
| Cirrhosis group | 30 | 1041.27±324.13 | 601.24±173.29 |
281.65±90.27a |
165.28±54.32a | 29.47±19.53 | 16.13±10.57 |
| HCC group | 40 |
796.24±201.52a |
461.93±152.37a | 208.59±80.10 | 121.75±49.58 | 21.25±14.66 | 12.75±5.98 |
| Control group | 30 | 1225.84±216.87 | 709.82±199.85 | 201.52±59.17 | 117.52±34.18 | 27.96±15.32 | 15.98±6.99 |
| t-test | – | 5.223 | 5.853 | 6.580 | 8.015 | 5.697 | 6.853 |
| P-value | – | 0.025 | 0.009 | 0.002 | 0.000 | 0.023 | 0.011 |
| Table III.Proportions of left outer lobe and
caudate lobe to the whole liver. |
Table III.
Proportions of left outer lobe and
caudate lobe to the whole liver.
| Groups | Cases | Left outer lobe/whole
liver (%) | Caudate lobe/whole
liver (%) |
|---|
| Hepatitis group | 30 |
29.72±9.29a |
3.37±1.45a |
| Cirrhosis group | 30 |
27.46±10.63a | 2.90±1.45 |
| HCC group | 40 |
27.07±8.04a | 2.89±1.42 |
| Control group | 30 | 16.63±4.45 | 2.25±0.73 |
| t-test | – | 1.236 | 1.117 |
| P-value | – | 0.159 | 0.206 |
Liver function-related indicators in
each group
Liver function-related indicators in the HCC and
cirrhosis groups were significantly different from those in the
control group (P<0.05). The results showed that the liver
function of hepatitis patients was normal. However, with the
aggravation of liver damage, liver dysfunction became more and more
obvious (Table IV).
| Table IV.Liver function-related indicators in
each group. |
Table IV.
Liver function-related indicators in
each group.
| Groups | Cases | ALB (g/l) | TP (g/l) | ALB/GLB | Pche (V/l) | TBIL (µmol/l) | TBA (µmol/l) |
|---|
| Hepatitis
group | 30 | 38.54±0.51 | 68.57±0.77 | 1.34±0.06 | 5215.15±230.42 | 2.72±0.09 | 2.49±0.11 |
| Cirrhosis
group | 30 |
30.93±0.47a | 63.32±0.71 |
0.93±0.05a |
2834.69±211.27a |
3.53±0.19a |
2.93±0.22a |
| HCC group | 40 |
23.59±0.41a |
57.91±0.62a |
0.65±0.02a |
2355.57±199.11a |
4.09±0.13a |
3.61±0.24a |
| Control group | 30 | 40.49±0.59 | 71.50±0.81 | 1.49±0.08 | 5347.42±251.22 | 2.91±0.11 | 2.41±0.99 |
p53 expression in each group
Positive rate of p53 expression was 45.00% (18/22)
in the HCC group and 3.33% (1/29) in the cirrhosis group. The
positive rate of p53 expression in cirrhosis and hepatitis was not
significantly different from that in control group (P>0.05), but
there were significant differences between HCC group and control
group (P<0.05) (Table V).
| Table V.p53 expression in each group. |
Table V.
p53 expression in each group.
|
| p53 |
|---|
|
|
|
|---|
| Groups | Cases | Positive n (%) | Negative n (%) |
|---|
| Hepatitis
group | 30 | 0 (0.00) | 30
(100.00)a |
| Cirrhosis
group | 30 | 1 (3.33) | 29 (96.67) |
| HCC group | 40 | 18 (45.00) | 22 (55.00) |
| Control group | 30 | 0 (0.00) | 30 (100.00) |
Correlations between hepatitis,
cirrhosis and HCC CT features and liver function index ALB
Hepatitis, cirrhosis and HCC CT features showed a
high degree of consistency with the expression level of liver
function indicator ALB, and they were positively correlated
(Table VI).
| Table VI.Correlations between hepatitis,
cirrhosis and HCC CT features and liver function index ALB. |
Table VI.
Correlations between hepatitis,
cirrhosis and HCC CT features and liver function index ALB.
| Groups | Correlation
values |
|---|
| Hepatitis
group | r=0.96,
P<0.05 |
| Cirrhosis
group | r=0.91,
P<0.05 |
| HCC group | r=0.94,
P<0.05 |
| Control group | r=0.92,
P<0.05 |
Correlations between hepatitis,
cirrhosis and HCC CT features and p53 expression
Hepatitis, cirrhosis and HCC CT features showed a
high degree of consistency with the expression level of p53, and
they were negatively correlated (Table
VII).
| Table VII.Correlations between hepatitis,
cirrhosis and HCC CT features and p53 expression. |
Table VII.
Correlations between hepatitis,
cirrhosis and HCC CT features and p53 expression.
| Groups | Correlation
values |
|---|
| Hepatitis
group | r=−0.94,
P<0.05 |
| Cirrhosis
group | r=−0.96,
P<0.05 |
| HCC group | r=−0.91,
P<0.05 |
| Control group | r=−0.93,
P<0.05 |
Diagnostic accuracies of liver
diseases by using CT
Sensitivity, specificity, positive predictive rate
and negative predictive rate of CT were 50.80, 98.90, 98.30 and
62.30%, respectively, while the values of p53 were 78.30, 77.80,
81.10 and 74.50%, respectively. Sensitivity, specificity, positive
predictive rate and negative predictive rate of CT combined with
p53 was 33.60, 98.90, 97.40 and 54.92%, respectively. The data
suggest that the accuracy of diagnosis of liver disease by both
using p53 and CT was higher than the use of p53 or CT alone
(Table VIII).
| Table VIII.The diagnostic accuracy of CT and p53
on HCC/%. |
Table VIII.
The diagnostic accuracy of CT and p53
on HCC/%.
| Items | Sensitivity | Specificity | Positive predictive
rate | Negative predictive
rate | LR+ | LR− |
|---|
| Single method |
| CT | 50.80 | 98.90 | 98.30 | 62.30 | 46.40 | 0.50 |
| p53 | 78.30 | 77.80 | 81.10 | 74.50 | 3.53 | 0.28 |
| Combined
method |
| Positive in at
least one method | 95.50 | 85.50 | 89.00 | 93.80 | 6.50 | 0.05 |
| Positive in both
methods | 33.60 | 98.90 | 97.40 | 54.92 | 30.25 | 0.66 |
Discussion
In China, 110,000 patients succumb to HCC, making
this disease the leading cause of death in patients with chronic
liver disease, especially those with cirrhosis (11,12). The
inhibition of hepatitis or cirrhosis remains a major issue for the
clinical treatment of HCC that needs to be resolved (13). Early diagnosis is the most effective
way to improve prognosis and increase the survival rate of patients
with HCC (14,15). HCC is directly related to cirrhosis;
thus, it is crucial to detect chronic liver disease (16).
Liver volume can directly reflect the number of
hepatocytes, which can be used to assess the conditions of liver
diseasess. Liver volume now has been widely used in the diagnosis
and treatment of acute and chronic liver diseases (17,18). In
this study, in the stage of hepatitis and cirrhosis, the volume of
whole liver was not significantly reduced compared with that in the
control group, but significantly decreased in the HCC group. In
addition, the proportion of left outer lobe to whole liver was
increased in each patient group compared with that in control
group, and no significant differences were found among the patient
groups. The data suggest that enlargement of left outer lobe can be
observed in both hepatitis and cirrhosis; thus, the proportion of
left outer lobe to whole liver was absolutely increased. The whole
liver volume was decreased in HCC group, thus, the proportion of
left outer lobe to whole liver was relatively increased. Whole
liver volume was not decreased in the stages of hepatitis or
cirrhosis, but left outer lobe volume was increased to maintain
normal compensatory function. With the development of disease,
whole liver volume was decreased and compensatory function was not
needed. Thus, left outer lobe volume was not be further
increased.
p53 protein dysfunction and the development of human
tumors are closely correlated with each other. The occurrence and
development of HCC are directly related to the abnormal expression
of p53 (19,20). In this study, it was found that p53
expression level in the control group and chronic liver disease
groups was relatively low, but the expression level was
significantly increased in the HCC group, indicating that p53 may
serve as a diagnostic marker for HCC. p53 was combined with CT to
increase diagnostic accuracy. It was found that a parallel
combination of p53 and HSP70 increased specificity and reduced
sensitivity, while serial combination played an opposite role.
Therefore, the reasonable combination of p53 and CT can be used to
diagnose HCC, which is more reliable and accurate than the use of
p53 or CT alone.
Therefore, the rational use of p53 and HSP70 in
series or in parallel can increase both sensitivity and
specificity, which is conducive to the early diagnosis of HCC.
Acknowledgements
Not applicable.
Funding
No funding was received.
Availability of data and materials
The datasets used and/or analyzed during the current
study are available from the corresponding author on reasonable
request.
Authors' contributions
YH recorded and analyzed the clinical data of
patients. JW was involved in data acquisition. SL was responsible
for indicator index. YH and XZ analyzed liver function. All authors
read and approved the final manuscript.
Ethics approval and consent to
participate
This study was approved by the Ethics Committee of
Zhengzhou Central Hospital Affiliated to Zhengzhou University
(Henan, China), and all patients signed written informed
consent.
Patient consent for publication
Not applicable.
Competing interests
The authors declare that they have no competing
interests.
References
|
1
|
Li H, Wang S, Wang G, Zhang Z, Wu X, Zhang
T, Fu B and Chen G: Yes-associated protein expression is a
predictive marker for recurrence of hepatocellular carcinoma after
liver transplantation. Dig Surg. 31:468–478. 2014. View Article : Google Scholar : PubMed/NCBI
|
|
2
|
Ji X, Zhang Q, Du Y, Liu W, Li Z, Hou X
and Cao G: Somatic mutations, viral integration and epigenetic
modification in the evolution of hepatitis B virus-induced
hepatocellular carcinoma. Curr Genomics. 15:469–480. 2014.
View Article : Google Scholar : PubMed/NCBI
|
|
3
|
Bahnassy AA, Zekri ARN, El-Bastawisy A,
Fawzy A, Shetta M, Hussein N, Omran D, Ahmed AAS and El-Labbody SS:
Circulating tumor and cancer stem cells in hepatitis C
virus-associated liver disease. World J Gastroenterol.
20:18240–18248. 2014. View Article : Google Scholar : PubMed/NCBI
|
|
4
|
Chen X, Jiang W, Yue C, Zhang W, Tong C,
Dai D, Cheng B, Huang C and Lu L: Heparanase contributes to
trans-endothelial migration of hepatocellular carcinoma cells. J
Cancer. 8:3309–3317. 2017. View Article : Google Scholar : PubMed/NCBI
|
|
5
|
Gehrmann M, Cervello M, Montalto G,
Cappello F, Gulino A, Knape C, Specht HM and Multhoff G: Heat shock
protein 70 serum levels differ significantly in patients with
chronic hepatitis, liver cirrhosis, and hepatocellular carcinoma.
Front Immunol. 5:3072014. View Article : Google Scholar : PubMed/NCBI
|
|
6
|
Kang GH, Lee BS, Lee ES, Kim SH, Lee HY
and Kang DY: Prognostic significance of p53, mTOR, c-Met, IGF-1R,
and HSP70 overexpression after the resection of hepatocellular
carcinoma. Gut Liver. 8:79–87. 2014. View Article : Google Scholar : PubMed/NCBI
|
|
7
|
Tremosini S, Forner A, Boix L, Vilana R,
Bianchi L, Reig M, Rimola J, Rodríguez-Lope C, Ayuso C, Solé M, et
al: Prospective validation of an immunohistochemical panel
(glypican 3, heat shock protein 70 and glutamine synthetase) in
liver biopsies for diagnosis of very early hepatocellular
carcinoma. Gut. 61:1481–1487. 2012. View Article : Google Scholar : PubMed/NCBI
|
|
8
|
Liu K, Zhao X, Gu J, Wu J, Zhang H and Li
Y: Effects of 12C6+ heavy ion beam irradiation on the
p53 signaling pathway in HepG2 liver cancer cells. Acta Biochim
Biophys Sin (Shanghai). 49:989–998. 2017. View Article : Google Scholar : PubMed/NCBI
|
|
9
|
Liu K, Lee J, Kim JY, Wang L, Tian Y, Chan
ST, Cho C, Machida K, Chen D and Ou JJ: Mitophagy controls the
activities of tumor suppressor p53 to regulate hepatic cancer stem
cells. Mol Cell. 68(281–292): e52017.
|
|
10
|
Chai Y, Xiaoyu L and Haiyan W: Correlation
between expression levels of PTEN and p53 genes and the clinical
features of HBsAg-positive liver cancer. J BUON. 22:942–946.
2017.PubMed/NCBI
|
|
11
|
EI-Emshaty HM, Saad EA, Toson EA, Malak
Abdel CA and Gadelhak NA: Apoptosis and cell proliferation:
Correlation with BCL-2 and p53 oncoprotein expression in human
hepatocellular carcinoma. Hepatogastroenterology. 61:1393–1401.
2014.PubMed/NCBI
|
|
12
|
Meng X, Franklin DA, Dong J and Zhang Y:
MDM2-p53 pathway in hepatocellular carcinoma. Cancer Res.
74:7161–7167. 2014. View Article : Google Scholar : PubMed/NCBI
|
|
13
|
Lagana SM, Salomao M, Bao F, Moreira RK,
Lefkowitch JH and Remotti HE: Utility of an immunohistochemical
panel consisting of glypican-3, heat-shock protein-70, and
glutamine synthetase in the distinction of low-grade hepatocellular
carcinoma from hepatocellular adenoma. Appl Immunohistochem Mol
Morphol. 21:170–176. 2013.PubMed/NCBI
|
|
14
|
Fu Y, Xu X, Huang D, Cui D, Liu L, Liu J,
He Z, Liu J, Zheng S and Luo Y: Plasma heat shock protein 90alpha
as a biomarker for the diagnosis of liver cancer: An official,
large-scale, and multicenter clinical trial. EBioMedicine.
24:56–63. 2017. View Article : Google Scholar : PubMed/NCBI
|
|
15
|
Tawada A, Kanda T and Yokosuka O: Current
and future directions for treating hepatitis B virus infection.
World J Hepatol. 7:1541–1552. 2015. View Article : Google Scholar : PubMed/NCBI
|
|
16
|
Abdelfattah MR, Abaalkhail F and Al-Manea
H: Misdiagnosed or incidentally detected hepatocellular carcinoma
in explanted livers: Lessons learned. Ann Transplant. 20:366–372.
2015. View Article : Google Scholar : PubMed/NCBI
|
|
17
|
Lun-Gen L: Antiviral therapy of liver
cirrhosis related to hepatitis B virus infection. J Clin Transl
Hepatol. 2:197–201. 2014.PubMed/NCBI
|
|
18
|
Zhang D and Xu A: Application of
dual-source CT perfusion imaging and MRI for the diagnosis of
primary liver cancer. Oncol Lett. 14:5753–5758. 2017.PubMed/NCBI
|
|
19
|
Moreira AJ, Rodrigues G, Bona S, Cerski
CT, Marroni CA, Mauriz JL, González-Gallego J and Marroni NP:
Oxidative stress and cell damage in a model of precancerous lesions
and advanced hepatocellular carcinoma in rats. Toxicol Rep.
2:333–340. 2014. View Article : Google Scholar : PubMed/NCBI
|
|
20
|
Wu W, Liu S, Liang Y, Zhou Z, Bian W and
Liu X: Stress hormone cortisol enhances Bcl-2 like-12 expression to
inhibit p53 in hepatocellular carcinoma cells. Dig Dis Sci.
62:3495–3500. 2017. View Article : Google Scholar : PubMed/NCBI
|