Introduction
Breast cancer is a malignant tumor in the mammary
gland tissue (1). Orthotopic breast
cancer is not fatal, but its cells are easy to fall off, and these
shedding cancer cells will be free from blood or lymph fluid and
spread throughout the body to form cancer, then cancer metastasis
is formed, thereby threatening life (2). The incidence of breast cancer has been
on an upward trend, and in statistics of DeSantis et al
(3), 1 out of 10 women in the United
States has breast cancer. Although China is not a country with a
high incidence of breast cancer, the growth rate in China has been
approximately 2 percentage points higher than that in some
high-incidence countries in recent years (4). In the recently published data (5), the incidence of breast cancer still
ranks first among female malignant tumors in the cancer
registration in China. The peak of onset age of breast cancer is
approximately 53 years, but now it tends to be younger (6).
Methylation is an important modification of protein
and nucleic acid and one of the most important research topics in
epigenetics (7). In recent years,
methylation has been studied in the diagnosis, efficacy and
prognostic evaluation of various cancers such as ovarian cancer
(8), cervical cancer (9) and hepatocellular carcinoma (10). The clinical application of methylation
in breast cancer has also been systematically studied. The report
of An et al (11) proposed
that the methy-lation of MGMT gene that was closely related to the
clinical stage, histological grade and lymph node metastasis of
breast cancer played an important role in its progression. Studies
of Hao et al (12) showed that
the combined detection of the methy-lation degree of a variety of
genes could be a good judgement of tumor stage and lymph node
metastasis. However, these studies have focused on a small number
of candidate genes and have not systematically screened out
methylation genes that may be related to the occurrence and
development of breast cancer. The Cancer Genome Atlas (TCGA)
(13) and the Gene Expression Omnibus
(GEO) (14) are commonly used public
databases in bioinformatics analysis, but the former has complete
patient data and is more conducive to the related analysis of the
course and prognosis. Therefore, we hope to expand the current
study on the role of methylation in the occurrence and development
of breast cancer by screening out breast cancer-related methylation
genes from the TCGA database, and analyzing the relationship
between them and the course and prognosis of breast cancer.
Materials and methods
Data collection and preprocessing
The data were downloaded from the TCGA database. The
RNA-seq data and methylation data for level 3 were downloaded from
TCGA, and the selected samples were all patient tissue samples.
First, the RNA-seq data files were merged into a matrix file using
the merge script of the Perl language (http://www.perl.org/). Then, the gene name was
converted from the Ensembl id to the matrix of the gene symbol
through the Ensembl database (http://asia.ensembl.org/index.html). At the same time,
the methylation data were merged into a single file through the
merge script of the Perl language. In the downloaded RNA-seq data
and methylation data, the data with incomplete clinical information
were excluded. Only the samples that had undergone RNA sequencing
and methylated chip data were retained in the remaining data to
make it possible to perform a linkage analysis of transcription and
methylation.
The study was approved by the Ethics Committee of
The First Affiliated Hospital of China Medical University
(Shenyang, China).
Screening of differentially methylated
genes
All cancer tissues and normal tissues were compared
and all high and low methylated genes were looked for (FDR<0.05)
using the MethylMix R package (http://www.bioconductor.org/packa-ges/release/bioc/html/MethylMix.html)
in the R Project for Statistical Computing software (Sax software;
SAS Institute Inc., Cary, NC, USA). Bidirectional hierarchical
clustering of differentially methylated genes was performed, and
the differential distribution map of the genes with the most
significant methylation difference screened out was plotted using
pheatmap R package (https://cran.r-project.org/web/packages/pheatmap/),
and the distribution of methylation degree of cancer samples
relative to normal tissues was observed. The correlation between
the gene methylation degree and the corresponding gene expression
was calculated using Pearson's correlation test in the cor.test
function of the R language (https://www.r-project.org/) (filter condition was cor
<-0.3 and P<0.05).
GO enrichment analysis
The GO enrichment analysis of differentially
methylated genes was performed using DAVID (Database for
Annotation, Visualization and Integration Discovery). First, the
DAVID database was logged in (https://david.ncifcrf.gov/), the Functional Annotation
was selected, and the list of differentially expressed genes was
submitted. Then, the OFFICIAL_GENE_SYMBOL in the Select Identifier
was selected, and the Gene List in List Type was selected, and the
Submit List was clicked finally. At the same time, the figure of
enrichment results was plotted using the GOplot R package
(https://cran.r-project.org/web/packages/GOplot/).
PATHWAY analysis
The differentially methylated genes were analyzed
using the over-representation analysis function of ConsensusPathDB
(http://cpdb.molgen.mpg.de/). The PATHWAY
pathways enrichment analysis of differentially methylated genes was
performed using the KEGG database. P<0.05 was the screening
condition.
Single factor and multivariate Cox
analysis
To determine the methylation genes related to
survival, single factor Cox analysis of differentially methylated
genes was performed using Survival R package (https://cran.r-project.org/web/views/Survival.html),
and selection of differentially methylated genes with P<0.05 in
the single factor analysis for subsequent multivariate analysis was
performed. The optimal risk model was found based on the Akaike
Information Criterion (AIC) (15).
Survival curve and ROC curve
plotting
According to the optimal risk model obtained from
the multivariate Cox analysis and the gene methylation degree of
each sample, the survival score was performed, and the median value
of risk score of each sample was calculated. The patients above the
median value were in the high-risk group, patients below it in the
low-risk group. The survival curves of the two groups were plotted
using the Kaplan-Meier method, and the difference between them was
tested using the log-rank method. The ROC curve was plotted to
predict the value of the patient's survival time through the gene
methylation degree.
Results
Clinical data of samples
According to the inclusion criteria we set, 670
samples were finally obtained as the subjects, and the clinical
data statistics are shown in Table
I.
 | Table I.Clinical data of samples. |
Table I.
Clinical data of samples.
| Covariates | Type | No. of patients [n
(%)] |
|---|
| Survival status | Alive | 616 (91.94%) |
|
| Dead | 54 (8.06%) |
| T | T1 | 175 (26.12%) |
|
| T2 | 381 (56.87%) |
|
| T3 | 93 (13.88%) |
|
| T4 | 21 (3.13%) |
| N | N0 | 306 (45.67%) |
|
| N1 | 233 (34.78%) |
|
| N2 | 76 (11.34%) |
|
| N3 | 49 (7.31%) |
|
| NX | 6 (0.90%) |
| M | M0 | 530 (79.10%) |
|
| M1 | 11 (1.64%) |
|
| MX | 129 (19.25%) |
| Stage | Stage I | 112 (16.72%) |
|
| Stage II | 380 (56.72%) |
|
| Stage III | 167 (24.93%) |
|
| Stage IV | 11 (1.64%) |
| Age | ≤65 | 482 (71.94%) |
|
| >65 | 188 (28.06%) |
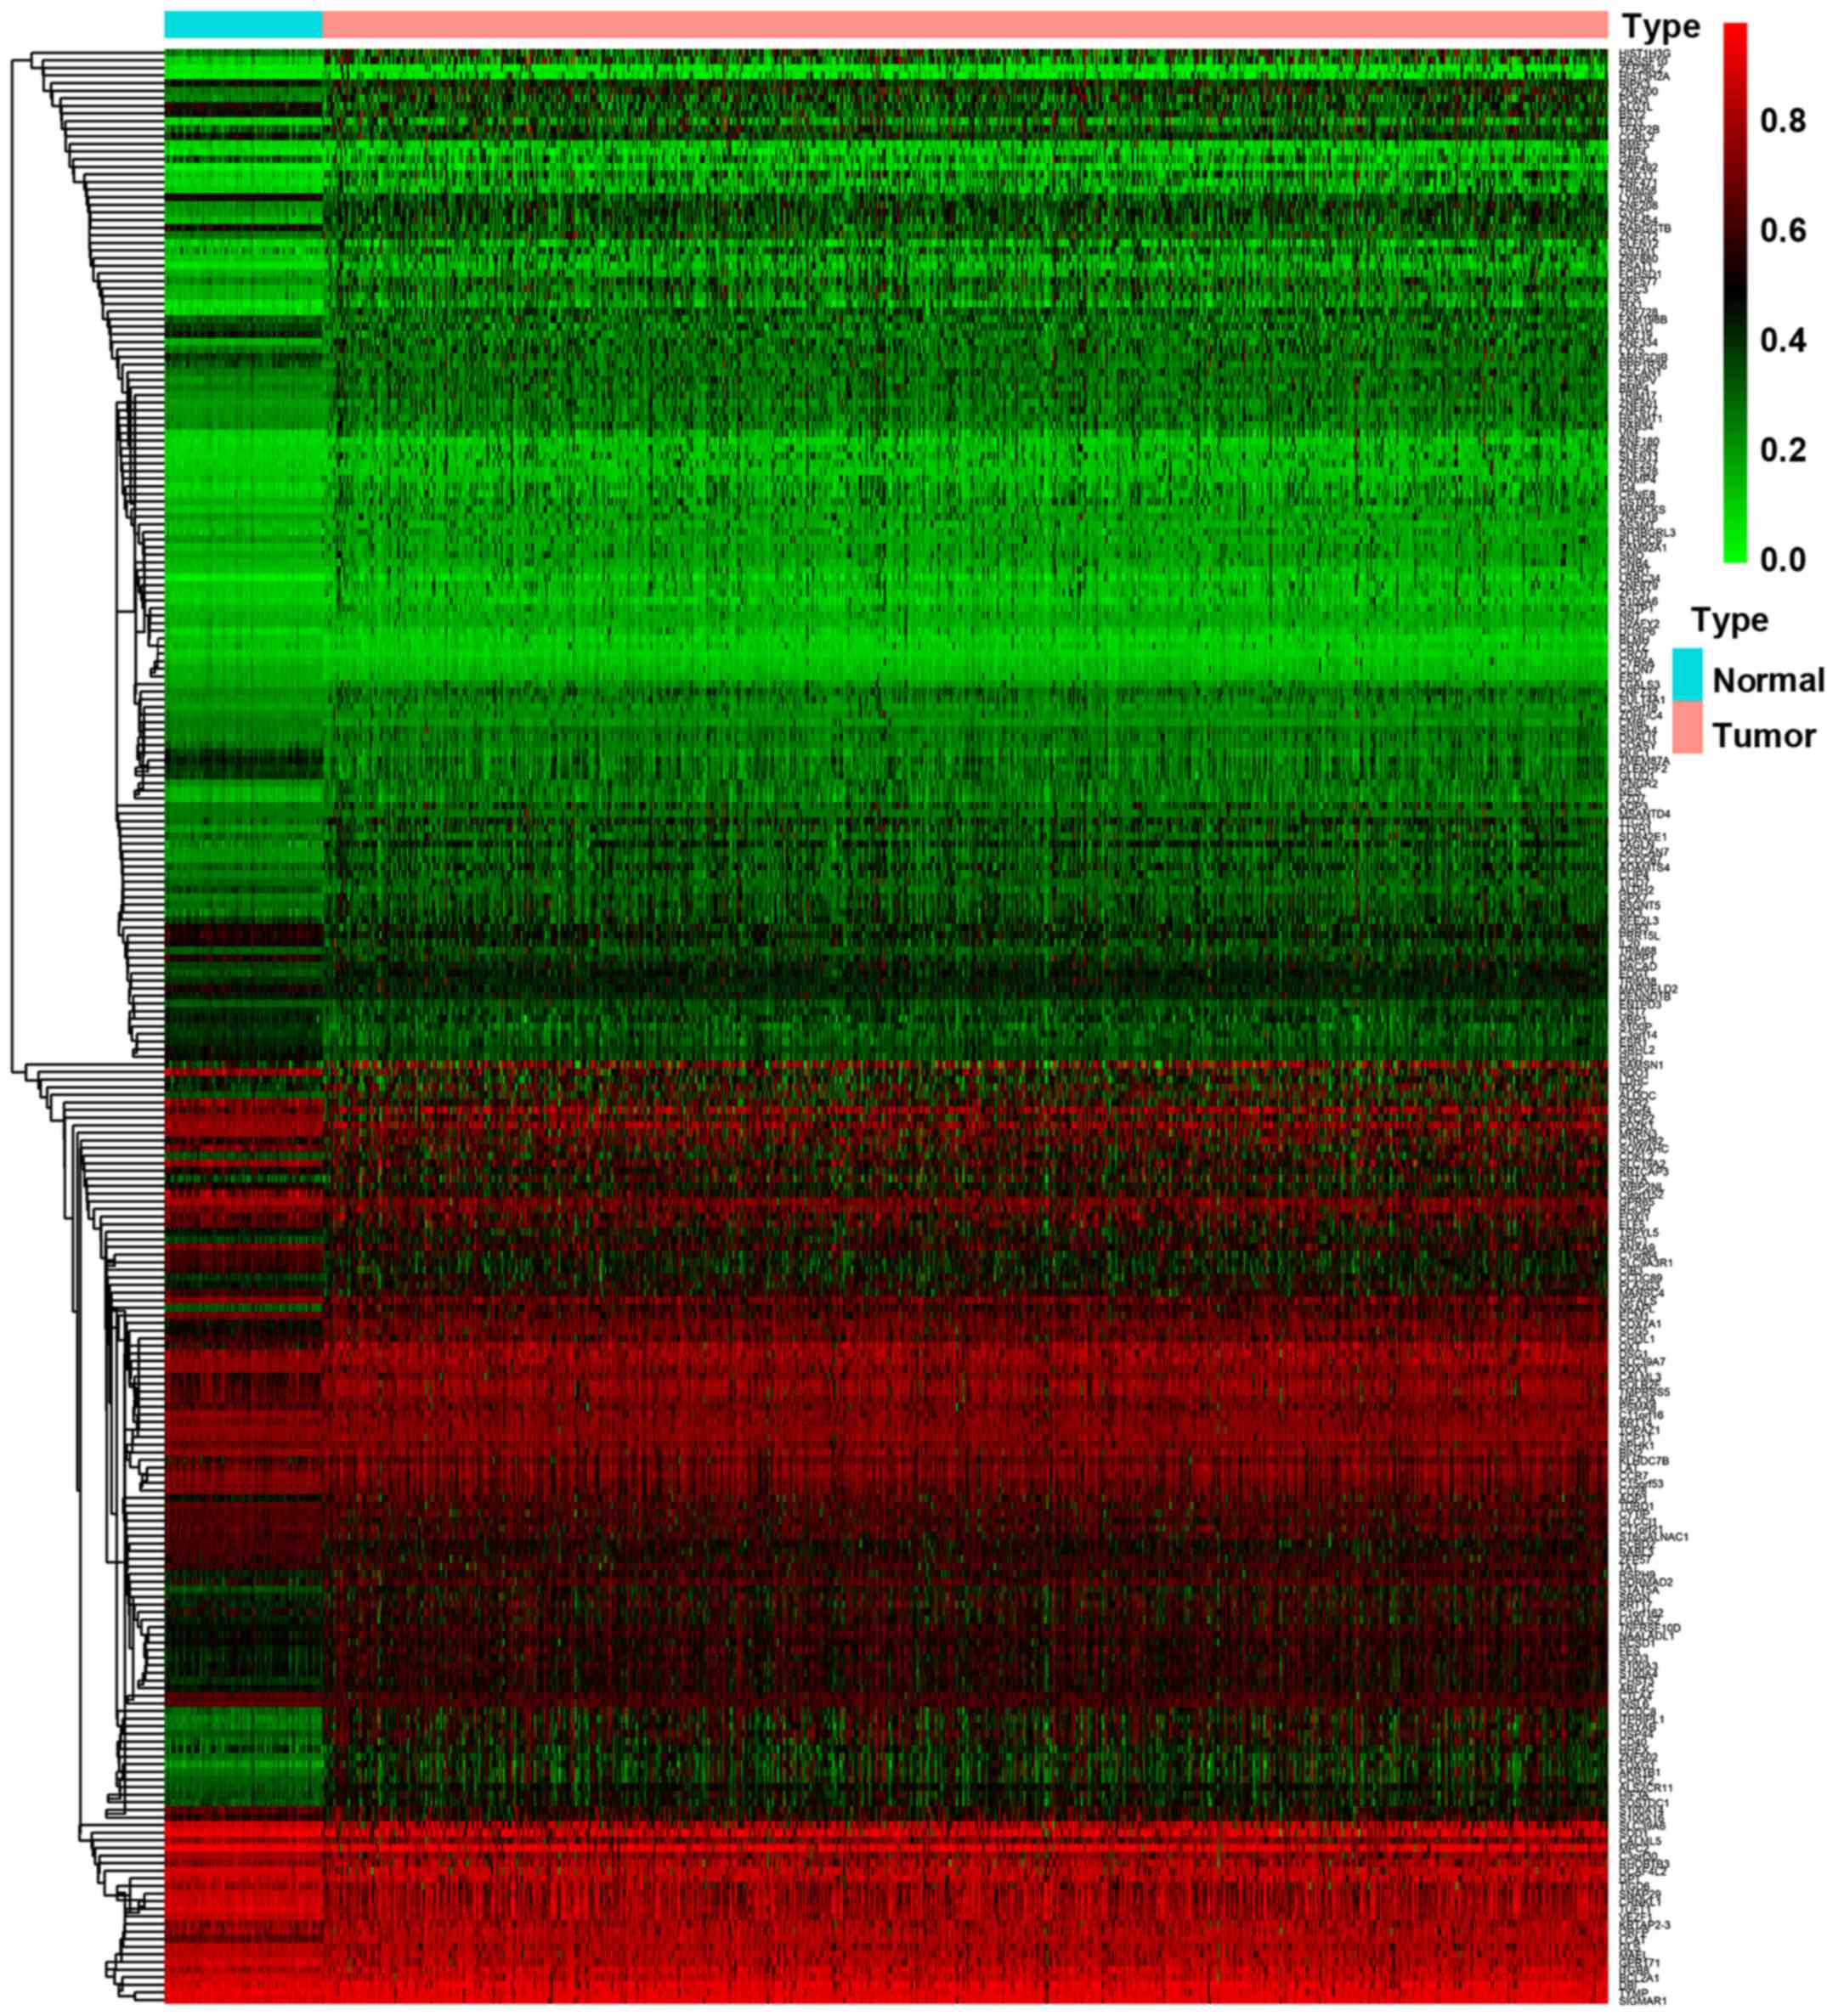
Screening of differentially methylated
genes
Through a comparison of the gene methylation levels
in cancer and normal tissues, 257 differentially methylated genes
were screened out (FDR<0.05) and the thermal map was plotted
(Fig. 1), in which there were 161
genes with higher methylation degree of cancer tissues than that of
normal tissues, and 96 genes with it lower than that of normal
tissues. The FDR (corrected P-value) was used as the standard and
the first 10 differentially methylated genes with the smallest
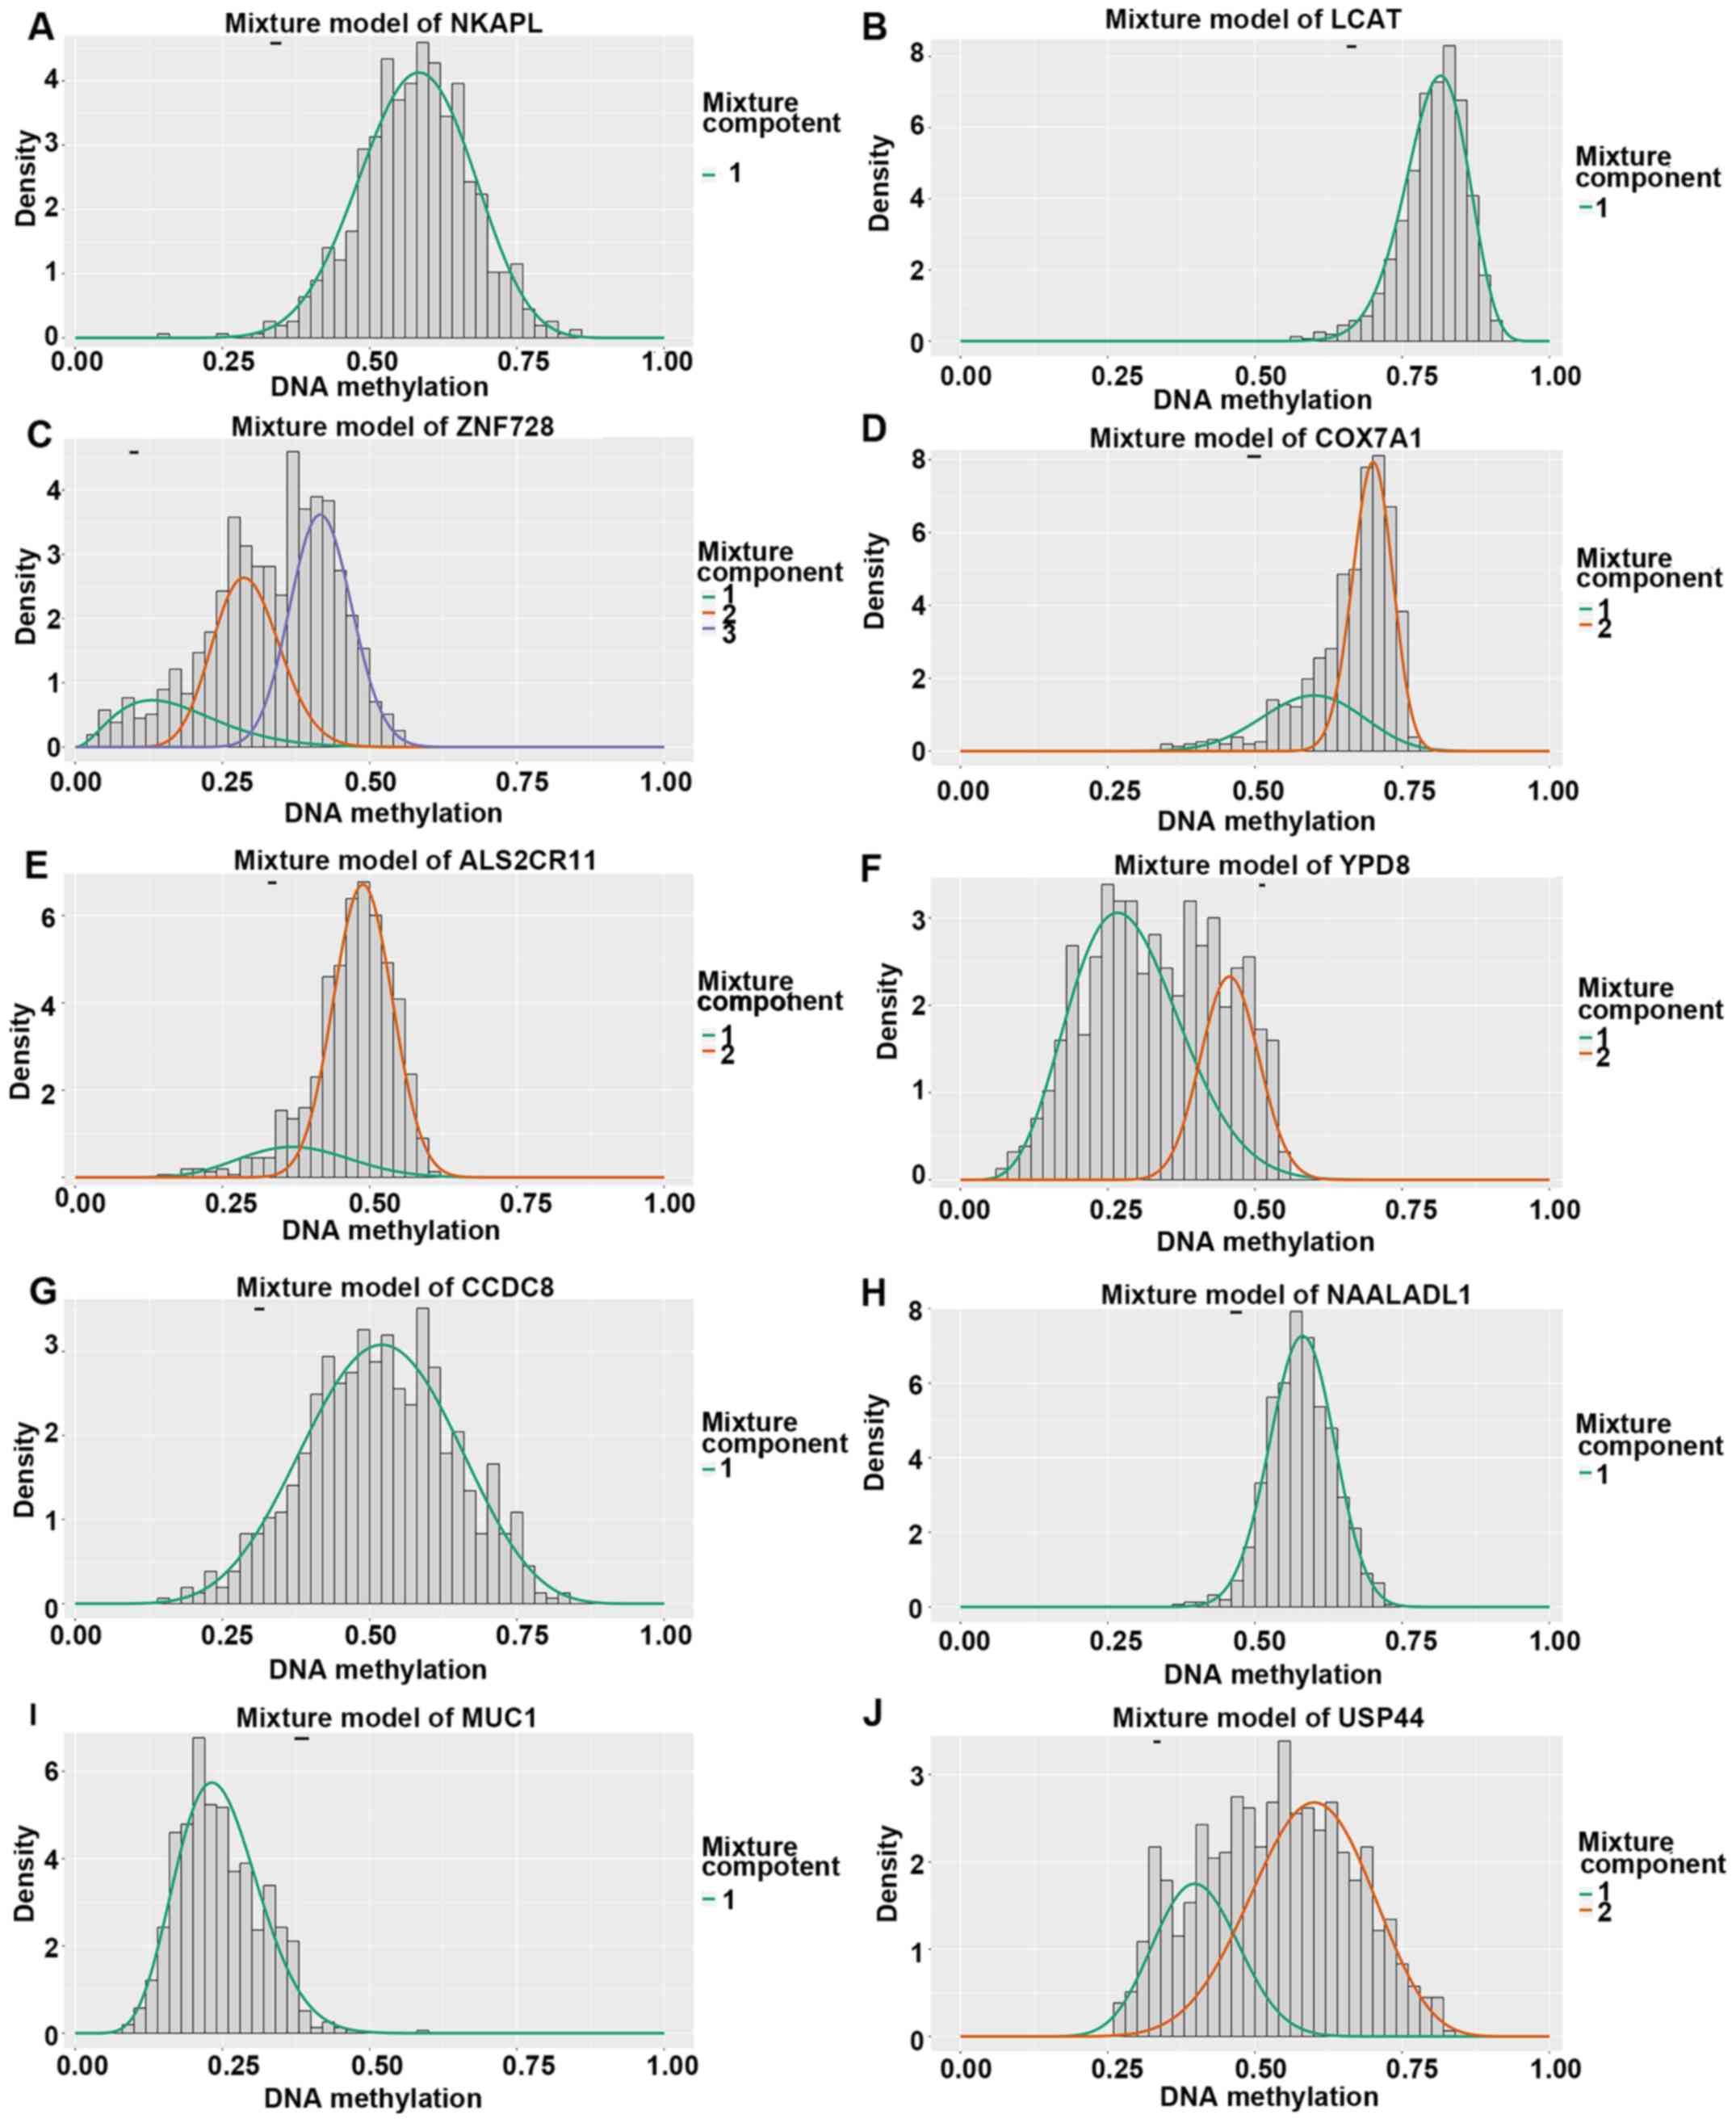
P-value were selected (Table II).
The distribution map of methylation degree was plotted (Fig. 2A-J).
| Table II.Partially differentially methylated
genes. |
Table II.
Partially differentially methylated
genes.
| Gene symbol | Normal group
methylation level (A) | Cancer group
methylation level (B) | Methylation
degree | P-value | FDR |
|---|
| NKAPL | 0.340837653 | 0.577383257 | 0.236545604 | 4.31E-54 | 1.22E-51 |
| LCAT | 0.664095202 | 0.803431309 | 0.139336107 | 1.16E-50 | 1.64E-48 |
| ZNF728 | 0.099901799 | 0.333781489 | 0.233879691 | 1.24E-49 | 1.16E-47 |
| COX7A1 | 0.498567597 | 0.664727174 | 0.166159577 | 2.04E-46 | 1.44E-44 |
|
ALS2CR11 | 0.334427241 | 0.470741226 | 0.136313985 | 4.83E-46 | 2.72E-44 |
| LYPD8 | 0.512159389 | 0.335695176 | −0.176464213 | 9.37E-46 | 4.40E-44 |
| CCDC8 | 0.312900607 | 0.518293085 | 0.205392479 | 7.78E-45 | 3.09E-43 |
|
NAALADL1 | 0.467929203 | 0.578828343 | 0.110899139 | 8.77E-45 | 3.09E-43 |
| MUC1 | 0.384572295 | 0.246245302 | −0.138326993 | 1.13E-43 | 3.54E-42 |
| USP44 | 0.333728357 | 0.532191383 | 0.198463026 | 1.97E-43 | 5.56E-42 |
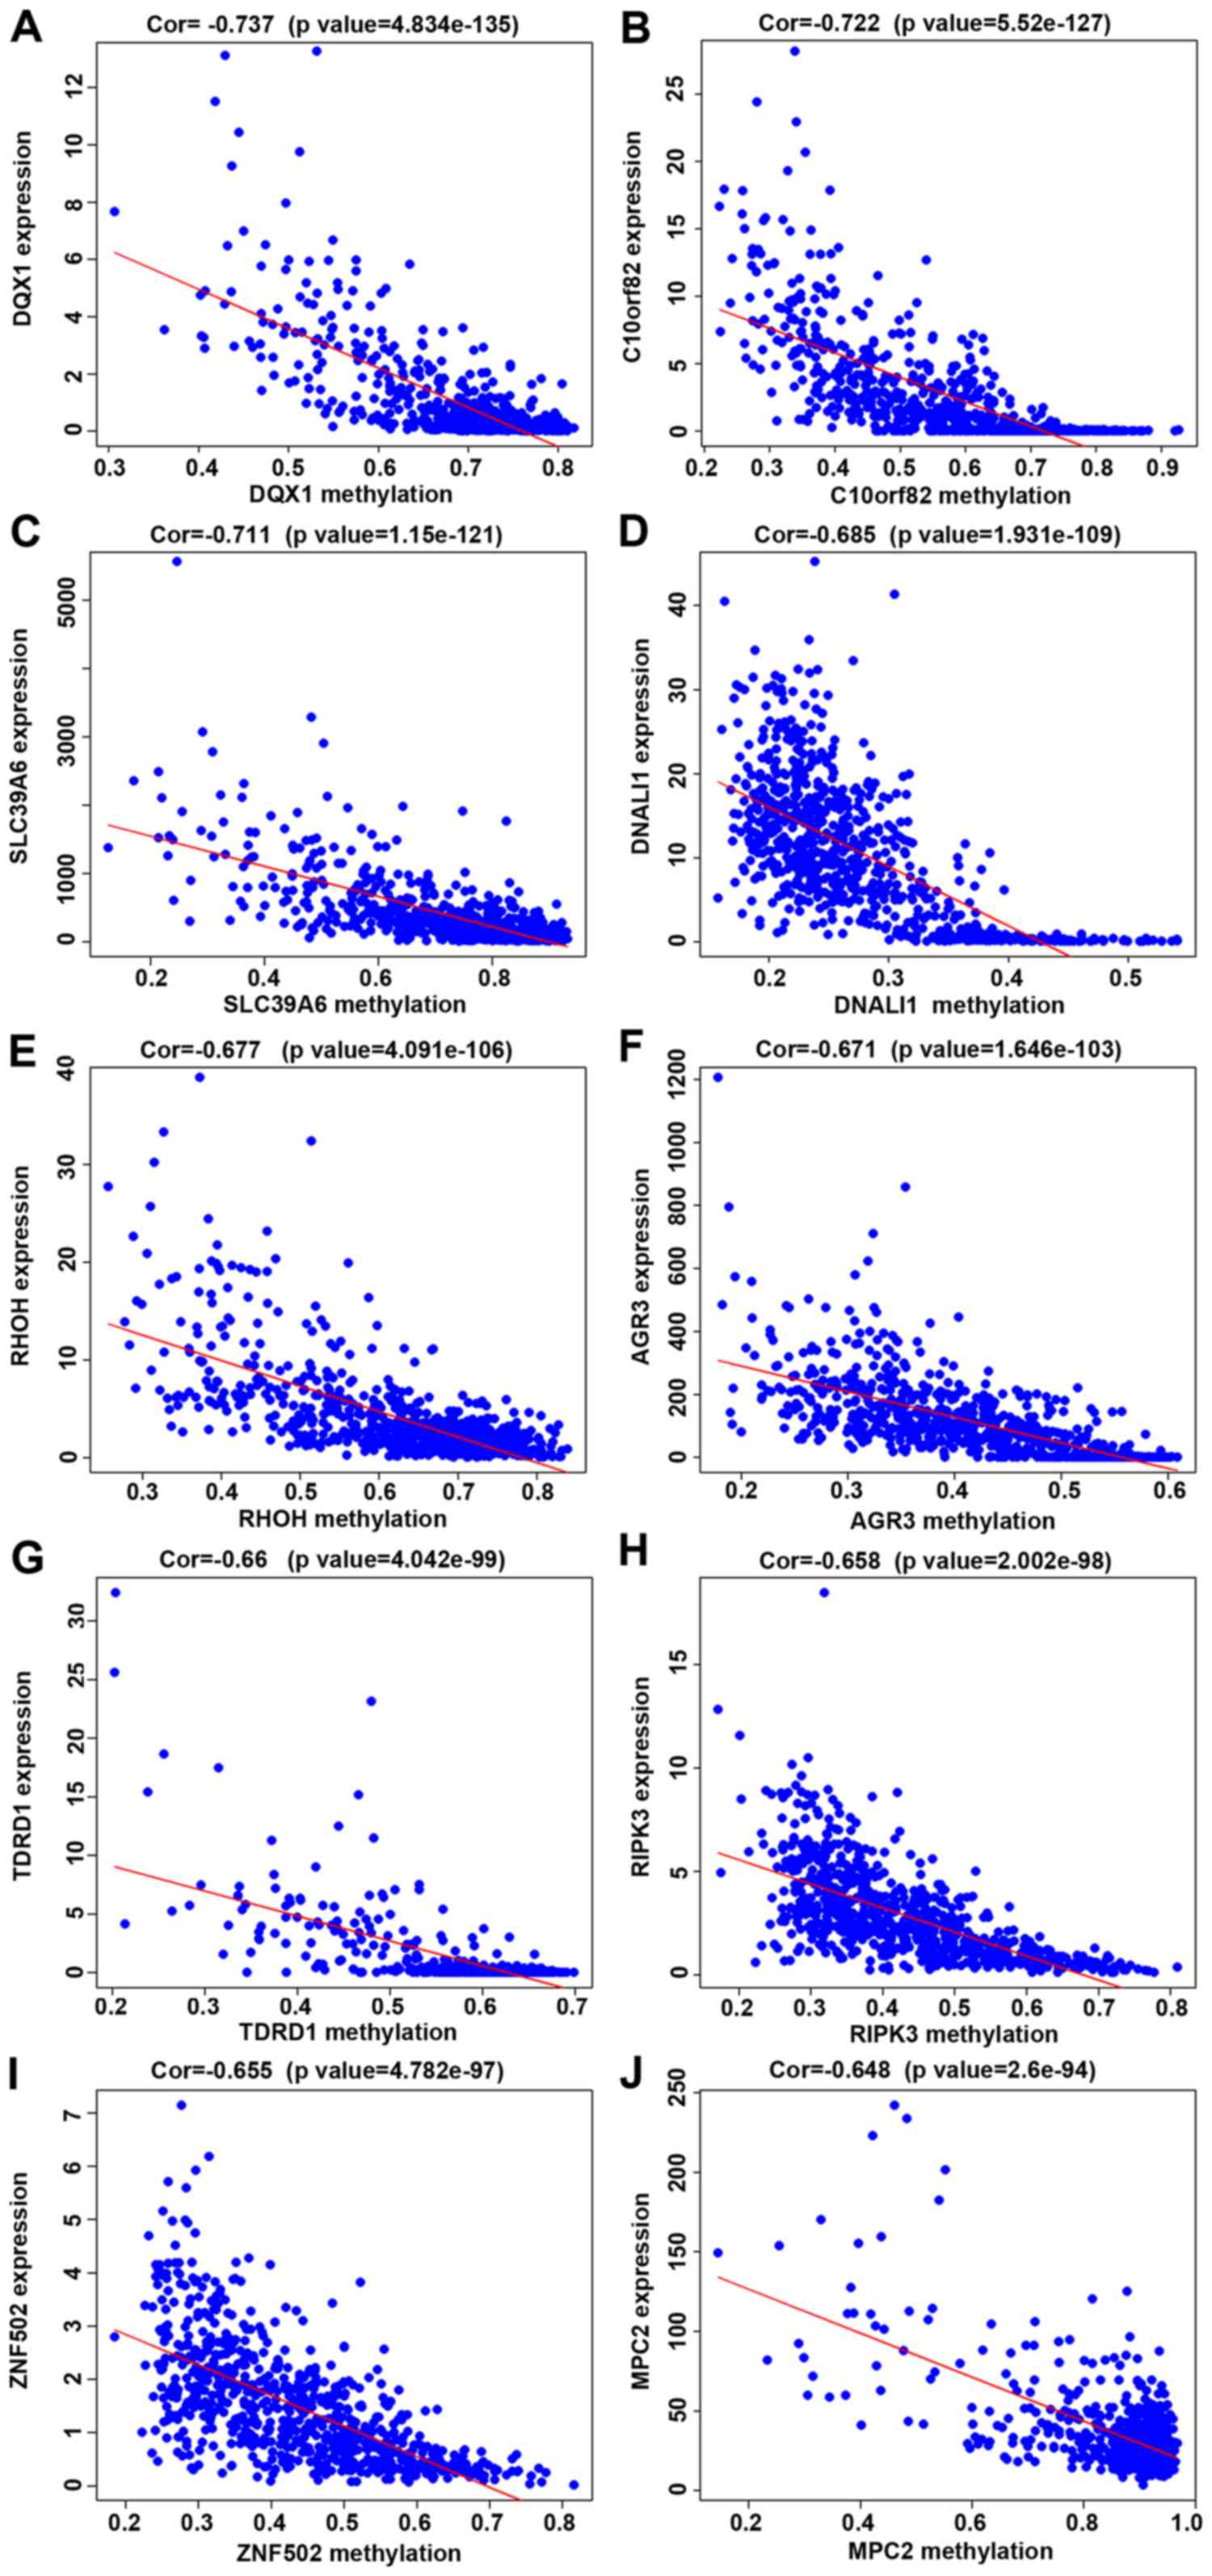
Correlation analysis between
methylation degree and gene expression
Correlation analysis between methylation degree of
257 differentially methylated genes and their gene expression was
performed, and it was found that the methylation degree of these
257 genes was negatively correlated with their expression. The
higher the methylation degree was, the lower the gene expression.
Based on the P-value obtained from the Pearson's correlation test,
the first 10 genes with the smallest P-value were selected
(Table III), and the correlation
figure was plotted (Fig. 3A-J).
| Table III.Correlation analysis between
methylation degree and gene expression. |
Table III.
Correlation analysis between
methylation degree and gene expression.
| Gene | cor | P-value |
|---|
| DQX1 | −0.737068974 | 4.83E-135 |
|
C10orf82 | −0.721853363 | 5.52E-127 |
| SLC39A6 | −0.71121904 | 1.15E-121 |
| DNALI1 | −0.684796632 | 1.93E-109 |
| RHOH | −0.677085189 | 4.09E-106 |
| AGR3 | −0.670876546 | 1.65E-103 |
| TDRD1 | −0.660058794 | 4.04E-99 |
| RIPK3 | −0.658304073 | 2.00E-98 |
| ZNF502 | −0.654789106 | 4.78E-97 |
| MPC2 | −0.64767024 | 2.60E-94 |
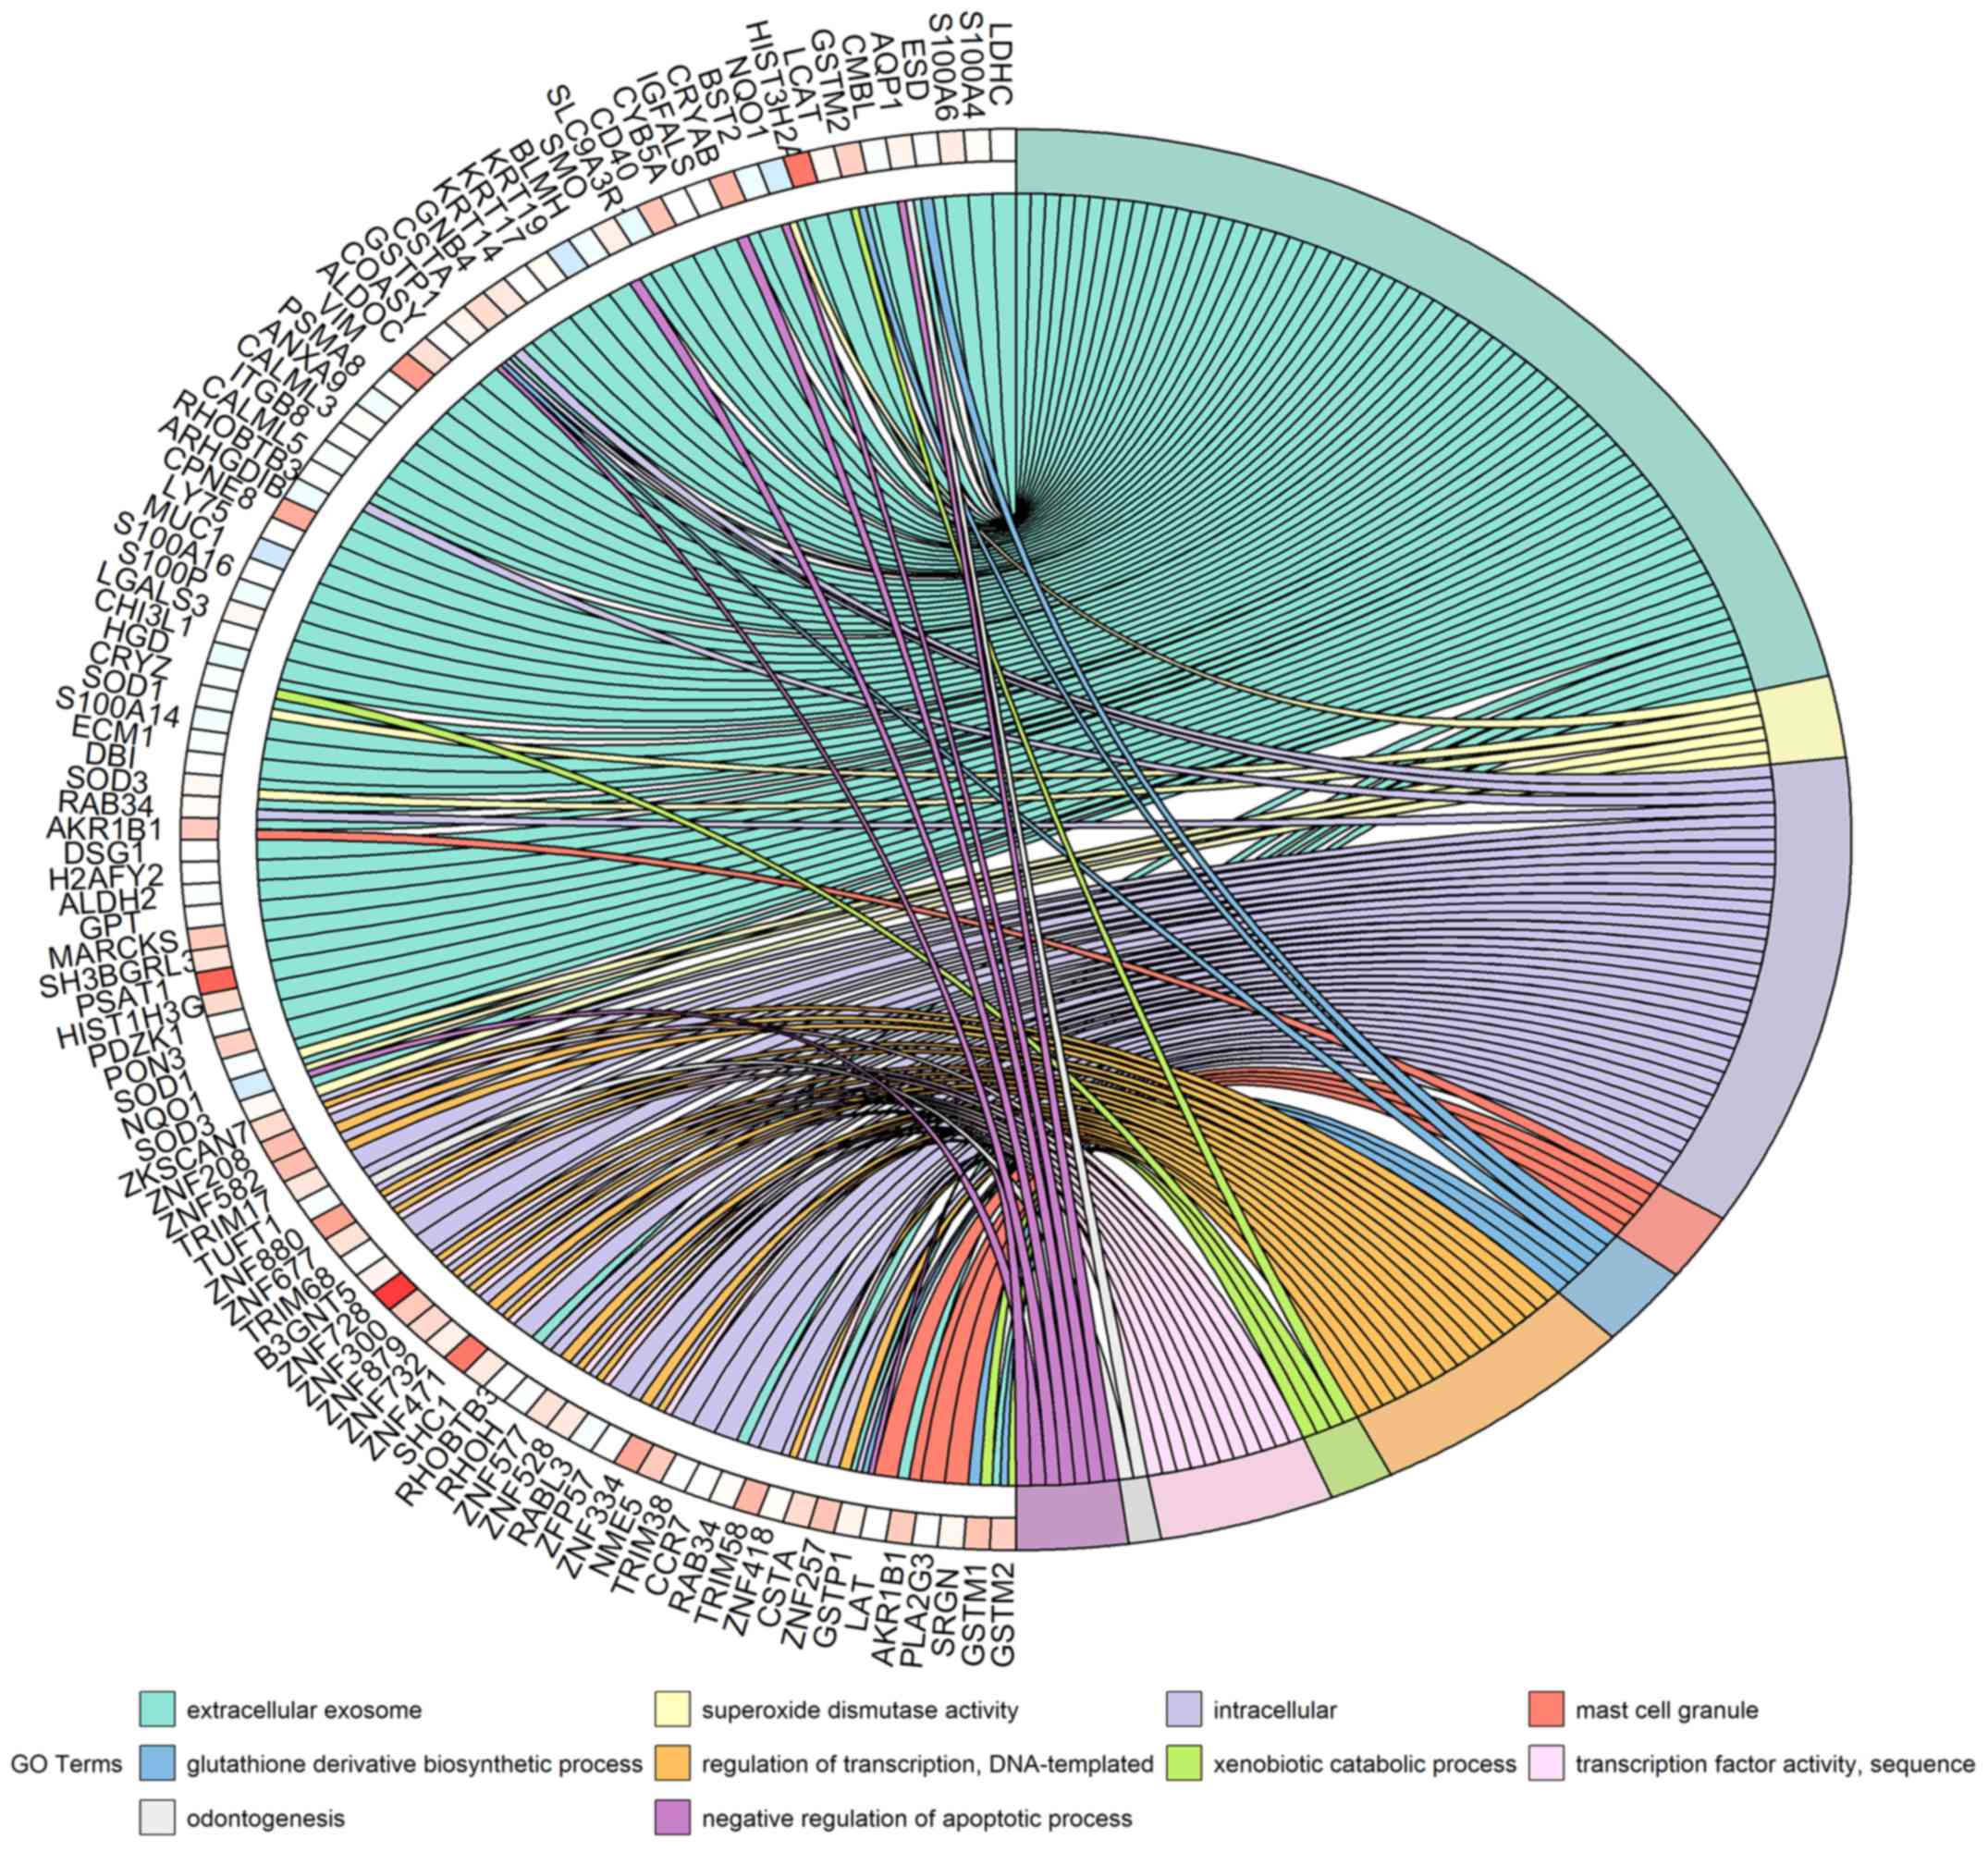
GO enrichment analysis
The GO enrichment analysis of 257 differentially
methylated genes was performed using DAVID, and results showed that
the most relevant enrichments were ‘extracellular exosome’,
‘superoxide dismutase activity’, ‘intracellular’, ‘mast cell
granule’ and ‘glutathione derivative biosynthetic’, (Table IV and Fig.
4).
| Table IV.GO enrichment analysis of
differentially methylated genes. |
Table IV.
GO enrichment analysis of
differentially methylated genes.
| Term | Enrichments | Count | P-value | FDR |
|---|
| GO:0070062 | Extracellular
exosome | 60 | 8.25E-05 | 0.10545219 |
| GO:0004784 | Superoxide
dismutase activity | 3 | 0.001692298 | 2.353503638 |
| GO:0005622 | Intracellular | 31 | 0.002142855 | 2.7070955 |
| GO:0042629 | Mast cell
granule | 4 | 0.002400191 | 3.027607057 |
| GO:1901687 | Glutathione
derivative biosynthetic process | 4 | 0.002628416 | 4.227224422 |
| GO:0006355 | Regulation of
transcription, DNA-templated | 33 | 0.002759092 | 4.43294563 |
| GO:0042178 | Xenobiotic
catabolic process | 3 | 0.003254731 | 5.209453579 |
| GO:0003700 | Transcription
factor activity, sequence-specific DNA binding | 24 | 0.004284423 | 5.858842135 |
| GO:0042476 | Odontogenesis | 4 | 0.004764259 | 7.538061353 |
| GO:0043066 | Negative regulation
of apoptotic process | 14 | 0.005694098 | 8.94558752 |
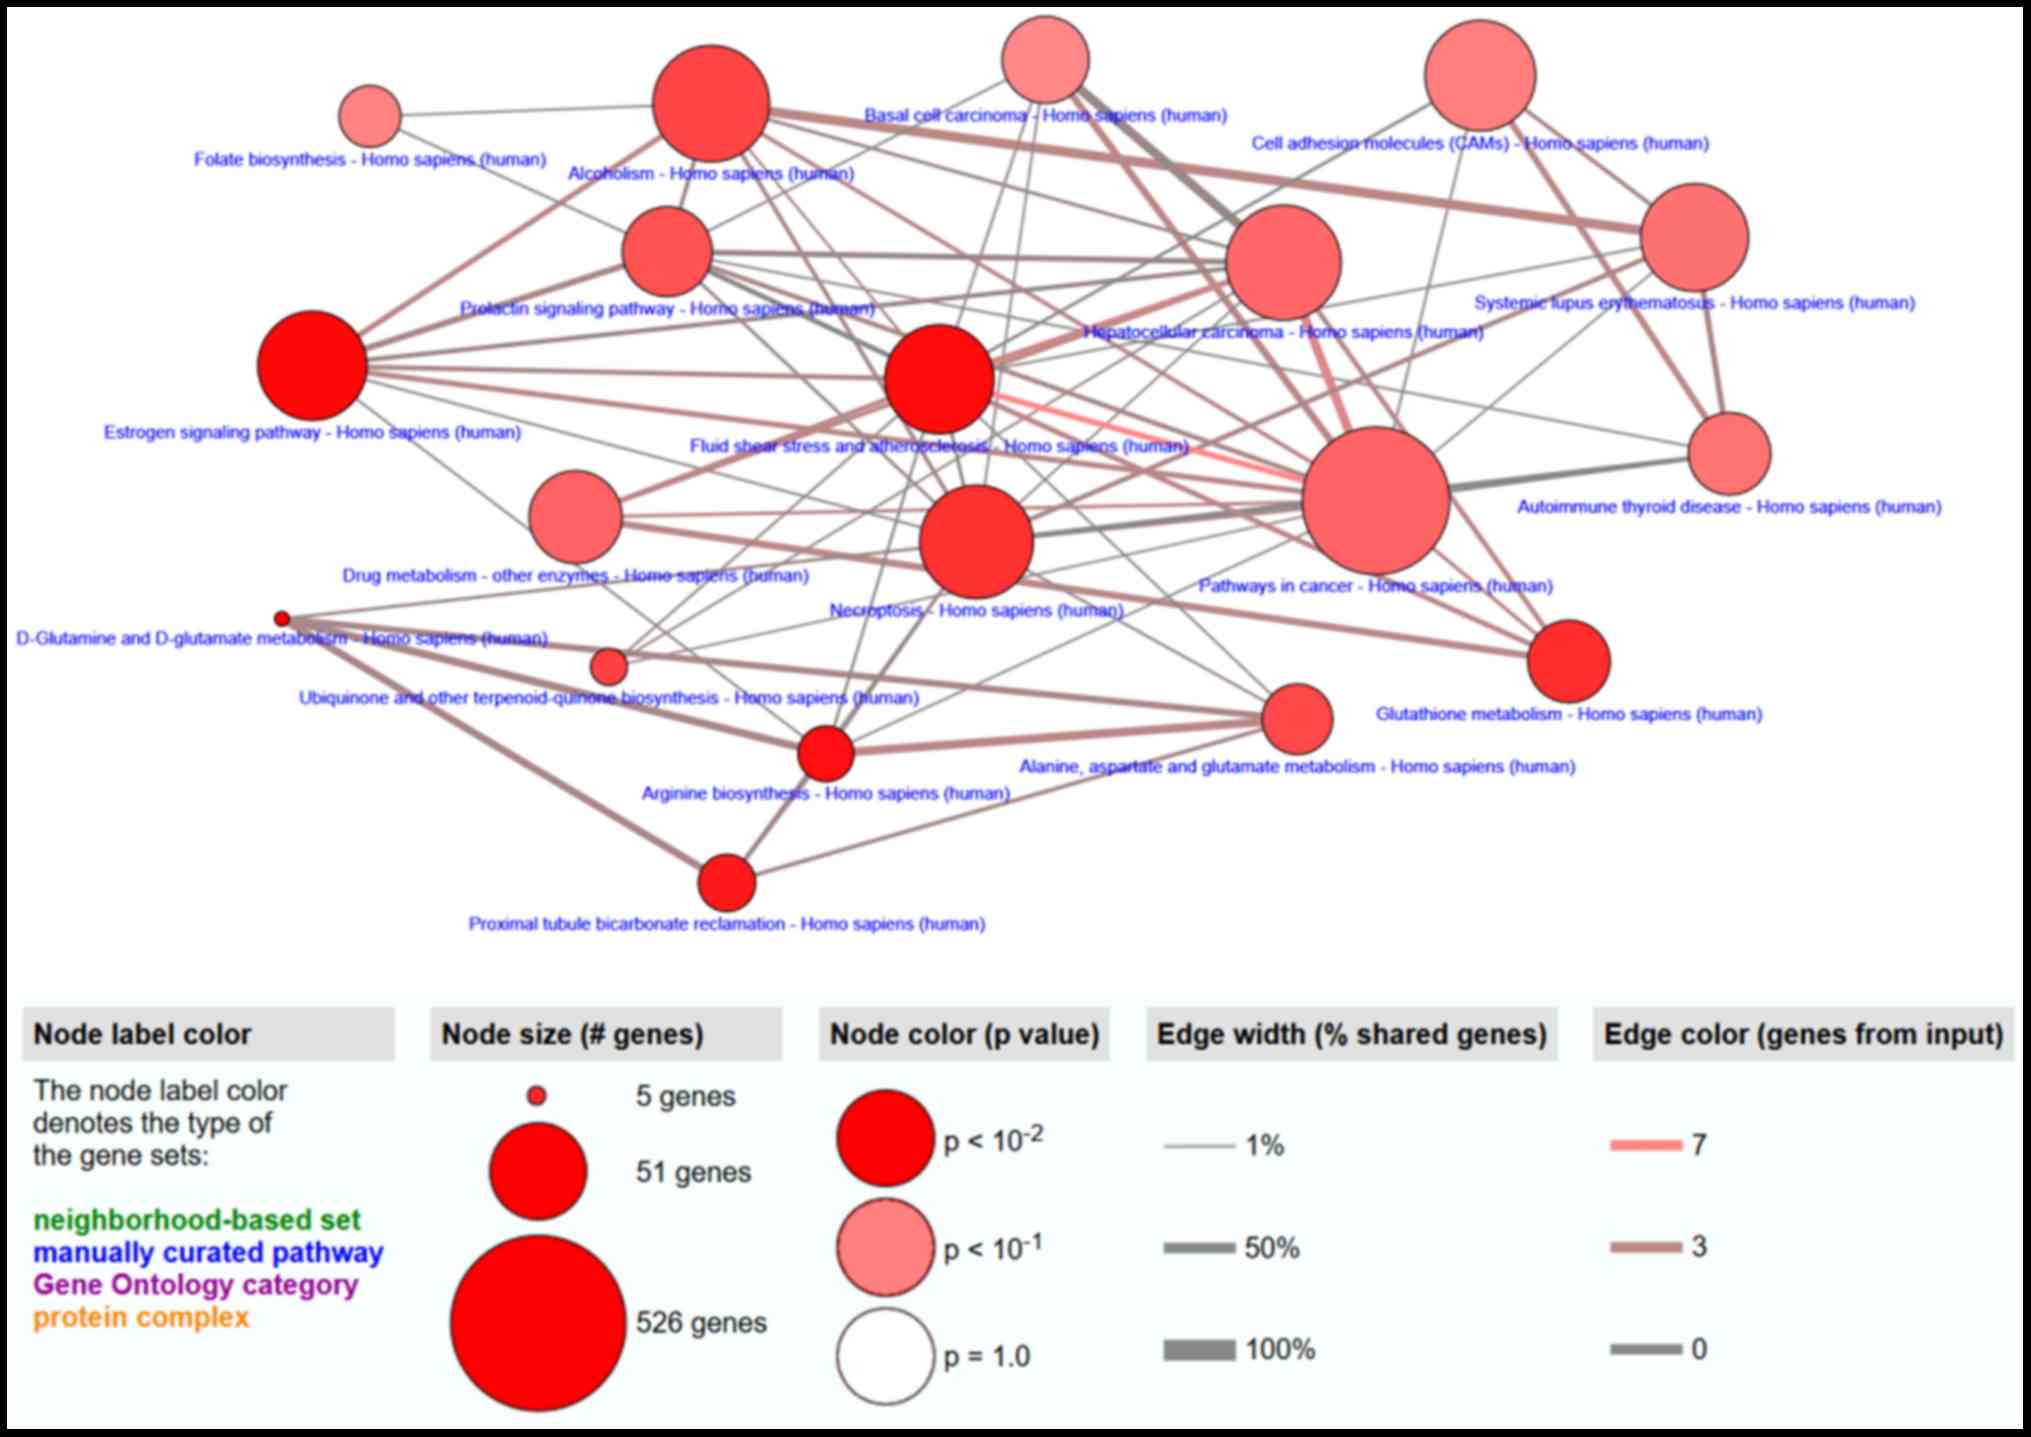
PATHWAY analysis
The PATHWAY pathways enrichment analysis of 257
differentially methylated genes was performed using
ConsensusPathDB, and a total of 19 related PATHWAYs were found
(P<0.05), among which the most relevant were ‘D-Glutamine and
D-glutamate metabolism’, ‘Estrogen signaling pathway’ and ‘Fluid
shear stress and atherosclerosis’ (Table
V and Fig. 5).
| Table V.Partial PATHWAY enrichment
analysis. |
Table V.
Partial PATHWAY enrichment
analysis.
| Pathway ID | Pathway | P-value | Enriched genes |
|---|
| hsa00471 | D-Glutamine and
D-glutamate metabolism | 0.001650165 | GLS;
GLUD1 |
| hsa04915 | Estrogen signaling
pathway | 0.002030577 | SHC1; ESR1;
CALML3; CALML5; KRT17; KRT14; KRT19 |
| hsa05418 | Fluid shear stress
and atherosclerosis | 0.00229801 | BMP4; CALML3;
GSTM1; GSTM2; CALML5; NQO1; GSTP1 |
| hsa00220 | Arginine
biosynthesis | 0.002443407 | GPT; GLS;
GLUD1 |
| hsa04964 | Proximal tubule
bicarbonate reclamation | 0.003192003 | GLS; GLUD1;
AQP1 |
| hsa00480 | Glutathione
metabolism | 0.005331216 | GSTM1; GSTM2;
GSTP1; GPX7 |
| hsa04217 | Necroptosis | 0.005718681 | H2AFY2; RIPK3;
GLUD1; STAT5A; IFNGR2; TNFRSF10D; HIST3H2A |
| hsa00130 | Ubiquinone and
other terpenoid-quinone biosynthesis | 0.008620151 | TAT;
NQO1 |
| hsa05034 | Alcoholism | 0.009346881 | SHC1; CALML3;
GNB4; H2AFY2; CALML5; HIST1H3G; HIST3H2A |
| hsa00250 | Alanine, aspartate
and glutamate metabolism | 0.010523928 | GPT; GLS;
GLUD1 |
Single factor and multivariate Cox
analysis
Single factor Cox analysis of differentially
methylated genes was performed using the Survival R package, the
screening condition was P<0.01, and 14 genes were obtained
(Table VI). At the risk ratio (HR)
>1, the higher the gene expression was, the higher the risk was;
at HR <1, the higher the gene expression was, the lower the risk
was. Multivariate analysis of 14 selected genes significantly
different from single factor was performed using Survival package.
The optimal model was found according to AIC and four optimal gene
models were obtained. The risk model obtained was: risk score =
QRFP (Degree of methylation) × (−3.657) + S100A16 ×
(−3.378) + TDRD1 × (−4.001) + SMO × (3.548).
| Table VI.Single factor Cox analysis. |
Table VI.
Single factor Cox analysis.
| Gene | HR | z | P-value |
|---|
| QRFP | 0.047697004 | −3.632634369 | 0.000280542 |
| CSTA | 0.062945881 | −3.360829859 | 0.000777087 |
| ELF5 | 0.058117795 | −3.264669409 | 0.001095919 |
| GRHL2 | 4.13E-06 | −3.167428425 | 0.001537936 |
| CCDC89 | 0.024575046 | −2.971482358 | 0.002963659 |
| S100A3 | 0.011686928 | −2.86232633 | 0.004205437 |
| S100A16 | 0.024716952 | −2.82925571 | 0.00466564 |
| TDRD1 | 0.017847438 | −2.791779478 | 0.005241907 |
| SMO | 42.93347544 | 2.704736969 | 0.006835849 |
| CALML5 | 0.054952261 | −2.672962518 | 0.007518465 |
| SCG5 | 0.015402449 | −2.669608387 | 0.007593976 |
| TAF1D | 0.040537383 | −2.661547052 | 0.007778247 |
| SOD1 | 0.145404134 | −2.6286443 | 0.008572598 |
|
KRTAP2-3 | 0.04690311 | −2.604144621 | 0.009210388 |
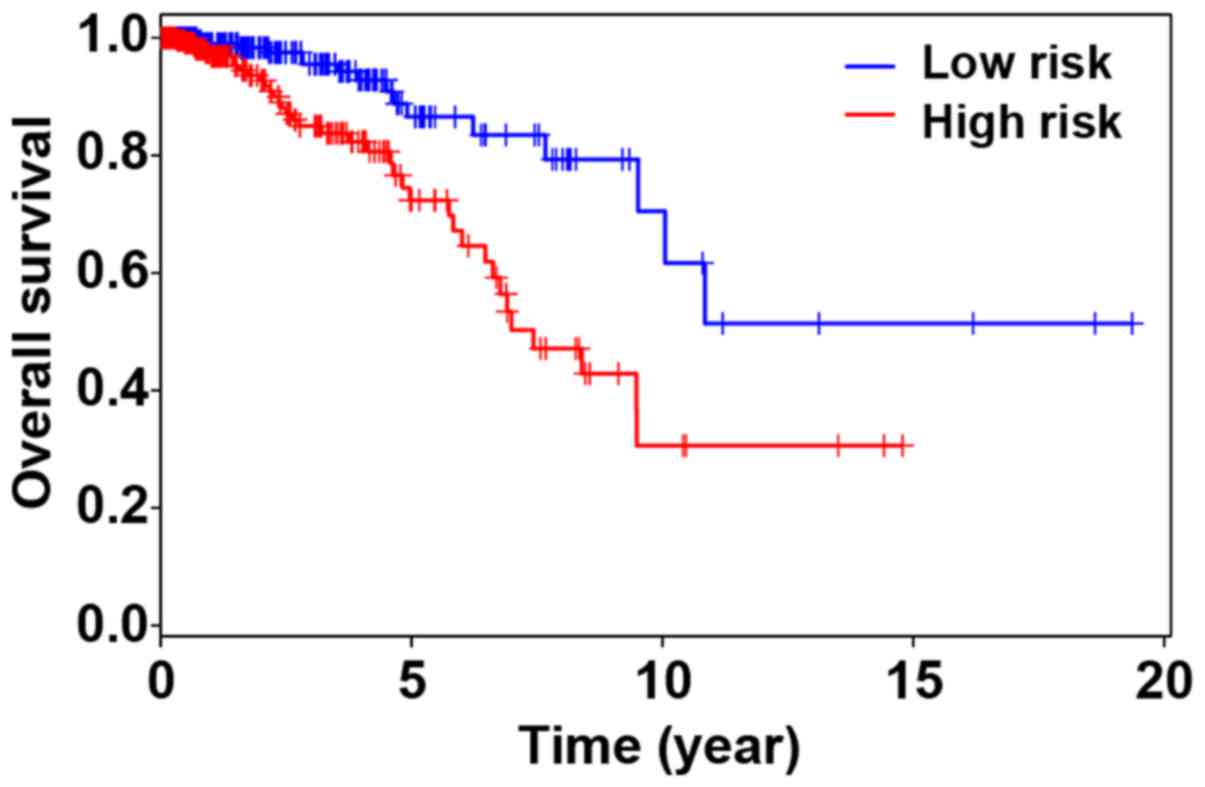
Survival curve and ROC curve
plotting
According to the optimal risk model obtained from
the multivariate Cox analysis and the degree of gene methylation of
each sample, the survival score was performed. The median value of
risk score of each sample was calculated to be 0.936, and used as
the cut-off value, 335 patients with a risk score >0.936 were in
the high-risk group and 335 patients <0.936 in the low-risk
group. Based on the high-risk and low-risk groups, the survival
curve was plotted using the Kaplan-Meier method (Fig. 6). From the survival data, we could see
that the five-year survival rate in the high-risk group of patients
was 72.4% (95% CI, 62.7–83.6%), and that in the low-risk group of
patients was 86.6% (95% CI, 78.6–95.3%), and the difference thereof
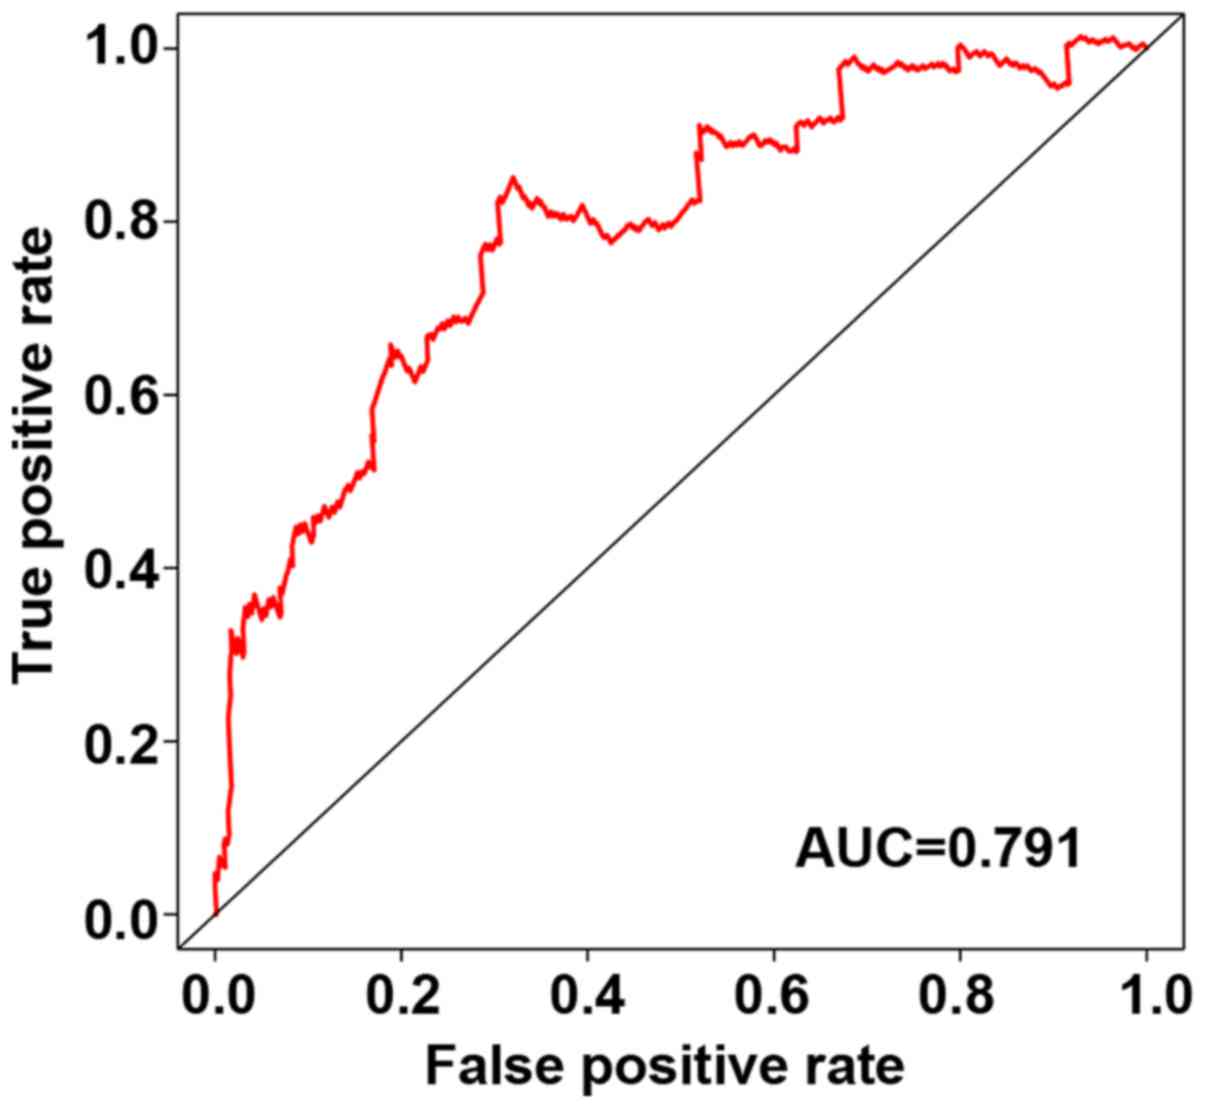
between the two groups was significant (P<0.001). At the same
time, the ROC curve was plotted (Fig.
7) and AUC was 0.791, indicating that our model could well
predict patient survival.
Discussion
In this study, 670 samples which had undergone RNA
sequencing and methylated chip data were selected by TCGA, in which
a differential methylation analysis was performed, and correlation
analysis, GO enrichment analysis, PATHWAY analysis, single factor
analysis, multivariate analysis, prognostic model and ROC curve
were performed on the differentially methylated genes.
Methylation is one of the most important studies in
epigenetics. In mammals, DNA methylation mainly occurs on CpG
islands, often in the promoter region or the first exon and the 3′
end of the gene (16), and about 70%
of human gene promoters exist in CpG islands (17). Studies have found that almost all
tumors can find abnormal DNA methylation in comparison between
cancer tissues and corresponding non-tumor normal tissues (18). Therefore, methylation is a very
important part in the current study on the molecular level of
cancer.
In our study, a total of 257 differentially
methylated genes were found by comparison between breast cancer
tissues and their corresponding normal tissues, of which the
methylation degree of NKAPL was the highest. In a study on 5
liver cancer cell lines and 62 pairs of primary liver cancer and
its adjacent non-cancerous liver tissues, Ng et al (19) found that NKAPL was highly
methylated in liver cancer, and the methylation degree was
negatively correlated with its expression level. It could also
inhibit the growth of cancer cells in liver cancer cells, which was
a potential prognostic marker. In our study, NKAPL was also
highly methyla-ted in breast cancer tissues, and the methylation
degree was also negatively correlated with its expression level. It
suggested that NKAPL may be involved in mechanism of cancer
suppression in breast cancer tissues. At the same time,
NKAPL was also enriched in ‘regulation of transcription,
DNA-templated’ and we hypothesized that it may affect cancer cell
changes by affecting the transcription and regulation of DNA.
However, there have been no reports of NKAPL in breast
cancer-related studies. In the follow-up GO enrichment analysis, it
was found that ‘extracellular exosome’ and ‘superoxide dismutase
activity’ were the most relevant enrichments with differentially
methylated genes, which mainly affected the activity of
extracellular body and superoxide dismutase (SOD).
Thirty years ago, when the first contact with the
extracellular body was made, it was originally thought that the
cell component was discarded or unwanted. Recently, it was realized
that the extracellular body contains cell-specific proteins, lipids
and genetic material that can be passed to distant tissues and
cells, thereby changing their function and physiology (20). Urabe et al (21) believed that the extracellular body was
expected to become a liquid biomarker for prostate cancer, kidney
cancer and bladder cancer by regulating the immune system and
angiogenesis that affect cancerous changes. At the same time, Chen
et al (22) thought that the
extracellular body induced the occurrence and recurrence of liver
cancer cells through the MAPK/ERK signaling pathway. In our study,
methylation genes influenced changes in the extracellular body and
thus affected changes in breast cancer, but specific experiments
are needed to confirm this conjecture. SOD can scavenge superoxide
anion radicals, thereby inhibiting the occurrence of lipid
peroxidation, autoimmune diseases and tumors (23).
In study of Kocot et al (24), it was believed that SOD was closely
related to the metastasis and differentiation of colorectal cancer,
and had certain application value in its treatment. According to
the characteristics of SOD, we believed that its activity was
related to the occurrence of cancer, and it was not comprehensive
in the study on breast cancer. The results of this study again
suggest the importance of SOD, and it is necessary to further
discuss its influencing mechanism. In the PATHWAY analysis, the
most closely related to the differentially methylated genes in
breast cancer tissues was the ‘D-Glutamine and D-glutamate
metabolism’. Glutamine is an important fuel for the immune system
and has important immunomodulatory effects (25), which can promote the division and
differentiation of lymphocytes and macrophages. Exogenous glutamine
can significantly increase the number of lymphocytes, T lymphocytes
and CD4/CD8 ratio in critically ill patients and enhance the body
immunity (26). Many cancers are very
dependent on glutamine (27),
transcriptional programs of which drives its high consumption, so
it is called ‘glutamine metabolism addiction’ (28). However, whether this phenomenon exists
in breast cancer still needs further study.
In the follow-up risk model construction and ROC
curve judgement, the best risk model was obtained, risk score =
QRFP × (−3.657) + S100A16 × (−3.378) + TDRD1 ×
(−4.001) + SMO × (3.548); with the median value-0.936 of
risk score as the cut-off value, the 5-year survival rate in
high-risk group of patients (risk score >0.936) was 72.4% (95%
CI, 62.7–83.6%), and that in low-risk group of patients was 86.6%
(95% CI, 78.6–95.3%) and AUC was 0.791 as judged by ROC curve,
having a good application value. By obtaining the methylation
degree of the patient's QRFP, S100A16, TDRD1 and SMO
in the clinic and it can be calculated whether the patient is in a
high-risk or low-risk state and can predict its five-year survival
rate, as a reminder for targeted treatment.
The main drawback of this study is that it only uses
computer simulation data but fails to verify the results by
specific clinical data and to perform specific cancer cell and
animal model experiments. In addition, there are major differences
in the regions and human races. The advantage behind these
drawbacks lies in the fact that molecular bioinformatics has made
it more efficient to spend time, resources and manpower on the
molecular area. In future studies, we will conduct a more in-depth
study on the differentially methylated genes screened out and the
related GO and PATHWAY.
After long-term calculations and discussions, we
finally concluded that the occurrence and development of breast
cancer were closely correlated with methylation genes such as
NKAPL, QRFP, S100A16, TDRD1 and SMO and related
biological processes and signaling pathways such as ‘extracellular
exosome’, ‘superoxide dismutase activity’ and ‘D-Glutamine and
D-glutamate metabolism’. We will conduct more in-depth studies on
these aspects as conditions permit. Recently, there have been few
studies on the breast cancer-related gene methylation; thus, we
hope that our experimental results can enrich the study in this
area and provide help for clinical diagnosis and treatment in the
future.
Acknowledgements
Not applicable.
Funding
No funding was received.
Availability of data and materials
The datasets used and/or analyzed during the present
study are available from the corresponding author on reasonable
request.
Authors' contributions
LF and FJ drafted the manuscript. LF helped with GO
enrichment analysis. FJ contributed to PATHWAY analysis. Both
authors have read and approved the final manuscript.
Ethics approval and consent to
participate
The study was approved by the Ethics Committee of
The First Affiliated Hospital of China Medical University
(Shenyang, China).
Patient consent for publication
Not applicable.
Competing interests
The authors declare that they have no competing
interests.
References
|
1
|
Inoue M, Nakagomi H, Nakada H, Furuya K,
Ikegame K, Watanabe H, Omata M and Oyama T: Specific sites of
metastases in invasive lobular carcinoma: A retrospective cohort
study of metastatic breast cancer. Breast Cancer. 24:667–672. 2017.
View Article : Google Scholar : PubMed/NCBI
|
|
2
|
Yates LR, Knappskog S, Wedge D, Farmery
JHR, Gonzalez S, Martincorena I, Alexandrov LB, Van Loo P, Haugland
HK, Lilleng PK, et al: Genomic evolution of breast cancer
metastasis and relapse. Cancer Cell. 32:169–184.e7. 2017.
View Article : Google Scholar : PubMed/NCBI
|
|
3
|
DeSantis CE, Ma J, Sauer Goding A, Newman
LA and Jemal A: Breast cancer statistics, 2017, racial disparity in
mortality by state. CA Cancer J Clin. 67:439–448. 2017. View Article : Google Scholar : PubMed/NCBI
|
|
4
|
Xing P, Dong H, Liu Q, Yao F, Xu Y, Chen
B, Zheng X, Wu Y, Jin F and Li J: Impact of persistence on survival
of patients with breast cancer treated with endocrine therapy in
Northeast China: A prospective study. Oncotarget. 8:102499–102510.
2017. View Article : Google Scholar : PubMed/NCBI
|
|
5
|
Zuo TT, Zheng RS, Zeng HM, Zhang SW and
Chen WQ: Female breast cancer incidence and mortality in China,
2013. Thorac Cancer. 8:214–218. 2017. View Article : Google Scholar : PubMed/NCBI
|
|
6
|
McGrath KG: An earlier age of breast
cancer diagnosis related to more frequent use of
antiperspirants/deodorants and underarm shaving. Eur J Cancer Prev.
12:479–485. 2003. View Article : Google Scholar : PubMed/NCBI
|
|
7
|
Widschwendter M, Siegmund KD, Müller HM,
Fiegl H, Marth C, Müller-Holzner E, Jones PA and Laird PW:
Association of breast cancer DNA methylation profiles with hormone
receptor status and response to tamoxifen. Cancer Res.
64:3807–3813. 2004. View Article : Google Scholar : PubMed/NCBI
|
|
8
|
Flanagan JM, Wilson A, Koo C, Masrour N,
Gallon J, Loomis E, Flower K, Wilhelm-Benartzi C, Hergovich A,
Cunnea P, et al: Platinum-based chemotherapy induces methylation
changes in blood DNA associated with overall survival in patients
with ovarian cancer. Clin Cancer Res. 23:2213–2222. 2017.
View Article : Google Scholar : PubMed/NCBI
|
|
9
|
Shu R, He J, Wu C and Gao J: The
association between RARβ and FHIT promoter methylation and the
carcinogenesis of patients with cervical carcinoma: A
meta-analysis. Tumour Biol. 39:10104283177091262017. View Article : Google Scholar : PubMed/NCBI
|
|
10
|
Udali S, Guarini P, Ruzzenente A,
Ferrarini A, Guglielmi A, Lotto V, Tononi P, Pattini P, Moruzzi S,
Campagnaro T, et al: DNA methylation and gene expression profiles
show novel regulatory pathways in hepatocellular carcinoma. Clin
Epigenetics. 7:432015. View Article : Google Scholar : PubMed/NCBI
|
|
11
|
An N, Shi Y, Ye P, Pan Z and Long X:
Association between MGMT promoter methylation and breast cancer: A
meta-analysis. Cell Physiol Biochem. 42:2430–2440. 2017. View Article : Google Scholar : PubMed/NCBI
|
|
12
|
Hao X, Luo H, Krawczyk M, Wei W, Wang W,
Wang J, Flagg K, Hou J, Zhang H, Yi S, et al: DNA methylation
markers for diagnosis and prognosis of common cancers. Proc Natl
Acad Sci USA. 114:7414–7419. 2017. View Article : Google Scholar : PubMed/NCBI
|
|
13
|
Weinstein JN, Collisson EA, Mills GB, Shaw
KR, Ozenberger BA, Ellrott K, Shmulevich I, Sander C and Stuart JM;
Cancer Genome Atlas Research Network, : The Cancer Genome Atlas
Pan-Cancer analysis project. Nat Genet. 45:1113–1120. 2013.
View Article : Google Scholar : PubMed/NCBI
|
|
14
|
Xie ZC, Dang YW, Wei DM, Chen P, Tang RX,
Huang Q, Liu JH and Luo DZ: Clinical significance and prospective
molecular mechanism of MALAT1 in pancreatic cancer exploration: A
comprehensive study based on the GeneChip, GEO, Oncomine, and TCGA
databases. OncoTargets Ther. 10:3991–4005. 2017. View Article : Google Scholar
|
|
15
|
Aho K, Derryberry D and Peterson T: Model
selection for ecologists: The worldviews of AIC and BIC. Ecology.
95:631–636. 2014. View Article : Google Scholar : PubMed/NCBI
|
|
16
|
Stirzaker C, Song JZ, Ng W, Du Q,
Armstrong NJ, Locke WJ, Statham AL, French H, Pidsley R,
Valdes-Mora F, et al: Methyl-CpG-binding protein MBD2 plays a key
role in maintenance and spread of DNA methylation at CpG islands
and shores in cancer. Oncogene. 36:1328–1338. 2017. View Article : Google Scholar : PubMed/NCBI
|
|
17
|
Kakizaki F, Sonoshita M, Miyoshi H,
Itatani Y, Ito S, Kawada K, Sakai Y and Taketo MM: Expression of
metastasis suppressor gene AES driven by a Yin Yang (YY) element in
a CpG island promoter and transcription factor YY2. Cancer Sci.
107:1622–1631. 2016. View Article : Google Scholar : PubMed/NCBI
|
|
18
|
Das S, Moran B and Perry AS: Assessing DNA
methylation in cancer stem cells. Methods Mol Biol. 1692:157–178.
2018. View Article : Google Scholar : PubMed/NCBI
|
|
19
|
Ng PKS, Lau CPY, Lam EKY, Li SSK, Lui VWY,
Yeo W, Ng YK, Lai PBS and Tsui SKW: Hypermethylation of
NF-κB-activating protein-like (NKAPL) promoter in hepatocellular
carcinoma suppresses its expression and predicts a poor prognosis.
Dig Dis Sci. 63:676–686. 2018. View Article : Google Scholar : PubMed/NCBI
|
|
20
|
Roy S, Hochberg FH and Jones PS:
Extracellular vesicles: The growth as diagnostics and therapeutics;
a survey. J Extracell Vesicles. 7:14387202018. View Article : Google Scholar : PubMed/NCBI
|
|
21
|
Urabe F, Kosaka N, Kimura T, Egawa S and
Ochiya T: Extracellular vesicles: Toward a clinical application in
urological cancer treatment. Int J Urol. 25:533–543. 2018.
View Article : Google Scholar : PubMed/NCBI
|
|
22
|
Chen L, Guo P, He Y, Chen Z, Chen L, Luo
Y, Qi L, Liu Y, Wu Q, Cui Y, et al: HCC-derived exosomes elicit HCC
progression and recurrence by epithelial-mesenchymal transition
through MAPK/ERK signalling pathway. Cell Death Dis. 9:5132018.
View Article : Google Scholar : PubMed/NCBI
|
|
23
|
Landeen KC, Spanos WC and Gromer L:
Topical superoxide dismutase in posttreatment fibrosis in patients
with head and neck cancer. Head Neck. May 13–2018.(Epub ahead of
print). doi: 10.1002/hed.25119. View Article : Google Scholar : PubMed/NCBI
|
|
24
|
Kocot J, Kiełczykowska M, Dąbrowski W,
Piłat J, Rudzki S and Musik I: Total antioxidant status value and
superoxide dismutase activity in human colorectal cancer tissue
depending on the stage of the disease: A pilot study. Adv Clin Exp
Med. 22:431–437. 2013.PubMed/NCBI
|
|
25
|
Caris AV, Da Silva ET, Dos Santos SA,
Tufik S and Dos Santos RVT: Effects of carbohydrate and glutamine
supplementation on oral mucosa immunity after strenuous exercise at
high altitude: A double-blind randomized trial. Nutrients.
9:6922017. View Article : Google Scholar
|
|
26
|
Pavlova NN, Hui S, Ghergurovich JM, Fan J,
Intlekofer AM, White RM, Rabinowitz JD, Thompson CB and Zhang J: As
extracellular glutamine levels decline, asparagine becomes an
essential amino acid. Cell Metab. 27:428–438.e5. 2018. View Article : Google Scholar : PubMed/NCBI
|
|
27
|
Aboud Abu O, Habib SL, Trott J, Stewart B,
Liang S, Chaudhari AJ, Sutcliffe J and Weiss RH: Glutamine
addiction in kidney cancer suppresses oxidative stress and can be
exploited for real-time imaging. Cancer Res. 77:6746–6758. 2017.
View Article : Google Scholar : PubMed/NCBI
|
|
28
|
Chiu M, Taurino G, Bianchi MG, Ottaviani
L, Andreoli R, Ciociola T, Lagrasta CAM, Tardito S and Bussolati O:
Oligodendroglioma cells lack glutamine synthetase and are
auxotrophic for glutamine, but do not depend on glutamine
anaplerosis for growth. Int J Mol Sci. 19:192018. View Article : Google Scholar
|