Introduction
Glioblastoma is a disease with a notably poor
prognosis, with a 2-year prognosis is as low as 27% in Europe and
in the United States (1,2). Patients undergo concurrent
chemoradiation following tumor resection, and then chemotherapy,
namely alkylating agent temozolomide, is administered as
monotherapy. Currently, only bevacizumab, an anti-vascular
endothelial growth factor (VEGF) antibody, is available as a
targeted therapy (2–4). Despite the changes in treatment
protocols in the past decade and the extensive research in the
field of glioblastoma treatment options, the majority of patients
succumb 16-24 months after diagnosis (1–4). Specific
clinical factors affect patient outcome, including sex, age,
Karnofsky performance status (KPS) score and tumor size, but these
are poor predictors of prognosis and cannot be used successfully in
everyday clinical practice (5,6). Maximum
safe resection may improve patient survival; however, neither the
minimal cut-off resection volume nor the maximum residual tumor
volume that is associated with survival benefit has been
established (7).
The molecular pathology of glioblastomas has been
the focus of recent research (8–13). Certain
well-established alterations in tumors, including methylation of
the O-6-methylguanine-DNA methyltransferase (MGMT) promoter region,
isocitrate dehydrogenase (IDH) 1/2 or telomerase reverse
transcriptase mutations, epidermal growth factor receptor (EGFR)
amplification or the well-known variant III mutation, are also
associated with prognosis (14). IDH
mutations have a notable impact on patient outcome; however, they
are present in <10% of glioblastomas (15,16). MGMT
promoter methylation status is associated with the effectiveness of
the current standardly used temozolomide chemotherapy, but
alterations in the methylation status during treatment is a known
phenomenon (9). Currently, clinicians
have no means of assessing the prognosis of individual patients,
even though there would be a demand for identifying patient
subgroups with different survival chances. Identifying patients
that require more frequent follow-up examinations to detect tumor
recurrence and determining subgroups that would benefit less from
the aggressive treatment protocol currently used, or that would be
fit for targeted therapy, is currently not possible for the
majority of clinicians.
Peritumoral infiltration is a hallmark of all
diffusely growing glioma types, therefore glioblastomas are also
invasive (10). Tumor masses have no
clear macroscopic border, thus complete surgical resection is not
possible (7). The extracellular
matrix (ECM) is known to be an important determinant of glioma
invasion. Previous studies revealed alterations in the expression
of specific ECM components in glioblastoma compared with that in
non-tumor brain or grade II–III astrocytomas (17–20).
Certain inhibitors targeted against specific ECM components have
been previously tested in clinical trials, but have failed to
provide a breakthrough in glioblastoma treatment thus far (1,4,21–23). A
selected group of ECM-associated molecules, also known as an
invasion panel, was tested in previous studies to understand the
molecular behavior of glioblastoma. The expression pattern of these
molecules, including the invasion spectrum, was demonstrated to be
specific for primary and secondary tumors, as well as the grade of
astrocytomas (24–26). Furthermore, it is considered that the
molecular composition of glioblastoma ECM contributes to
invasiveness; thus, the molecular fingerprint of the tumor is
associated with the efficacy of conventional and targeted
therapies. For example, matrix metallopeptidase 2 (MMP2) and MMP9
molecules are associated with increased invasiveness in
glioblastoma. Integrin-αV (ITGAV) is known to be involved in the
migration of glioma cells and is thus considered to contribute to
invasiveness. Other examples include the hyaluronan receptor
cluster of differentiation (CD)44, or the central nervous
system-specific proteoglycan brevican (BCAN), which have been
associated with increased invasiveness (24,27–29). The
aim of the present study was to analyze the expression pattern of
the invasion panel in glioblastoma samples, and to identify the
association between the invasion spectrum and disease
progression.
Patients and methods
Patients and tumor samples
Samples from 132 adult (58 females and 74 males)
patients who were diagnosed with primary glioblastoma between 01
January 2006 and 31 December 2015 were selected from the Brain
Tumor and Tissue Bank of the Department of Neurosurgery, University
of Debrecen (Debrecen, Hungary). Stratified random sampling was
performed, with overall survival time as stratum. No other
parameter was considered when selecting samples. The tumor samples
were all obtained from brain lobes, and were frozen
intraoperatively on the surface of liquid nitrogen and then stored
at −78°C in a deep freezer until use for mRNA analysis. The rest of
the resected tumor was fixed in 10% paraformaldehyde solution at
25°C for 24 h and then embedded in paraffin. The tissues were
examined, and the diagnosis of glioblastoma was made by an
experienced neuropathologist. Patients had been treated with
radiotherapy plus concomitant and maintenance temozolomide
chemotherapy following maximal safe resection of the tumor. Upon
tumor recurrence, patients received bevacizumab monotherapy until
further progression. Patient age ranged from 20 to 82 years, median
age was 60 years [confidence interval (CI), 58.0–62.0 years], and
the mean postoperative KPS score was 82.5 (CI, 80.4–84.7). Overall
mean survival (OS) time of the patients was 20.8 months (CI,
17.6–24.0 months). Patients were divided into two prognostic groups
based on OS time. Patients whose OS time was <24 months were
considered to be ‘patients with a worse prognosis’ and were placed
in group A (n=74), whereas patients whose OS time was ≥24 months
were considered to be ‘patients with a better prognosis’ and were
placed in group B (n=58). The 24-month threshold was selected as a
previously published analysis of patient data at our institution
(University of Debrecen Clinical Center, Department of
Neurosurgery, Department of Oncology, Debrecen, Hungary) determined
that patients previously treated according to Stupp's protocol (60
Gy irradiation with concurring 75 mg/d/m2 temozolomide,
followed by 150–200 mg/d/m2 temozolomide monotherapy
until progression), then receiving bevacizumab following disease
progression have a mean OS time of 24 months (24). Literature data also supported that an
OS of ≥24 months can be considered to represent better than average
survival (5,30).
Determination of the invasion
spectrum
The invasion spectrum was determined by measuring
the mRNA expression level of the 16 molecules of the invasion
panel. Ki-67 was measured to confirm presence of tumor tissue, GFAP
was measured to confirm glial origin. (Table I). The mRNA expression was determined
through reverse transcriptase-quantitative polymerase chain
reaction (RT-qPCR), as described previously (31,32).
Flash-frozen tissue samples were first pulverized and then
homogenized using TriReagent® (Invitrogen; Thermo Fisher
Scientific, Inc., Waltham, MA, USA) at 25°C until no visible solid
tissue was present in the tubes. Total RNA was isolated from
TriReagent lysates, according to the manufacturer's protocols. A
NanoDrop® ND-1000 Spectrophotometer (NanoDrop
Technologies; Thermo Fisher Scientific, Inc., Wilmington, DE, USA)
was used to measure the quantity and purity of the RNA.
Subsequently, reverse transcription was performed to convert total
RNA to single-stranded complementary DNA (cDNA) with a
High-Capacity cDNA Archive kit with RNasin (Applied Biosystems;
Thermo Fisher Scientific, Inc.). The cDNA was then loaded onto a
microfluidic card (cDNA from 100 ng of total RNA/port). An Applied
Biosystems 7900HT real-time PCR system with Micro Fluidic Card
upgrade (Applied Biosystems; Thermo Fisher Scientific, Inc.) was
used to perform TaqMan® low-density array experiments.
The thermocycling conditions were 2 min at 50°C, 10 min at 94.5°C,
followed by 40 cycles of denaturation at 97°C for 30 sec and
annealing and extension at 60°C for 1 min. The Micro Fluidic Cards
were analyzed with SDS 2.1 software (Applied Biosystems; Thermo
Fisher Scientific, Inc.) as relative quantification studies, and
the cycle quantification (Cq) values were exported for further
analysis. β2 microglobulin and GAPDH housekeeping genes exhibited
the least variation among the samples, and β2 microglobulin was
used as reference gene to calculate the ∆Cq value for each gene.
Expression values were calculated using the comparative Cq method,
as described previously (33).
 | Table I.List of the analyzed ECM
components. |
Table I.
List of the analyzed ECM
components.
| Symbol | Assay ID |
|---|
| BCAN |
BCAN-Hs00222607_m1 |
| CD44 |
CD44-Hs01075861_m1 |
| CSPG5 |
CSPG5-Hs00198108_m1 |
| EGFR |
EGFR-Hs01076090_m1 |
| FLT4/VEGF3 |
FLT4-Hs00176607_m1 |
| HMMR |
HMMR-Hs00234864_m1 |
| IDH1 |
IDH1-Hs01855675_s1 |
| ITGAV |
ITGAV-Hs00233808_m1 |
| ITGB1 |
ITGB1-Hs00559595_m1 |
| ITGB5 |
ITGB5-Hs00174435_m1 |
| MDM2 |
MDM2-Hs01066930_m1 |
| MMP-2 |
MMP2-Hs01548727_m1 |
| NCAN |
NCAN-Hs00189270_m1 |
| PDGFA |
PDGFA-Hs00964426_m1 |
| TNC |
TNC-Hs01115665_m1 |
| VCAN |
VCAN-Hs00171642_m1 |
| GFAP |
GFAP-Hs00909233_m1 |
| MKI67 |
MKI67-Hs01032443_m1 |
| B2M |
B2M-Hs00187842_m1 |
| GAPDH |
GAPDH-Hs99999905_m1 |
Immunohistochemistry
Protein expression was measured by
immunohistochemical staining of formalin-fixed paraffin embedded
tissue slides. For the slides, the corresponding tissue blocks were
collected from the Department of Neuropathology, Institute of
Pathology, University of Debrecen. Sections (4 µm) were cut with a
microtome then prepared for staining. Sections were first
deparaffinized using xylene, then rehydrated in a graded series
(100%, then 95%) of ethanol at 25°C. Epitopes were retrieved by
heat-induction in citrate buffer (pH 6.0, Antigen Decloaker 10X,
Biocare Medical, LLC, Pacheco, CA, USA). Endogenous peroxidase
activity was blocked with 0.3% methanolic hydrogen-peroxide at 25°C
for 10 min prior to the slides being incubated overnight with the
primary antibodies in concentrations according to manufacturer's
protocols. (Table II) Visualization
was conducted with a MACH 4 Universal AP Polymer kit (Biocare
Medical, LLC, Paheco, CA, USA) according to manufacturer's protocol
and 3,3′-diaminobenzidine with hematoxylin counterstaining at 25°C
for 10 min and 30 secs, respectively. Positive and negative control
slides were also stained using the same procedures as the other
slides (Table II). Expression of the
proteins was evaluated by three independent observers in 10 random
high-power fields (×100 magnification, Eclipse 80i microscope,
Nikon, Minato, Tokyo, Japan) in each slide in a semi-quantitative
manner, considering the percentage of staining cells and/or
extracellular space, as well as the intensity of staining. The
percentage of the staining was considered as follows: 0, negative
or <10% staining; 1, 10–25% staining; 2, 26–50% staining; 3,
51–75% staining; and 4, >75% staining, as described by
Bondarendko et al (34).
Intensity was graded from 0–3 (negative, -; weak positivity, +;
moderate positivity, ++; and strong positivity, +++, respectively).
Combined scores were calculated for each slide by multiplying the
scores, and a mean score for each sample was then determined.
| Table II.Primary antibodies used for
immunohistochemical staining. |
Table II.
Primary antibodies used for
immunohistochemical staining.
| Protein | Antibody code | Manufacturer | Dilution | Positive
control |
|---|
| Brevican | NBP1-89992PEP | Novus Biologicals
(Littleton, CO, USA) | 1:200 | Rat brain |
| CD 44 | AB16728 | Abcam (Cambridge,
United Kingdom) | 1:500 | Human tonsil |
| CSPG-5 (neuroglyan
C) | ORB157961 | Biorbyt (Cambridge,
United Kingdom) | 1:250 | Rat brain |
| Flt-4/VEGFR-3 | SC-514825 | Santa Cruz
Biotechnology (Dallas, TX, USA) | 1:250 | Human kiney |
| HMMR (CD168,
RHAMM) | AB110075 | Abcam (Cambridge,
United Kingdom) | 1:200 | Human tonsil |
| Integrin alpha V
chain | BS-2203R | Bioss Antibodies
(Woburn, MS, USA) | 1:250 | Human kidney |
| Integrin beta 1
chain | RD-MAB1778-SP | RnD Systems
(Minneapolis MN, USA | 1:250 | Human tonsil |
| Integrin beta 5
chain | NBP1-88117 | Novus Biologicals
(Littleton, CO, USA) | 1:250 | Human tonsil |
| MDM2 | AB16895 | Abcam(Cambridge,
United Kingdom) | 1:400 | Rat brain |
| MMP-2 | TA806846 | OriGene
Technologies (Rockville, MD, USA) | 1:200 | Human tonsil |
| Versican | AB177480 | Abcam (Cambridge,
United Kingdom) | 1:150 | Rat brain |
Statistical analysis
Independent samples Student's paired t-test and
Mann-Whitney U tests were used for age, tumor size, KPS values, RNS
and protein expression, while χ2 test was used for sex,
tumor location and percentage of repeat surgery patients.
Progression-free survival (PFS) and OS times were compared using
Kaplan-Meier survival analysis with log-rank (Mantel-Cox) test. PFS
and OS times were calculated from the time of diagnosis. For an
overall analysis of the expressional pattern, the statistical
classifier nearest neighbor search was used on mRNA expression data
(35,36). The nearest neighbor search analyzed
all attributes (i.e. the level of expression of a given ECM
molecule) at the same time and compared these attributes to those
of other samples, finding similar patterns of mRNA expression among
the samples. The value of every measured ECM component were used to
identify samples that have the most similar values. Samples with
similar patterns of expression were then put in the same group.
P<0.05 level of significance was considered as statistically
significant. Calculations were performed using statistical program
GraphPad Prism v6.01 (GraphPad Software Inc., La Jolla, CA, USA).
Nearest neighbor search was performed using statistical program
Weka v3.6 (University of Waikato, Hamilton, New Zealand).
Results
Patient data
The clinical characteristics of the patients are
summarized in Table III. The median
ages of the patients was 61.0 years (CI, 57.97–63.28 years) in
group A and 58.5 years (CI, 55.53–61.47 years) in group B.
Statistical analysis revealed a significant difference between the
two groups (P=0.0293). Patients had an improved preoperative and
postoperative KPS score in group B compared with patients in group
A, but the KPS scores did not differ significantly. The other
examined clinical characteristics of the tumors were not
statistically different in the two groups: the tumors were
determined to be similar in size in the two groups and there was no
statistical difference in the involvement of the dominant side of
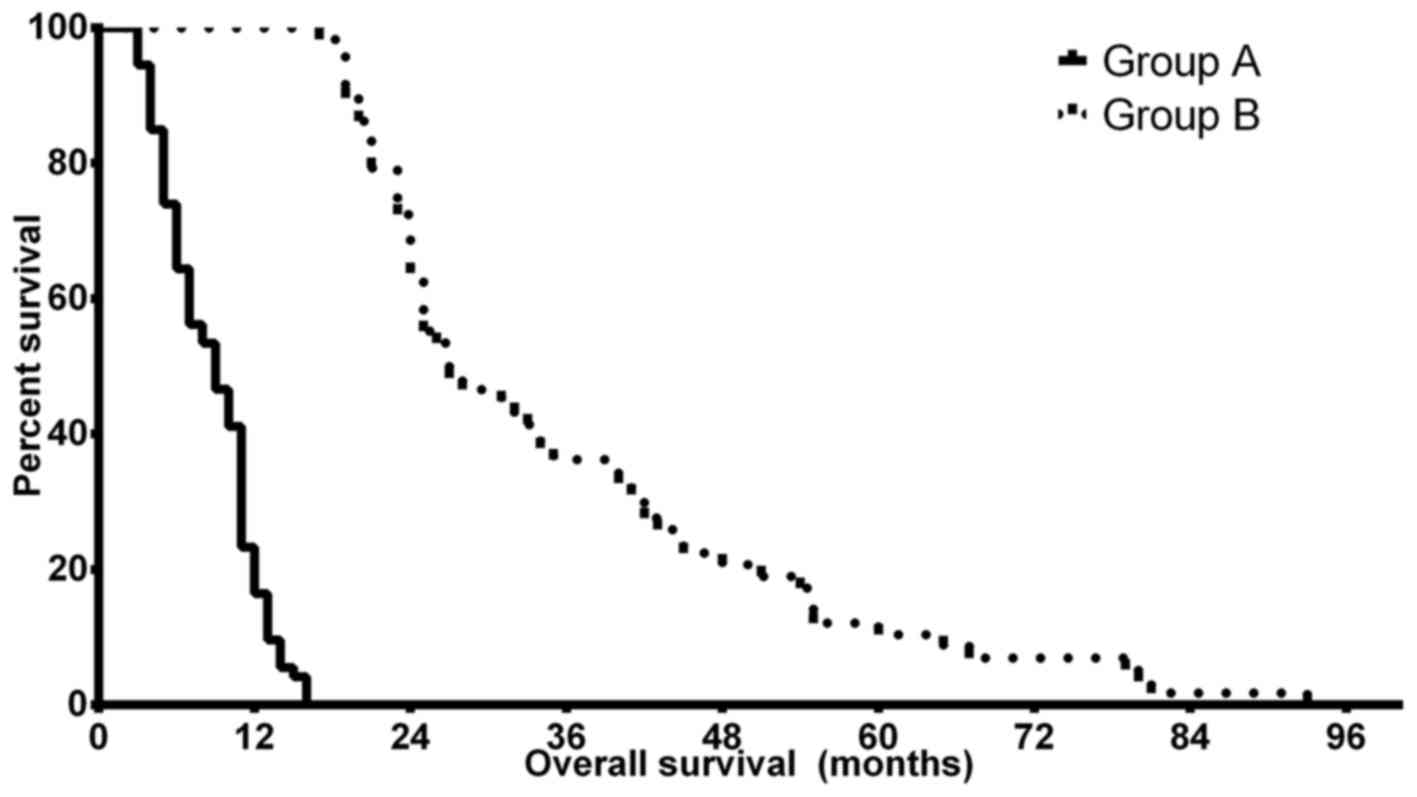
the brain nor the lobular localization of the tumor. Kaplan-Meier
analyses confirmed the predicted differences in PFS and OS of the
patients in groups A and B. The median OS time was 9.0 months (CI,
8.14–9.86 months) in group A, while patients in group B had a
significantly improved prognosis with a median OS time of 27.0
months (CI, 22.17–31.83 months) (P<0.0001). The median PFS
differences were less notable but remained statistically
significant, with 5.5 months (CI, 3.79–7.21 months) in group A and
8.5 months (4.36–12.64 months) in group B (P=0.024). Fig. 1 depicts the OS differences between
groups A and B. The two groups therefore had no major differences
in the clinical characteristics of the patients apart from patient
age and the survival times, which were selection criteria.
| Table III.Summary of the clinical
characteristics of patients in groups A and B. |
Table III.
Summary of the clinical
characteristics of patients in groups A and B.
| Group | Median age, years
(CI) | Median preoperative
KPS score (CI) | Median
postoperative KPS (CI) | Median PFS, months
(CI) | Median OS, months
(CI) | Mean tumor size, mm
(CI) | Proportion of tumor
in dominant side, % | Lobular
localization, n |
|---|
| Group A | 61
(57.97–63.28) | 76.16
(72.59–79.74) | 80.68
(77.82–83.53) | 5.5
(3.79–7.21) | 9.0
(8.14–9.86) | 45.7
(41.97–49.43) | 48.6 | Frontal, 22;
temporal, 24; parietal, 3; occipital, 3; multilobular, 22 |
| Group B | 58.5
(53.27–59.20) | 81.05
(76.63–85.47) | 84.74
(81.60–87.87) | 8.5
(4.36–12.64) | 27.0
(22.17–31.83) | 49.16
(44.46–53.86) | 49.1 | Frontal, 18;
temporal, 12; parietal, 4; occipital, 4; multilobular, 20 |
| P-value | 0.0293 | 0.0883 | 0.0579 | 0.007 | <0.0001 | 0.2490 | 0.9500 | 0.6701 |
mRNA expression of the tumor
samples
Ki-67 mRNA was measured in each sample to confirm
that the flash-frozen samples contained sufficient tumor tissue.
All the samples were determined to express sufficient marker of
proliferation Ki-67 (MKI67) and the two groups did not demonstrate
any significant difference in Ki-67 expression (P=0.8567). GFAP
expression was also analyzed to confirm the presence of glial
tumors.
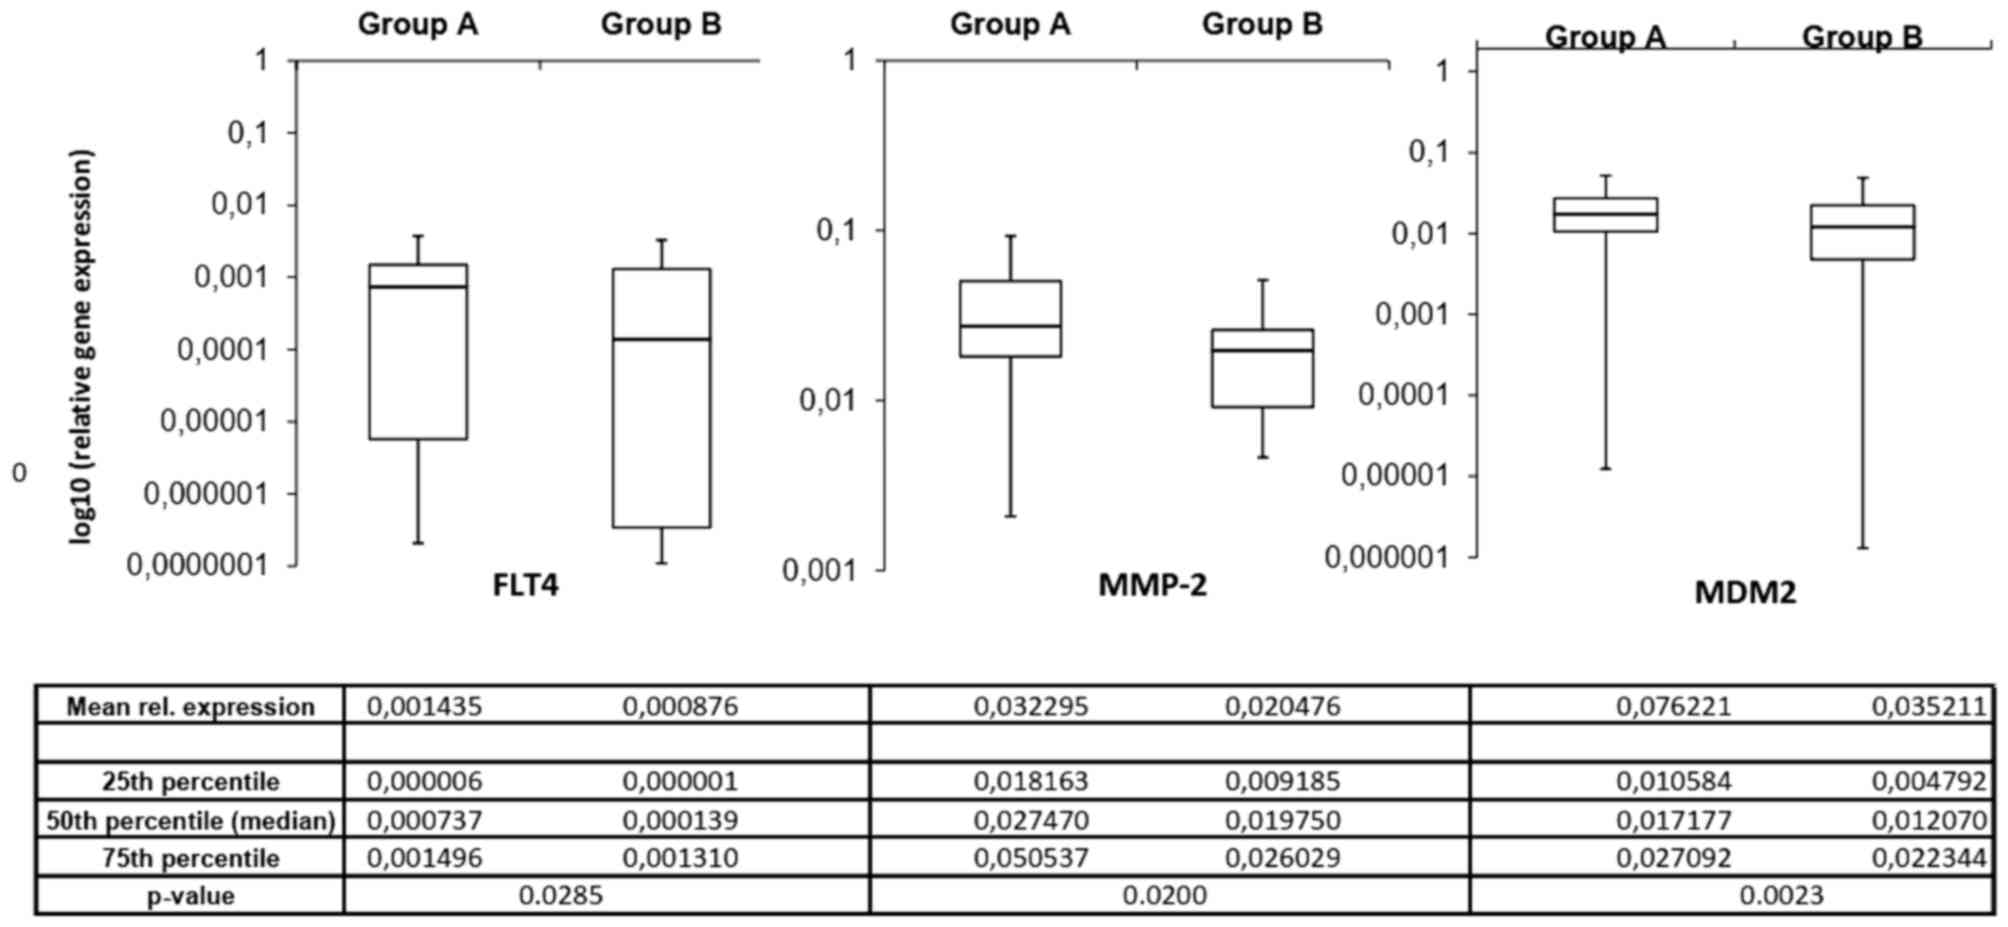
The mRNA expression of the invasion-associated ECM
components in the two prognostic groups demonstrated notable
differences. Fig. 2 depicts the mean
mRNA expression values of the analyzed molecules. Using the
independent samples Student's t-test, 3 invasion-associated
molecules demonstrated significant differences between the two
prognostic groups. Fms-related tyrosine kinase 4 (FLT4), murine
double minute 2 (MDM2) and MMP2 expression levels were
significantly increased in patients in group A compared with those
in group B (P=0.0285, P=0.0200 and P=0.0023, respectively).
Fig. 3 depicts the expression of
these 3 ECM components in the different prognostic groups.
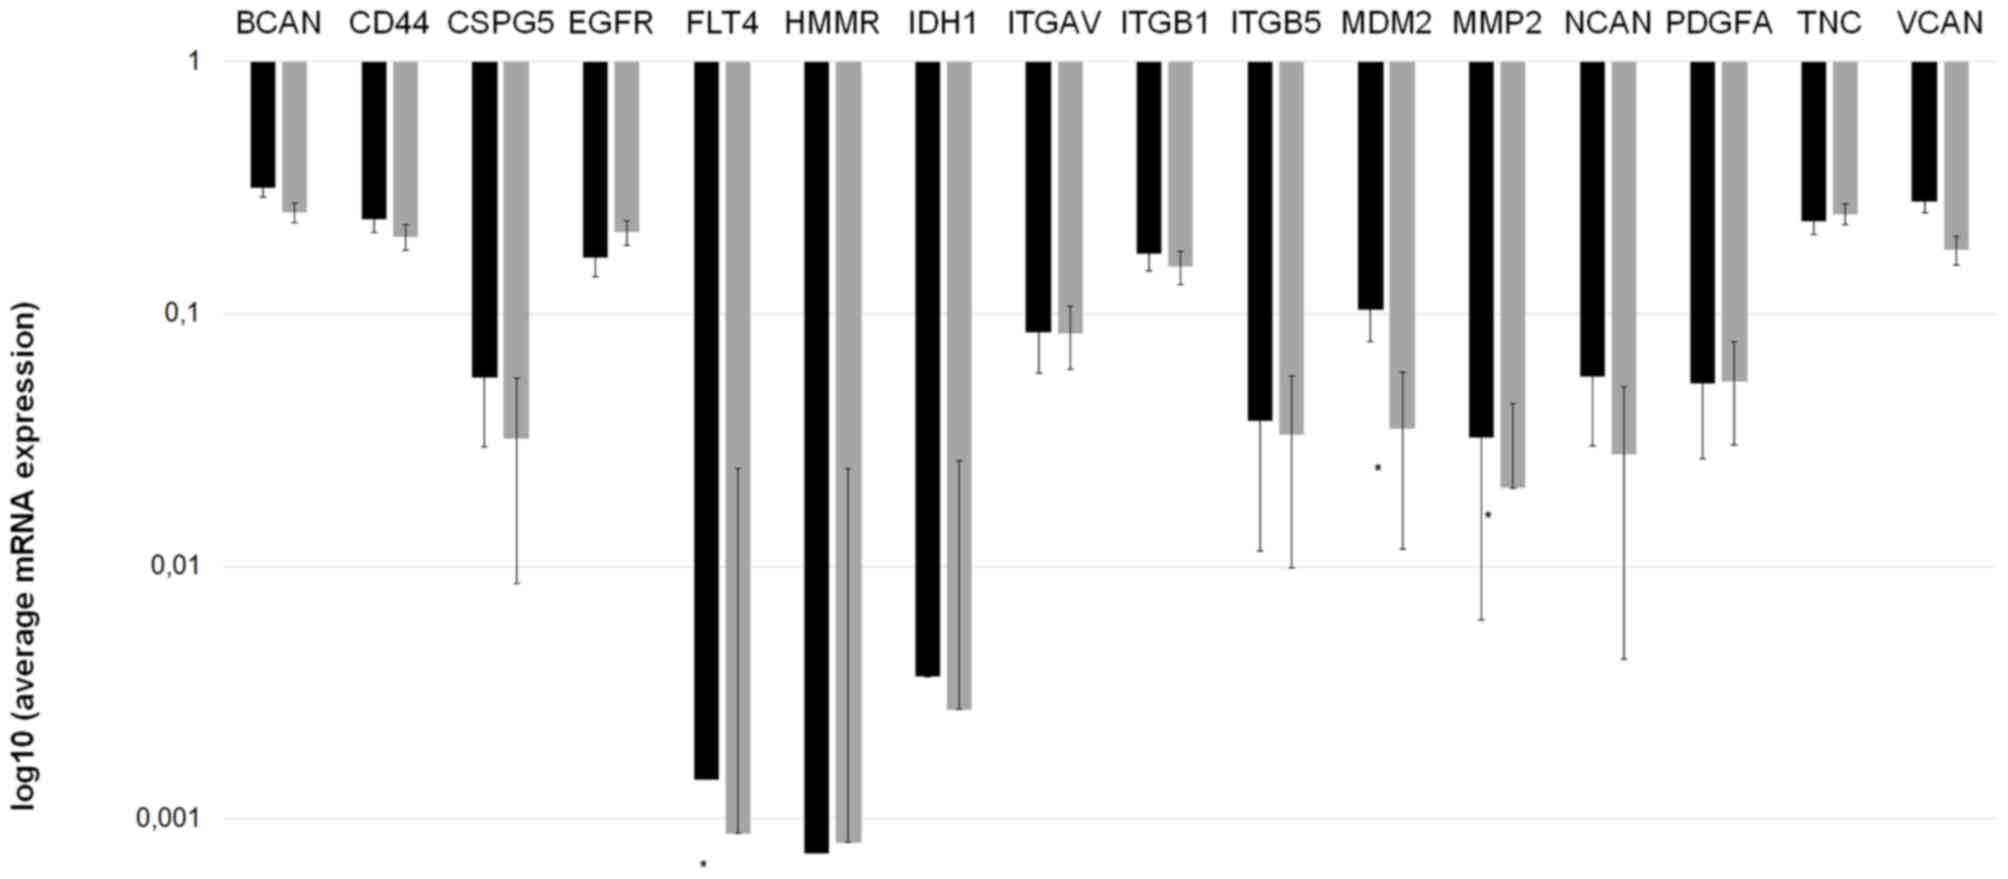 | Figure 2.Invasion spectrum (the mRNA
expression pattern of invasion-associated extracellular matrix
components) differs in patients with ‘worse’ and ‘better’
prognoses. mRNA expression measurements were performed twice for
each gene to confirm the data. A longer bar on the logarithmic
scale indicates reduced expression. *P<0.05 vs. group A
(Mann-Whitney U test). Group A, OS <24 months; group B, OS
>24 months; BCAN, brevican; CD44, cluster of differentiation 44;
CSPG5, chondroitin sulfate proteoglycan 5; EGFR, epidermal growth
factor receptor; FLT4, Fms-related tyrosine kinase 4; HMMR,
hyaluronan-mediated motility receptor; IDH1, isocitrate
dehydrogenase 1; ITGAV, integrin-αV; MDM2, murine double minute 2;
MMP-2, matrix metallopeptidase 2; NCAN, neurocan; PDGFA,
platelet-derived growth factor α; TNC, tenascin C; VCAN, versican;
OS, overall survival. |
Immunohistochemistry confirms
different ECM composition in tumors with different prognoses
Immunohistochemistry sections were analyzed and
differences in protein expression were identified in the different
glioblastoma prognostic groups. Out of the analyzed
invasion-associated proteins, BCAN (P=0.0002), CD44 (P=0.0200),
hyaline-mediated motility receptor (P=0.0020), ITGAV and -β1
(P=0.0200 and 0.0400, respectively), and MDM2 (P=0.0240) were
determined to be significantly different between the two groups.
The mRNA and immunohistochemical differences were concordant in
direction except for ITGβ1 molecules. Concordance of protein
expression underlines the relevance of the mRNA expression data.
Table IV contains the
immunohistochemistry scores and P-values of the significant ECM
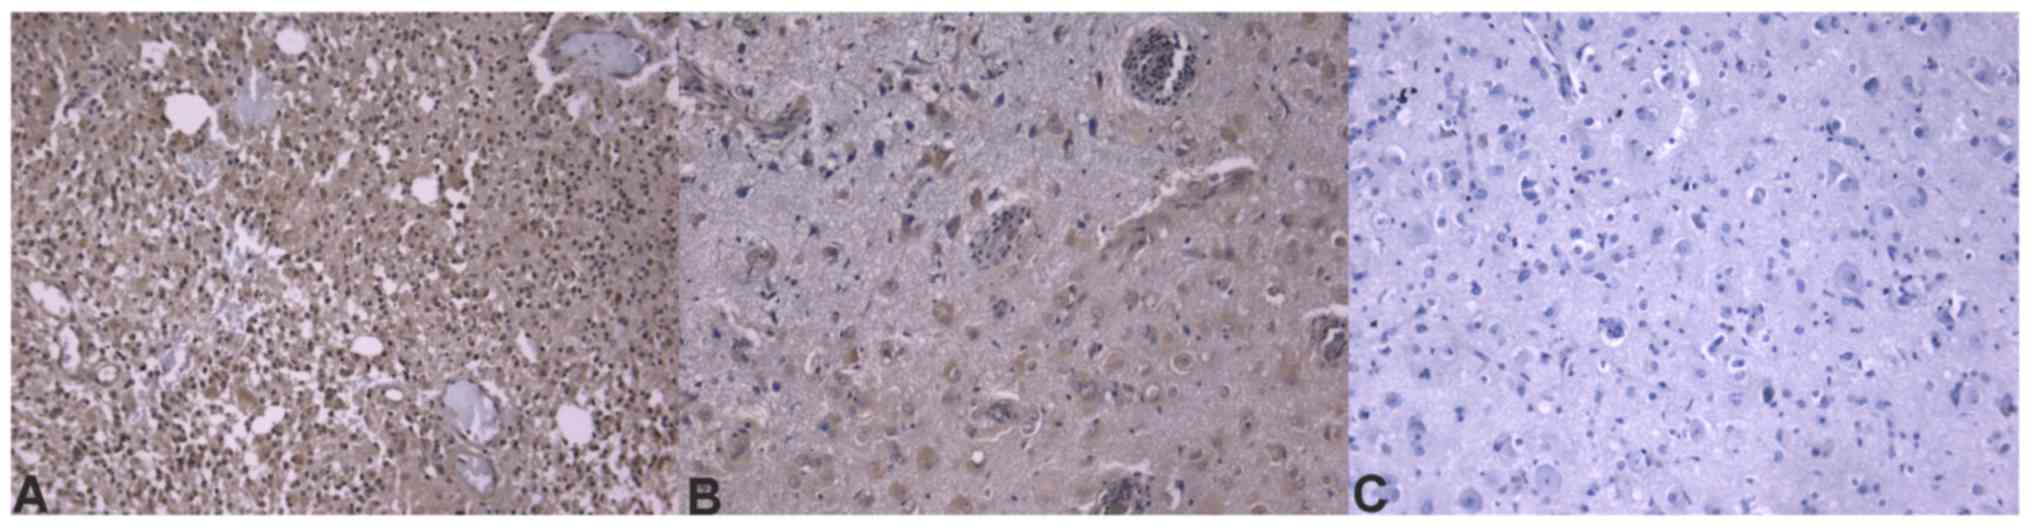
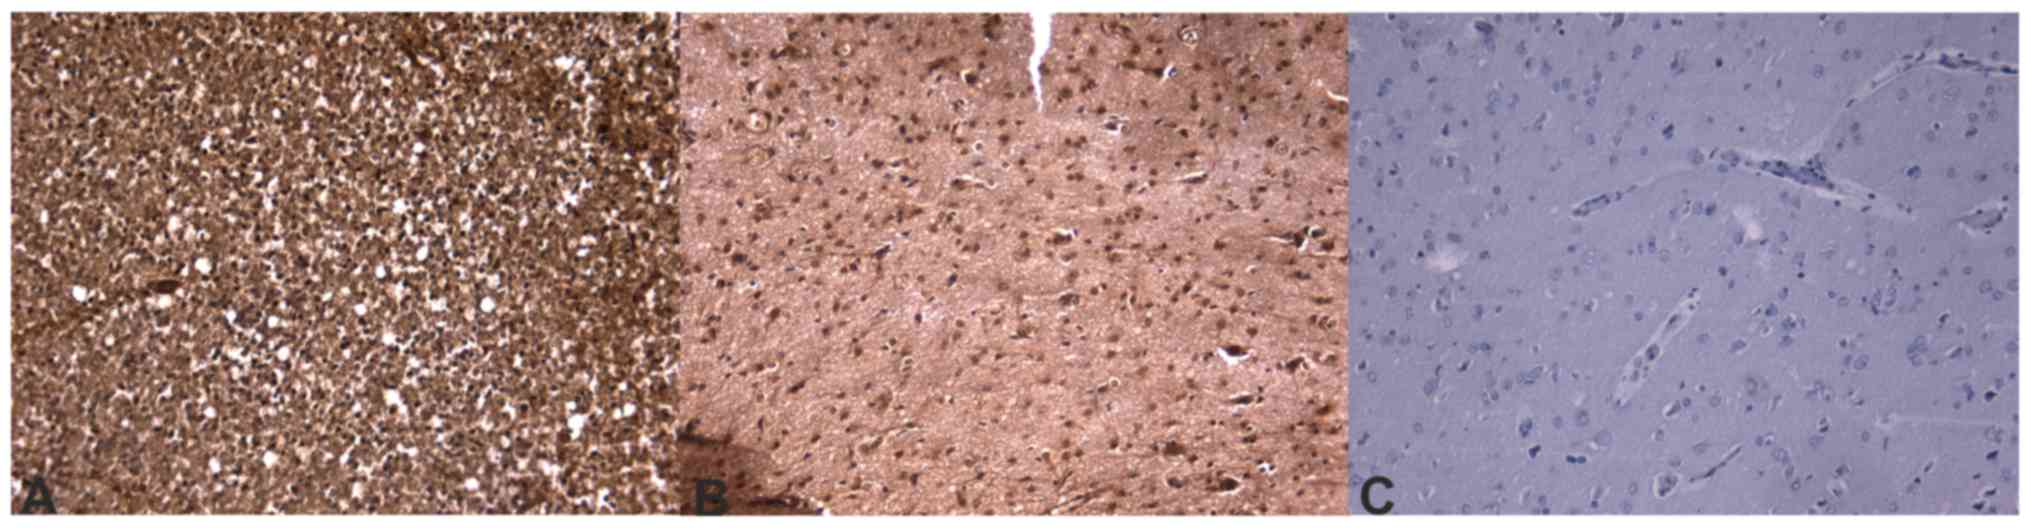
molecules. Immunohistochemical slides of the ECM components that
were significant at the mRNA level are presented in Figs. 4–6.
| Table IV.Mean immunohistochemistry scores of
the ECM components that were determined to be significantly
different in the two prognostic groups. |
Table IV.
Mean immunohistochemistry scores of
the ECM components that were determined to be significantly
different in the two prognostic groups.
|
|
|
| Mean
immunohistochemistry scores |
|---|
|
|
|
|
|
|---|
| ECM component | P-value | Concordance with
mRNA results | Group A | Group B |
|---|
| BCAN | 0.0002 | Yes | 6.58 | 3.40 |
| CD44 | 0.0200 | Yes | 4.35 | 3.69 |
| HMMR | 0.0020 | Yes | 5.71 | 3.58 |
| ITGAV | 0.0200 | Yes | 4.35 | 3.69 |
| ITGβ1 | 0.0400 | No | 2.69 | 3.86 |
| MDM2 | 0.0240 | Yes | 4.41 | 2.44 |
Statistical classifier selects
molecules that differentiate tumors with worse and better
prognoses
Subsequent to analyzing mRNA and protein expression
for each ECM component individually, a nearest neighbor search, a
statistical classifier to perform joint, overall analysis of the
invasion panel, was used. The following molecules were used by the
statistical classifier algorithm as major influencers: CD44, EGFR,
FLT4/VEGF-3, IDH1, MMP2, platelet-derived growth factor α, tenascin
C and versican.
The expression of these ECM components may be a key
component in the separation of tumors with different prognoses. The
classifier identified the prognosis, including whether the patient
lived ≥24 months, in 94/132 patients correctly. Sensitivity and
positive predictive values were increased in tumors with a worse
prognosis. The method's receiver operating curve (ROC) area, which
is the curve of sensitivity dotted against false positive rate, is
0.706. As the value rages from 0 to 1, a value of 0.706 suggests
good accuracy. The Matthew's correlation coefficient is 0.414. MCC
measures the quality of binary classification and its values range
from −1 to +1, where 0 is no better than random classification and
+1 is perfect classification, thus a coefficient of 0.414 indicates
fine selection between the groups. Further details of the method
are within Table V.
| Table V.Characteristics of the binary
classification that identified the prognostic group of each sample
based upon the mRNA expression pattern of the extracellular matrix
of the samples. |
Table V.
Characteristics of the binary
classification that identified the prognostic group of each sample
based upon the mRNA expression pattern of the extracellular matrix
of the samples.
| Class | Sensitivity | FP rate | Positive prediction
value | F-1 score | MCC | ROC area |
|---|
| Group A | 0.757 | 0.345 | 0.737 | 0.747 | 0.414 | 0.706 |
| Group B | 0.655 | 0.243 | 0.679 | 0.667 | 0.4144 | 0.706 |
| Weighted mean | 0.712 | 0.300 | 0.711 | 0.712 | 0.414 | 0.706 |
Discussion
Glioblastoma, the most common glioma, has a poor
prognosis (1,2). Despite aggressive treatment protocols,
patients survive for only 16–24 months following diagnosis
(37,38). Certain factors, like age or maximal
safe tumor resection, are known to have a degree of association
with patient survival; however, clinicians cannot assess individual
prognosis (5–7). Glioma cells invade the neighboring
tissue in a complex process actively influenced by ECM components
(28,39). Previous studies determined that
certain ECM molecules were expressed at an altered, frequently
increased level in gliomas compared with that in non-tumor brain
samples, and numerous studies determined that certain drugs
designed to target these molecules can inhibit tumor invasion in
vitro in certain subgroups of patients with glioblastoma
(3,24,40–45).
Bevacizumab is highly effective in one subgroup of patients, while
other patients have reduced or no benefit from the targeted therapy
(3,46,47).
Furthermore, bevacizumab has been determined to exert its effect
primarily in increasing PFS time, and it may not affect OS time
significantly (48,49).
The present study aimed to analyze the ECM
composition of glioblastoma samples in order to identify the
expression pattern of patients with glioblastoma with ‘worse’ or
‘better’ survival. The two prognostic groups demonstrated
differences in patient age at diagnosis, which is in accordance
with literature data (5,6). No further differences were determined in
terms of KPS score, tumor size or tumor location; therefore, it is
possible that differences in survival are not explained by
differences in clinical factors, as all patients had undergone the
identical treatment policy; however, the survival times were
notably different. Molecular methods were used to investigate
differences in the molecular composition of the tumors with
different prognoses.
It was determined that ECM components demonstrate
differences in expression at transcriptional or translational
levels. The mRNA expression of FLT4, MDM2 and MMP2 genes was
determined to be significantly different between the two groups.
Additionally, MDM2 expression was determined to be significantly
different at the protein level, while FLT4 and MMP-2 were selected
by the statistical classifier as key molecules in the separation of
different prognostic groups. Figs.
4–6 depict immunhistochemical
slides stained with antibodies agains these ECM components. All 3
molecules exhibited increased expression in tumor samples from
patients whose survival time was below average. These results
supported previous data, further confirming their role in glioma
invasion (50,51). FLT4 is a receptor for VEGF-C and D,
and it is not normally expressed in human brain endothelium;
however, it has been previously determined to be overexpressed in
the endothelium of blood vessels in glioblastoma (51). This expression may be responsible for
the escape phenomenon of bevacizumab-treated patients, which is a
secondary neovascularization despite anti-angiogenic therapy with
bevacizumab, which primarily inhibits VEGF1 and VEGF2, and
partially inhibits VEGF3 (50). MDM2
is an inhibitor of the p53 protein. An increased amount of MDM2 can
explain a second way method to bypass the gatekeeper function of
p53 in tumor protein 53 wild-type glioblastomas (52,53).
Furthermore, MDM2 has p53-independent roles. MDM2 may induce
genomic instability through inhibiting DNA damage repair and
suppressing cell cycle arrest (52).
MDM2 has also been demonstrated to facilitate
epithelial-mesenchymal transition; therefore, it enhances motility
and tumor invasiveness (53). MMP2
has a well-described role in the dynamic alteration of tumor ECM,
as well as other oncogenic functions that assist glioma cells with
invading the brain parenchyma (54–57). All
these molecules could serve as a target for future anti-invasive
therapies in glioblastoma treatment.
In the present study, the statistical classifier
nearest neighbor search was able to identify the prognostic group
for each sample based upon the invasion spectrum, including the
expressional pattern of the invasion-associated molecules. The
method had high accuracy in determining whether the patient
belonged to group A or B. This is important from a clinician's
point of view, as it is one of the first methods that could provide
information on individual patient survival. The increased positive
predictive value for patients who have a worse prognosis is
beneficial in identifying those patients that require extra
attention and care, and whose treatment protocol should be
intensified and/or complemented with targeted therapy as first-line
treatment. Additional information on the molecular composition of
tumor samples is provided; thus, selecting the correct
anti-invasive therapeutic agent in the future would be possible.
Therefore, the invasion spectrum can be considered as a prognostic
factor with a future predictive role in patients with
glioblastoma.
Acknowledgements
Not applicable.
Funding
The present study was supported by the Hungarian
Brain Research Program (grant no 2017-1.2.1-NKP-2017-00002) and the
ÚNKP-17-3-I and ÚNKP-17-2-I New National Excellence Program of the
Ministry of Human Capacities.
Availability of data and materials
The datasets used and/or analyzed during the present
study are available from the corresponding author on reasonable
request.
Authors' contributions
JV took part in the design of the study, carried out
IHC staining and evaluation, took part in the statistical analysis
and drafted the manuscript. LSz carried out IHC staining and
evaluation, prepared patient data for analysis, took part in the
statistical analysis and contributed to the drafting of the
manuscript, TH analysed tissue samples and validated IHC slides,
MKC took part in the IHC slide evaluation, GZ performed qRT-PCR, LS
performed nearest neighbor search and validated other statistical
analyses performed by JV and LSz. JT was responsible for oncologic
treatments and patient documentation, contributed to the
interpretation of results from patient data analyses, LB and JRP
collected and prepared tumor samples and collected patient data, KA
took part in the design of the study, revised the manuscript for
intellectual content and gave final approval of the manuscript.
Ethics approval and consent to
participate
The study was approved by the Scientific and
Research Ethics Committee of the Medical Research Council (ref. no.
51450-2/2015/EKU).
Patient consent for publication
All patients had signed an informed consent form for
academic and research use of the resected tissues, including
publication of data and findings.
Competing interests
The authors declare that they have no competing
interests.
References
|
1
|
Grossman SA, Ye X, Piantadosi S, Desideri
S, Nabors LB, Rosenfeld M and Fisher J; NABTT CNS Consortium, .
Survival of patients with newly diagnosed glioblastoma treated with
radiation and temozolomide in research studies in the United
States. Clin Cancer Res. 16:2443–2449. 2010. View Article : Google Scholar : PubMed/NCBI
|
|
2
|
Back MF, Ang ELL, Ng WH, See SJ, Lim CCT,
Chan SP and Yeo TT: Improved median survival for glioblastoma
multiforme following introduction of adjuvant temozolomide
chemotherapy. Ann Acad Med Singapore. 36:338–342. 2007.PubMed/NCBI
|
|
3
|
Chamberlain MC: Bevacizumab for the
treatment of recurrent glioblastoma. Clin Med Insights Oncol.
5:117–129. 2011. View Article : Google Scholar : PubMed/NCBI
|
|
4
|
Stupp R, Mason WP, van den Bent MJ, Weller
M, Fisher B, Taphoorn MJ, Belanger K, Brandes AA, Marosi C, Bogdahn
U, et al: Radiotherapy plus concomitant and adjuvant temozolomide
for glioblastoma. N Engl J Med. 352:987–996. 2005. View Article : Google Scholar : PubMed/NCBI
|
|
5
|
Krex D, Klink B, Hartmann C, von Deimling
A, Pietsch T, Simon M, Sabel M, Steinbach JP, Heese O, Reifenberger
G, et al: Long-term survival with gliossblastoma multiforme. Brain.
130:2596–606. 2007. View Article : Google Scholar : PubMed/NCBI
|
|
6
|
Donato V, Papaleo A, Castrichino A,
Banelli E, Giangaspero F, Salvati M and Delfini R: Prognostic
implication of clinical and pathologic features in patients with
glioblastoma multiforme treated with concomitant radiation plus
temozolomide. Tumori. 93:248–256. 2007. View Article : Google Scholar : PubMed/NCBI
|
|
7
|
Sanai N and Berger MS: Glioma extent of
resection and its impact on patient outcome. Neurosurgery.
62:753–764. 2008. View Article : Google Scholar : PubMed/NCBI
|
|
8
|
Griffin CA, Burger P, Morsberger L,
Yonescu R, Swierczynski S, Weingart JD and Murphy KM:
Identification of der(1;19)(q10;p10) in five oligodendrogliomas
suggests mechanism of concurrent 1p and 19q loss. J Neuropathol Exp
Neurol. 65:988–994. 2006. View Article : Google Scholar : PubMed/NCBI
|
|
9
|
Reifenberger G, Hentschel B, Felsberg J,
Schackert G, Simon M, Schnell O, Westphal M, Wick W, Pietsch T,
Loeffler M, et al: Predictive impact of MGMT promoter methylation
in glioblastoma of the elderly. Int J Cancer. 131:1342–1350. 2012.
View Article : Google Scholar : PubMed/NCBI
|
|
10
|
Louis DN, Perry A, Reifenberger G, von
Deimling A, Figarella-Branger D, Cavenee WK, Ohgaki H, Wiestler OD,
Kleihues P and Ellison DW: The 2016 world health organization
classification of tumors of the central nervous system: A summary.
Acta Neuropathol. 113:803–820. 2016. View Article : Google Scholar
|
|
11
|
Bleeker FE, Molenaar RJ and Leenstra S:
Recent advances in the molecular understanding of glioblastoma. J
Neurooncol. 108:11–27. 2012. View Article : Google Scholar : PubMed/NCBI
|
|
12
|
Schwartzbaum JA, Fisher JL, Aldape KD and
Wrensch M: Epidemiology and molecular pathology of glioma. Nat Clin
Pract Neurol. 2:494–503. 2006. View Article : Google Scholar : PubMed/NCBI
|
|
13
|
Demuth T and Berens ME: Molecular
mechanisms of glioma cell migration and invasion. J Neurooncol.
70:217–228. 2004. View Article : Google Scholar : PubMed/NCBI
|
|
14
|
Milinkovic V, Bankovic J, Rakic M,
Stankovic T, Skender-Gazibara M, Ruzdijic S and Tanic N:
Identification of novel genetic alterations in samples of malignant
glioma patients. PLoS One. 8:e821082013. View Article : Google Scholar : PubMed/NCBI
|
|
15
|
Cohen AL, Holmen SL and Colman H: IDH1 and
IDH2 mutations in gliomas. Curr Neurol Neurosci Rep. 13:3452013.
View Article : Google Scholar : PubMed/NCBI
|
|
16
|
Hartmann C, Hentschel B, Wick W, Capper D,
Felsberg J, Simon M, Westphal M, Schackert G, Meyermann R and
Pietsch T: Patients with IDH1 wild type anaplastic astrocytomas
exhibit worse prognosis than IDH1-mutated glioblastomas, and IDH1
mutation status accounts for the unfavorable prognostic effect of
higher age: Implications for classification of gliomas. Acta
Neuropathol. 120:707–718. 2010. View Article : Google Scholar : PubMed/NCBI
|
|
17
|
Tysnes BB and Mahesparan R: Biological
mechanisms of glioma invasion and potential therapeutic targets. J
Neurooncol. 53:129–147. 2001. View Article : Google Scholar : PubMed/NCBI
|
|
18
|
Gladson CL: The extracellular matrix of
gliomas: Modulation of cell function. J Neuropathol Exp Neurol.
58:1029–1040. 1999. View Article : Google Scholar : PubMed/NCBI
|
|
19
|
Reinhard J, Brösicke N, Theocharidis U and
Faissner A: The extracellular matrix niche microenvironment of
neural and cancer stem cells in the brain. Int J Biochem Cell Biol.
81:174–183. 2016. View Article : Google Scholar : PubMed/NCBI
|
|
20
|
Goldbrunner RH, Bernstein JJ and Tonn JC:
Cell-extracellular matrix interaction in glioma invasion. Acta
Neurochir (Wien). 141:295–305. 1999. View Article : Google Scholar : PubMed/NCBI
|
|
21
|
Kreisl TN, McNeill KA, Sul J, Iwamoto FM,
Shih J and Fine HA: A phase I/II trial of vandetanib for patients
with recurrent malignant glioma. Neuro Oncol. 14:1519–1526. 2012.
View Article : Google Scholar : PubMed/NCBI
|
|
22
|
Razis E, Selviaridis P, Labropoulos S,
Norris JL, Zhu MJ, Song DD, Kalebic T, Torrens M,
Kalogera-Fountzila A, Karkavelas G, et al: Phase II study of
neoadjuvant imatinib in glioblastoma: Evaluation of clinical and
molecular effects of the treatment. Clin Cancer Res. 15:6258–6266.
2009. View Article : Google Scholar : PubMed/NCBI
|
|
23
|
Shirai K, Siedow MR and Chakravarti A:
Antiangiogenic therapy for patients with recurrent and newly
diagnosed malignant gliomas. J Oncol. 2012:1934362012. View Article : Google Scholar : PubMed/NCBI
|
|
24
|
Virga J, Bognar L, Hortobagyi T, Zahuczky
G, Csősz É, Kalló G, Tóth J, Hutóczki G, Reményi Puskár J, Steiner
L and Klekner A: Prognostic role of the expression of
invasion-related molecules in glioblastoma. J Neurol Surg A Cent
Eur Neurosurg. 78:12–19. 2017.PubMed/NCBI
|
|
25
|
Virga J, Bognár L, Hortobágyi T, Zahuczky
G, Csősz É, Kalló G, Tóth J, Hutóczki G, Reményi Puskár J, Steiner
L and Klekner A: Tumor grade vs. expression of invasion-related
molecules in astrocytoma. Pathol Oncol Res. 24:35–43. 2018.
View Article : Google Scholar : PubMed/NCBI
|
|
26
|
Virga J, Szemcsak CD, Remenyi-Puskar J,
Tóth J, Hortobágyi T, Csősz É, Zahuczky G, Szivos L, Bognár L and
Klekner A: Differences in extracellular matrix composition and its
role in invasion in primary and secondary intracerebral
malignancies. Anticancer Res. 37:4119–4126. 2017.PubMed/NCBI
|
|
27
|
Mellinghoff IK, Wang MY, Vivanco I,
Haas-Kogan DA, Zhu S, Dia EQ, Lu KV, Yoshimoto K, Huang JH, Chute
DJ, et al: Molecular determinants of the response of glioblastomas
to EGFR kinase inhibitors. N Engl J Med. 353:2012–2024. 2005.
View Article : Google Scholar : PubMed/NCBI
|
|
28
|
Wild-Bode C, Weller M and Wick W:
Molecular determinants of glioma cell migration and invasion. J
Neurosurg. 94:978–984. 2001. View Article : Google Scholar : PubMed/NCBI
|
|
29
|
Bellail AC, Hunter SB, Brat DJ, Tan C and
Van Meir EG: Microregional extracellular matrix heterogeneity in
brain modulates glioma cell invasion. Int J Biochem Cell Biol.
36:1046–1069. 2004. View Article : Google Scholar : PubMed/NCBI
|
|
30
|
Gerber NK, Goenka A, Turcan S, Reyngold M,
Makarov V, Kannan K, Beal K, Omuro A, Yamada Y, Gutin P, et al:
Transcriptional diversity of long-term glioblastoma survivors.
Neuro Oncol. 16:1186–1195. 2014. View Article : Google Scholar : PubMed/NCBI
|
|
31
|
Petrás M, Hutóczki G, Varga I, Vereb G,
Szöllosi J, Bognár L, Ruszthi P, Kenyeres A, Tóth J, Hanzély Z, et
al: Expression pattern of invasion-related molecules in cerebral
tumors of different origin. Magy Onkológia. 53:253–258. 2009.
View Article : Google Scholar
|
|
32
|
Varga I, Hutóczki G, Petrás M, Scholtz B,
Mikó E, Kenyeres A, Tóth J, Zahuczky G, Bognár L, Hanzély Z and
Klekner A: Expression of invasion-related extracellular matrix
molecules in human glioblastoma vs. intracerebral lung
adenocarcinoma metastasis. Cent Eur Neurosurg. 71:173–180. 2010.
View Article : Google Scholar : PubMed/NCBI
|
|
33
|
Livak KJ and Schmittgen TD: Analysis of
relative gene expression data using real-time quantitative PCR and
the 2(-Delta Delta C(T)) Method. Methods. 25:402–408. 2001.
View Article : Google Scholar : PubMed/NCBI
|
|
34
|
Bondarenko A, Angrisani N,
Meyer-Lindenberg A, Seitz JM, Waizy H and Reifenrath J:
Magnesium-based bone implants: Immunohistochemical analysis of
peri-implant osteogenesis by evaluation of osteopontin and
osteocalcin expression. J Biomed Mater Res A. 102:1449–1457. 2014.
View Article : Google Scholar : PubMed/NCBI
|
|
35
|
Li L, Darden TA, Weinberg CR, Levine AJ
and Pedersen LG: Gene assessment and sample classification for gene
expression data using a genetic algorithm/k-nearest neighbor
method. Comb Chem High Throughput Screen. 4:727–739. 2001.
View Article : Google Scholar : PubMed/NCBI
|
|
36
|
Manocha S and Girolami MA: An empirical
analysis of the probabilistic K-nearest neighbour classifier.
Pattern Recognit Lett. 28:1818–1824. 2007. View Article : Google Scholar
|
|
37
|
Birol Sarica F, Tufan K, Cekinmez M, Sen
O, Cem Onal H, Mertsoylu H, Topkan E, Pehlivan B, Erdogan B and Nur
Altinors M: Effectiveness of temozolomide treatment used at the
same time with radiotherapy and adjuvant temozolomide; concomitant
therapy of glioblastoma multiforme: Multivariate analysis and other
prognostic factors. J Neurosurg Sci. 54:7–19. 2010.PubMed/NCBI
|
|
38
|
Helseth R, Helseth E, Johannesen TB,
Langberg CW, Lote K, Rønning P, Scheie D, Vik A and Meling TR:
Overall survival, prognostic factors, and repeated surgery in a
consecutive series of 516 patients with glioblastoma multiforme.
Acta Neurol Scand. 122:159–167. 2010. View Article : Google Scholar : PubMed/NCBI
|
|
39
|
Chintala SK and Rao JK: Invasion of human
glioma: Role of extracellular matrix proteins. Front Biosci.
1:d324–d339. 1996. View
Article : Google Scholar : PubMed/NCBI
|
|
40
|
Jung S, Moon KS, Kim ST, Ryu HH, Lee YH,
Jeong YI, Jung TY, Kim IY, Kim KK and Kang SS: Increased expression
of intracystic matrix metalloproteinases in brain tumors:
relationship to the pathogenesis of brain tumor-associated cysts
and peritumoral edema. J Clin Neurosci. 14:1192–1198. 2007.
View Article : Google Scholar : PubMed/NCBI
|
|
41
|
Abdollahi A, Griggs DW, Zieher H, Roth A,
Lipson KE, Saffrich R, Gröne HJ, Hallahan DE, Reisfeld RA, Debus J,
et al: Inhibition of alpha(v)beta3 integrin survival signaling
enhances antiangiogenic and antitumor effects of radiotherapy. Clin
Cancer Res. 11:6270–6279. 2005. View Article : Google Scholar : PubMed/NCBI
|
|
42
|
Kawataki T, Yamane T, Naganuma H,
Rousselle P, Andurén I, Tryggvason K and Patarroyo M: Laminin
isoforms and their integrin receptors in glioma cell migration and
invasiveness: Evidence for a role of alpha5-laminin(s) and
alpha3beta1 integrin. Exp Cell Res. 313:3819–3831. 2007. View Article : Google Scholar : PubMed/NCBI
|
|
43
|
Yoshida T, Matsuda Y, Naito Z and Ishiwata
T: CD44 in human glioma correlates with histopathological grade and
cell migration. Pathol Int. 62:463–470. 2012. View Article : Google Scholar : PubMed/NCBI
|
|
44
|
Vuoriluoto K, Högnäs G, Meller P, Lehti K
and Ivaska J: Syndecan-1 and −4 differentially regulate oncogenic
K-ras dependent cell invasion into collagen through α2β1 integrin
and MT1-MMP. Matrix Biol. 30:207–217. 2011. View Article : Google Scholar : PubMed/NCBI
|
|
45
|
Aldape KD, Ballman K, Furth A, Buckner JC,
Giannini C, Burger PC, Scheithauer BW, Jenkins RB and James CD:
Immunohistochemical detection of EGFRvIII in high malignancy grade
astrocytomas and evaluation of prognostic significance. J
Neuropathol Exp Neurol. 63:700–707. 2004. View Article : Google Scholar : PubMed/NCBI
|
|
46
|
Holdhoff M and Grossman SA: Controversies
in the adjuvant therapy of high-grade gliomas. Oncologist.
16:351–358. 2011. View Article : Google Scholar : PubMed/NCBI
|
|
47
|
Johnson DR and Galanis E: Medical
management of high-grade astrocytoma: Current and emerging
therapies. Semin Oncol. 41:511–522. 2014. View Article : Google Scholar : PubMed/NCBI
|
|
48
|
Narita Y: Bevacizumab for glioblastoma.
Ther Clin Risk Manag. 11:1759–1765. 2015. View Article : Google Scholar : PubMed/NCBI
|
|
49
|
Chinot OL, Wick W, Mason W, Henriksson R,
Saran F, Nishikawa R, Carpentier AF, Hoang Xuan K, Kavan P, Cernea
D, et al: Bevacizumab plus radiotherapy-temozolomide for newly
diagnosed glioblastoma. N Engl J Med. 370:709–722. 2014. View Article : Google Scholar : PubMed/NCBI
|
|
50
|
Grau SJ, Trillsch F, Herms J, Thon N,
Nelson PJ, Tonn JC and Goldbrunner R: Expression of VEGFR3 in
glioma endothelium correlates with tumor grade. J Neurooncol.
82:141–150. 2007. View Article : Google Scholar : PubMed/NCBI
|
|
51
|
Jenny B, Harrison JA, Baetens D, Tille JC,
Burkhardt K, Mottaz H, Kiss JZ, Dietrich PY, De Tribolet N,
Pizzolato GP and Pepper MS: Expression and localization of VEGF-C
and VEGFR-3 in glioblastomas and haemangioblastomas. J Pathol.
209:34–43. 2006. View Article : Google Scholar : PubMed/NCBI
|
|
52
|
Li Q and Lozano G: Molecular pathways:
Targeting Mdm2 and Mdm4 in cancer therapy. Clin Cancer Res.
19:34–41. 2013. View Article : Google Scholar : PubMed/NCBI
|
|
53
|
Hientz K, Mohr A, Bhakta-Guha D and
Efferth T: The role of p53 in cancer drug resistance and targeted
chemotherapy. Oncotarget. 8:8921–8946. 2017. View Article : Google Scholar : PubMed/NCBI
|
|
54
|
Kesanakurti D, Chetty C, Dinh DH, Gujrati
M and Rao JS: Role of MMP-2 in the regulation of IL-6/Stat3
survival signaling via interaction with α5β1 integrin in glioma.
Oncogene. 32:327–340. 2013. View Article : Google Scholar : PubMed/NCBI
|
|
55
|
Deryugina EI, Bourdon MA, Luo GX, Reisfeld
RA and Strongin A: Matrix metalloproteinase-2 activation modulates
glioma cell migration. J Cell Sci. 110:2473–2482. 1997.PubMed/NCBI
|
|
56
|
Deryugina EI, Bourdon MA, Reisfeld RA and
Strongin A: Remodeling of collagen matrix by human tumor cells
requires activation and cell surface association of matrix
metalloproteinase-2. Cancer Res. 58:3743–3750. 1998.PubMed/NCBI
|
|
57
|
Egeblad M and Werb Z: New functions for
the matrix metalloproteinases in cancer progression. Nat Rev
Cancer. 2:161–174. 2002. View
Article : Google Scholar : PubMed/NCBI
|