Introduction
Lung cancer is one of the most common types of
malignant tumor globally. According to cancer statistics, 2,093,000
new lung cancer cases were reported in 2018 (1), accounting for 12.22% of total cases
cancer worldwide. A total of 1,761,000 patients died due to lung
cancer in 2018, which represents 19.78% of total mortality due to
cancer in the same period (1). In
general, >80% of cases of lung cancer are attributed to
non-small cell lung cancer (2).
Early-stage non-small cell cancer usually occurs in the form of
pulmonary nodules, which are not readily detected, and are often
asymptomatic prior to excessive proliferation. This leads to
frequent misdiagnoses. Lung database computed tomography (LDCT) is
an effective screening method for pulmonary nodules due to its low
radiation and price. Automatic detection and diagnosis of pulmonary
nodules from chest CT images usually includes segmentation of the
pulmonary parenchyma from the CT images, detection of suspected
nodules in the parenchyma of the lung, extraction of the
characteristics of pulmonary nodules and classification of the
pulmonary nodules, which is the key step in supplying supplementary
suggestions for diagnosis.
When making a diagnosis using medical imaging,
physicians rate the characteristics (texture, margin, lobulation
and calcification) of pulmonary nodules using empirical and
subjective methods to determine their malignant phenotype (3–7). This
method is subjective and highly dependent on the physician's
experience. Concomitantly, physical examination and imaging of lung
nodules is becoming increasingly onerous and presents a major
challenge for physicians, affecting the diagnostic classification
accuracy (Acc) of lung nodules. The continuous development of
machine learning has enabled the application of advanced learning
techniques in the research and diagnosis of a number of diseases
(8–17). The information derived from lung
nodule image data can be combined with machine learning in order to
investigate the association between lung cancer incidence and
clinicopathological features (18).
Supervised machine learning uses the correspondence between data
and labels to derive a mapping association between them, whereas
unsupervised machine learning is used in cases where samples cannot
be effectively classified, such as in the absence of sufficient
prior labels. The automated rating of lung nodules using machine
learning can improve the efficiency of inspections while reducing
human error (19).
The present study proposed a method based on
ensemble learning designed to classify the malignant levels of
pulmonary nodules, using features such as morphological texture
features (TF) and deep semantic features. These approaches are more
suitable than previous computer-aided diagnosis (9–18) for
clinical practice and replace a single identification method that
can only distinguish between benign and malignant nodule states. As
the precision of a single classifier (9–13) is not
high and does not meet the clinical diagnosis requirements, the
present study used the ensemble learning method to integrate three
single classifiers according to certain strategies, namely
comprehensive analysis of the characterization information of lung
nodules and automatic assignment of the lung nodule malignancy, in
order to improve the Acc. The training and testing protocols used
in the present study included datasets from the Lung Image Database
Consortium Image Database Resource Initiative (LIDC-IDRI).
Radiologists assigned the corresponding features of pulmonary
nodule lesions according to the image files of each study example
(20,21).
The results of the present study demonstrated that
the specific characteristics of CT images and pulmonary nodules can
be used to quantitatively evaluate lung nodule features based on
weighted voting, which differs from the previous classification of
the benign and malignant pulmonary nodule algorithm. This process
automatically scores the malignant phenotype levels of the lung
nodules. In addition, the computer tomographic image features and
the different semantic features are matched. The correspondence
between different modalities can be used to design a more precise
personalized treatment plan. Furthermore, a scheme is proposed for
ensemble learning of different classifiers by training multiple
classifiers, combining them according to the determined integration
strategy and comprehensively assessing the final result. The
feasibility of the proposed method was demonstrated in the
LIDC-IDRI dataset and was compared with state-of-the-art methods
for pulmonary nodule diagnosis and assessment.
Materials and methods
The materials and methods section describes the
proposed method for classification of pulmonary nodules using
ensemble learning. Characteristics of pulmonary nodules were
extracted using techniques such as the Convolutional Neural
Networks (CNN) features of supervised machine learning methods, the
Denoising Auto Encoder (DAE) features of unsupervised machine
learning methods and the Texture Feature (TF) and Shape Feature
(SF) of lung nodules. CNN, autoencoder and TF and SF techniques
were combined with the weighted voting model to predict the
semantic feature scores of the lung nodules. According to the
classification error rate of the sub-classifier, the weights of
different classifiers were determined, and the integrated model
lung nodule classification was obtained to determine malignant
phenotype level (Fig. 1).
Lung nodule data
The lung CT datasets selected in the present study
were obtained from LIDC-IDRI (22)
(https://wiki.cancerimagingarchive.net/display/Public/LIDC-IDRI).
The LIDC-IDRI dataset contained a total of 1,018 CT images of
patients with relevant clinical information. These CT images were
marked by four physicians to indicate the location of the lung
nodules, the edge contour information, the degree of benign and
malignant characteristics and the quantitation of different signs.
Pulmonary nodules with different malignant phenotypes exhibited a
number of morphological characteristics. In the LIDC-IDRI dataset,
the malignant phenotype of the lung nodules was quantified by the
physician using specific numbers and the quantification range was
set to 1–5, according to the definition of dataset (14,16). The
probability of malignancy was indicated as follows: i) Malignancy
1, high probability of being benign; ii) malignancy 2, moderate
probability of being benign; iii) malignancy 3, indeterminate
probability being benign; iv) malignancy 4, moderate probability of
being malignant; and v) malignancy 5, high probability of being
malignant.
As nodules in the lung parenchyma are generally
small in diameter, the remaining parts of the CT image may affect
the classification results; therefore, the lung nodule images were
extracted according to the required annotations. The annotation
file records comprised the edge information used by the doctor to
mark the position of the nodule. Based on the edge information, the
center position of the nodule was determined and a 64×64
pixel2 image located at the center of the lung nodule
was obtained as experimental data. The computer-aided diagnostic
system automatically extracts the characteristics of the pulmonary
nodules and assesses the malignant phenotype of the nodules, which
improves the prediction efficiency. In the present study, the
LIDC-IDRI dataset was used for model training. Initially, the 64×64
pixel2 regions of interest (ROI) containing the
pulmonary nodules were extracted according to the annotation file.
The extracted ROI images of the pulmonary nodules were used as the
input of the three models, and the corresponding pulmonary
malignant phenotype of the nodule was extracted.
Pulmonary nodule feature extraction
using unsupervised learning
The autoencoder (23)
is an unsupervised learning method that automatically maps input
data into the hidden layers and reconstructs the output of the
hidden layers to the same shape as the raw input data. It locates
hidden features from specific inputs and extracts them to represent
the original input. The process from the input to the hidden layers
is known as encoding, whereas the process of reconstruction from
the hidden layers is known as decoding. The difference between the
raw and the reconstruction input data is the reconstruction error.
The autoencoder assumes that the distribution representation of the
hidden layers can capture the main factors of change within the
data.
Following lung nodule extraction using the DAE, the
Softmax function was used to classify the nodular malignancy,
assuming the training sample {(x1,y1),
(x2,y2), …,
(xn,yn)}, where xi
is the lung nodule image data, and yi is the
corresponding malignancy score. The classification of a lung nodule
by the Softmax function requires estimation of the probability
corresponding to each malignancy score. The formula used to
calculate the probability was:
P(yi=j|xi;j)=1∑j=15eωxi[eωxi],j=1,2,3,4,5
where ω is a parameter used in the model. The degree
of malignant phenotype corresponding to the probability value was
selected as the predicted malignancy of the lung nodule image
xi. The process and feature extraction by Denoising
Autoencoder (Fig. S1) are further
described in Data S1.
Pulmonary nodule features extraction
using supervised learning
CNN is a feedforward deep neural network, which
consists of convolution operation. CNN calculates matching levels
between the images and labels by extracting the feature
representation of images (24–27). The
deeper of network layers is, the stronger CNN representation is;
however, it has been shown that the network degenerates as CNN
increase in depth, and this increase results in a decrease in Acc.
ResNet network is another typical CNN that adds a shortcut
connection and an identity map to the network using residual
learning (27). The extraction
capability of network features is enhanced, and the network
performance gradually improves as the network deepens (25).
In the present study, the sum of the cross-entropy
loss function and the regularization loss function were used as the
loss function of the residual network:
lR=-∑i=1nyilogyˆ1+(1-yi)log(1-yˆ1)+1n(p∑1=1n|θi|+(1-p)∑i=1nθi2)
where yi is the true label of the
pulmonary nodule, ŷi is the prediction label for
the pulmonary nodule, p is the regularization factor and θ,
the network model parameter. The features extracted using ResNet-18
were also classified using the Softmax function. The process of
feature extraction by ResNet-18 (Fig.
S2) and the hyper-parameters of ResNet-18 (Table SI) are further described in Data
S2.
Pulmonary nodule classification by
handcrafted features
The handcrafted features of the pulmonary nodules
were used to classify the lung nodules. Due to the particularity of
the medical images, only SF and TF were used to classify the lung
nodules (28,29). The geometric parameter method was
used to determine the shape of the lung nodules, and the Gray Level
Co-occurrence Matrix was used to determine the texture of the
nodules.
Following extraction of TF and SF, the extracted
features were concatenated using a set of feature vectors. The
multi-class machine learning method was selected to classify the
features of the lung nodules. In the present study, the K-Nearest
Neighbor (KNN) method was selected to classify the extracted
handcrafted features. KNN is a method for classifying targets based
on feature space training examples, and consists of two components,
learning and classification. In the present study, five grades were
used for the classification of the malignant phenotype and an
additional five categories were employed as vectors. All candidate
feature vectors were classified by KNN and divided into five
categories, representing the five malignancy grades. The process
and some typical handcrafted features (Fig. S3) are further described in Data
S3
Weighted voting method based on
classification error rate
The three feature methods of unsupervised learning,
supervised learning and handcrafted feature combination exhibited
different classification abilities for the classification task, and
different classification performances. If a single classifier is
used alone, the generalization ability of the classifier may not be
strong. Three classifiers were combined by certain rules and the
combined model could make full use of the features extracted by the
three methods. This approach may improve the Acc and generalization
ability of the model and could decrease the risk of the model
leading to local minimum points in the learning task during the
training process. Fusion of the multi-classifiers resulted in
cascade and parallel forms. The parallel mode adjusts the base
classifiers into a parallel action. Therefore, in the present
study, the three classifiers were combined in parallel.
Using parallel fusion, weighted voting was based on
the error rate (30–32). The ensemble classification model can
utilize the features of each classifier and further ensure
flexibility between the different feature coefficients of each
classifier (Table I).
 | Table I.Weighted voting algorithm based on
classification error rate. |
Table I.
Weighted voting algorithm based on
classification error rate.
| Algorithm 1
Weighted voting algorithm based on classification error rate |
|---|
 |
Evaluation criteria
In the present study, models were assessed based on
accuracy (Acc), precision (Pre) and sensitivity (Sen). Acc is the
correct proportion of the total sample, indicating the
classification ability of the models. Pre is the positive
predictive value, representing the proportion of true positives in
the positive samples. Sen is the true positive rate, which is the
proportion required to make a true positive prediction. Larger
values indicate a better performance of classification. The
calculation formula used were as follows:
Acc=∑i=15ωi(TPi+TNi)/(TPi+TNi+FPi+FNi)
Pre=∑i=15ωiTPi/(TPi+FPi)
Sen=∑i=15ωiTPi/(TPi+FNi)
The pulmonary nodule classification was defined by
the following parameters: TPi (true positive) indicated
the probability that the malignancy i was classified as I;
FNi (false negative) indicated the probability that the
malignancy i was not classified as I; FPi (false
positive) indicated the probability that a malignancy that was not
i was not classified as I; and TNi (true negative)
indicated the probability that a malignancy that was not i was
classified as i (i=1, 2, 3, 4 and 5). The detailed data description
and some nodule samples (Fig. S4)
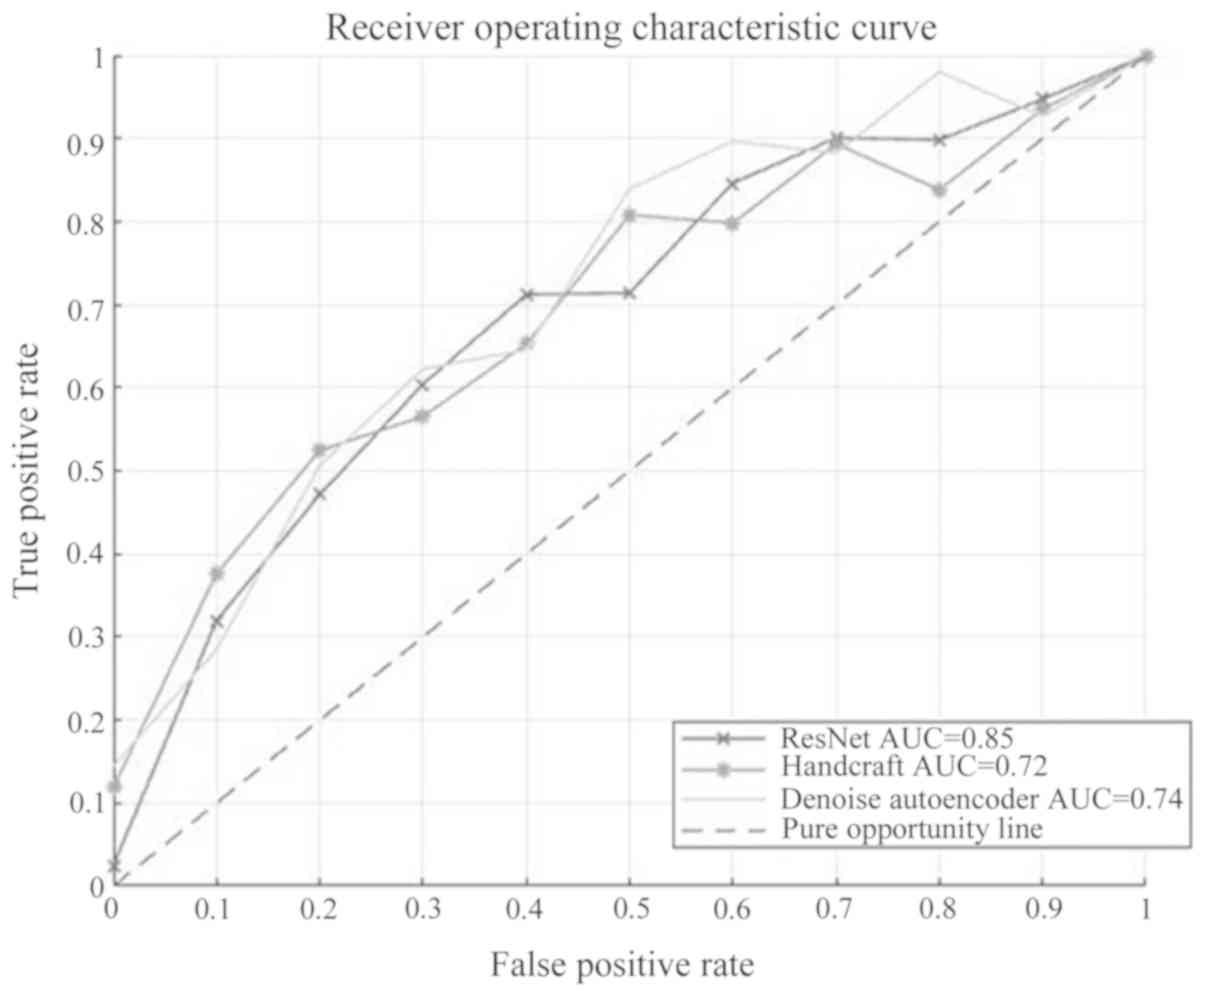
are shown in Data S4. In order to determine sensitivity and
accuracy trends, receiver operating characteristic (ROC) curves and
area under the curve (AUC) values were generated (Fig. 2). The ROC curves comprehensively
demonstrate the association between precision and sensitivity,
while the AUC value is the area under ROC curves. The larger the
AUC value, the better the classifier performance (32).
Results
Classification results of different
classifiers
The proposed method exhibited an average Acc of
93.10%, a Pre of 83.85% and a Sen of 81.75% for identification of
the malignant phenotype of the lung nodules in the test set
(Table II).
| Table II.Classification results of different
malignant pulmonary nodules from the Lung Image Database
Consortium-Image Database Resource Initiative. |
Table II.
Classification results of different
malignant pulmonary nodules from the Lung Image Database
Consortium-Image Database Resource Initiative.
| Malignancy
level | Accuracy, % | Precision, % | Sensitivity, % |
|---|
| 1 | 93.70 | 88.92 | 76.25 |
| 2 | 92.70 | 72.11 | 82.37 |
| 3 | 93.60 | 84.30 | 84.71 |
| 4 | 92.22 | 81.42 | 81.82 |
| 5 | 93.33 | 89.18 | 83.06 |
| Totals | 93.10 | 83.85 | 81.75 |
During the training phase, 10-fold cross-validation
was used to obtain the Acc of the three classifiers. ResNet-18
exhibited high Acc, whereas DAE exhibited notably stable Acc
(Fig. 3). Although the Acc of the
handcrafted features was relatively low, it could describe the
specific morphological and TF of the pulmonary nodules. In order to
validate these findings, an ablation experiment was performed by
removing the single methods (Table
III).
| Table III.Experimental results of the pairwise
method. |
Table III.
Experimental results of the pairwise
method.
| Method | Accuracy, % | Precision, % | Sensitivity, % |
|---|
| ResNet + Denoising
Auto Encoder | 80.27 | 82.10 | 73.45 |
| ResNet + KNN | 79.87 | 69.73 | 77.95 |
| Denoising Auto
Encoder + KNN | 82.59 | 75.11 | 80.80 |
Comparative experiment
The present study further compared the performance
of the proposed method based on the weighted voting classification
method and similar classification methods (13,33–36) used
under the same conditions (Table
IV).
| Table IV.Performance comparison of different
pulmonary nodule classification methods. |
Table IV.
Performance comparison of different
pulmonary nodule classification methods.
| Method | Accuracy, % | Precision, % | Sensitivity, % | Area under
curve |
|---|
| Zinovev et
al (33) | 68.50 | 69.66 | 73.45 | 0.72 |
| Shen et al
(34) | 82.12 | 84.10 | 78.65 | 0.78 |
| Rodrigues et
al (35) | 73.45 | 75.20 | 79.20 | 0.75 |
| Kumar et al
(13) | 71.30 | 69.73 | 77.95 | 0.74 |
| Sun et al
(36) | 72.80 | 75.11 | 80.80 | 0.77 |
| Proposed | 93.10 | 83.85 | 81.75 | 0.82 |
The results indicated that the Acc, Sen and AUC of
the classification of the malignant phenotype of the pulmonary
nodules were optimal in the methods used in the present study. The
proposed method exhibited a higher classification performance
regarding the pulmonary nodules, which could be used for their
accurate assessment, thereby supplying an auxiliary suggestion for
the judgment of the medical practitioner. The Pre of the method
used in the present study was lower compared with the Multi-Crop
CNN (MC-CNN) method proposed by Shen et al (34), as MC-CNN captures more prominent
features of the nodule via multiple cropping strategies. However,
MC-CNN reduces Sen to ensure Pre and does not improve the
classification Acc of pulmonary nodules. Therefore, complex
convolution networks may result in longer time periods.
Different CNN models
In the present study, a number of common supervised
CNN models were selected for comparison, namely, GoogleNet, VGGNet
and SENet (24–26). The CNN models were compared using
different pre-training processes with the ResNet-18 under the same
conditions (Table V).
| Table V.Comparison of classification
performance for different CNN models. |
Table V.
Comparison of classification
performance for different CNN models.
| Convolutional
neural network model | Accuracy, % | Precision, % | Sensitivity, % |
|---|
| Plain-18 | 66.75 | 65.30 | 66.00 |
| ResNet-18 | 87.15 | 84.10 | 85.65 |
| ResNet-50 | 85.75 | 69.75 | 69.25 |
| GoogleNet | 86.20 | 79.00 | 79.50 |
| VGGNet-16 | 86.30 | 85.25 | 80.90 |
| SENet | 87.00 | 83.35 | 84.80 |
Discussion
Magnetic Resonance Imaging (MRI) uses a magnetic
field to obtain electromagnetic signals from the body and
reconstruct these signals into images. As lung tissue is rich in
gas, the effectiveness of lung MRI is poor. Positron Emission CT
(PET-CT) uses the Compton effect in order to reconstruct images.
However, its use of radiation increases the risk of lung cancer. CT
uses precise and collimated X-ray beams to scan the body and
conduct tomography. CT is suitable for screening human respiratory
diseases due to its high-density resolution (37). The radiation dose of LDCT is only 26%
of that of conventional CT, and LDCT can therefore decrease the
incidence of side effects, compared with MRI and PET-CT (38). It is therefore suitable for screening
patients with lung cancer, especially non-small cell lung
cancer.
For each characteristic of the pulmonary nodules,
the appearance was different. Direct observation of the location of
the pulmonary nodules or analysis of their malignant phenotype from
the image is considered a difficult task. The key features of the
vectors were extracted, in order to represent nodules for
classification; however, the characteristics of the nodules varied,
thus making the task difficult. With regards to nodule images, the
supervised learning approaches can automatically extract different
features of nodules according to the nodule's labels (benign and
malignant). The advantage is that it can identify different
categories of nodules according to given labels, without manual
intervention. On the other hand, DAE also can extract effective
features of nodules through back-propagation algorithm and gradient
descent algorithm (23). The
autoencoder can find the specific latent vectors from sample sets
and extract it for classification. DAE have the ability to preserve
the local and global structure of highly nonlinear networks, thus
it can be better applied to nodules classification tasks. The
handcrafted features, TF and SF reflect the information of the
surface and appearance of the nodules, respectively; however, they
are unable to completely reflect the essential attributes of the
nodules in classification alone, thus these features need to be
used in combination (39).
The present study proposed a method for classifying
the malignant phenotype of pulmonary nodules on chest CT images.
Initially, ResNet-18 and DAE were used to classify lung nodules and
KNN was used to classify the SF and TF of these nodules. To get
better classification results, we ensemble single classifier
according to the classification error rate of the three
classifiers, the ensemble model was integrated with three
classifiers using weighted voting. A total of 4,578 lung nodule
images were extracted from the LIDC-IDRI dataset to verify the
validity of the method. Following data balancing and data
augmentation, data were obtained from 20,000 images. In the final
model, Acc, Pre and Sen reached 93.10, 83.85 and 81.75%,
respectively. The overall performance was higher than that of
state-of-the-art methods (13,29–32). In
the present study, these data were compared with the different CNN
models and ResNet-18. It was demonstrated that the classification
performance of ResNet-18 was higher than that of the other CNN
models. Therefore, the proposed classification method for the
malignant phenotype of pulmonary nodules decreases the time and
cost of CT imaging, increases the Acc of assisted lung cancer
diagnosis, offers auxiliary support during diagnosis and improves
the efficiency of lung cancer screening in hospitals.
Lung cancer automatic judgment is important but
difficult as it predominantly includes detection, segmentation and
evaluation (40). The present study
successfully identified the classification of multi-class nodules,
which is the first step of lung cancer judgment. Prospective
studies will focus on lung tumor prediction and segmentation.
Supplementary Material
Supporting Data
Acknowledgements
Not applicable.
Funding
The present study was supported in part by the
National Natural Science Foundation of China (grant no.
61872261).
Availability of data and materials
The datasets generated and/or analyzed during the
current study are available in the LIDC-IDRI repository (https://wiki.cancerimagingarchive.net/display/Public/LIDC-IDRI).
The implementation code used during the current study is available
at https://github.com/XmaNm/nodules-classification.
Authors' contributions
NX and YQ conceived and designed the study. MBZ
improved the algorithm for use in the present study. JHL collected
and curated data. NX and JHL designed the experiment and analyzed
the results. SHW coordinated the present study and collected
background information. All authors read and approved the final
manuscript.
Ethics approval and consent for
publication
Not applicable.
Patient consent for publication
Not applicable.
Competing interests
The authors declare that they have no competing
interests.
References
|
1
|
Bray F, Ferlay J, Soerjomataram I, Siegel
RL, Torre LA and Jemal A: Global cancer statistics 2018: GLOBOCAN
estimates of incidence and mortality worldwide for 36 cancers in
185 countries. CA Cancer J Clin. 68:394–424. 2018. View Article : Google Scholar : PubMed/NCBI
|
|
2
|
Rzechonek A, Grzegrzolka J, Blasiak P,
Ornat M, Piotrowska A, Nowak A and Dziegiel P: Correlation of
expression of tenascin C and blood vessel density in non-small cell
lung cancers. Anticancer Res. 38:1987–1991. 2018.PubMed/NCBI
|
|
3
|
Chen S, Harmon S, Perk T, Li X, Chen M, Li
Y and Jeraj R: Diagnostic classification of solitary pulmonary
nodules using dual time 18F-FDG PET/CT image texture
features in granuloma-endemic regions. Sci Rep. 7:93702017.
View Article : Google Scholar : PubMed/NCBI
|
|
4
|
Dai M, Qi J, Zhou Z and Gao F: The
classification of pulmonary nodules based on texture features over
local jet transformation space. Chin J Biomed Eng. 36:12–19.
2017.
|
|
5
|
Felix A, Oliveira M, Machado A and Raniery
J: Using 3D texture and margin sharpness features on classification
of small pulmonary nodules. In: Proceedings of 29th Conference on
Graphics. (Patterns and Images (SIBGRAPI), Sao Paulo). 394–400.
2016.
|
|
6
|
Song J, Hui L, Geng F and Zhang C:
Weakly-supervised classification of pulmonary nodules based on
shape characters. In: Proceedings of 2016 IEEE 14th Intl Conf on
Dependable, Autonomic and Secure Computing, 14th Intl Conf on
Pervasive Intelligence and Computing, 2nd Intl Conf on Big Data
Intelligence and Computing and Cyber Science and Technology
Congress (DASC/PiCom/DataCom/CyberSciTech). (Auckland). 228–232.
2016.
|
|
7
|
Niehaus R, Raicu DS, Furst J and Armato S
III: Toward understanding the size dependence of shape features for
predicting spiculation in lung nodules for computer-aided
diagnosis. J Digit Imaging. 28:704–717. 2015. View Article : Google Scholar : PubMed/NCBI
|
|
8
|
Dhara AK, Mukhopadhyay S, Dutta A, Garg M
and Khandelwal N: A Combination of shape and texture features for
classification of pulmonary nodules in lung CT images. J Digit
Imaging. 29:466–475. 2016. View Article : Google Scholar : PubMed/NCBI
|
|
9
|
Li W, Cao P, Zhao D and Wang J: Pulmonary
nodule classification with deep convolutional neural networks on
computed tomography images. Comput Math Methods Med.
2016:62150852016. View Article : Google Scholar : PubMed/NCBI
|
|
10
|
Tartar A, Akan A and Kilic N: A novel
approach to malignant-benign classification of pulmonary nodules by
using ensemble learning classifiers. Conf Proc IEEE Eng Med Biol
Soc. 2014:4651–4654. 2014.PubMed/NCBI
|
|
11
|
Nibali A, Zhen H and Wollersheim D:
Pulmonary nodule classification with deep residual networks. Int J
Comput Assist Radiol Surg. 12:1799–1808. 2017. View Article : Google Scholar : PubMed/NCBI
|
|
12
|
Shen W, Zhou M, Yang F, Yang C and Tian J:
Multi-scale convolutional neural networks for lung nodule
classification. Inf Process Med Imaging. 24:588–599.
2015.PubMed/NCBI
|
|
13
|
Kumar D, Wong A and Clausi DA: Lung nodule
classification using deep features in CT images. In: Proceedings of
the 2015 12th Conference on Computer and Robot Vision. (Halifax,
Canada. IEEE). 133–138. 2015.
|
|
14
|
Kaya A and Can AB: A weighted rule based
method for predicting malignancy of pulmonary nodules by nodule
characteristics. J Biomed Inform. 56:69–79. 2015. View Article : Google Scholar : PubMed/NCBI
|
|
15
|
Li G, Kim H, Tan JK, Ishikawa S, Hirano Y,
Kido S and Tachibana R: Semantic characteristics prediction of
pulmonary nodule using artificial neural networks. Conf Proc IEEE
Eng Med Biol Soc. 2013:5465–5468. 2013.PubMed/NCBI
|
|
16
|
Chen S, Ni D, Qin J, Lei B, Wang T and
Cheng JZ: Bridging computational features toward multiple semantic
features with multi-task regression: A study of ct pulmonary
nodules. International Conference on Medical Image Computing and
Computer-Assisted Intervention. Springer. (Cham). 53–60. 2016.
|
|
17
|
Shewaye TN and Mekonnen AA:
Benign-malignant lung nodule classification with geometric and
appearance histogram features. arXiv: Computer Vision and Pattern
Recognition. (arXiv:1605.08350v1 [cs.CV]). 2016.
|
|
18
|
Orozco HM, Villegas OOV, de Jesús Ochoa
Domínguez O and Sánchez VGC: Lung nodule classification in CT
thorax images using support vector machines. Mexican International
Conference on Artificial Intelligence. IEEE. 277–283. 2014.
|
|
19
|
Zhao A, Qi L, Li J, Dong J and Yu H: LSTM
for diagnosis of neurodegenerative diseases using gait data. In:
Proceedings of the 9th International Conference on Graphics and
Image Processing. SPIE Press. 2018.
|
|
20
|
Jacobs C, van Rikxoort EM, Twellmann T,
Scholten ET, de Jong PA, Kuhnigk JM, Oudkerk M, de Koning HJ,
Prokop M, Schaefer-Prokop C and van Ginneken B: Automatic detection
of subsolid pulmonary nodules in thoracic computed tomography
images. Med Image Anal. 18:374–384. 2014. View Article : Google Scholar : PubMed/NCBI
|
|
21
|
Ma J, Wang Q, Ren Y, Hu H and Zhao J:
Automatic lung nodule classification with radiomics approach.
Medical Imaging 2016: PACS and Imaging Informatics: Next Generation
and Innovations. 9789:SPIE Proceedings. 2016.
|
|
22
|
Armato SG III, McLennan G, Bidaut L,
McNitt-Gray MF, Meyer CR, Reeves AP, Zhao B, Aberle DR, Henschke
CI, Hoffman EA, et al: The lung image database consortium (LIDC)
and image database resource initiative (IDRI): A completed
reference database of lung nodules on CT scans. Med Phys.
38:915–931. 2011. View Article : Google Scholar : PubMed/NCBI
|
|
23
|
Chen M, Weinberger KQ, Sha F and Bengio
YO: Marginalized denoising auto-encoders for nonlinear
representations. Proceedings of the 31st International Conference
on Machine Learning. PMLR. 32:1476–1484. 2014.
|
|
24
|
Szegedy C, Liu W, Jia Y, Sermanet P, Reed
S, Anguelov D, Erhan D, Vanhoucke V and Rabinovich A: Going deeper
with convolutions. arXiv: Computer Vision and Pattern Recognition.
(arXiv:1409.4842v1 [cs.CV]). 2015. View Article : Google Scholar
|
|
25
|
Simonyan K and Zisserman A: Very deep
convolutional networks for large-scale image recognition. arXiv:
Computer Vision and Pattern Recognition arXiv:1409.1556v6 [cs.CV].
2014.
|
|
26
|
Hu J, Shen L, Albanie S, Sun G and Wu E:
Squeeze-and-excitation networks. arXiv: Computer Vision and Pattern
Recognition. (arXiv:1709.01507v4 [cs.CV]). 2017.
|
|
27
|
He K, Zhang X, Ren S and Sun J: Deep
residual learning for image recognition. IEEE Conference on
Computer Vision and Pattern Recognition. 770–778. 2016.
|
|
28
|
Haralick RM, Shanmugam K and Dinstein IH:
Textural features for image classification. IEEE Transactions on
Systems. (Man, and Cybernetics. Vol SMC-3. IEEE). 610–621.
1973.
|
|
29
|
Pan L, Qiang Y, Yuan J and Wu L: Rapid
retrieval of lung nodule CT images based on hashing and pruning
methods. Biomed Res Int. 2016:31626492016. View Article : Google Scholar : PubMed/NCBI
|
|
30
|
Li X, Yang Y, Xiong H, Song S and Jia H:
Pulmonary nodules detection algorithm based on robust cascade
classifier for CT images. Control and Decision Conference. IEEE.
231–235. 2017.
|
|
31
|
Zinovev D, Furst J and Raicu D: Building
an ensemble of probabilistic classifiers for lung nodule
interpretation. Proceedings of the 10th International Conference on
Machine Learning and Applications and Workshops. IEEE Computer
Society. 155–161. 2011.
|
|
32
|
Zou KH, O'Malley AJ and Mauri L:
Receiver-operating characteristic analysis for evaluating
diagnostic tests and predictive models. Circulation. 115:654–657.
2007. View Article : Google Scholar : PubMed/NCBI
|
|
33
|
Zinovev D, Feigenbaum J, Furst J and Raicu
D: Probabilistic lung nodule classification with belief decision
trees. Conf Proc IEEE Eng Med Biol Soc. 2011:4493–4498.
2011.PubMed/NCBI
|
|
34
|
Shen W, Zhou M, Yang F, Yu D, Dong D, Yang
C, Zang Y and Tian J: Multi-crop Convolutional Neural Networks for
lung nodule malignancy suspiciousness classification. Pattern
Recogn. 61:663–673. 2017. View Article : Google Scholar
|
|
35
|
Rodrigues MB, Da NóBrega RVM, Alves SSA,
Filho PPR, Duarte JBF, Sangaiah AK and De Albuquerque VHC: Health
of things algorithms for malignancy level classification of lung
nodules. IEEE Access. 6:18592–18601. 2018. View Article : Google Scholar
|
|
36
|
Sun W, Huang X, Tseng TL, Zhang J and Qian
W: Computerized lung cancer malignancy level analysis using 3D
texture features. Medical Imaging 2016: PACS and Imaging
Informatics: Next Generation and Innovations. 9785:SPIE
Proceedings. 2016.
|
|
37
|
Seo N, Seok J, Lim S and Cho A: Radiologic
diagnosis (CT, MRI, & PET-CT). Surg Gastric Cancer. 67–86.
2019. View Article : Google Scholar
|
|
38
|
Oliva MR and Saini S: Liver cancer
imaging: Role of CT, MRI, US and PET. Cancer Imaging. 4:S42–S46.
2004. View Article : Google Scholar : PubMed/NCBI
|
|
39
|
Muhammad MN, Raicu DS, Furst JD and
Varutbangkul E: Texture versus shape analysis for lung nodule
similarity in computed tomography studies. Medical Imaging 2008:
PACS and Imaging Informatics. 6919:SPIE Proceedings. 2008.
|
|
40
|
Wormanns D, Fiebich M, Saidi M, Diederich
S and Heindel W: Automatic detection of pulmonary nodules at spiral
CT: Clinical application of a computer-aided diagnosis system. Eur
Radiol. 12:1052–1057. 2002. View Article : Google Scholar : PubMed/NCBI
|