In 2020, 1.9 million new cases and 935,000 deaths
from colorectal cancer (CRC) were reported in the United States,
and CRC had the third highest incidence and the second highest
mortality rate among all cancers in the country (1). Furthermore, the incidence of
colorectal cancer before the age of 50 has increased by 1–4% per
year in numerous countries (2). CRC
patients without metastasis have a good 5-year overall survival
(OS) rate at >84.0% (3). For CRC
patients with metastasis, the 5-year OS is <15% (4,5). The
properties of the tumor microenvironment are strongly linked to the
occurrence, development, metastasis, recurrence and treatment
resistance of CRC (6).
Currently, the main treatments for CRC include
surgery, targeted therapy, radiotherapy, chemotherapy and
immunotherapy (7,8). Surgery, chemotherapy and radiotherapy
are the preferred treatments because immunotherapy is generally
less effective (9,10). However, among CRC patients receiving
immunotherapy, patients with microsatellite instability tumors were
reported to have shown greater therapeutic effects than patients
with microsatellite stable tumors (11,12).
The Tumor-Node-Metastasis (TNM) staging system is widely used to
evaluate the prognosis of CRC patients (13). However, this system is insufficient
for evaluating the effect of treatment in patients receiving
immunotherapy and for making treatment decisions. The development
of next-generation sequencing will help to elucidate the biological
molecular mechanisms underlying colorectal cancer, and further
contribute to the development of personalized treatment (14,15).
Therefore, new biomarkers for predicting the prognosis of CRC
patients need to be identified.
Recent studies have reported biomarkers that can
guide systemic therapy in colorectal cancer. For example,
insensitivity to cetuximab or panitumumab is associated with
mutations of the KRAS and NRAS gene exons 2, 3 and 4, and the
presence of these mutations precludes the use of these drugs
(16–20). Furthermore, patients with CRC and
the BRAF V600E mutation have a worse prognosis (21). The addition of cetuximab to
first-line treatment also showed no better OS benefit when compared
with treatment without cetuximab, and is additionally associated
with increased toxicity of the treatment (22). Immune checkpoint inhibitors have
attracted great attention owing to their unique clinical
therapeutic effects. According to a phase II clinical trial, the
immune-related objective response rate (ORR) was 40% in the DNA
mismatch repair (dMMR) colorectal cancer group and 0% in the
microsatellite instability-high/mismatch repair-deficient
(MSI-H/dMMR) group, respectively (12). An open-label study (KEYNOTE-164)
reported that the ORR was 33% in dMMR/MSI-H patients receiving
pembrolizumab therapy regardless of whether they received
first-line or second-line therapy (23).
Immune-related genes and immune-infiltrating cells
undoubtedly serve an indispensable role in the tumor
microenvironment and their roles in CRC are worth exploring. A
comprehensive analysis of immune cells and immune-related genes is
needed to further elucidate the underlying mechanisms of immune
resistance and immune response in the context of CRC (24,25).
Level 3 RNA sequencing data (such as TPM or FPKM
data), high throughput sequencing-counts transcriptome data and
clinical information for colon adenocarcinoma (COAD) and rectum
adenocarcinoma (READ) were downloaded from TCGA database
(https://portal.gdc.cancer.gov/). After
processing, data on 659 COADREAD patients (51 normal patients and
608 patients with colorectal cancer) with both gene expression
profile and clinical information were included for subsequent
analysis. The gene expression profiles were normalized using the
DEseq2 package (Bioconductor version 3.14) (26). The clinical features of the patients
were presented in Table I. Gene
expression data and clinical data were downloaded from the National
Center for Biotechnology Information Gene Expression Omnibus (GEO)
under the accession number GSE87211.
ESTIMATE analysis, performed using the ESTIMATE
package (version 1.0.13, ESTIMATE: R Package; mdanderson.org), was
used to calculate the tumor purity, stromal score and immune score
of each CORDREAD patient (32).
CIBERSORT (R version 1.03; http://cibersort.stanford.edu) was used to calculate
the distributions of 22 types of immune cells (33). Wilcoxon's rank-sum test was used to
compare the scores between the high- and low-immunity groups.
Immune-related genes associated with OS of COADREAD
patients were screened using univariate Cox regression analysis
using the survival (version 3.2–13; http://cran.r-project.org/src/contrib/Archive/survival/survival_3.2–13.tar.gz)
package in R. Then, a LASSO regression model was constructed using
the glmnet (version 4.1–4; http://cran.r-project.org/src/contrib/Archive/glmnet/glmnet_4.1–4.tar.gz)
package based on the results of univariate Cox regression, and the
COADREAD patients were divided into high-risk group and low-risk
groups according to the median risk score. The risk signature in
the GSE87211 cohort was then validated, and survival and survminer
(version 0.4.9; http://cran.r-project.org/web/packages/survminer/index.html)
packages were used to construct a Kaplan-Meier curve between the
high- and low-risk groups. The sensitivity and specificity of the
prognostic signature were evaluated using a receiver-operating
characteristic (ROC) curve.
The signaling pathway differences were analyzed
using functional enrichment analysis by the clusterProfiler package
(version 4.4.4; Bioconductor-clusterProfiler) (34,35).
The dataset named c2.cp.kegg.v7.5.1.symbols.gmt was download from
the GSEA website (https://www.gsea-msigdb.org/gsea/msigdb/collections.jsp#C2)
(36).
To further validate the expression of hub genes in
the present study, tissue was collected from 3 CRC patients who had
not undergone any treatment. The transcription level of the hub
gene in the colorectal cancer tissue and adjacent tissues was
assessed. Total RNA was extracted from tissues using TRNzol (cat.
no. DP424; Tiangen Biotech Co., Ltd.), and cDNA was synthesized
using the Evo M-MLV RT premix kit (cat. no. AG11601; Accurate
Biotechnology; Hunan Aikerui Biological Engineering Co., Ltd.)
according to the manufacturer's instructions. RT-qPCR was performed
using the SYBR Green Real-time PCR Master Mix kit (cat. no.
11201ES08; Shanghai Yeasen Biotechnology Co., Ltd.). The following
conditions apply to the reaction: An initial 5 min at 95°C and
denaturation at 95°C for 15 sec, followed by 40 cycles of annealing
at 60°C for 30 sec and extension at 72°C for 30 sec. Relative mRNA
expression levels were calculated using the 2−ΔΔCq
method (38) and assessed
statistically using Student's t-test. The primer sequences used
were as follows: HAMP forward (F), 5′-CTCCTTCGCCTCTGGAACAT-3′ and
reverse (R), 5′-AGTGGCTCTGTTTTCCCACA-3′; and GAPDH F,
5′-GAAGATGGTGATGGGATTTC-3′ and R, 5′-GAAGGTGAAGGTCGG-3′.
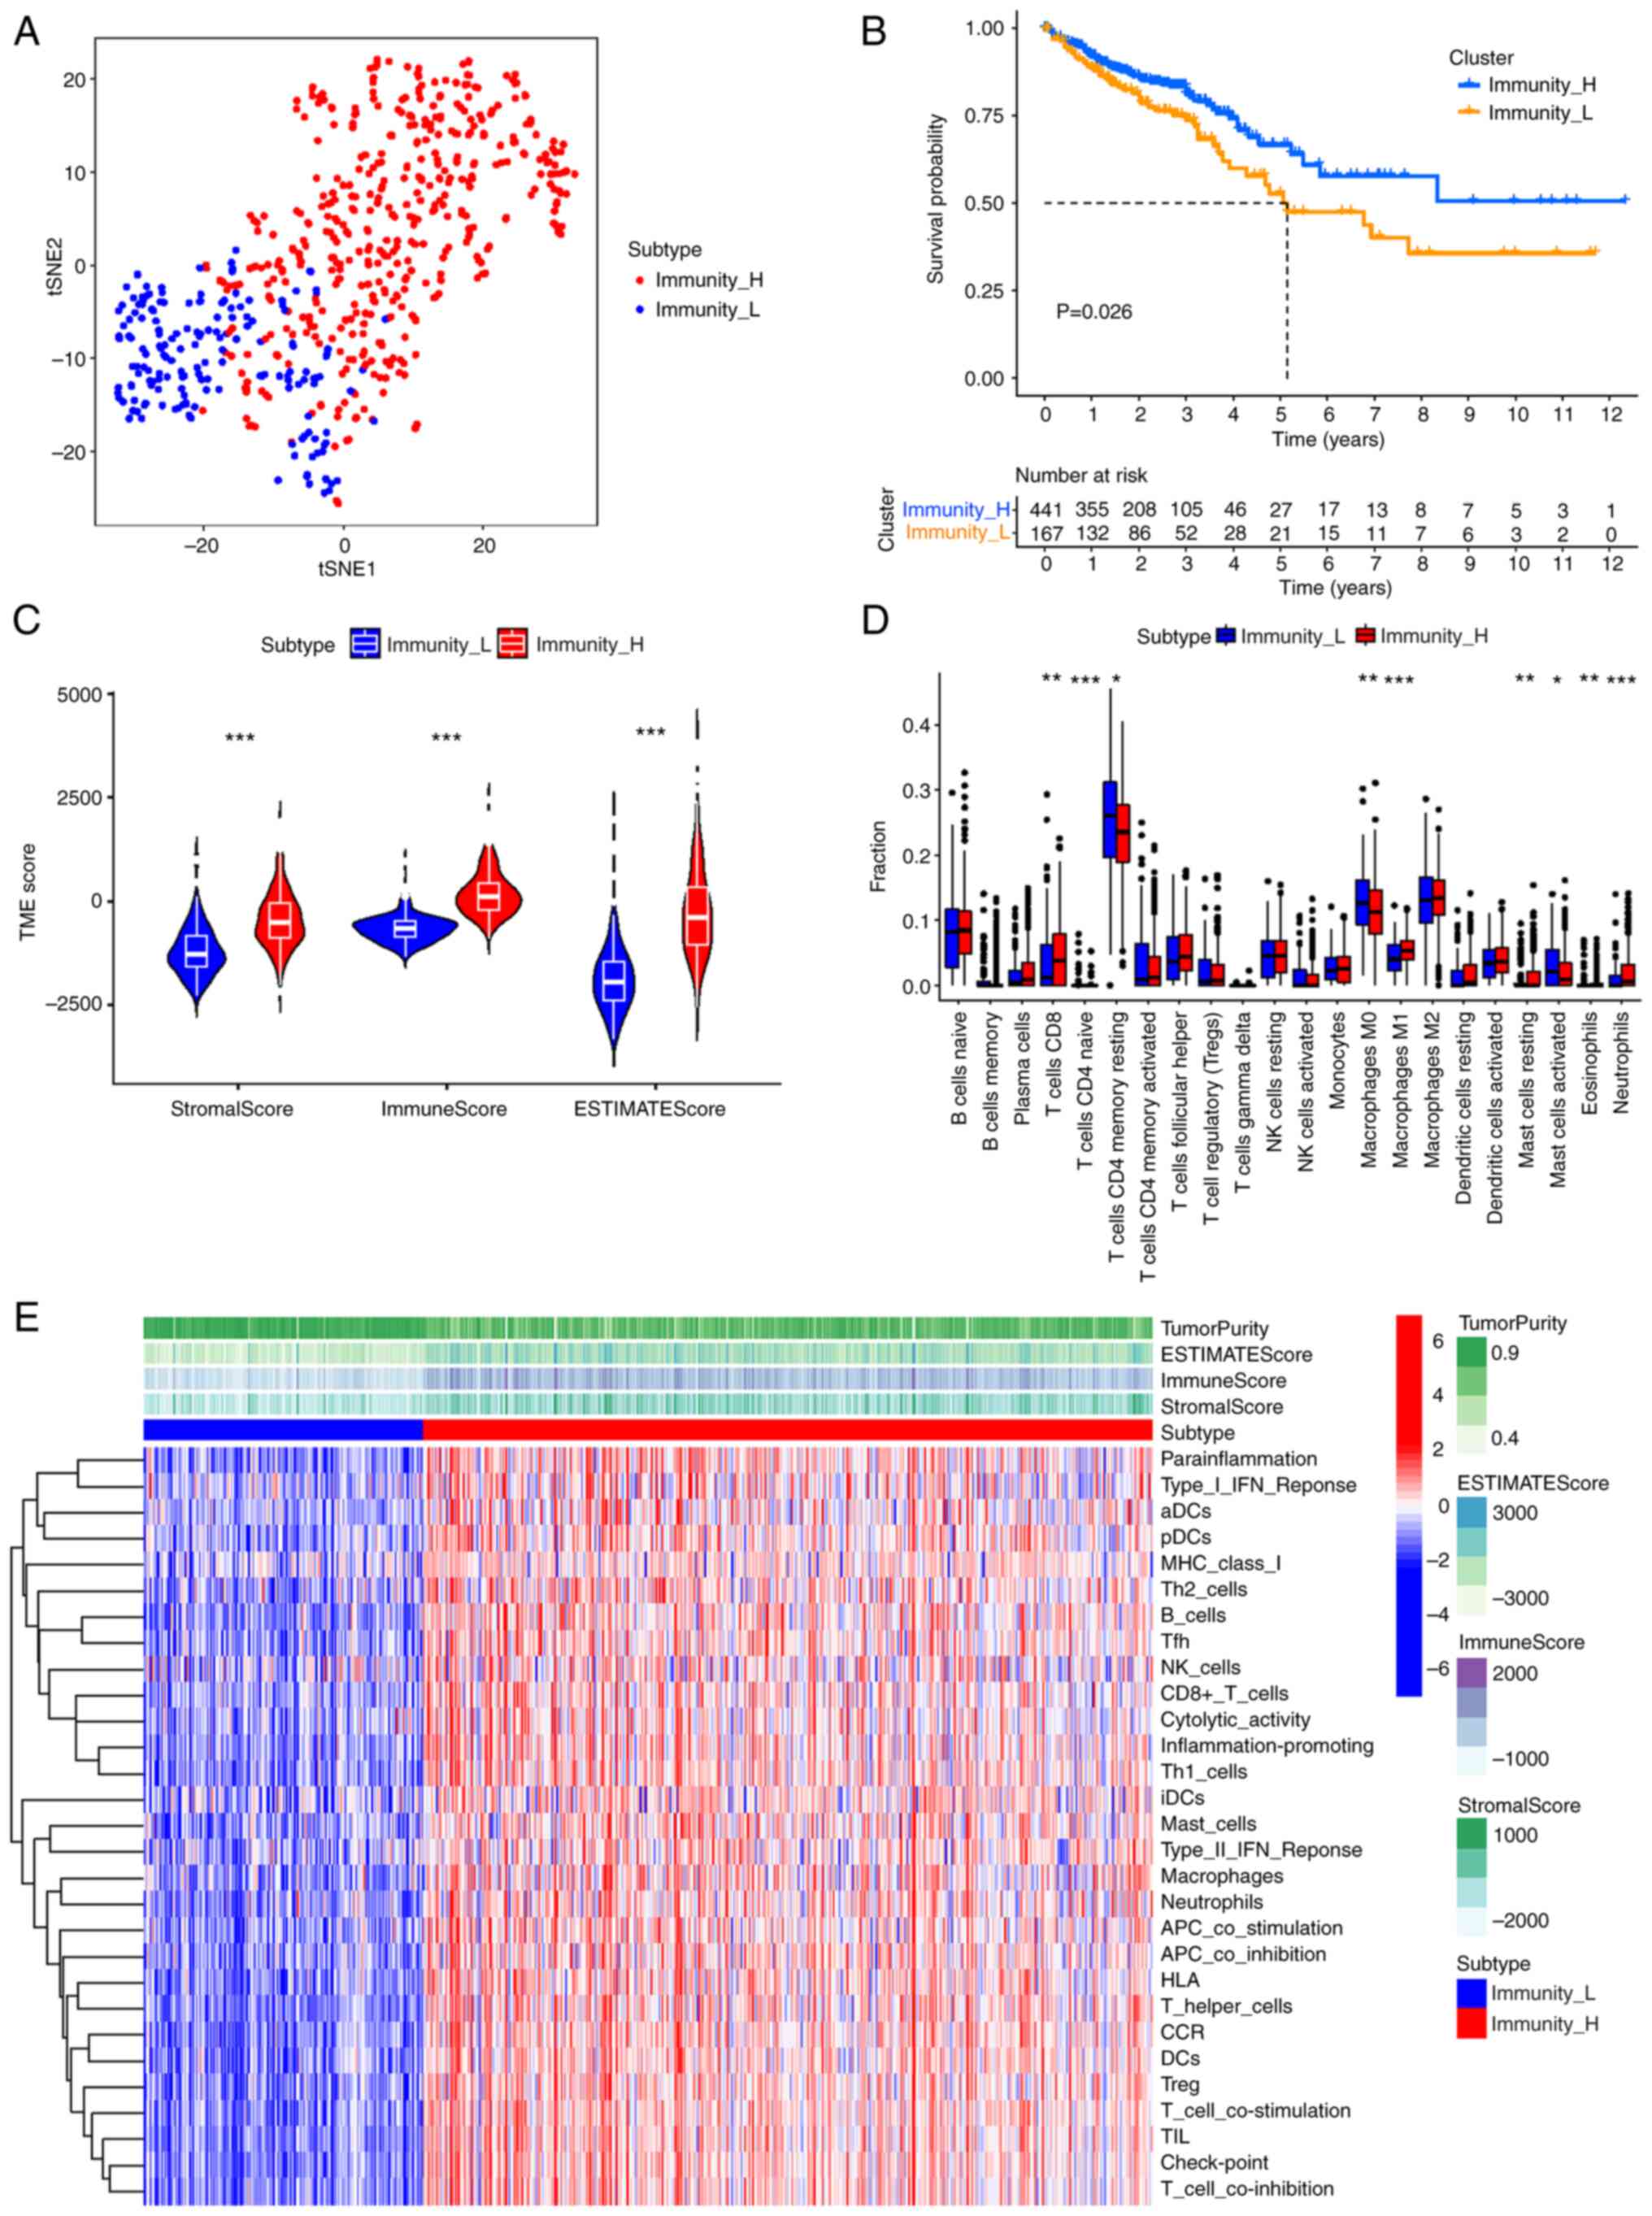
Data for patients with CRC were obtained from TCGA
database, and the distribution of 22 types of immune cells in these
patients was analyzed using the ssGSEA algorithm. CRC patients were
divided into high-immunity and low-immunity groups according to
consensus cluster analysis based on the median ssGSEA scores. The
t-SNE method preliminarily evaluated the distribution between the
two groups, and the high- and low-immunity groups were well
differentiated in colorectal cancer samples (Fig. 1A). A significant difference in OS
was observed between the high-immunity group and low-immunity group
using the KM curve (Fig. 1B;
P=0.026). Stromal, immune and ESTIMATE scores were calculated using
ESTIMATE analysis. The Wilcoxon rank-sum test method was used to
assess the statistical significance and the violin plot
demonstrated significantly higher scores in the high-immunity group
compared with the low-immunity group (Fig. 1C; P<2×10⁻¹⁶). In
particular, CIBERSORT analysis demonstrated significantly higher
CD8+ T cell levels in the high-immunity group compared
with the low-immunity group (Fig.
1D; P=0.0019). The heatmap demonstrated that in the high-immune
group, the stromal, immune and ESTIMATE scores had a similar trend
to immune cell expression (Fig.
1E).
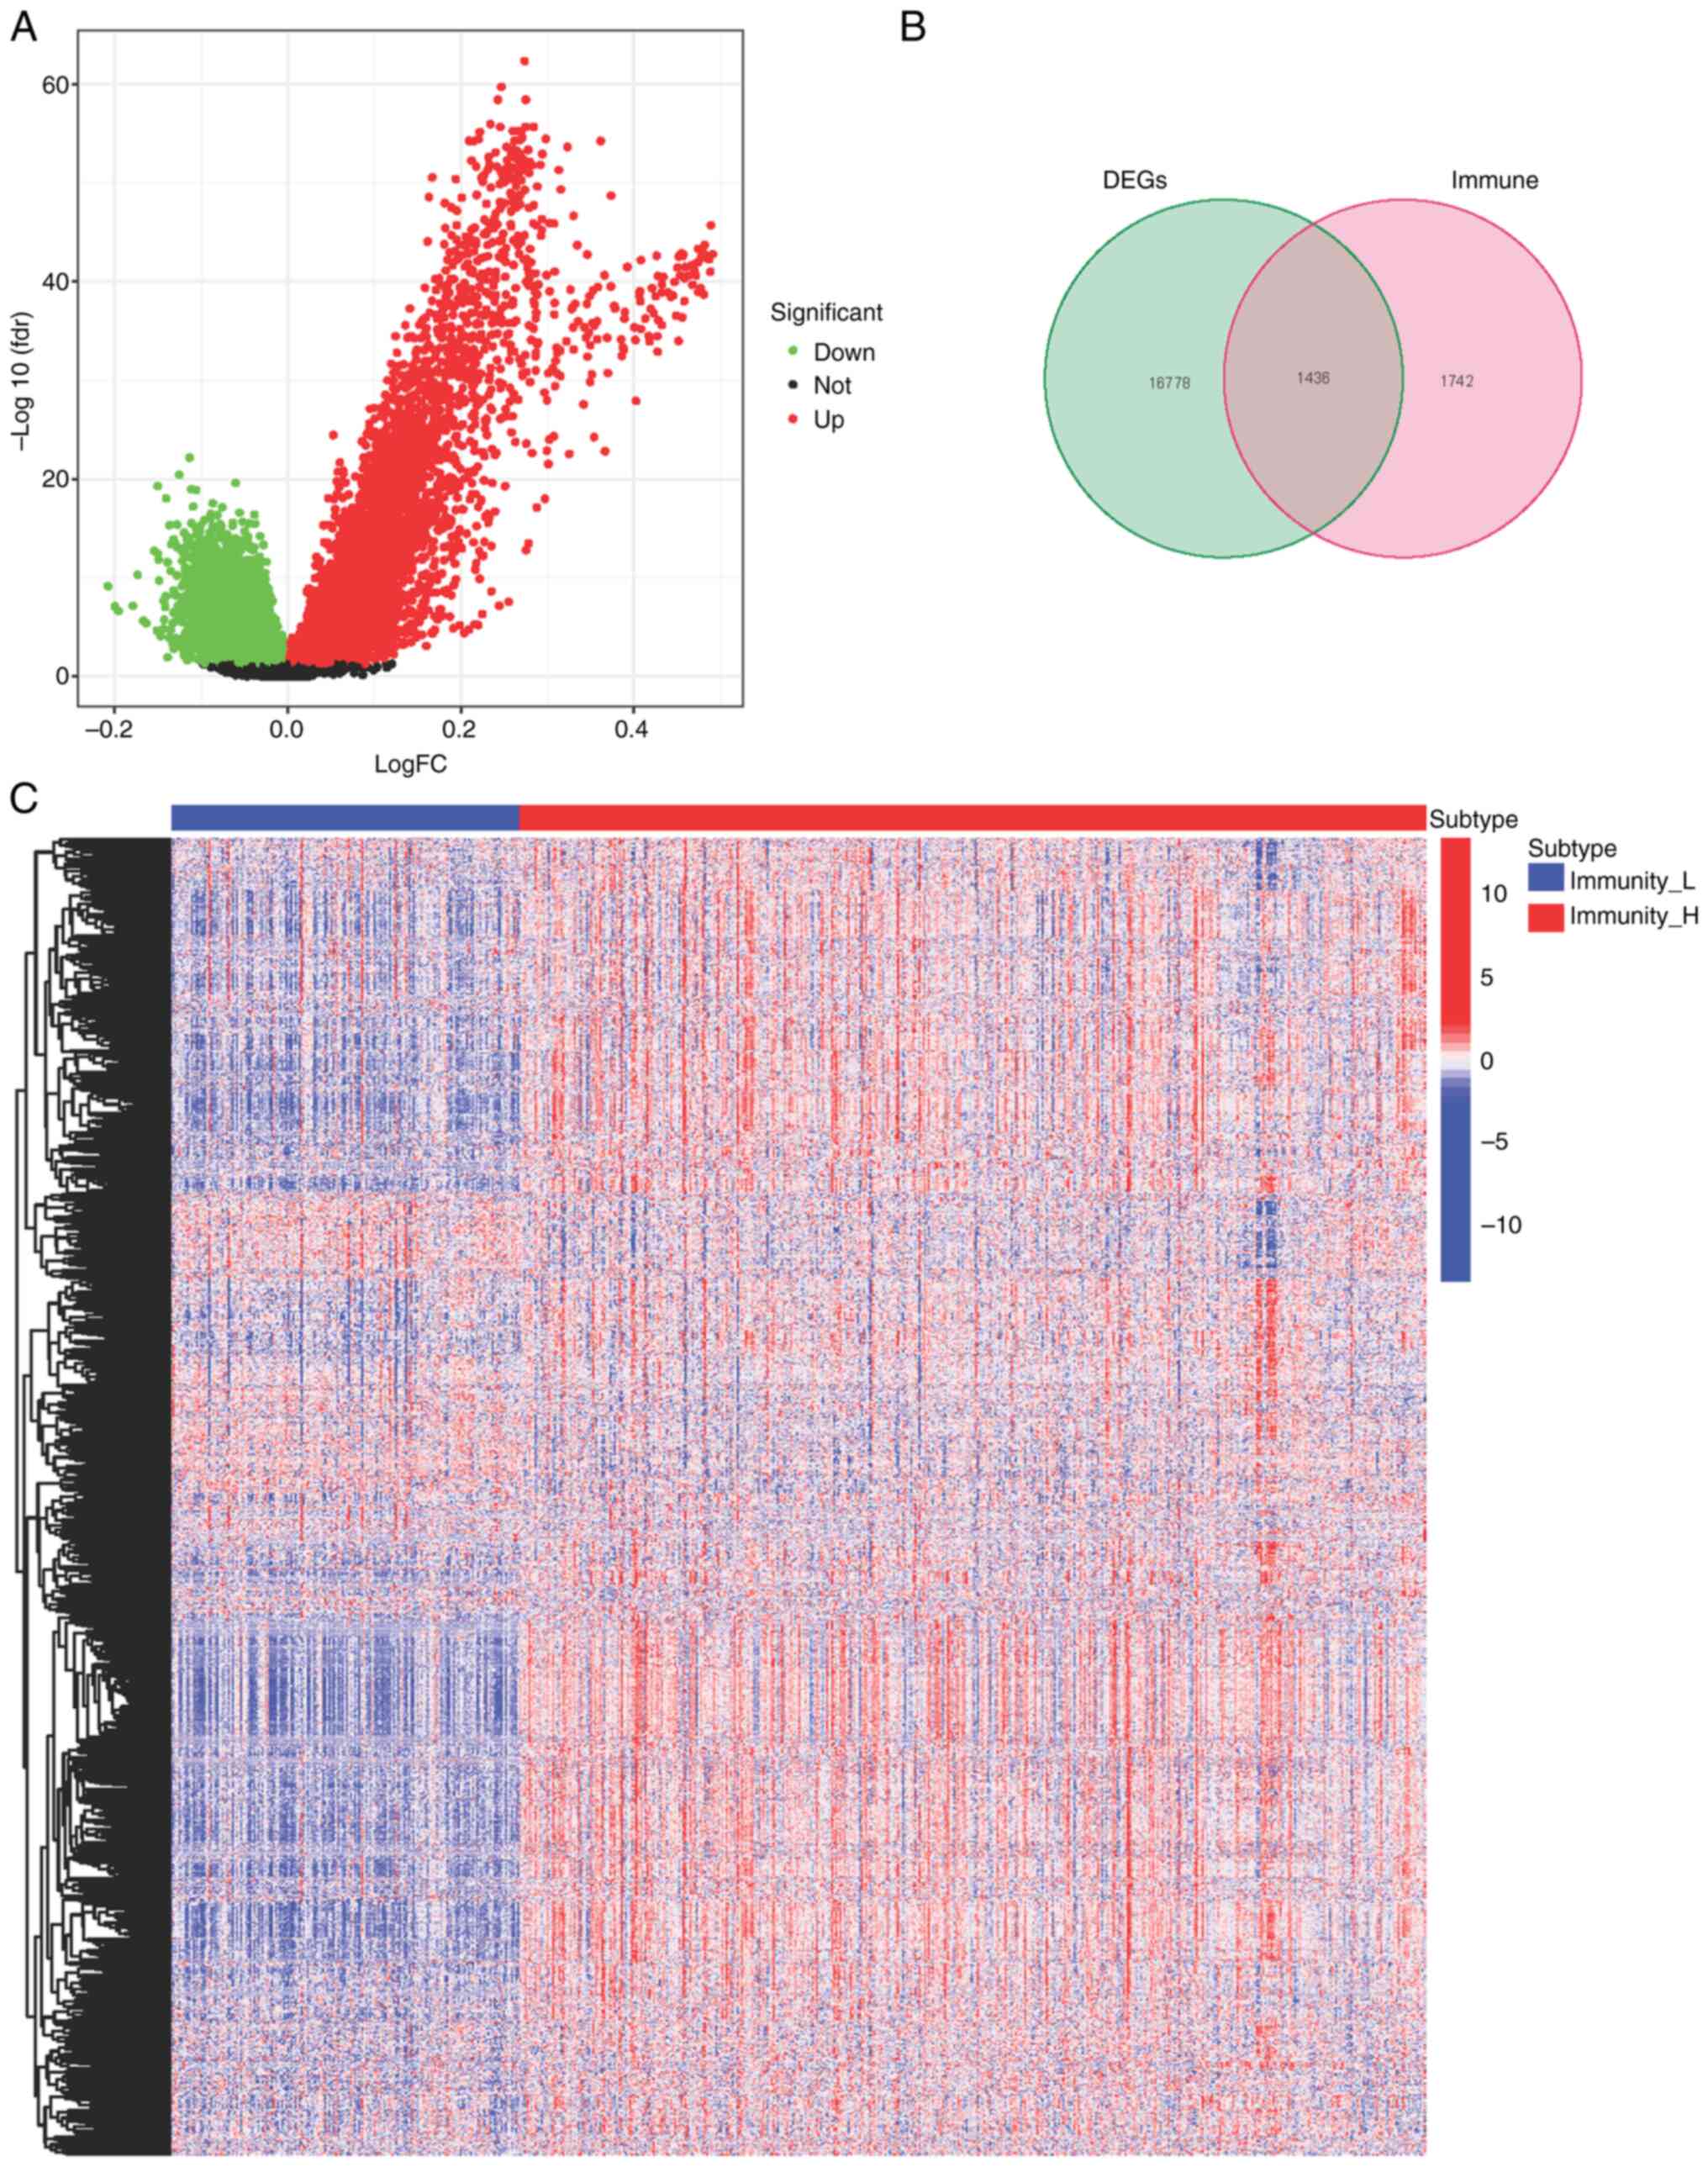
Differentially expressed genes (DEGs) between the
high- and low-immunity groups were assessed (Fig. 2A). Immune-related genes were
downloaded from two websites, ImmPort (https://www.immport.org/home) and innateDB (https://www.innatedb.com/). Among the DEGs, 1,436
genes were immune system related (Fig.
2B), with 1,195 being upregulated and 241 being downregulated
(Fig. 2C).
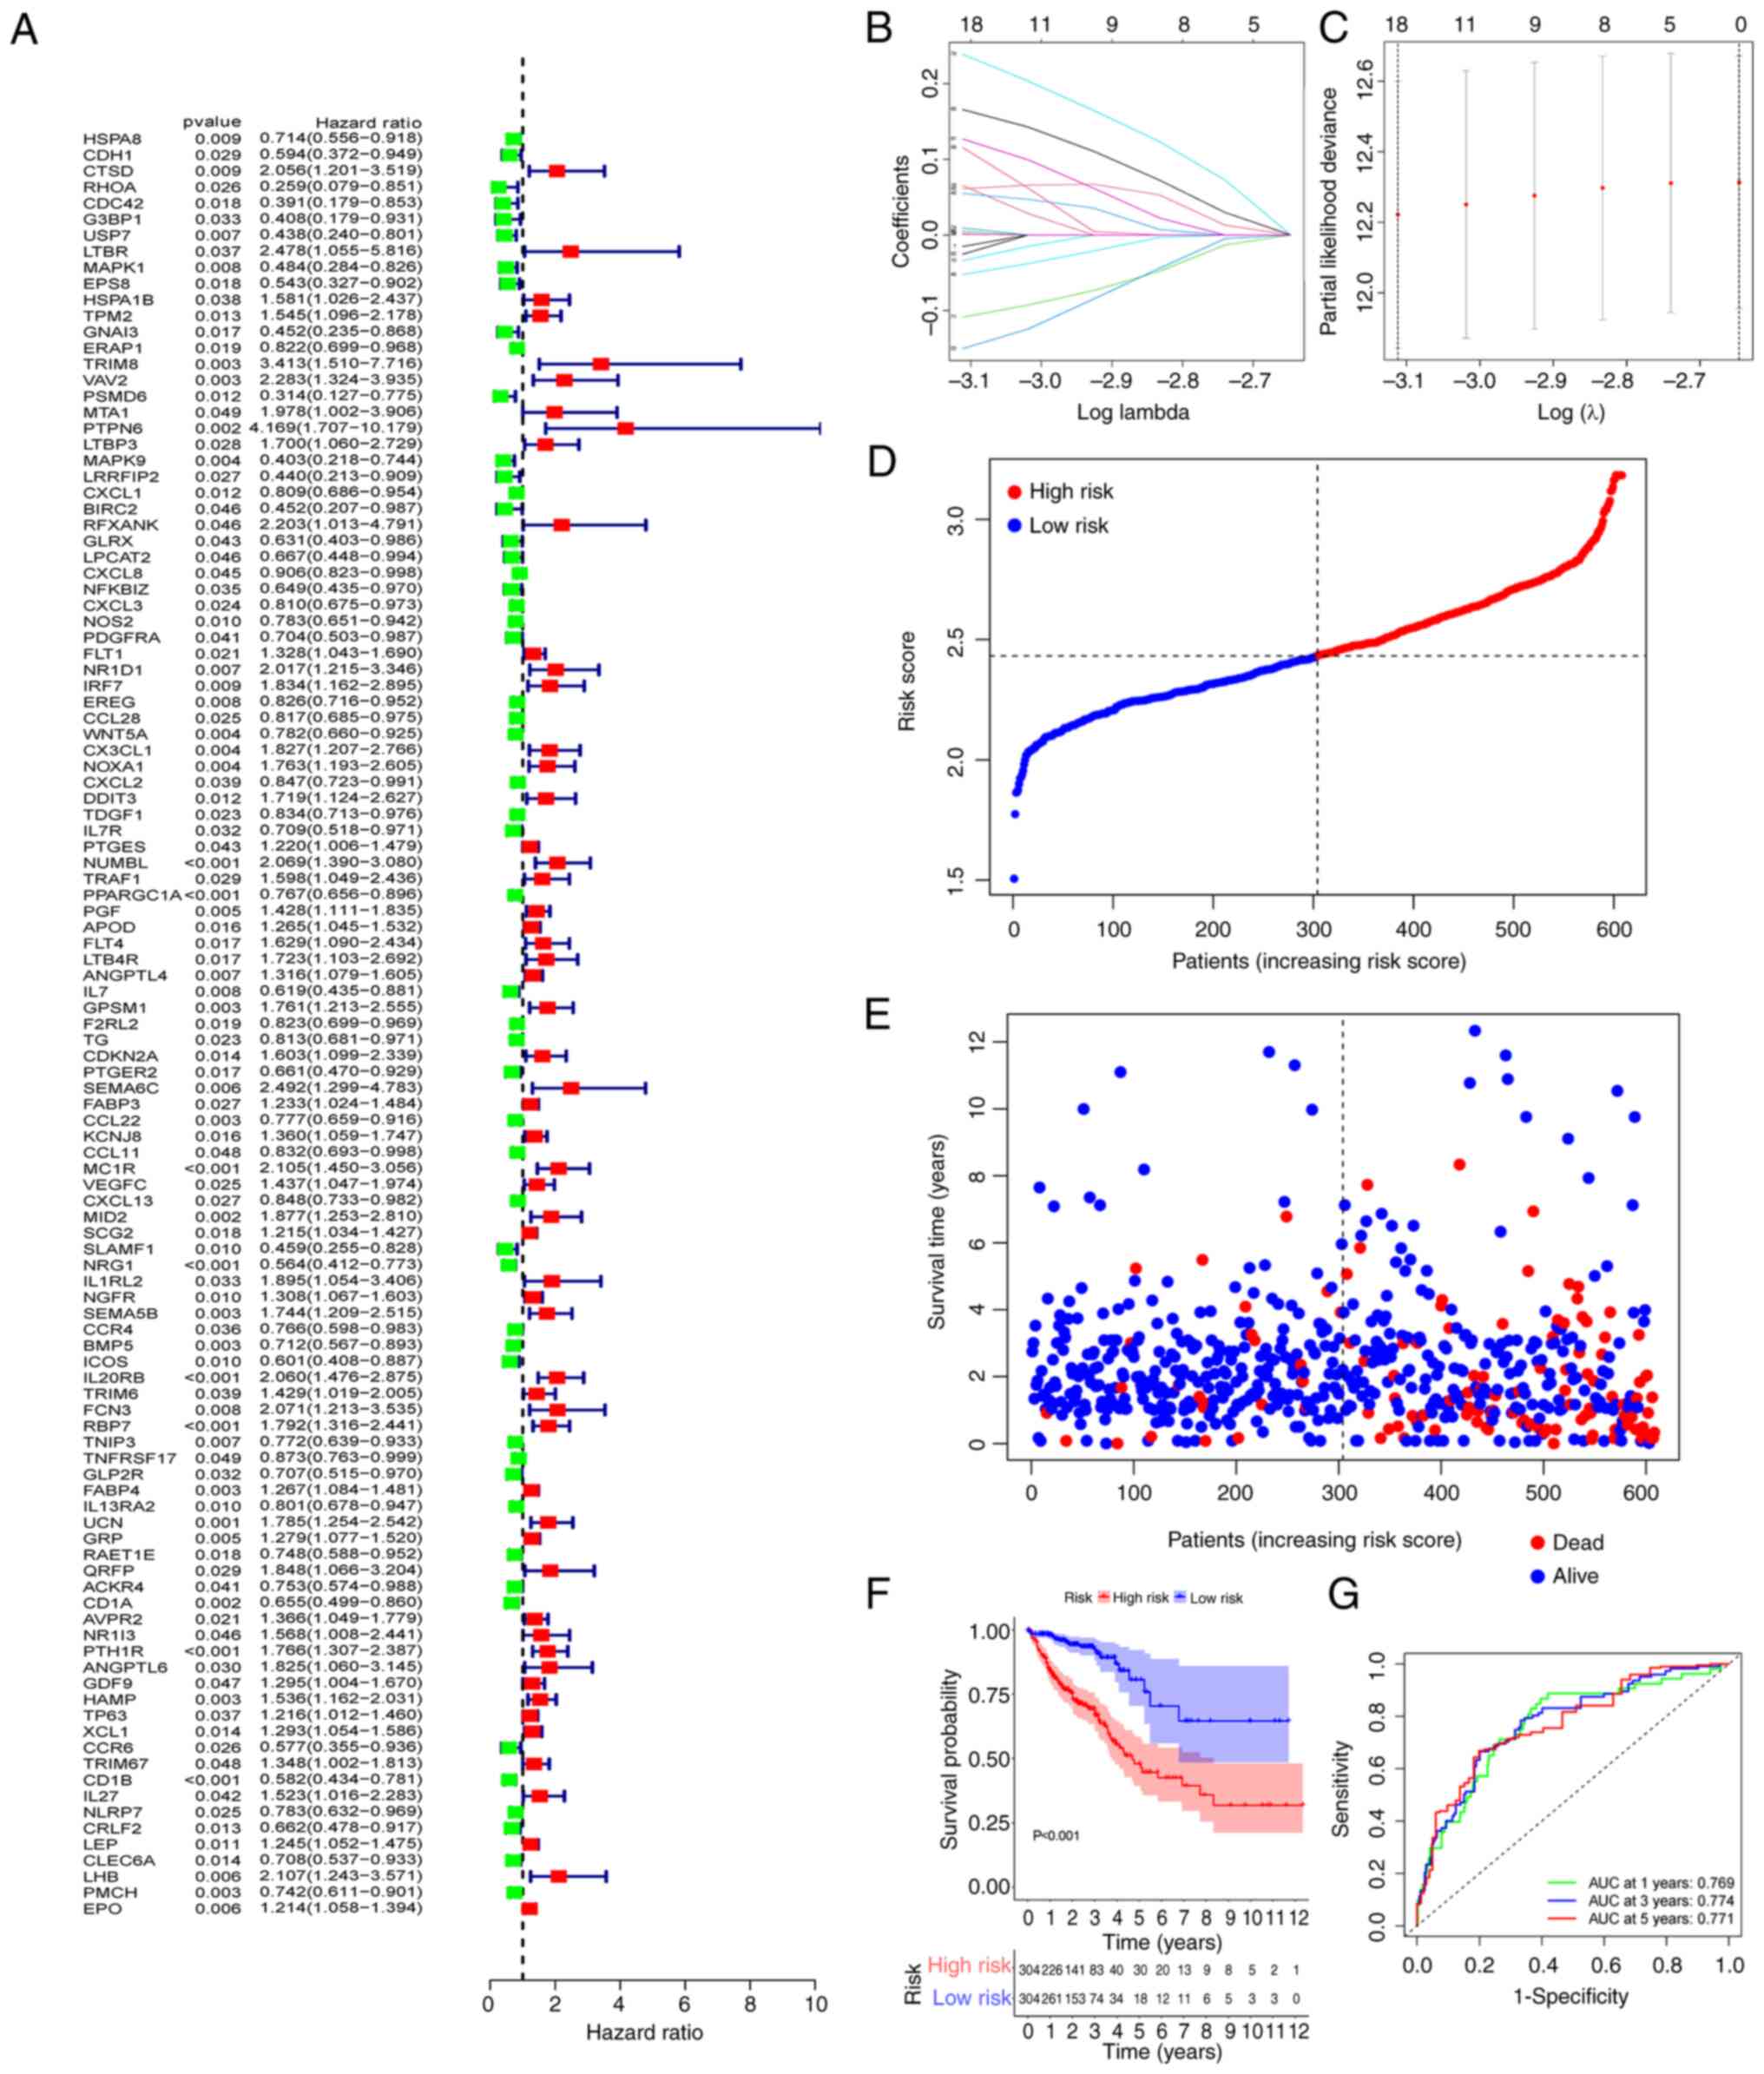
To construct a risk model, 111 mRNAs related to OS
were identified using the univariate analysis (Fig. 3A). Among the identified mRNAs, 18
genes were used to build a risk model by LASSO Cox regression
analysis. The risk score was calculated using the coefficients of
the 18 genes (Fig. 3B and C) as
follows: risk score=USP7 × (−0.0153034090477698) + VAV2 ×
0.0655011160044214 + CX3CL1 × 0.00124855618096817 + NUMBL ×
0.0548798283592552 + PPARGC1A × (−0.052320825824987) + ANGPTL4 ×
0.00461031918855942 + MC1R × 0.165908532485693 + MID2 ×
0.115738969177335 + NRG1 × (−0.108632261933379) + SEMA5B ×
0.00929691428939524 + IL20RB × 0.238904701764134 + RBP7 ×
0.127007108169451 + CD1A × (−0.0254834618450881) + PTH1R ×
0.0610074708594601 + HAMP × 0.00478998991273158 + CD1B ×
(−0.150298945645048) + PMCH × (−0.0339401840839164) + EPO ×
0.00100587552113195. The coefficient values of the 18 genes was
calculated by glmnet package using the coef function. Using the
median risk scores, the CRC patients were divided into high-risk
and low-risk groups. Patients' mortality and risk score
distributions were plotted (Fig. 3D and
E) and a higher death rate was demonstrated in patients in the
high-risk group. Compared with patients in the low-risk group,
those in the high-risk group had a significantly shorter overall
survival time (P<0.001; Fig.
3F). For assessment of the prognostic validity of the risk
score, ROC curves were generated, the area under the curve (AUC)
values of 0.769, 0.774 and 0.771 for 1, 3, and 5 year survival
rates respectively, indicated that the risk model was valid
(Fig. 3G).
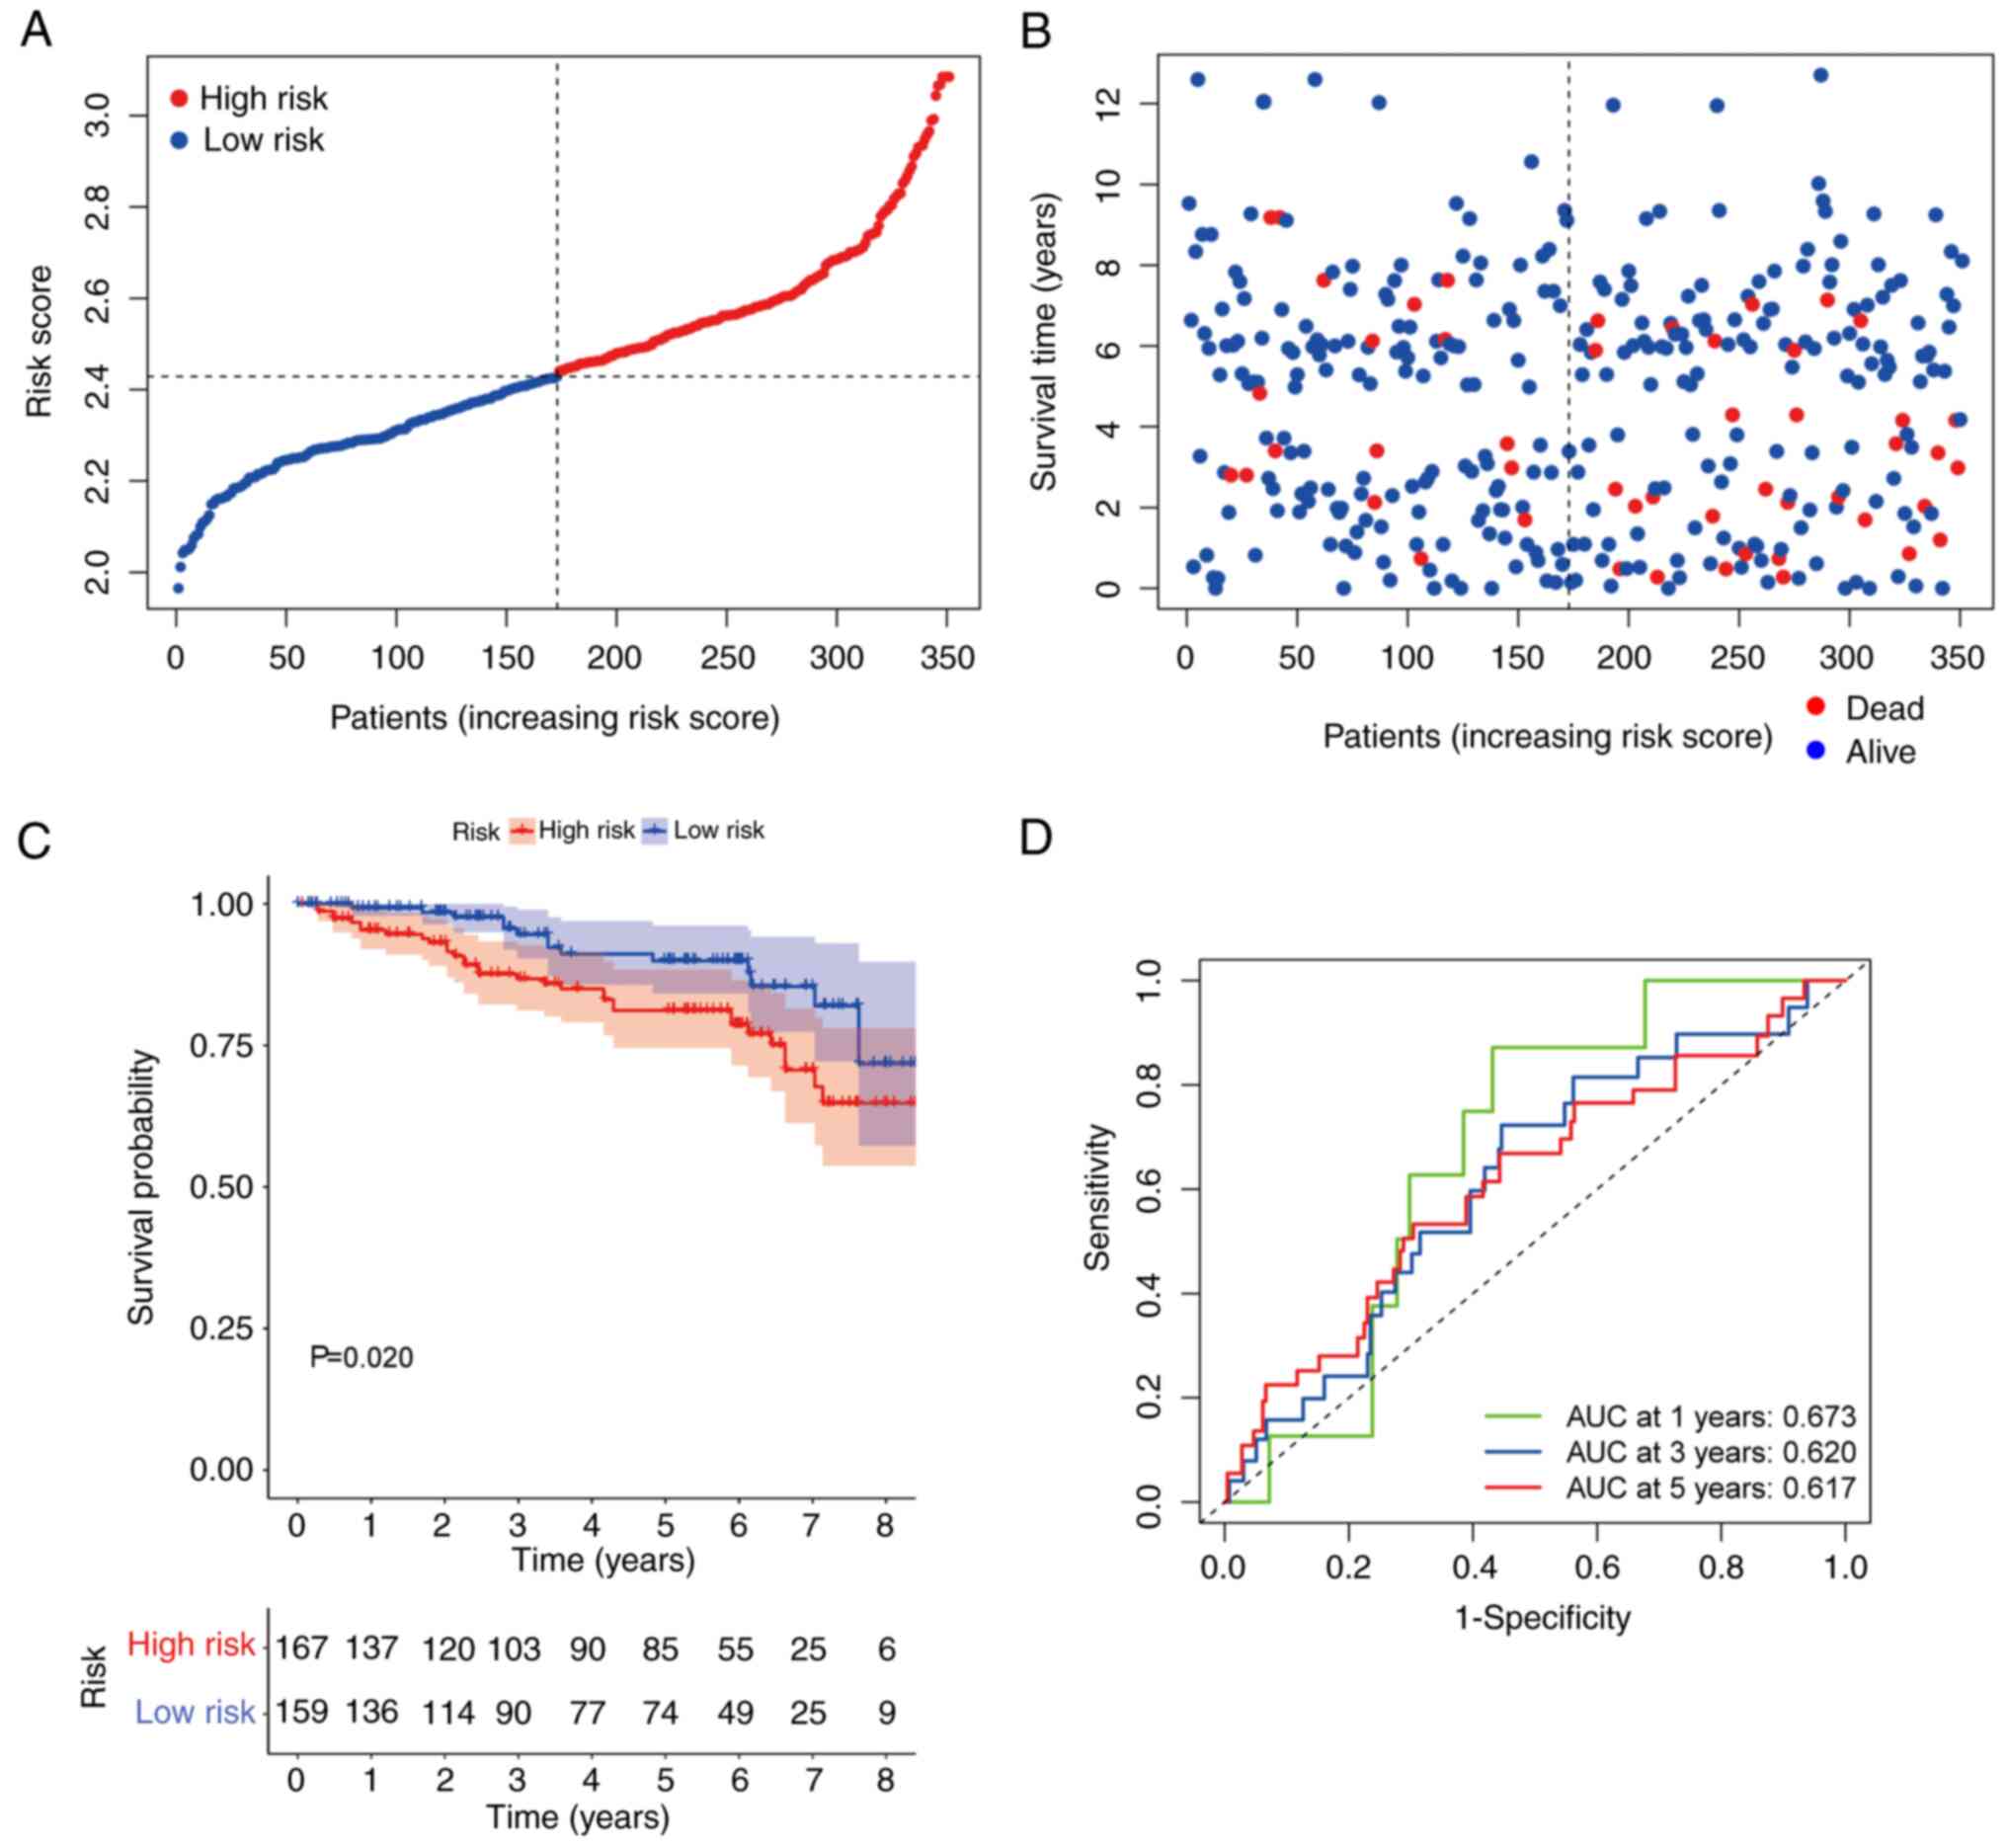
To better understand the value of the
immunity-related risk signature, a GEO cohort (GSE87211) with a
survival time <9 years was used to construct ROC curves and for
KM analysis. Consistent with the trend demonstrated in the TCGA
cohort, the OS in the high-risk group was shorter and the risk
scores were higher compared with the low-risk group (Fig. 4A and B). The patients in the
high-risk group in the GSE87211 dataset demonstrated significantly
shorter OS compared with those in the low-risk group (P=0.034;
Fig. 4C). ROC analysis was
performed to test the stability and robustness of the
immunity-related risk model. The AUC values were 0.673, 0.620, and
0.617 for 1, 3, and 5 year OS, respectively (Fig. 4D).
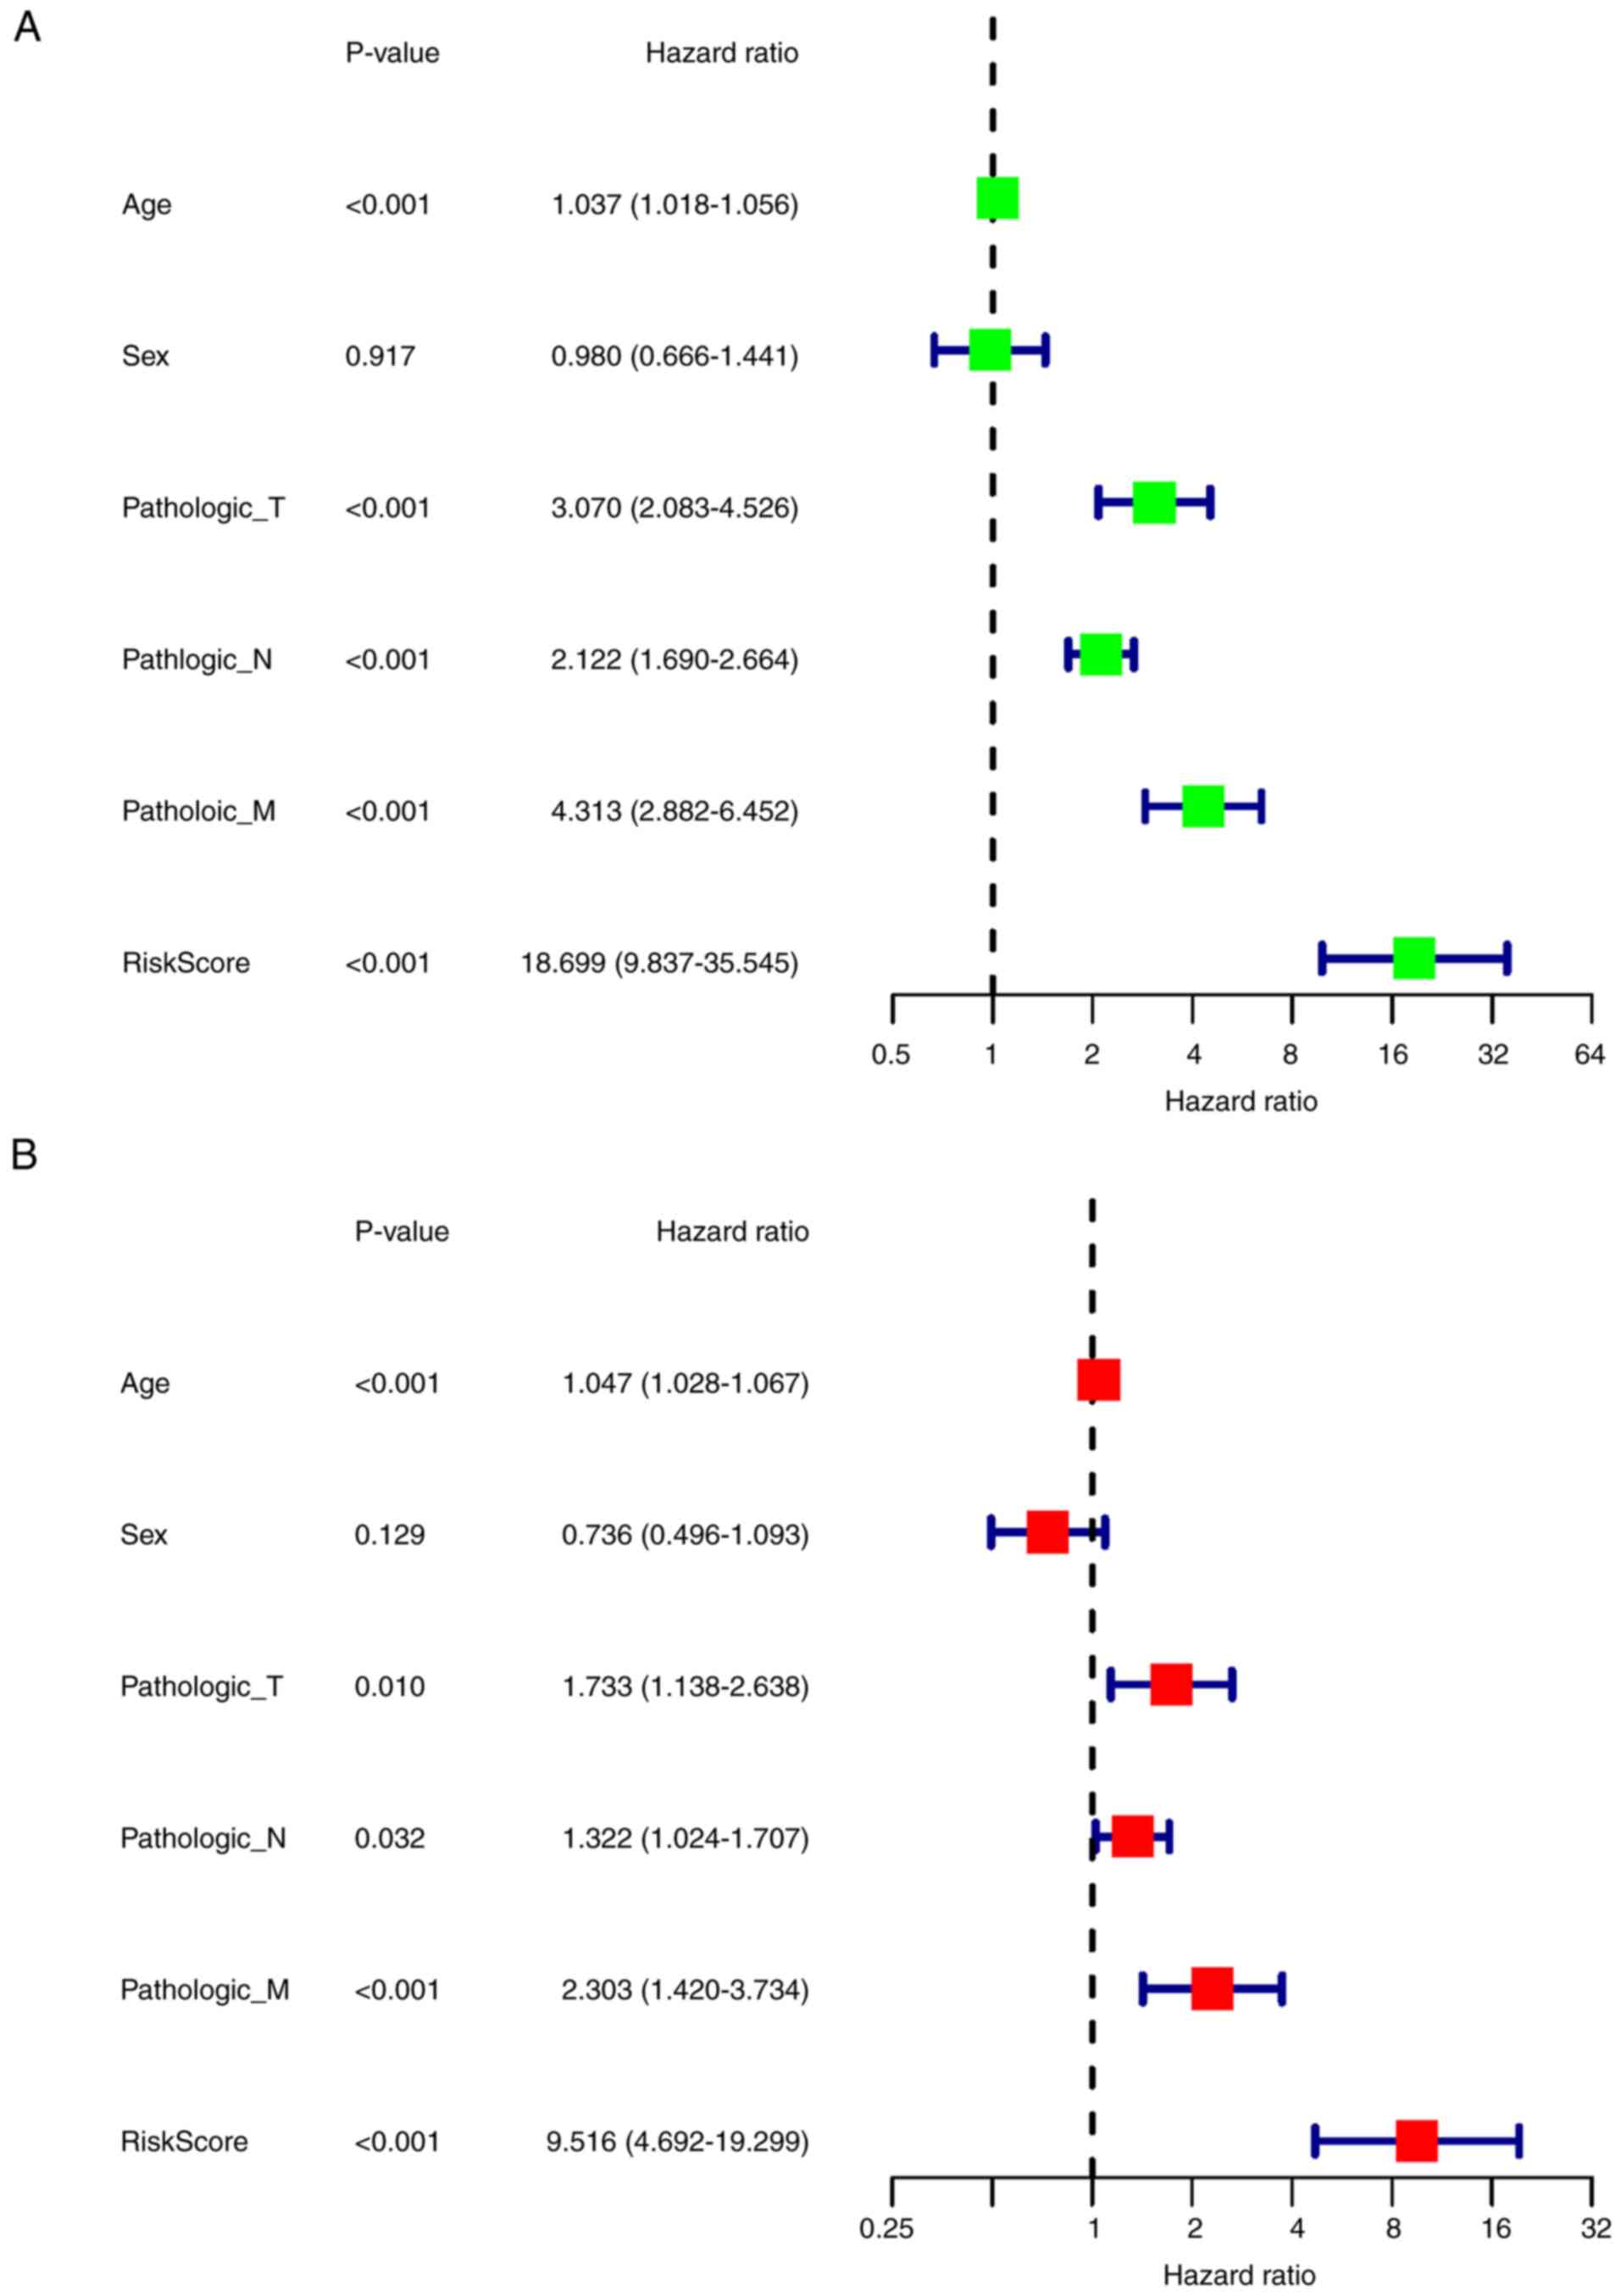
To evaluate the correlation between the clinical
features and the prognosis of CRC, univariate Cox regression
analysis was performed, which demonstrated that age, T stage, N
stage, M stage and risk score were significantly associated with OS
(P<0.001; Fig. 5A). More
importantly, multivariate Cox analysis demonstrated that risk score
could be an independent prognostic risk factor (P<0.001;
Fig. 5B).
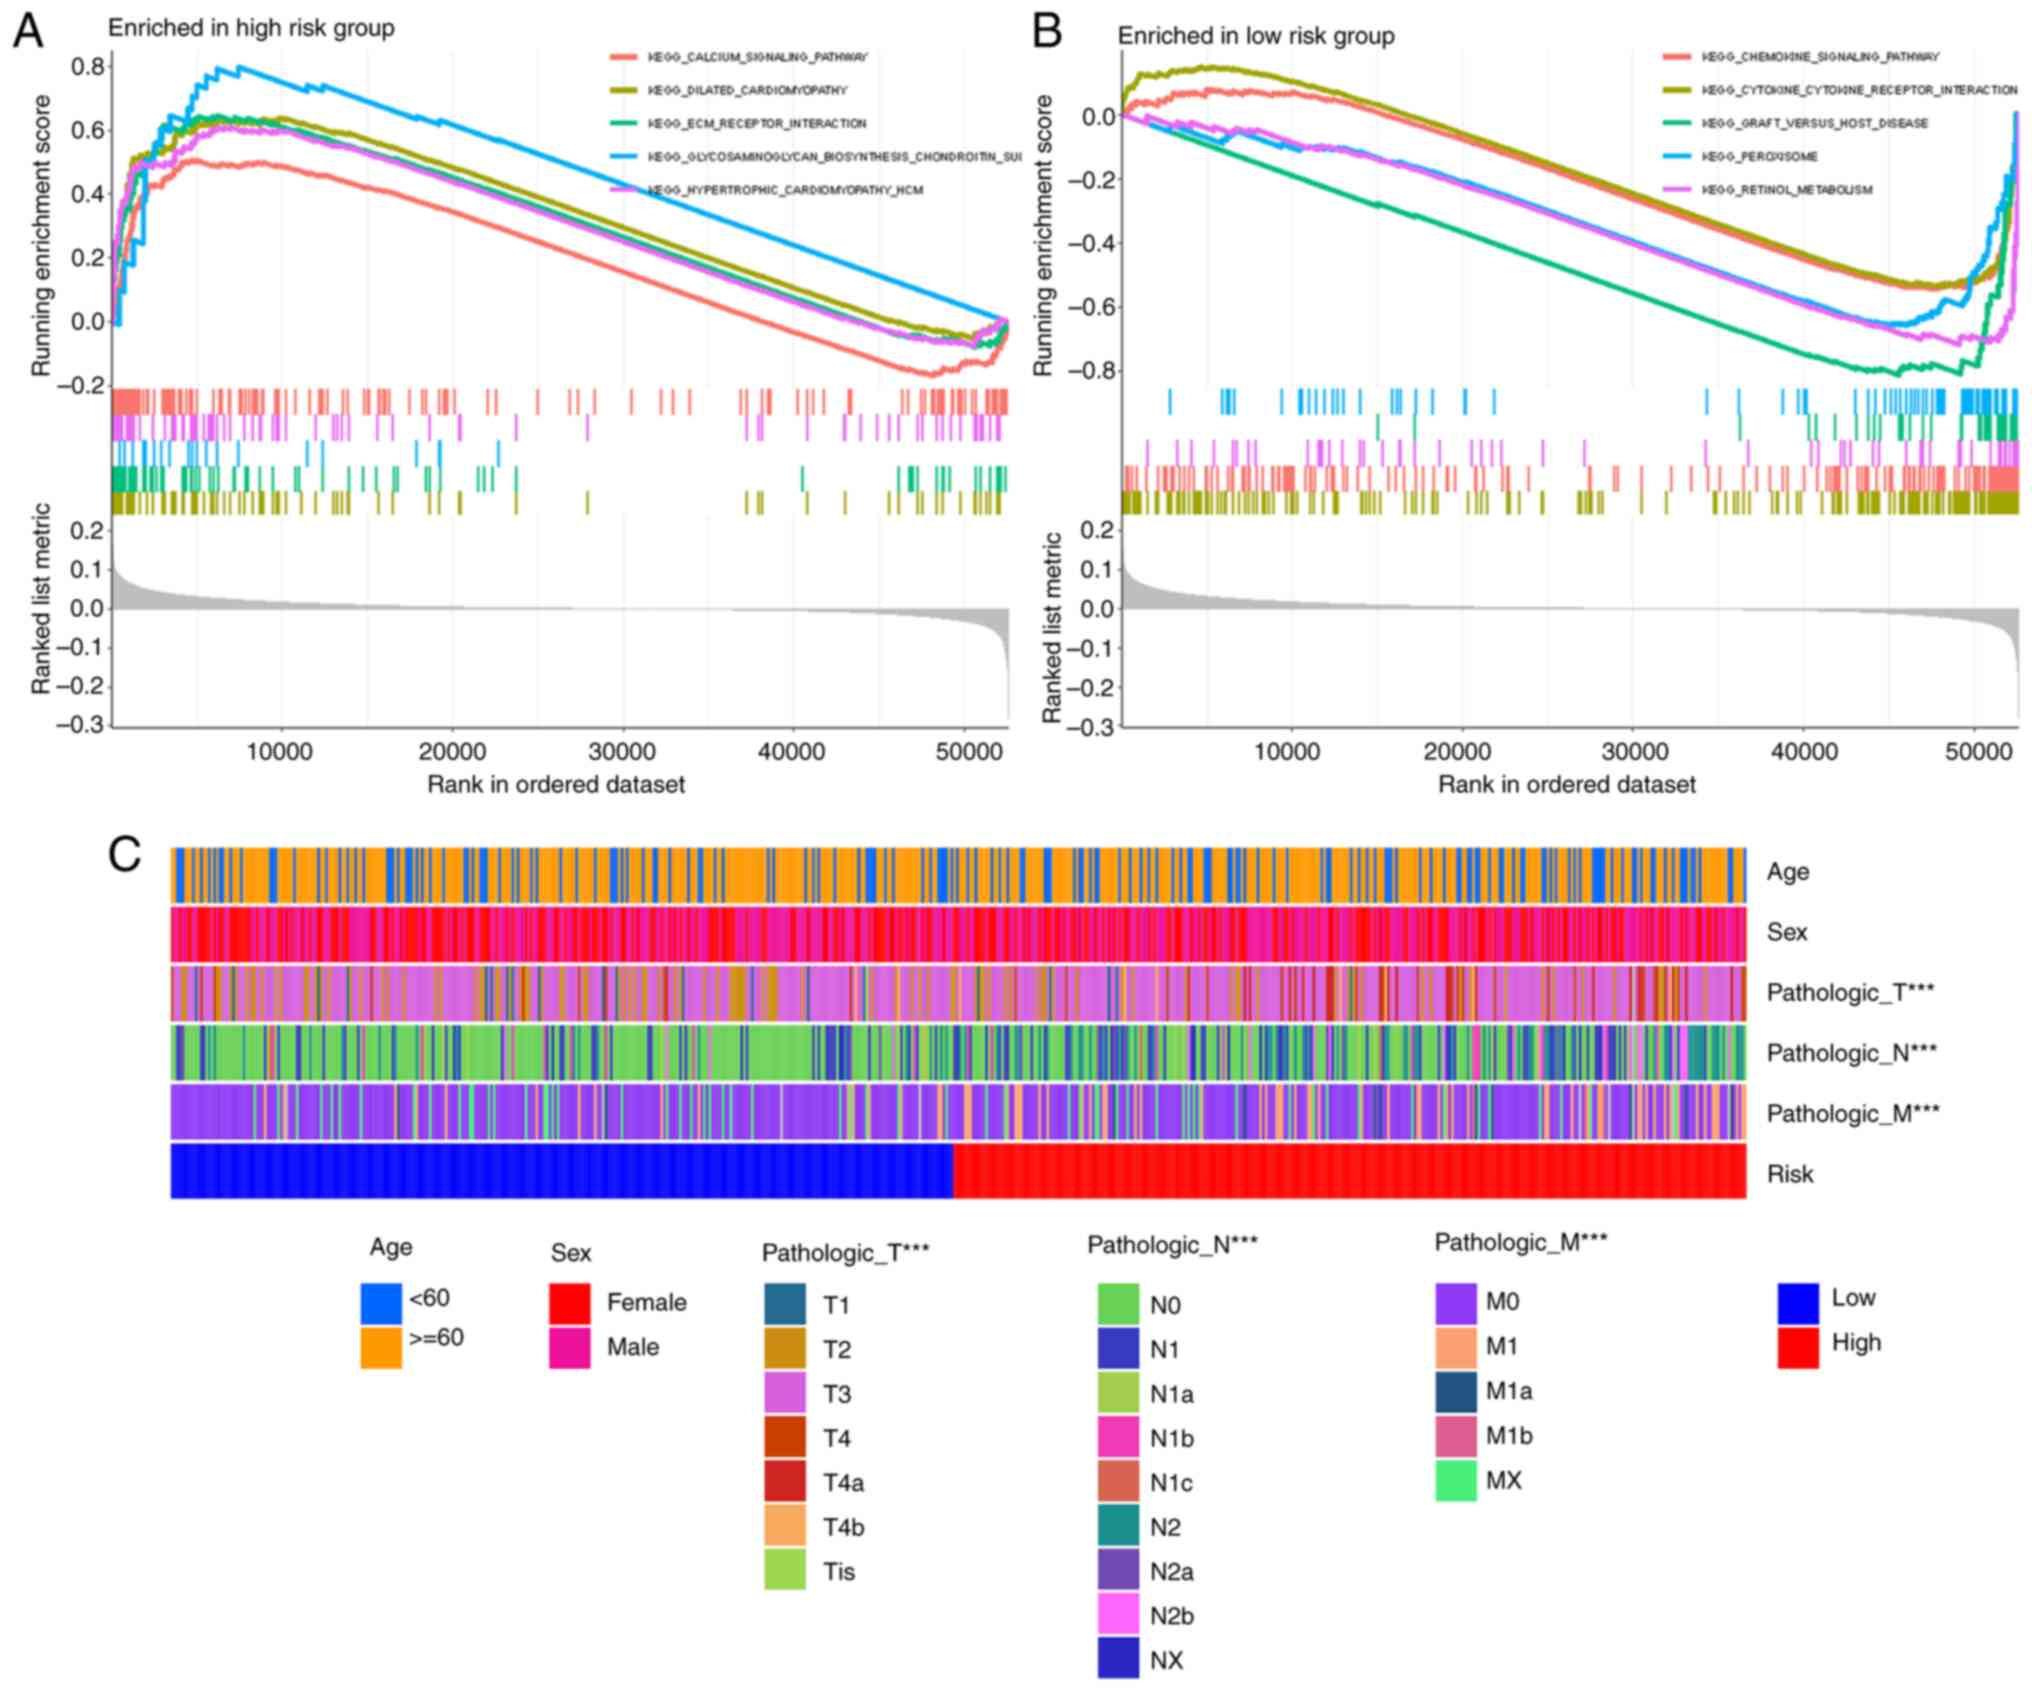
GSEA analysis indicated that the extracellular
matrix (ECM) receptor interaction was enriched in the high-risk
group (Fig. 6A), which directly or
indirectly controls cellular activities. Other enriched pathways in
the high-risk group involved calcium signaling, dilated
cardiomyopathy, hypertrophic cardiomyopathy and neuroactive ligand
receptor interaction (Fig. 6A). The
low-risk group demonstrated enrichment of pathways such as
chemokine signaling pathway or cytokine-cytokine receptor
interaction (Fig. 6B). The
correlation between risk score and clinical characteristics was
analyzed and there were significant differences in T, N and M
stages between the high- and low-risk groups, but there were no
differences in age and sex (Fig.
6C).
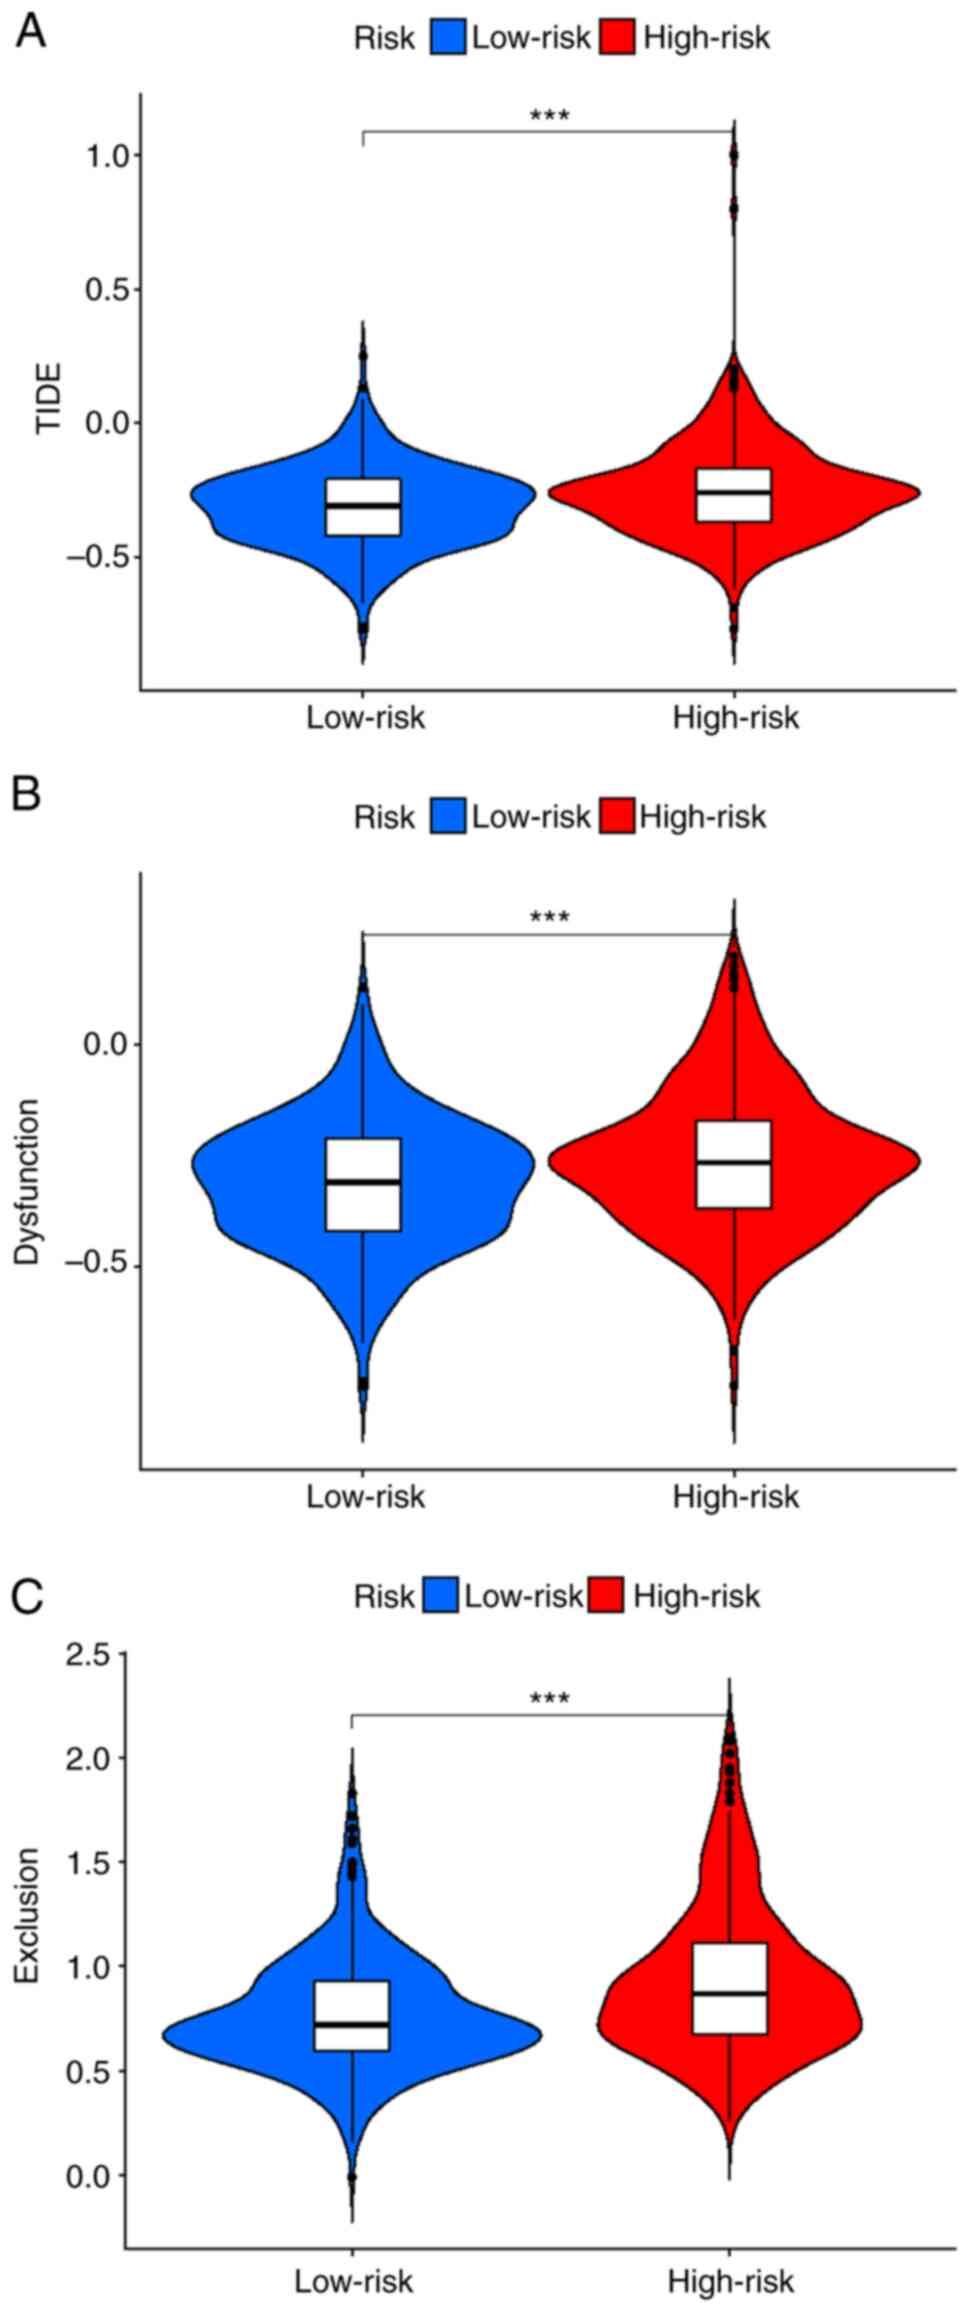
To evaluate the clinical function of the risk model,
the TIDE method was used to compare the differences in TIDE,
dysfunction and exclusion scores between high- and low-risk groups.
Patients in the high-risk group had higher scores for all measures
(P=8.3×10⁻⁵, P=9.5×10⁻⁵ and
P=1.1×10⁻⁸, respectively; Fig. 7). These findings suggested that the
poor immune response of patients in the high-risk group was due to
immune dysfunction and immune rejection.
CRC is the third most common type of malignant tumor
and the second most common cause of tumor-related death in the
United States (1). Targeted therapy
for CRC is still ineffective for patients with advanced tumors
(40). PD1 and PD-L1 are the main
indicators used to guide the use of immune checkpoint inhibitors
(41). A small number of patients
with MSI-H/dMMR have a durable response to immune checkpoint
inhibitor therapy, which can effectively prolong the OS of patients
with advanced CRC (42,43). However, the results in patients with
MSI-H/dMMR cannot be generalized to the entire patient population
receiving immune checkpoint inhibitor therapy. As the importance of
the immune microenvironment in tumor progression is increasingly
recognized, there is a critical need to elucidate the molecular
pathogenesis of colorectal cancer and to identify reliable
prognostic biomarkers based on the immune landscape (44).
In the present study, transcriptomic and clinical
information were downloaded from TCGA database and patients with
CRC were divided into high- and low-immunity groups based on ssGSEA
scores. Previous research reported a pan-cancer tumor inflammation
signature and divided patients into high- and low-immune groups,
and that patients with renal clear cell carcinoma (45), melanoma (46), lung tumors (47) and head and neck tumors (48) in the high-immune group were more
likely to be sensitive to immune checkpoint inhibitors. However,
this model has been reported to have limited predictive ability for
colorectal cancer (49), because
tumor cells could rapidly proliferate by transitioning from an
immune homeostasis state to an immune escape state. Therefore,
patients in the immune elimination and immune editing phases have
higher immunity and better prognosis (50). The antitumor role of the immune
system can be summarized as preventing pro-inflammatory effects,
protecting the host from viral infection and killing tumor cells
(51).
The present study demonstrated that the stromal
score, immune score and ESTIMATE score were higher in the
high-immune group. By performing CIBERSORT analyses, it was
demonstrated that the levels of CD8+ T cells and
macrophage M1 cells in the high-immune group were significantly
increased compared with the low-immune group. As key components of
the adaptive immune system, CD8+ T cells serve important
roles in immune defense against intracellular pathogens such as
viruses and bacteria, and tumors (52,53).
In general, cytotoxic T cells serve an important antitumor role
through interferon-γ, tumor necrosis factor-α, interleukin-2 and
interleukin-17 (54,55). An increase in T-cell infiltration is
more likely with high-immune status (56). Similarly, an increase in
CD8+ T cells was demonstrated in the high-immune group
in the present study. Tumors contain a large amount of macrophages,
and M1 macrophages have anti-tumor and pro-inflammatory effects
(57,58). Elevated CD8+ T cell
infiltration has been reported to be associated with better
prognosis in colorectal cancer (59), improved OS in oral squamous cell
carcinoma (59) and disease free
survival in laryngeal carcinoma (60–62).
High macrophage infiltration is also associated with improved
prognosis in colorectal cancer (63). These reports together with the
results of the present study explain why colorectal cancer patients
in the high-immune group have a better prognosis. By analyzing the
DEGs of the high- and low-immune groups, and the intersecting
immune-related genes from the ImmPort and innateDB immune
databases, a risk model was constructed for the identified
intersecting genes. Risk scores and clinical characteristics were
combined to evaluate the model's effectiveness, and the ROC curve
demonstrated the effectiveness of the model. Univariate and
multivariate analyses demonstrated that the model had a better
prognostic result than the TNM classification system. The risk
model was also validated using external GEO data (GSE87211).
Functional enrichment analysis of the high- and low-risk groups was
performed and the results demonstrated that the genes in the
high-risk group were mainly enriched in the ECM receptor signaling
pathway. To evaluate the predictive effect of the model for immune
checkpoint inhibitors, the TIDE algorithm was used, which
demonstrated that the high-risk group had a high score of immune
dysfunction and immune rejection, which may indicate a poor
response to immunotherapy (24,25).
Hepcidin, as an acute-phase protein, participates in
innate immune reactions in an interleukin-6 dependent manner
(71). Hepcidin in conventional
dendritic cells can promote mucosal repair in a nutritional
immunity manner (72). Macrophages
serve an important role in regulating iron levels with hepcidin,
which in turn influences inflammation, infection and possibly
cancer, and overexpression of hepcidin is linked with cancer
development and prognosis (73).
HAMP affects iron homeostasis, inflammation and
oxidative regulation through the mTOR, JAK/STAT and BMP/SMAD
signaling pathways (74–76). Hepcidin serves an important role in
the occurrence, development and metastasis of liver cancer. Iron
sensing is dysregulated in patients with liver cancer, which in
turn leads to the dysregulation of hepcidin. As such, hepcidin may
serve as a drug therapy target in liver cancer (77–79).
Hepcidin is also involved in breast cancers, promoting
proliferation, invasion and metastasis (80). In prostate cancer, hepcidin
dysregulation contributes to the development and progression of the
cancer (81,82). Serum hepcidin levels are
significantly correlated with lymph node metastasis status and T
stage in non-small cell lung cancer (83). In colorectal cancer, patients with
adequate iron have superior outcomes and increased response to
therapy (84). If hepcidin is
deficient, tumor number, burden and size are diminished (85–87). A
previous in vitro study reported that hepcidin promotes
growth in the colorectal cancer cell line HT-29 cell; however,
similar results were not reported in other colorectal cell types
(87). A previous
immunohistochemistry study reported that the positive rate of
hepcidin in CRC tissues was significantly higher than that in
adjacent tissues (88). In the
present study, differences in HAMP expression between
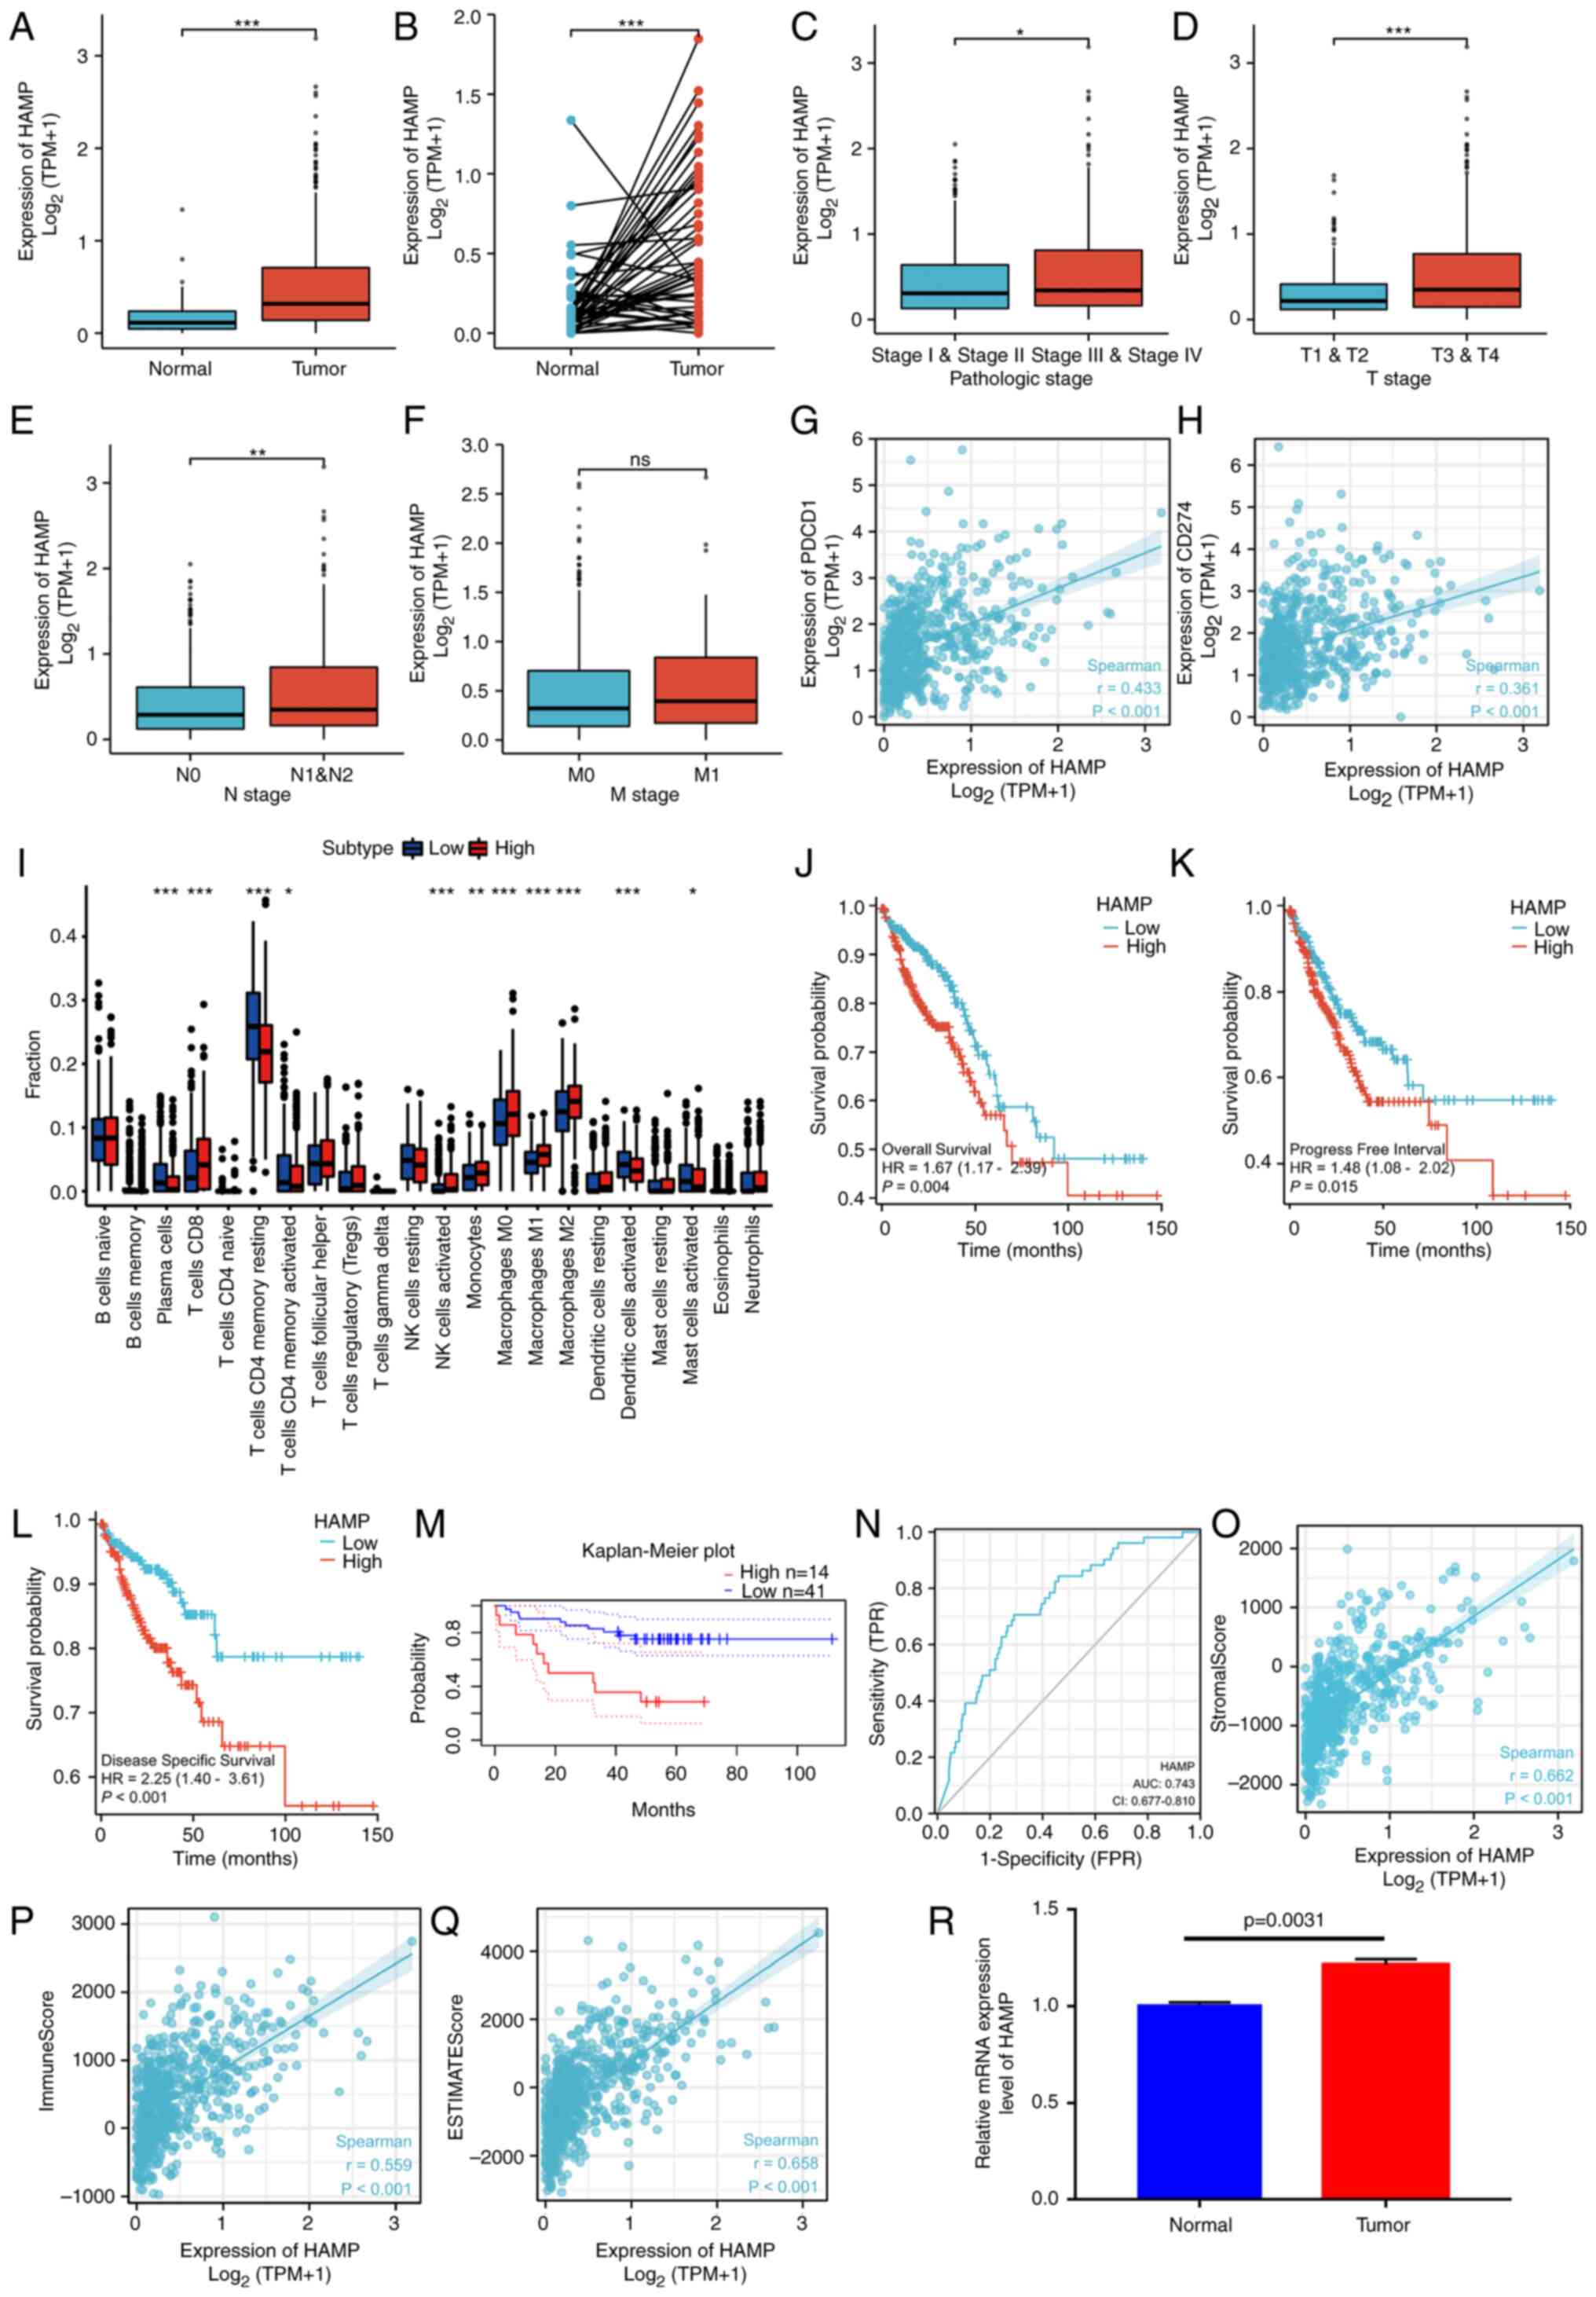
colorectal cancer and normal tissues were demonstrated.
Furthermore, in terms of clinical features, HAMP expression
was higher in patients with advanced clinical features (such as T1
and T2 vs. T3 and T4, and N0 vs. N1 and N2). Colorectal cancer
patients were divided into groups based on high and expression of
HAMP, using the median value of HAMP expression. Patients
with high HAMP expression had a worse prognosis.
Furthermore, in the high HAMP expression group,
CD8+ T cell and macrophage M1 cell levels were
significantly increased compared with the low HAMP
expression group. Finally, qPCR was performed using tissue samples
from colorectal cancer patients to verify the differences in
expression levels. Based on the results of the present study,
HAMP could be further used to identify target molecules for
subsequent studies and as possible treatment candidates.
The present study demonstrated for the first time,
to the best of our knowledge, the role of HAMP in the immune
microenvironment of colorectal cancer, combining the current immune
microenvironment with the ferroptosis hotspot. The present study
has certain limitations. These research findings are preliminary
and there are still mechanisms needing further elaboration.
Firstly, only the GEO database was used to verify the model, and
prospective clinical trial results are needed in the future.
Secondly, more clinical samples and in vivo and in
vitro experiments are needed to verify the role of HAMP
in colorectal cancer. Thirdly, the present study only analyzed the
risk model and the correlation between HAMP and immune cells
and immunotherapy. More clinical samples are needed to evaluate the
roles in the model and HAMP in immunotherapy in the future.
The mechanism of HAMP in the progression of colorectal
cancer still needs to be further elucidated, and clinical data and
molecular experiments are needed to verify these results.
The present study constructed an immune-related
prognostic model, and then identified the key gene HAMP,
which linked the immune microenvironment with ferroptosis. Risk
models and HAMP may provide evidence for colorectal cancer
prognosis and drug selection. The finding of HAMP gene as a
hub gene is significant and it is important to perform further
experiments to elucidate how this gene is related to colorectal
cancer. Furthermore, whether modified HAMP could change
tumor environment and allow more people to benefit from
immunotherapy or reverse immunotherapy resistance should be studied
further in future.
Not applicable.
This work was funded by the Fundamental Research Funds for the
Central Universities (grant no. 21JNQN14); the Technology
Development Cultivation of Program Southern Medical University
(grant no. KJ20161121); Guangdong Sci-tech Commissioner (grant no.
20211800500322); the National Natural Science Foundation of China
(grant no. 81803877); the Dongguan City Social Science and
Technology Development (Key) Project (grant no. 202050715001207);
and the Fundamental and Applied Basic Research Fund of Guangdong
Province (grant no. 2020B1515120063).
The datasets used and/or analyzed during the current
study are available from the corresponding author on reasonable
request.
HW, YW and XZ designed the study. HD collected the
data from databases and performed analyses. HW and HD organized and
arranged all the figures. SR and JC performed the experiments and
the formal analysis. YZ and MD collected tissue samples. HW and XZ
prepared and wrote the original draft of the manuscript. HW, HD, YW
and XZ reviewed and edited the manuscript. All authors read and
approved the final version of the manuscript. HW and HD confirm the
authenticity of all the raw data.
This study was approved by the Ethics Committee of
The Affiliated Dongguan People's Hospital of Southern Medical
University (approval no. KYKT2021-018) and informed consents was
provided by the patients. The study was conducted in accordance
with the Declaration of Helsinki.
Not applicable.
The authors declare that they have no competing
interests.
|
1
|
Sung H, Ferlay J, Siegel RL, Laversanne M,
Soerjomataram I, Jemal A and Bray F: Global Cancer Statistics 2020:
GLOBOCAN estimates of incidence and mortality worldwide for 36
cancers in 185 countries. CA Cancer J Clin. 71:209–249. 2021.
|
|
2
|
Siegel RL, Torre LA, Soerjomataram I,
Hayes RB, Bray F, Weber TK and Jemal A: Global patterns and trends
in colorectal cancer incidence in young adults. Gut. 68:2179–2185.
2019.
|
|
3
|
Kim MJ, Jeong SY, Choi SJ, Ryoo SB, Park
JW, Park KJ, Oh JH, Kang SB, Park HC, Heo SC and Park JG: Survival
paradox between stage IIB/C (T4N0) and stage IIIA (T1-2N1) colon
cancer. Ann Surg Oncol. 22:505–512. 2015.
|
|
4
|
Almatroudi A: The incidence rate of
colorectal cancer in Saudi Arabia: An observational descriptive
epidemiological analysis. Int J Gen Med. 13:977–990. 2020.
|
|
5
|
Gan GL, Liu J, Chen WJ, Ye QQ, Xu Y, Wu HT
and Li W: The diverse roles of the mucin gene cluster located on
chromosome 11p15.5 in colorectal cancer. Front Cell Dev Biol.
8:5142020.
|
|
6
|
Sasidharan Nair V, Saleh R, Taha RZ, Toor
SM, Murshed K, Ahmed AA, Kurer MA, Abu Nada M, Al Ejeh F and Elkord
E: Differential gene expression of tumor-infiltrating CD4+ T cells
in advanced versus early stage colorectal cancer and identification
of a gene signature of poor prognosis. Oncoimmunology.
9:18251782020.
|
|
7
|
Ihnát P, Vávra P and Zonča P: Treatment
strategies for colorectal carcinoma with synchronous liver
metastases: Which way to go. World J Gastroenterol. 21:7014–7021.
2015.
|
|
8
|
Mármol I, Sánchez-de-Diego C, Pradilla
Dieste A, Cerrada E and Rodriguez Yoldi MJ: Colorectal carcinoma: A
general overview and future perspectives in colorectal cancer. Int
J Mol Sci. 18:1972017.
|
|
9
|
Ciardiello D, Vitiello PP, Cardone C,
Martini G, Troiani T, Martinelli E and Ciardiello F: Immunotherapy
of colorectal cancer: Challenges for therapeutic efficacy. Cancer
Treat Rev. 76:22–32. 2019.
|
|
10
|
Cunningham D, Atkin W, Lenz HJ, Lynch HT,
Minsky B, Nordlinger B and Starling N: Colorectal cancer. Lancet.
375:1030–1047. 2010.
|
|
11
|
de Weger VA, Turksma AW, Voorham QJ, Euler
Z, Bril H, van den Eertwegh AJ, Bloemena E, Pinedo HM, Vermorken
JB, van Tinteren H, et al: Clinical effects of adjuvant active
specific immunotherapy differ between patients with
microsatellite-stable and microsatellite-instable colon cancer.
Clin Cancer Res. 18:882–889. 2012.
|
|
12
|
Le DT, Uram JN, Wang H, Bartlett BR,
Kemberling H, Eyring AD, Skora AD, Luber BS, Azad NS, Laheru D, et
al: PD-1 blockade in tumors with mismatch-repair deficiency. N Engl
J Med. 372:2509–2520. 2015.
|
|
13
|
Benson AB, Venook AP, Al-Hawary MM, Azad
N, Chen YJ, Ciombor KK, Cohen S, Cooper HS, Deming D,
Garrido-Laguna I, et al: Rectal cancer, version 2.2022, NCCN
clinical practice guidelines in oncology. J Natl Compr Canc Netw.
20:1139–1167. 2022.
|
|
14
|
Koncina E, Haan S, Rauh S and Letellier E:
Prognostic and predictive molecular biomarkers for colorectal
cancer: Updates and challenges. Cancers (Basel). 12:3192020.
|
|
15
|
Vacante M, Borzì AM, Basile F and Biondi
A: Biomarkers in colorectal cancer: Current clinical utility and
future perspectives. World J Clin Cases. 6:869–881. 2018.
|
|
16
|
Amado RG, Wolf M, Peeters M, Van Cutsem E,
Siena S, Freeman DJ, Juan T, Sikorski R, Suggs S, Radinsky R, et
al: Wild-type KRAS is required for panitumumab efficacy in patients
with metastatic colorectal cancer. J Clin Oncol. 26:1626–1634.
2008.
|
|
17
|
Bokemeyer C, Bondarenko I, Makhson A,
Hartmann JT, Aparicio J, de Braud F, Donea S, Ludwig H, Schuch G,
Stroh C, et al: Fluorouracil, leucovorin, and oxaliplatin with and
without cetuximab in the first-line treatment of metastatic
colorectal cancer. J Clin Oncol. 27:663–671. 2009.
|
|
18
|
Douillard J, Oliner KS, Siena S, Tabernero
J, Burkes R, Barugel M, Humblet Y, Bodoky G, Cunningham D, Jassem
J, et al: Panitumumab-FOLFOX4 treatment and RAS mutations in
colorectal cancer. N Engl J Med. 369:1023–1034. 2013.
|
|
19
|
Karapetis CS, Khambata-Ford S, Jonker DJ,
O'Callaghan CJ, Tu D, Tebbutt NC, Simes RJ, Chalchal H, Shapiro JD,
Robitaille S, et al: K-ras mutations and benefit from cetuximab in
advanced colorectal cancer. N Engl J Med. 359:1757–1765. 2008.
|
|
20
|
Sorich MJ, Wiese MD, Rowland A,
Kichenadasse G, McKinnon RA and Karapetis CS: Extended RAS
mutations and anti-EGFR monoclonal antibody survival benefit in
metastatic colorectal cancer: A meta-analysis of randomized,
controlled trials. Ann Oncol. 26:13–21. 2015.
|
|
21
|
Van Cutsem E, Köhne CH, Láng I, Folprecht
G, Nowacki MP, Cascinu S, Shchepotin I, Maurel J, Cunningham D,
Tejpar S, et al: Cetuximab plus irinotecan, fluorouracil, and
leucovorin as first-line treatment for metastatic colorectal
cancer: Updated analysis of overall survival according to tumor
KRAS and BRAF mutation status. J Clin Oncol. 29:2011–2019.
2011.
|
|
22
|
Maughan TS, Adams RA, Smith CG, Meade AM,
Seymour MT, Wilson RH, Idziaszczyk S, Harris R, Fisher D, Kenny SL,
et al: Addition of cetuximab to oxaliplatin-based first-line
combination chemotherapy for treatment of advanced colorectal
cancer: Results of the randomised phase 3 MRC COIN trial. Lancet.
377:2103–2114. 2011.
|
|
23
|
Le DT, Kim TW, Van Cutsem E, Geva R, Jäger
D, Hara H, Burge M, O'Neil B, Kavan P, Yoshino T, et al: Phase II
open-label study of pembrolizumab in treatment-refractory,
microsatellite instability-high/mismatch repair-deficient
metastatic colorectal cancer: KEYNOTE-164. J Clin Oncol. 38:11–19.
2020.
|
|
24
|
Fu J, Li K, Zhang W, Wan C, Zhang J, Jiang
P and Liu XS: Large-scale public data reuse to model immunotherapy
response and resistance. Genome Med. 12:212020.
|
|
25
|
Jiang P, Gu S, Pan D, Fu J, Sahu A, Hu X,
Li Z, Traugh N, Bu X, Li B, et al: Signatures of T cell dysfunction
and exclusion predict cancer immunotherapy response. Nat Med.
24:1550–1558. 2018.
|
|
26
|
Love MI, Huber W and Anders S: Moderated
estimation of fold change and dispersion for RNA-seq data with
DESeq2. Genome Biol. 15:5502014.
|
|
27
|
Wang X, Duanmu J, Fu X, Li T and Jiang Q:
Analyzing and validating the prognostic value and mechanism of
colon cancer immune microenvironment. J Transl Med. 18:3242020.
|
|
28
|
Li L, Zhang W, Qiu J, Zhang W, Lu M, Wang
J, Jin Y and Xi Q: Stem cell-associated signatures help to predict
diagnosis and prognosis in ovarian serous cystadenocarcinoma. Stem
Cells Int. 2023:45005612023.
|
|
29
|
Hänzelmann S, Castelo R and Guinney J:
GSVA: Gene set variation analysis for microarray and RNA-Seq data.
BMC Bioinformatics. 14:72013.
|
|
30
|
Ritchie ME, Phipson B, Wu D, Hu Y, Law CW,
Shi W and Smyth GK: Limma powers differential expression analyses
for RNA-sequencing and microarray studies. Nucleic Acids Res.
43:e472015.
|
|
31
|
Finotello F, Mayer C, Plattner C,
Laschober G, Rieder D, Hackl H, Krogsdam A, Loncova Z, Posch W,
Wilflingseder D, et al: Molecular and pharmacological modulators of
the tumor immune contexture revealed by deconvolution of RNA-seq
data. Genome Med. 11:342019.
|
|
32
|
Yoshihara K, Shahmoradgoli M, Martínez E,
Vegesna R, Kim H, Torres-Garcia W, Treviño V, Shen H, Laird PW,
Levine DA, et al: Inferring tumour purity and stromal and immune
cell admixture from expression data. Nat Commun. 4:26122013.
|
|
33
|
Newman AM, Liu CL, Green MR, Gentles AJ,
Feng W, Xu Y, Hoang CD, Diehn M and Alizadeh AA: Robust enumeration
of cell subsets from tissue expression profiles. Nat Methods.
12:453–457. 2015.
|
|
34
|
Wu T, Hu E, Xu S, Chen M, Guo P, Dai Z,
Feng T, Zhou L, Tang W, Zhan L, et al: clusterProfiler 4.0: A
universal enrichment tool for interpreting omics data. Innovation
(Camb). 2:1001412021.
|
|
35
|
Yu G, Wang LG, Han Y and He QY:
clusterProfiler: An R package for comparing biological themes among
gene clusters. OMICS. 16:284–287. 2012. View Article : Google Scholar : PubMed/NCBI
|
|
36
|
Subramanian A, Tamayo P, Mootha VK,
Mukherjee S, Ebert BL, Gillette MA, Paulovich A, Pomeroy SL, Golub
TR, Lander ES and Mesirov JP: Gene set enrichment analysis: A
knowledge-based approach for interpreting genome-wide expression
profiles. Proc Natl Acad Sci USA. 102:15545–15550. 2005. View Article : Google Scholar : PubMed/NCBI
|
|
37
|
Chin CH, Chen SH, Wu HH, Ho CW, Ko MT and
Lin CY: cytoHubba: Identifying hub objects and sub-networks from
complex interactome. BMC Syst Biol. 8 (Suppl 4):S112014. View Article : Google Scholar : PubMed/NCBI
|
|
38
|
Livak KJ and Schmittgen TD: Analysis of
relative gene expression data using real-time quantitative PCR and
the 2(−Delta Delta C(T)) Method. Methods. 25:402–408. 2001.
View Article : Google Scholar : PubMed/NCBI
|
|
39
|
Liu J, Lichtenberg T, Hoadley KA, Poisson
LM, Lazar AJ, Cherniack AD, Kovatich AJ, Benz CC, Levine DA, Lee
AV, et al: An integrated TCGA pan-cancer clinical data resource to
drive high-quality survival outcome analytics. Cell.
173:400–416.e11. 2018. View Article : Google Scholar : PubMed/NCBI
|
|
40
|
Tang YL, Li DD, Duan JY, Sheng LM and Wang
X: Resistance to targeted therapy in metastatic colorectal cancer:
Current status and new developments. World J Gastroenterol.
29:926–948. 2023. View Article : Google Scholar : PubMed/NCBI
|
|
41
|
Seliger B: Basis of PD1/PD-L1 Therapies. J
Clin Med. 8:21682019. View Article : Google Scholar : PubMed/NCBI
|
|
42
|
Pitt JM, Vétizou M, Daillère R, Roberti
MP, Yamazaki T, Routy B, Lepage P, Boneca IG, Chamaillard M,
Kroemer G and Zitvogel L: Resistance mechanisms to
immune-checkpoint blockade in cancer: Tumor-intrinsic and
-extrinsic factors. Immunity. 44:1255–1269. 2016. View Article : Google Scholar : PubMed/NCBI
|
|
43
|
Sun C, Mezzadra R and Schumacher TN:
Regulation and function of the PD-L1 checkpoint. Immunity.
48:434–452. 2018. View Article : Google Scholar : PubMed/NCBI
|
|
44
|
Chen DS and Mellman I: Elements of cancer
immunity and the cancer-immune set point. Nature. 541:321–330.
2017. View Article : Google Scholar : PubMed/NCBI
|
|
45
|
Horn L, Spigel DR, Vokes EE, Holgado E,
Ready N, Steins M, Poddubskaya E, Borghaei H, Felip E, Paz-Ares L,
et al: Nivolumab versus docetaxel in previously treated patients
with advanced non-small-cell lung cancer: Two-Year outcomes from
two randomized, open-label, phase III trials (CheckMate 017 and
CheckMate 057). J Clin Oncol. 35:3924–3933. 2017. View Article : Google Scholar : PubMed/NCBI
|
|
46
|
Topalian SL, Sznol M, McDermott DF, Kluger
HM, Carvajal RD, Sharfman WH, Brahmer JR, Lawrence DP, Atkins MB,
Powderly JD, et al: Survival, durable tumor remission, and
long-term safety in patients with advanced melanoma receiving
nivolumab. J Clin Oncol. 32:1020–1030. 2014. View Article : Google Scholar : PubMed/NCBI
|
|
47
|
Reck M, Rodríguez-Abreu D, Robinson AG,
Hui R, Csőszi T, Fülöp A, Gottfried M, Peled N, Tafreshi A, Cuffe
S, et al: Pembrolizumab versus chemotherapy for PD-L1-Positive
non-small-cell lung cancer. N Engl J Med. 375:1823–1833. 2016.
View Article : Google Scholar : PubMed/NCBI
|
|
48
|
Ferris RL, Blumenschein G Jr, Fayette J,
Guigay J, Colevas AD, Licitra L, Harrington K, Kasper S, Vokes EE,
Even C, et al: Nivolumab for recurrent squamous-cell carcinoma of
the head and neck. N Engl J Med. 375:1856–1867. 2016. View Article : Google Scholar : PubMed/NCBI
|
|
49
|
Danaher P, Warren S, Lu R, Samayoa J,
Sullivan A, Pekker I, Wallden B, Marincola FM and Cesano A:
Pan-cancer adaptive immune resistance as defined by the Tumor
Inflammation Signature (TIS): Results from The Cancer Genome Atlas
(TCGA). J Immunother Cancer. 6:632018. View Article : Google Scholar : PubMed/NCBI
|
|
50
|
Koebel CM, Vermi W, Swann JB, Zerafa N,
Rodig SJ, Old LJ, Smyth MJ and Schreiber RD: Adaptive immunity
maintains occult cancer in an equilibrium state. Nature.
450:903–907. 2007. View Article : Google Scholar : PubMed/NCBI
|
|
51
|
Dunn GP, Bruce AT, Ikeda H, Old LJ and
Schreiber RD: Cancer immunoediting: From immunosurveillance to
tumor escape. Nat Immunol. 3:991–998. 2002. View Article : Google Scholar : PubMed/NCBI
|
|
52
|
Pagès F, Berger A, Camus M, Sanchez-Cabo
F, Costes A, Molidor R, Mlecnik B, Kirilovsky A, Nilsson M, Damotte
D, et al: Effector memory T cells, early metastasis, and survival
in colorectal cancer. N Engl J Med. 353:2654–2666. 2005. View Article : Google Scholar : PubMed/NCBI
|
|
53
|
Zhang N and Bevan MJ: CD8(+) T cells: Foot
soldiers of the immune system. Immunity. 35:161–168. 2011.
View Article : Google Scholar : PubMed/NCBI
|
|
54
|
Alspach E, Lussier DM and Schreiber RD:
Interferon γ and its important roles in promoting and inhibiting
spontaneous and therapeutic cancer immunity. Cold Spring Harb
Perspect Biol. 11:a0284802019. View Article : Google Scholar : PubMed/NCBI
|
|
55
|
Liu Y, Zhou N, Zhou L, Wang J, Zhou Y,
Zhang T, Fang Y, Deng J, Gao Y, Liang X, et al: IL-2 regulates
tumor-reactive CD8+ T cell exhaustion by activating the aryl
hydrocarbon receptor. Nat Immunol. 22:358–369. 2021. View Article : Google Scholar : PubMed/NCBI
|
|
56
|
Zhang J, Endres S and Kobold S: Enhancing
tumor T cell infiltration to enable cancer immunotherapy.
Immunotherapy. 11:201–213. 2019. View Article : Google Scholar : PubMed/NCBI
|
|
57
|
Franklin RA, Liao W, Sarkar A, Kim MV,
Bivona MR, Liu K, Pamer EG and Li MO: The cellular and molecular
origin of tumor-associated macrophages. Science. 344:921–925. 2014.
View Article : Google Scholar : PubMed/NCBI
|
|
58
|
Wu D, Liu X, Mu J, Yang J, Wu F and Zhou
H: Therapeutic approaches targeting proteins in tumor-associated
macrophages and their applications in cancers. Biomolecules.
12:3922022. View Article : Google Scholar : PubMed/NCBI
|
|
59
|
Dahlin AM, Henriksson ML, Van Guelpen B,
Stenling R, Oberg A, Rutegård J and Palmqvist R: Colorectal cancer
prognosis depends on T-cell infiltration and molecular
characteristics of the tumor. Mod Pathol. 24:671–682. 2011.
View Article : Google Scholar : PubMed/NCBI
|
|
60
|
Badoual C, Hans S, Merillon N, Van Ryswick
C, Ravel P, Benhamouda N, Levionnois E, Nizard M, Si-Mohamed A,
Besnier N, et al: PD-1-expressing tumor-infiltrating T cells are a
favorable prognostic biomarker in HPV-associated head and neck
cancer. Cancer Res. 73:128–138. 2013. View Article : Google Scholar : PubMed/NCBI
|
|
61
|
Vassilakopoulou M, Avgeris M, Velcheti V,
Kotoula V, Rampias T, Chatzopoulos K, Perisanidis C, Kontos CK,
Giotakis AI, Scorilas A, et al: Evaluation of PD-L1 expression and
associated tumor-infiltrating lymphocytes in laryngeal squamous
cell carcinoma. Clin Cancer Res. 22:704–713. 2016. View Article : Google Scholar : PubMed/NCBI
|
|
62
|
Wang J, Wang S, Song X, Zeng W, Wang S,
Chen F and Ding H: The prognostic value of systemic and local
inflammation in patients with laryngeal squamous cell carcinoma.
Onco Targets Ther. 9:7177–7185. 2016. View Article : Google Scholar : PubMed/NCBI
|
|
63
|
Forssell J, Oberg A, Henriksson ML,
Stenling R, Jung A and Palmqvist R: High macrophage infiltration
along the tumor front correlates with improved survival in colon
cancer. Clin Cancer Res. 13:1472–1479. 2007. View Article : Google Scholar : PubMed/NCBI
|
|
64
|
Jung M, Mertens C, Tomat E and Brüne B:
Iron as a central player and promising target in cancer
progression. Int J Mol Sci. 20:2732019. View Article : Google Scholar : PubMed/NCBI
|
|
65
|
Torti SV and Torti FM: Iron and cancer:
More ore to be mined. Nat Rev Cancer. 13:342–355. 2013. View Article : Google Scholar : PubMed/NCBI
|
|
66
|
Wang Y, Yu L, Ding J and Chen Y: Iron
metabolism in cancer. Int J Mol Sci. 20:952018. View Article : Google Scholar : PubMed/NCBI
|
|
67
|
Jiang Z, Lim SO, Yan M, Hsu JL, Yao J, Wei
Y, Chang SS, Yamaguchi H, Lee HH, Ke B, et al: TYRO3 induces
anti-PD-1/PD-L1 therapy resistance by limiting innate immunity and
tumoral ferroptosis. J Clin Invest. 131:e1394342021. View Article : Google Scholar : PubMed/NCBI
|
|
68
|
Sharma P, Hu-Lieskovan S, Wargo JA and
Ribas A: Primary, adaptive, and acquired resistance to cancer
immunotherapy. Cell. 168:707–723. 2017. View Article : Google Scholar : PubMed/NCBI
|
|
69
|
Jacolot S, Le Gac G, Scotet V, Quere I,
Mura C and Ferec C: HAMPas a modifier gene that increases the
phenotypic expression of the HFEpC282Y homozygous genotype. Blood.
103:2835–2840. 2004. View Article : Google Scholar : PubMed/NCBI
|
|
70
|
Casu C, Nemeth E and Rivella S: Hepcidin
agonists as therapeutic tools. Blood. 131:1790–1794. 2018.
View Article : Google Scholar : PubMed/NCBI
|
|
71
|
Armitage AE, Eddowes LA, Gileadi U, Cole
S, Spottiswoode N, Selvakumar TA, Ho LP, Townsend AR and Drakesmith
H: Hepcidin regulation by innate immune and infectious stimuli.
Blood. 118:4129–4139. 2011. View Article : Google Scholar : PubMed/NCBI
|
|
72
|
Bessman NJ, Mathieu JRR, Renassia C, Zhou
L, Fung TC, Fernandez KC, Austin C, Moeller JB, Zumerle S, Louis S,
et al: Dendritic cell-derived hepcidin sequesters iron from the
microbiota to promote mucosal healing. Science. 368:186–189. 2020.
View Article : Google Scholar : PubMed/NCBI
|
|
73
|
Vyoral D and Petrák J: Hepcidin: A direct
link between iron metabolism and immunity. Int J Biochem Cell Biol.
37:1768–1773. 2005. View Article : Google Scholar : PubMed/NCBI
|
|
74
|
Mleczko-Sanecka K, Roche F, da Silva AR,
Call D, D'Alessio F, Ragab A, Lapinski PE, Ummanni R, Korf U, Oakes
C, et al: Unbiased RNAi screen for hepcidin regulators links
hepcidin suppression to proliferative Ras/RAF and
nutrient-dependent mTOR signaling. Blood. 123:1574–1585. 2014.
View Article : Google Scholar : PubMed/NCBI
|
|
75
|
Ren F, Yang Y, Wu K, Zhao T, Shi Y, Song M
and Li J: The effects of dandelion polysaccharides on iron
metabolism by regulating hepcidin via JAK/STAT signaling pathway.
Oxid Med Cell Longev. 2021:71847602021. View Article : Google Scholar : PubMed/NCBI
|
|
76
|
Saad HKM, Abd Rahman AA, Ab Ghani AS, Taib
WRW, Ismail I, Johan MF, Al-Wajeeh AS and Al-Jamal HAN: Activation
of STAT and SMAD signaling induces hepcidin re-expression as a
therapeutic target for β-Thalassemia patients. Biomedicines.
10:1892022. View Article : Google Scholar : PubMed/NCBI
|
|
77
|
Joachim JH and Mehta KJ: Hepcidin in
hepatocellular carcinoma. Br J Cancer. 127:185–192. 2022.
View Article : Google Scholar : PubMed/NCBI
|
|
78
|
Kessler SM, Barghash A, Laggai S, Helms V
and Kiemer AK: Hepatic hepcidin expression is decreased in
cirrhosis and HCC. J Hepatol. 62:977–979. 2015. View Article : Google Scholar : PubMed/NCBI
|
|
79
|
Maegdefrau U, Arndt S, Kivorski G,
Hellerbrand C and Bosserhoff A: Downregulation of hemojuvelin
prevents inhibitory effects of bone morphogenetic proteins on iron
metabolism in hepatocellular carcinoma. Lab Invest. 91:1615–1623.
2011. View Article : Google Scholar : PubMed/NCBI
|
|
80
|
Scimeca M and Bonanno E: New highlight in
breast cancer development: The key role of hepcidin and iron
metabolism. Ann Transl Med. 6 (Suppl 1):S562018. View Article : Google Scholar : PubMed/NCBI
|
|
81
|
Tesfay L, Clausen KA, Kim JW, Hegde P,
Wang X, Miller LD, Deng Z, Blanchette N, Arvedson T, Miranti CK, et
al: Hepcidin regulation in prostate and its disruption in prostate
cancer. Cancer Res. 75:2254–2263. 2015. View Article : Google Scholar : PubMed/NCBI
|
|
82
|
Zhao B, Li R, Cheng G, Li Z, Zhang Z, Li
J, Zhang G, Bi C, Hu C, Yang L, et al: Role of hepcidin and iron
metabolism in the onset of prostate cancer. Oncol Lett.
15:9953–9958. 2018.PubMed/NCBI
|
|
83
|
Chen Q, Wang L, Ma Y, Wu X, Jin L and Yu
F: Increased hepcidin expression in non-small cell lung cancer
tissue and serum is associated with clinical stage. Thorac Cancer.
5:14–24. 2014. View Article : Google Scholar : PubMed/NCBI
|
|
84
|
Phipps O, Brookes MJ and Al-Hassi HO: Iron
deficiency, immunology, and colorectal cancer. Nutr Rev. 79:88–97.
2021. View Article : Google Scholar : PubMed/NCBI
|
|
85
|
Colorectal cancer cells ectopically
express hepcidin to sequester iron. Cancer Discov. 11:OF22021.
View Article : Google Scholar
|
|
86
|
Schwartz AJ, Goyert JW, Solanki S, Kerk
SA, Chen B, Castillo C, Hsu PP, Do BT, Singhal R, Dame MK, et al:
Hepcidin sequesters iron to sustain nucleotide metabolism and
mitochondrial function in colorectal cancer epithelial cells. Nat
Metab. 3:969–982. 2021. View Article : Google Scholar : PubMed/NCBI
|
|
87
|
Sornjai W, Nguyen Van Long F, Pion N,
Pasquer A, Saurin JC, Marcel V, Diaz JJ, Mertani HC and Smith DR:
Iron and hepcidin mediate human colorectal cancer cell growth. Chem
Biol Interact. 319:1090212020. View Article : Google Scholar : PubMed/NCBI
|
|
88
|
Xiang-Tao P: Expression of hepcidin and
neogenin in colorectal cancer. Open Med (Wars). 12:184–188. 2017.
View Article : Google Scholar : PubMed/NCBI
|