Introduction
Gastric cancer (GC) is the fifth most common cause
of cancer-associated deaths worldwide, with limited treatment
options (1,2). However, most patients with GC exhibit
insidious onset and no obvious symptoms in the early stage, which
leads to the clinical diagnosis of GC in the advanced stage
(3). In 2020, >1 million new
cases of stomach cancer and ~770,000 deaths from stomach cancer
were reported, with about half of all new cases and related deaths
occurring in China (4). According
to previous studies, early detection of GC leads to favorable
prognosis, whereas advanced stages of GC have worse prognoses, with
survival rates of <20% (3–5).
Targeted and novel immune-based therapies have become more
accessible, improving the survival and prognosis of patients with
GC (6,7). There is a need to identify effective
immunological intervention-associated prognostic biomarkers and
targets (8).
Solute carrier family 2 member 2 (SLC2A2),
also known as glucose transporter type 2 (GLUT2), belongs to the
GLUT family and is primarily responsible for transporting glucose
into cells (9,10). According to previous research, tumor
cells transport glucose to intracellular stores to meet their high
metabolic energy demands via the SLC2A protein, suggesting that the
expression of different SLC2A subtypes may be associated with
invasiveness and progression of tumors (10). High SLC2A2 expression is
positively associated with a higher overall survival (OS) rate in
liver and breast cancer and other malignant tumors (10,11).
However, to the best of our knowledge, the association between
SLC2A2 expression and GC prognosis is unknown.
In the present study, Kaplan-Meier curves were used
to investigate the association between survival prognosis and
SLC2A2 expression in GC, and the association between
SLC2A2 expression and MYC targets, tumor mutation burden
(TMB), microsatellite instability (MSI), immune infiltration,
immune checkpoints and IC50 was explored to assess the
relationship between SLC2A2 expression and immunotherapy
effect. Finally, the association between SLC2A2 expression and
clinical features was investigated and a predictive nomogram model
was established and verified to assess the OS rate of GC. The
objective of the present study was to evaluate whether
SLC2A2 could be used as a prognostic biomarker and a novel
immunotherapy target for GC to improve the early diagnosis rate of
GC and provide a novel regimen for immunotherapy of GC.
Materials and methods
Data collection and preprocessing
A standardized pan-cancer dataset that combined The
Cancer Genome Atlas (TCGA) and Genotype-Tissue Expression (GTEx)
data was downloaded from the University of California, Santa Cruz
genome browser (xenabrowser.net/). Data on RNA sequencing and
corresponding clinical features of stomach adenocarcinoma were
obtained from TCGA (portal.gdc.cancer.gov/). All transcripts per
million values were generated from fragments per kilobase million
data and unified into log-transformed data (12). The present study adhered to GTEx
(https://commonfund.nih.gov/GTEx) and
TCGA publication guidelines (http://cancergenome.nih.gov/publications/publicationguidelines).
Differential SLC2A2 expression in
cancer and GC
Using the Wilcoxon rank-sum test, SLC2A2
expression was compared between cancer and normal tissues (healthy
individuals, and adjacent tissues from the same or different
patients) based on data downloaded from TCGA and GTEx. To identify
differentially expressed genes (DEGs) in GC, SLC2A2 median
expression in stomach adenocarcinoma samples was used as a cut-off
value to divide patients into the low and high SLC2A2
groups. A correlation heat map was constructed to display the
association between SLC2A2 and the top 12 significant DEGs
using R software (version 3.6.3; http://www.r-project.org/). DESeq2 was used to analyze
data using R software (version 3.6.3; http://www.r-project.org/). An adjusted P-value
(P.adj)<0.05 and |log fold-change (FC)|>2 were considered to
indicate statistically significant DEGs.
Functional analysis of SLC2A2 in
GC
To illustrate DEG-associated biological functions,
the ‘clusterProfiler’ (version 3.14.3; http://guangchuangyu.github.io/software/clusterProfiler)
package was used for Gene Ontology (GO) and Kyoto Encyclopedia of
Genes and Genomes (KEGG) enrichment analyses. Gene symbols were
transformed into EntrezID to obtain GO and KEGG functional
annotations using org.Hs.eg.db (version 3.12.0; http://www.bioconductor.org/packages/org.Hs.eg.db). GO
enrichment analysis was divided into three categories: Biological
processes (BPs), molecular functions (MFs) and cellular components
(CCs). Gene set enrichment analysis (GSEA; http://www.broadinstitute.org/gsea) was conducted to
examine the differential pathways and biological functions
associated with SLC2A2 expression, including GO enrichment
analysis, Reactome pathway analysis and Wiki pathways analysis
based on the C2 collection from the Molecular Signatures Database
(https://www.gsea-msigdb.org/gsea/msigdb). A false
discovery rate q-value <0.25 and P.adj <0.05 were used to
determine statistical significance.
Immune infiltration, copy number
alteration and gene mutation analysis of SLC2A2 in GC
The infiltration of immune cells was analyzed using
quantification of the tumor immune contexture from human RNA-seq
data (QUANTISEQ from the ‘Immunedeconv’ R package; version 2.0.3,
icbi.i-med.ac.at/software/quantiseq/doc/). The Pearson correlation
coefficient was calculated to explore the correlation between
immune cell infiltration and SLC2A2 expression (13). To explore the correlation between
the expression levels of SLC2A2 and different immune
infiltrating cells in GC, the Tumor Immune Estimation Resource 2.0
database (http://timer.cistrome.org/) was used
to analyze the association between SLC2A2 and immune
infiltration levels, and a Cox proportional hazard model was
constructed. The copy number alterations of SLC2A2 in GC and
the gene mutation status of SLC2A2 in GC were investigated using
cBioPortal (version 5.4.7; http://www.cbioportal.org/).
Immune checkpoint, MYC targets, TMB,
MSI and chemotherapeutic response analysis of SLC2A2 in GC
Further analysis was conducted to assess the
association between SLC2A2 expression and six major immune
checkpoints, namely glucocorticoid-induced tumor necrosis
factor-related [GITR; TNFR superfamily 18 (TNFRSF18)] protein,
programmed cell death ligand 1 (PD-L1; CD274), programmed cell
death 1 (PDCD1), cytotoxic T-lymphocyte associated protein 4
(CTLA4), sialic acid binding Ig-like lectin 15 (SIGLEC15) and
signal regulatory protein α (SIRPα). MYC targets, TMB and MSI were
examined to assess the effectiveness of immunotherapy using
‘ggstatsplot’ (version 4.0.2; http://github.com/IndrajeetPatil/ggstatsplot) and
‘GSVA’ (version 1.34.0; http://www.bioconductor.org/packages/release/bioc/vignettes/GSVA/inst/doc/GSVA.html).
The Spearman's correlation coefficient was calculated to explore
the correlation between MYC targets/TMB/MSI score and SLC2A2
expression. To predict the chemotherapeutic response associated
with SLC2A2 expression, the IC50 score was
analyzed based on Genomics of Drug Sensitivity in Cancer
(release-8.2; http://www.cancerrxgene.org/) (14). The ‘pRRophetic’ package (version
0.5; http://github.com/paulgeeleher/pRRophetic) was used
for prediction and the IC50 score was calculated using
ridge regression.
Survival prognosis analysis of
SLC2A2
Based on the clinical data from TCGA (https://tcga-data.nci.nih.gov/tcga/),
Kaplan-Meier curves were used to investigate the association
between survival prognosis and SLC2A2 expression in GC using
the ‘survival’ package (version 3.2–10; http://cran.r-project.org/package=survival). OS,
disease-specific survival (DSS) and progression-free interval (PFI)
of the patients divided into low and high SLC2A2 expression
groups based on the median of SLC2A2 expression as the
cutoff were compared. SLC2A2 expression and corresponding
clinical variables were evaluated using univariate and multivariate
Cox regression analysis to determine independent prognostic factors
for survival. Clinical information such as age, sex, TNM stage and
the R0 grade for complete resection of residual tumor was
incorporated. To elucidate the prognostic effect of SLC2A2
in GC, subgroup analysis was conducted. The Sankey diagram,
prognostic nomogram and corresponding calibration plots were
generated using ‘survival’ (version 3.2–10; http://cran.r-project.org/package=survival) and
‘RMS’ (version 6.2–0; http://cran.r-project.org/web/packages/rms/index.html)
packages to predict the OS at 1, 4 and 6 years. Discrimination was
quantified using the concordance index and the accuracy of the
nomogram was evaluated by comparing observed rates and
nomogram-predicted probabilities.
Validation of differential SLC2A2
expression and predictive values
To validate SLC2A2 expression and its
predictive value, SLC2A2 expression in normal gastric tissue
from healthy individuals and GC tissues was compared using the
Human Protein Atlas (HPA) database (proteinatlas.org/). A total of
two microarray datasets, GSE38749 and GSE84437, were downloaded
from the Gene Expression Omnibus (GEO) database
(ncbi.nlm.nih.gov/geo/) to analyze the association between
expression levels of SLC2A2 and clinical characteristics in
GC, including survival status, age, T stage and N stage (15,16).
Kaplan-Meier plotter (2022 version; kmplot.com/analysis/) was then
used to verify whether SLC2A2 affects GC prognosis. The
log-rank P-value and hazard ratio (HR) with 95% confidence
intervals were calculated. An automatic cut-off value for high or
low SLC2A2 expression was determined by the Kaplan-Meier
plotter, and the GC mRNA dataset and corresponding clinical
information analyzed by Kaplan-Meier plotter came from three
databases, including TCGA, GEO and European Genome-phenome
Archive.
Immunohistochemistry (IHC)
A GC tissue microarray (TMA; cat. no. D046St01) was
purchased from Xi'an Bioaitech Co., Ltd. The GC tissues were fixed
in 4% paraformaldehyde (room temperature; <24 h), immobilized in
paraffin and sectioned at 4 µm. The TMA contained 46 samples,
including 40 samples of GC and 6 mild gastritis samples from
gastric mucosa adjacent to cancer. IHC of the TMA was carried out
according to standard procedures (17). Briefly, the IHC application solution
kit (cat. no. 13079S; Cell Signaling Technology, Inc.) was used for
staining. After being heated to 60°C for 1 h, the TMA was
deparaffinized in turpentine oil type biological tablet transparent
agent three times for 10 min each, then dipped in 99.5% anhydrous
ethanol (C2H60; cat. no. C15188908; Macklin Inc.) and 95% ethanol
(C2H60; cat. no. C13799050; Macklin, Inc.) twice for 10 min each.
The TMA was transferred to EDTA buffer (pH 6.0) by microwave
heating for antigen retrieval. Microwave heating was performed at
medium-high for 4 min, high for 5 min and then another 10 min at
medium-high, then washed with distilled water (dH2O)
after cooling. The TMA was washed with dH2O three times
for 5 min each, immersed in 3% hydrogen peroxide for 20 min, then
washed with dH2O, Tris-Buffered Saline and 0.1% Tween-20
(TBST). The slide was blocked with 20% (1X) animal-free blocking
solution (cat. no. 15019S; Cell Signaling Technology, Inc.) at room
temperature for 2 h and incubated with primary antibody
(anti-SLC2A2; 1:500; cat. no. 66889-1-Ig; Proteintech Group, Inc.)
overnight at 4°C, followed by a 30-min incubation with 2 drops (100
µl) secondary antibody (SignalStain® Boost IHC Detection
Reagent; HRP; mouse; cat. no. 8125S; Cell Signaling Technology,
Inc.) at room temperature. A three-step washing procedure with TBST
was followed by SignalStain® 3,3′-diaminobenzidine
staining (cat. no. 8059S; Cell Signaling Technology, Inc.). The TMA
was mounted and observed in three randomly selected fields of view
(light microscope; magnification, ×400; Pannoramic MIDI; 3DHISTECH,
Ltd.) to calculate the average optical density. IHC intensity was
quantified using Fiji ImageJ (version 2.0.0; National Institutes of
Health) by calculating the integrated and mean integrated optical
density (IOD) (IOD/area).
Cell lines
The GES-1 normal gastric mucosal epithelial cell
line and three types of GC cell lines (AGS, HGC-27 and NCI-N87)
were obtained from BeNa Culture Collection; Beijing Beina Chunglian
Institute of Biotechnology. GES-1 cells were maintained in DMEM
(Wuhan Servicebio Technology Co., Ltd.) containing 10% FBS (Gibco;
Thermo Fisher Scientific, Inc.). AGS and NCI-N-87 cells were
cultured in RPMI-1640 medium (Gibco; Thermo Fisher Scientific,
Inc.) containing 10% FBS, while HGC-27 cells were maintained in
RPMI-1640 medium (Gibco; Thermo Fisher Scientific, Inc.) containing
20% FBS. All cells were cultured at 37°C in a humidified atmosphere
containing 5% CO2.
Reverse transcription-quantitative PCR
(RT-qPCR)
Total cellular RNA was isolated from GES-1, AGS,
HGC-27 and NCI-N87 cells using the RNApure Tissue & Cell kit
(cat. no. CW0560S; CoWin Biosciences), and cDNA was synthesized
using a UnionScript First-strand cDNA Synthesis Mix for qPCR (cat.
no. SR511; Beijing Genesand Biotech Co., Ltd.). The reverse
transcription conditions were 37°C for 2 min, 55°C for 15 min and
85°C for 5 min using the T100 Thermo Cycler (Bio-Rad Laboratories,
Inc.). RT-qPCR was performed using a QuanStudioTM 5 Real-Time PCR
instrument (Thermo Fisher Scientific, Inc.) using GS AntiQ qPCR
SYBR Green Fast Mix (cat. no. SQ410; Beijing Genesand Biotech Co.,
Ltd.). GAPDH (forward primer, 5′-GAAGGTGAAGGTCGGAGTC-3′ and reverse
primer, 5′-GAAGATGGTGATGGGATTTC-3′) was used as the internal
control. The human SLC2A2 qPCR primers were: Forward,
5′-ATTGCTCCAACCGCTCTCA-3′ and reverse, 5′-ATGGCTCGCACACCAGAC-3′.
The thermocycling conditions were as follows: Initial denaturation
at 95°C for 3 min, followed by 40 cycles of 95°C for 5 sec and 60°C
for 15 sec, and melting curve at 95°C for 15 sec, 60°C for 1 min
and 95°C for 15 sec. The relative gene expression of SLC2A2
was calculated as the FC using the 2−ΔΔCq method
(18) and GraphPad Prism (version
8.0; Dotmatics).
Statistical analysis
Log2 transformation was used to normalize
gene expression data. For analysis of SLC2A2 expression, the
Wilcoxon rank-sum test was used. Using univariate and multivariate
Cox regression models, the HR and 95% CI of various clinical
features were determined. Pearson and Spearman's coefficients were
calculated to explore the correlation between immune cell
infiltration, immune checkpoints and MYC/TMB/MSI score and
SLC2A2 expression. The statistical difference of QUANTISEQ
Scores was tested using the Kruskal-Wallis test. Bonferroni post
hoc tests were used for post hoc comparisons. The potential
relationship between SLC2A2, prognosis and immunotherapy
efficacy of GC related to copy number variation and gene mutation
was analyzed using cBioPortal (version 5.4.7; http://www.cbioportal.org/) to perform a comprehensive
analysis of SLC2A2 alterations in GC. The time-dependent
receiver operating characteristic (ROC) curve was used to verify
the sensitivity and specificity of SLC2A2 in the diagnosis
of GC. Kaplan-Meier curves, Kruskal-Wallis test with Dunn's post
hoc test and the log-rank test were used to analyze survival
differences. According to different clinical parameters, the high
and low SLC2A2 expression groups determined by median were
compared with the Kruskal-Wallis test to validate SLC2A2
expression and its predictive value for the survival function. Data
analysis was conducted using R software (version 3.6.3; http://www.r-project.org/about.html).
The IOD was calculated using Fiji ImageJ (version 2.0.0; National
Institutes of Health) and data were analyzed using one-way ANOVA
with Tukey's post hoc test. Data are presented as the mean ± SD.
qPCR was performed three times independently. A two-sided P<0.05
was considered to indicate a statistically significant
difference.
Results
Differential SLC2A2 expression in GC
and other types of cancer
The sequencing data of a total of 210 normal samples
and 414 GC samples were extracted from GTEx and TCGA databases.
Among them, the normal samples included 174 samples from healthy
individuals and 36 samples from normal gastric mucosal tissue
adjacent to cancer. SLC2A2 expression was downregulated in
most types of tumor, such as breast invasive carcinoma
(P<0.001), cholangiocarcinoma (P<0.001), lymphoid neoplasm
diffuse large B-cell lymphoma (P<0.05), kidney chromophobe
(P<0.001), acute myeloid leukemia (P<0.001), lung squamous
cell carcinoma (P<0.05), ovarian serous cystadenocarcinoma
(P<0.001), prostate adenocarcinoma (P<0.001), skin cutaneous
melanoma (P<0.001), thyroid carcinoma (P<0.001), thymoma
(P<0.001), uterine corpus endometrial carcinoma (P<0.01) and
testicular germ cell tumors (P<0.001; Fig. 1A), but upregulated in six tumor
types compared with the normal tissues, including stomach
adenocarcinoma/GC (P<0.001), colon adenocarcinoma (P<0.001),
esophageal carcinoma (P<0.001), glioblastoma multiforme
(P<0.001), kidney renal clear cell carcinoma (P<0.001) and
pancreatic adenocarcinoma (P<0.05; Fig. 1A). SLC2A2 expression was
unchanged in several tumors, including adrenocortical carcinoma,
bladder urothelial carcinoma, and cervical squamous cell carcinoma
and endocervical adenocarcinoma (Fig.
1A). Based on |logFC|>2 and P.adj<0.05 thresholds, 1,471
DEGs, including of 1,465 significantly upregulated and six
significantly downregulated genes, were identified (Fig. 1B). In addition, according to the
|logFC| value, six significantly DEGs were selected from each of
the upregulated (APOA4, AFP, APOA1, APOA2, VCX2 and AC115619.1) and
downregulated genes (BOK-AS1, AC105460.1, CALB1, CLCA4, TMPRSS11B
and CALCA) in descending order. A correlation heat map was
constructed to display the association between SLC2A2 and
the top 12 significantly upregulated and downregulated DEGs
(Fig. 1C).
Functional enrichment analysis of
SLC2A2 in GC
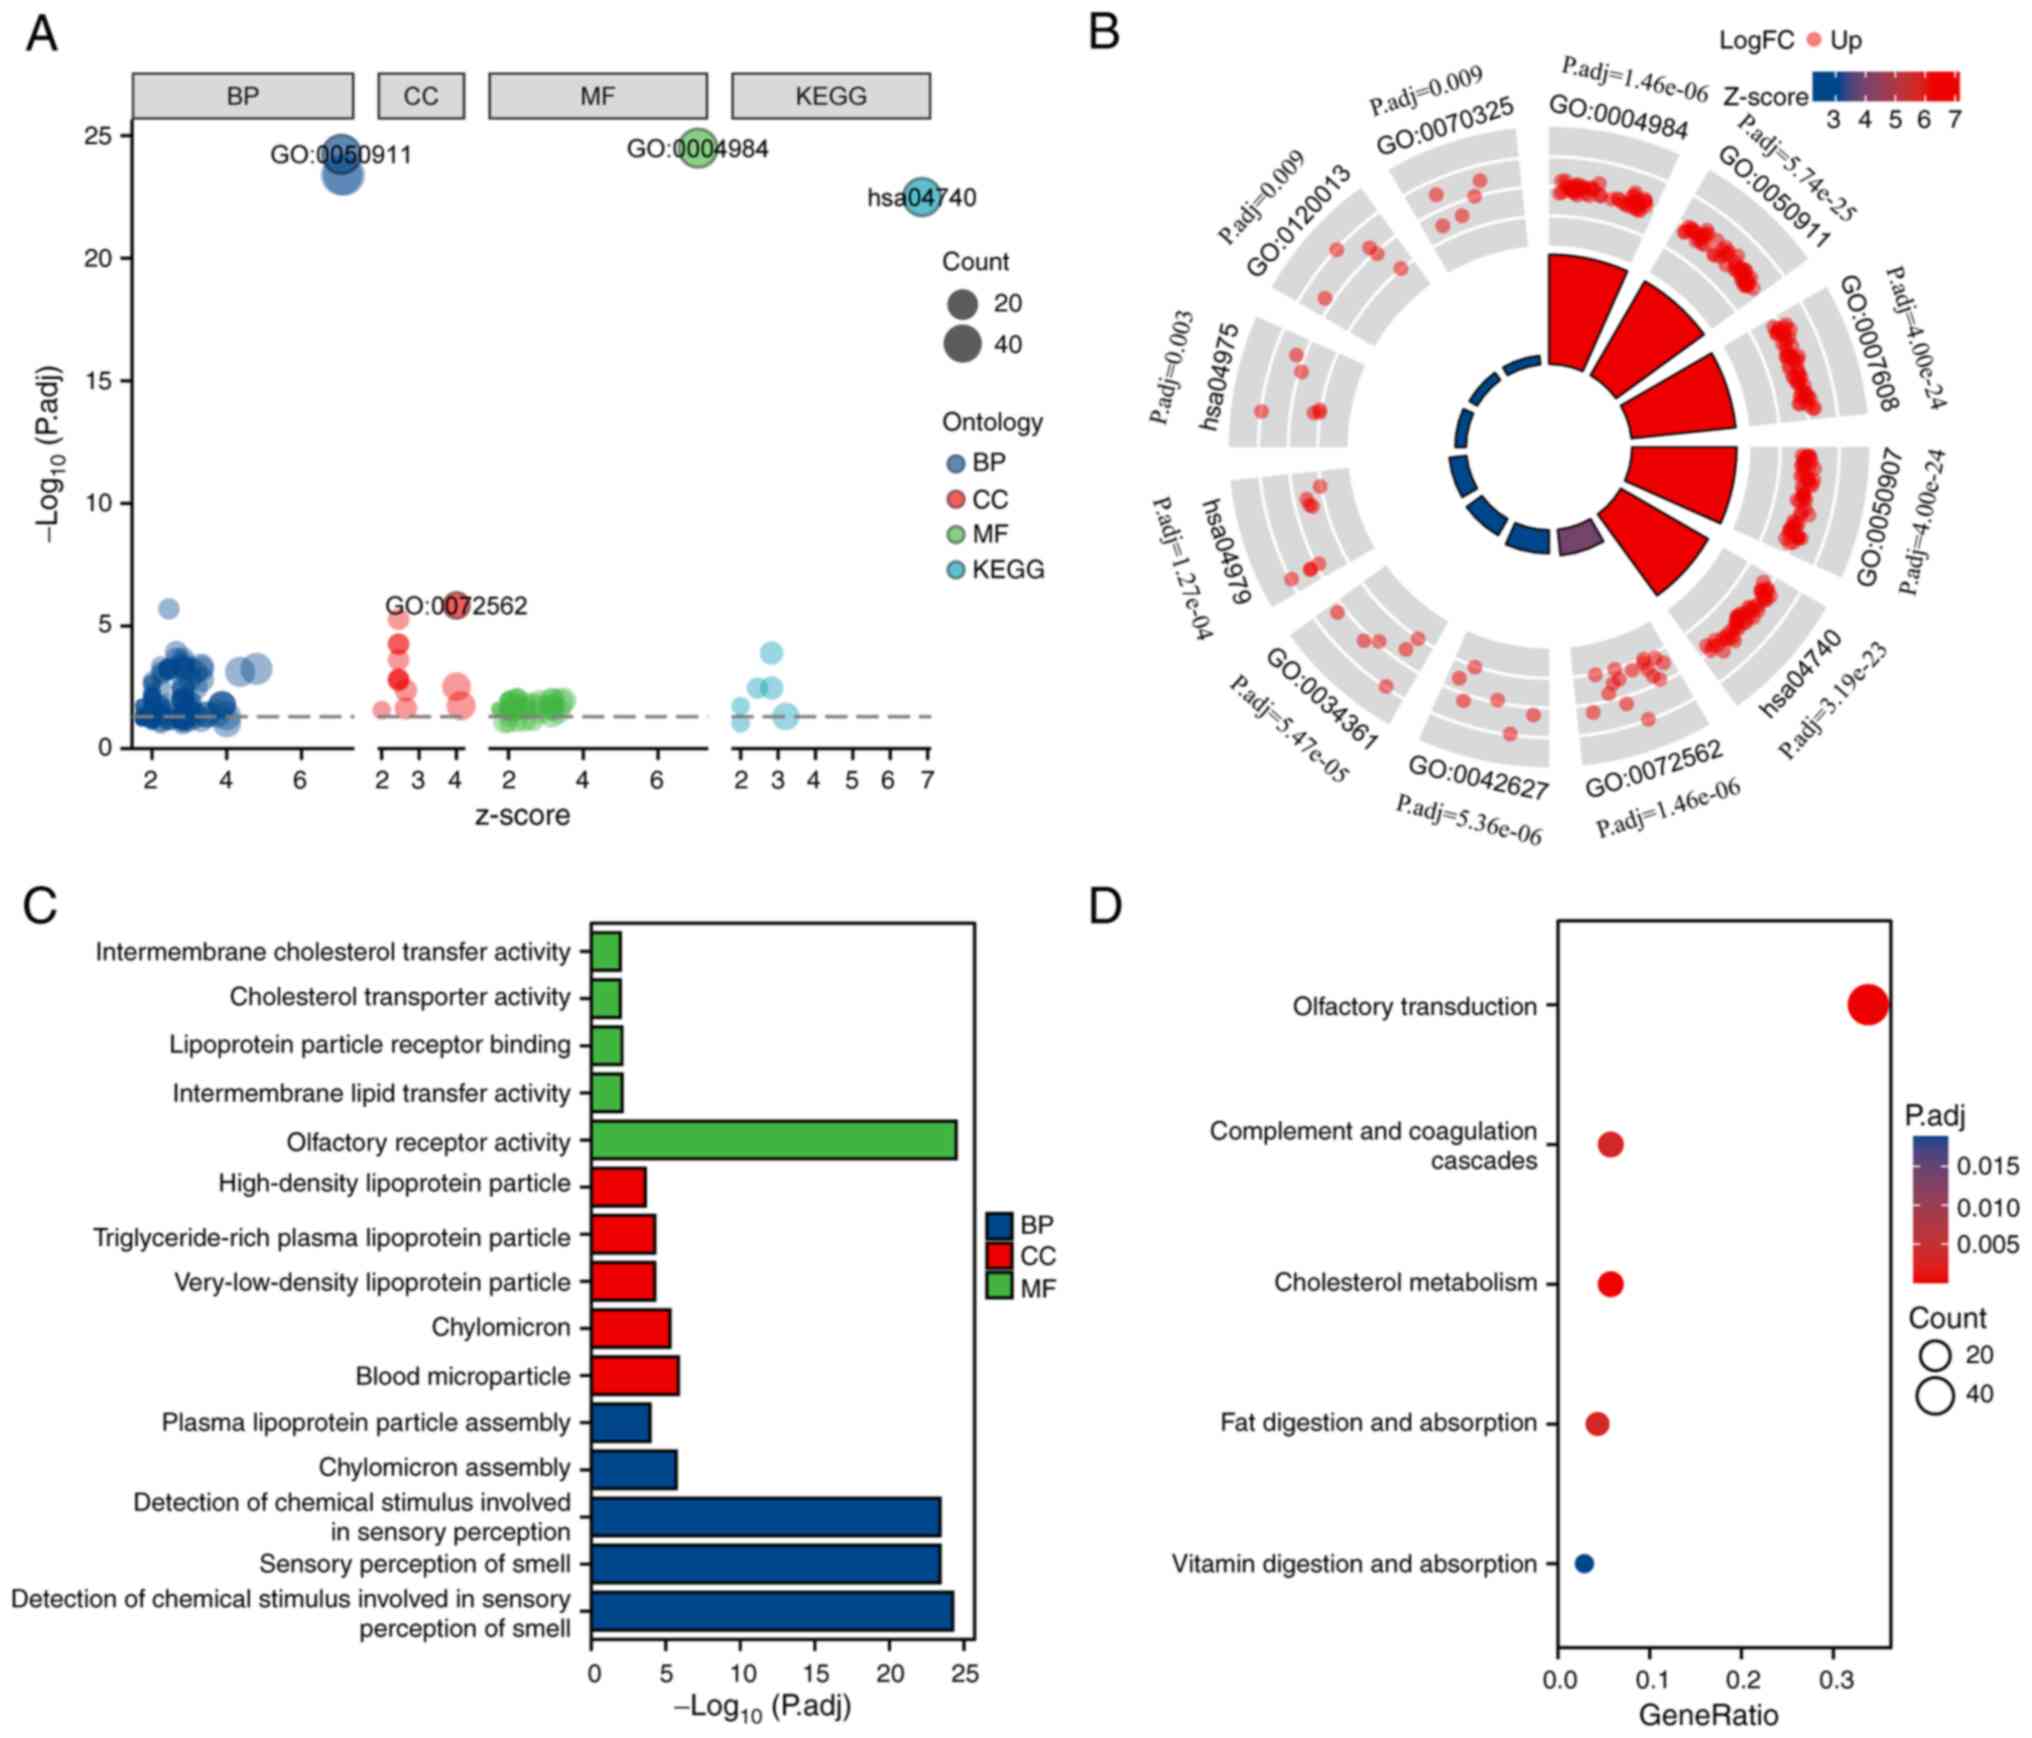
DEG-associated functional enrichment analysis was
conducted. According to KEGG pathway and GO term functional
enrichment analysis (Fig. 2A and
B), for BPs, SLC2A2-related DEGs were enriched
predominantly in ‘sensory perception of smell’, ‘chylomicron
assembly’, ‘detection of chemical stimulus involved in sensory
perception’, ‘plasma lipoprotein particle assembly’ and ‘detection
of chemical stimulus involved in sensory perception of smell’. For
CCs, DEGs were primarily related to ‘high-density lipoprotein
particle’, ‘chylomicron’, ‘triglyceride-rich plasma lipoprotein
particle’, ‘blood microparticle’ and ‘very-low-density lipoprotein
particle’. For the MFs, DEGs were mostly involved in ‘olfactory
receptor activity’, ‘intermembrane lipid transfer activity’,
‘lipoprotein particle receptor binding’, ‘cholesterol transporter
activity’ and ‘intermembrane cholesterol transfer activity’
(Fig. 2C). In addition, ‘olfactory
transduction’, ‘cholesterol metabolism’, ‘fat digestion and
absorption’, ‘complement and coagulation cascades’ and ‘vitamin
digestion and absorption’ were significantly enriched in the KEGG
pathway analysis (Fig. 2D).
GSEA of GO enrichment analysis,
Reactome pathway analysis and Wiki pathways analysis between SLC2A2
high expression and low expression levels for latent biological
functions
To determine the latent functions of SLC2A2
in patients with GC, GSEA was conducted based on false discovery
rate q-values <0.25 and P.adj<0.05. According to GO
enrichment analysis, ‘sterol transfer activity’, ‘sterol
transporter activity’, ‘lipoprotein particle receptor binding’,
‘lipid transfer activity’ and ‘cholesterol binding’ were
significantly enriched in association with high SLC2A2
expression (Fig. 3A). However, ‘DNA
N glycosylase activity’, ‘prenyltransferase activity’, ‘MHC class I
protein binding’, ‘superoxide generating NADPH oxidase activator
activity’ and ‘CXCR chemokine receptor binding’ were significantly
enriched in association with low SLC2A2 expression (Fig. 3B). According to the Reactome pathway
analysis, ‘chylomicron assembly’, ‘plasma lipoprotein assembly’,
‘GRB2 SOS provides linkage to MAPK signaling for integrins’,
‘P130CAS linkage to MAPK signaling for integrins’ and ‘metabolism
of fat soluble vitamins’ were significantly enriched in association
with increased SLC2A2 expression (Fig. 3C), and ‘regulation of NFκB
signaling’, ‘signaling by NOTCH1 HD domain mutants in cancer’,
‘SUMOylation of immune response proteins’, ‘repression of Wnt
target genes’ and ‘mitochondrial iron sulfur cluster biogenesis’
were significantly enriched in association with decreased
SLC2A2 expression (Fig. 3D).
Furthermore, the association between Wiki pathways and
SLC2A2 expression was investigated based on the C2
collection from the Molecular Signatures Database. ‘Lipid particles
composition’, ‘metabolic pathway of LDL HDL and TG including
diseases’, ‘statin inhibition of cholesterol production’, ‘PPARα
pathway’ and ‘folate metabolism’ were significantly enriched in
association with high SLC2A2 expression (Fig. 3E), and ‘amplification and expansion
of oncogenic pathways as metastatic traits’, ‘apoptosis modulation
by HSP70’, ‘cancer immunotherapy by CTLA4 blockade’, ‘development
of pulmonary dendritic cells and macrophage subsets’ and ‘aerobic
glycolysis’ were significantly enriched in association with low
SLC2A2 expression (Fig. 3F).
These results indicated that SLC2A2 expression was
associated with dynamic alteration of inflammatory chemokines,
oxidative stress, lipid metabolism, inflammatory reaction, immune
regulation and the tumor immune microenvironment.
Association between SLC2A2 and immune
infiltration and mutation types of SLC2A2 by mutation count and
alteration frequency
SLC2A2 expression and immune cell
infiltration levels in GC were analyzed. QUANTISEQ revealed that
neutrophils (P=0.003) and M2 macrophages (P=0.045) were
significantly increased in patients with high SLC2A2
expression, whereas M1 macrophages (P=0.037) were significantly
decreased (Fig. 4A-C), although the
correlations were weak. The distribution of QUANTISEQ immune score
in GC tissue was divided into high expression group and low
expression group according to the median expression value of
SLC2A2, and data for 32 normal samples of gastric mucosa
adjacent to cancer from the same patients were extracted from TCGA
as the normal group for this immune score. GC and normal tissues
exhibited significant differences in M1 macrophages (P<0.001),
monocytes (P<0.001), neutrophils (P<0.05) and CD4+
T cells (P<0.05), while M2 macrophages were markedly different
(0.05≤P<0.1; Fig. 4D). The
analysis of putative copy number alterations showed that the
expression of SLC2A2 was related to missense point
mutations, with the highest mutation count found in the diploid,
indicating the gene mutations of SLC2A2 in GC may contribute
to poor prognosis and immunotherapy might be effective for this
patients with high expression level of SLC2A2 (Fig. 4E). Mutation analysis showed that
SLC2A2 was highly amplified in GC, and the highest amplification
rate of 6.28% was found in TCGA Firehose Legacy cohort (Fig. 4F). The multivariate Cox proportional
hazard model of immune subsets of GC revealed that SLC2A2
primarily affected the prognosis of patients by affecting the
infiltration of macrophages and B cells in the immune
microenvironment of GC (Table
I).
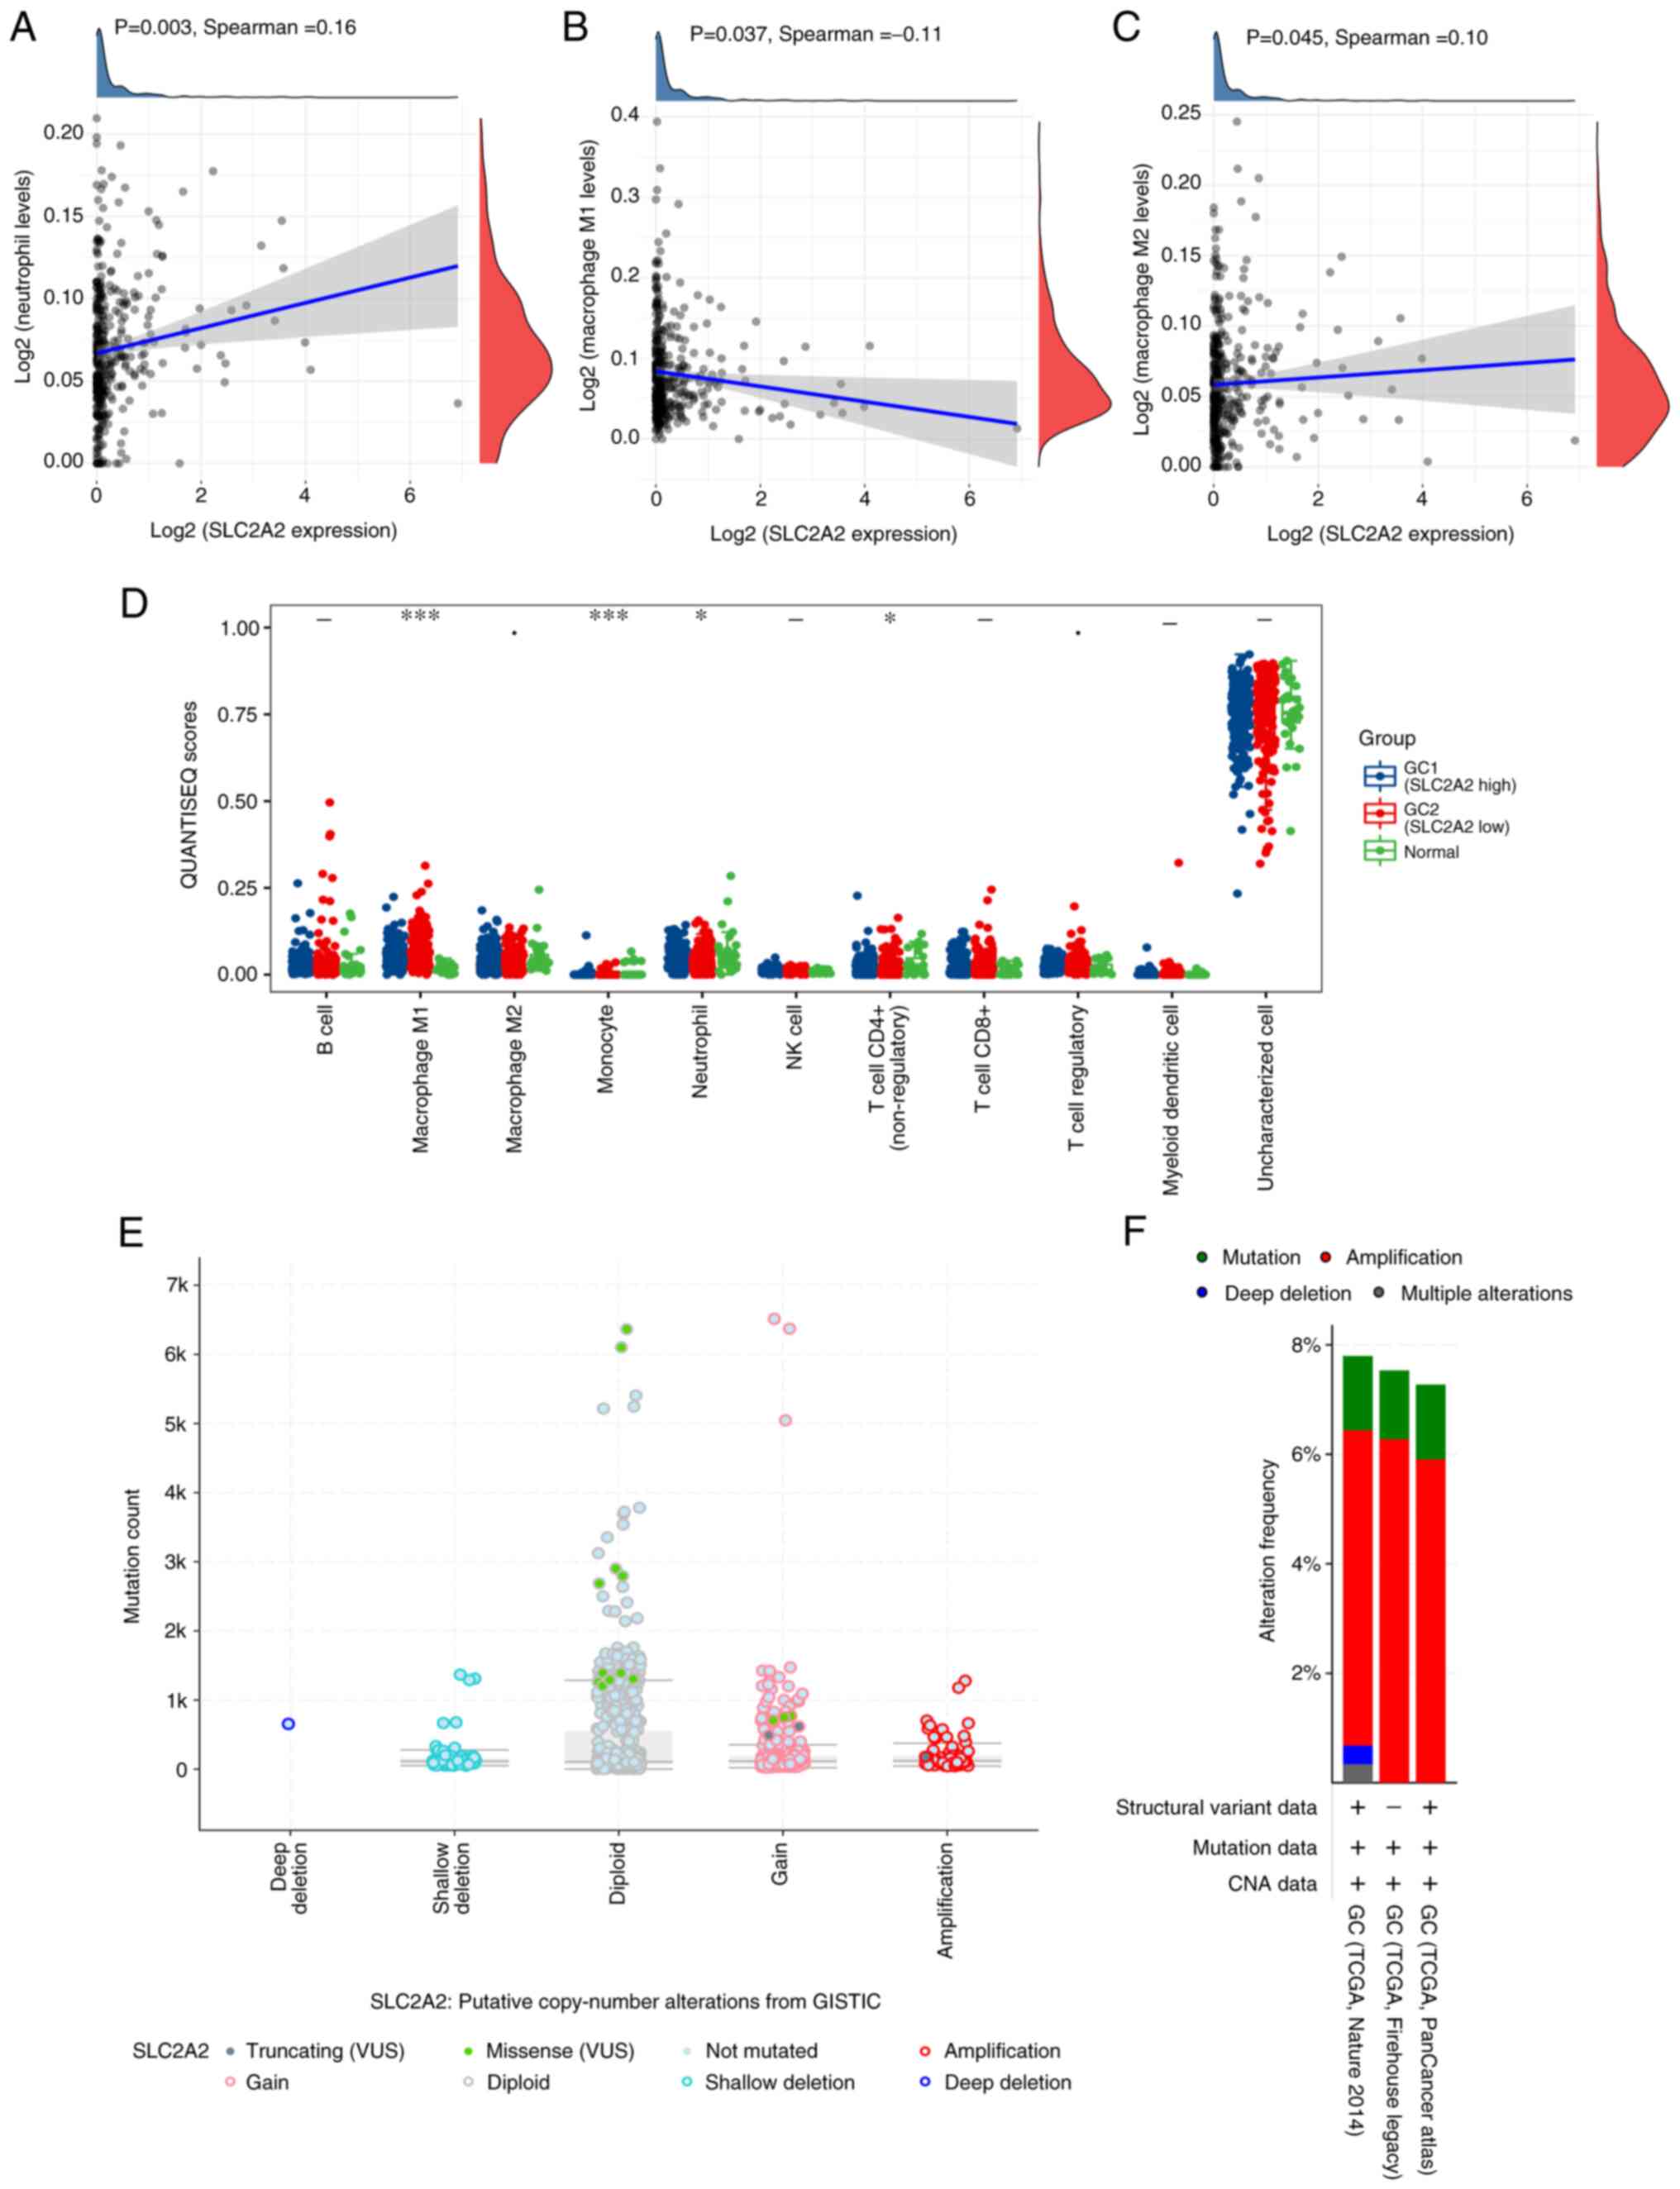 | Figure 4.Association between SLC2A2
expression and immune infiltration. Relationships between
SLC2A2 expression and (A) neutrophils, (B) M1 macrophages,
(C) M2 macrophages and (D) QUANTISEQ immune scores. (E) Association
between copy number alterations, mutation types and mutation count
of SLC2A2 in GC. (F) Analysis of the gene mutations of
SLC2A2 in GC. *P<0.05, ***P<0.001, Ÿ0.05≤P<0.1,
high expression of SLC2A2 vs. low expression of SLC2A2
vs. normal groups in GC. GC, gastric cancer; NK, natural
killer; QUANTISEQ, quantification of the tumor immune contexture
from human RNA-seq data; SLC2A2, solute carrier family 2 member 2;
STAD, stomach adenocarcinoma; TCGA, The Cancer Genome Atlas;
GISTIC, Genomic Identification of Significant Targets in Cancer;
VUS, variants of uncertain significance; CNA, copy number
alteration. |
 | Table I.Cox proportional hazard model of
gastric cancer immune subsets. |
Table I.
Cox proportional hazard model of
gastric cancer immune subsets.
| Characteristic | Regression
coefficient | 95% CI | Hazard ratio | P-value |
|---|
| SLC2A2
expression | 0.283 | 1.004–1.753 | 1.327 | 0.047a |
| Age | 0.037 | 1.017–1.059 | 1.038 |
<0.001b |
| Male sex | 0.172 | 0.788–1.791 | 1.188 | 0.411 |
| Ethnicity
(black) | 0.288 | 0.542–3.278 | 1.333 | 0.531 |
| Ethnicity
(white) | 0.169 | 0.722–1.944 | 1.185 | 0.502 |
| Stage 2 | 0.783 | 0.970–4.937 | 2.189 | 0.059 |
| Stage 3 | 1.167 | 1.504–6.859 | 3.212 | 0.003c |
| Stage 4 | 1.725 | 2.071–15.225 | 5.615 | 0.001c |
| B cell | 3.078 |
1.097–10,548.852 | 107.592 | 0.046a |
| CD8+ T
cell | −0.986 | 0.018–7.598 | 0.373 | 0.521 |
| CD4+ T
cell | −5.023 | 0.000–1.586 | 0.007 | 0.073 |
| Macrophage | 7.317 |
45.703–49,588.633 | 1,505.436 |
<0.001b |
| Neutrophil | −5.242 | 0.000–2.818 | 0.005 | 0.102 |
| Dendritic cell | 1.960 | 0.486–103.643 | 7.099 | 0.152 |
Correlation between immune
checkpoints, MYC, TMB, MSI and IC50 and SLC2A2
expression
Further analyses were conducted to investigate the
relationship between SLC2A2 expression and the immune
checkpoints of GC, namely GITR (TNFRSF18), PD-L1 (CD274), PDCD1,
CTLA4, SIGLEC15 and SIRPα. SLC2A2 expression was positively
correlated with SIGLEC15 (r=0.151; P=0.003) and SIRPα (r=0.116;
P=0.025) and inversely correlated with GITR (r=−0.115; P=0.025) and
PD-L1 (r=−0.105, P=0.042) expression (Fig. 5A and B), although the correlations
were weak. However, lower MYC targets (r=−0.13; P=0.010), TMB
(r=−0.14; P=0.012) and MSI score (r=−0.21; P=0.000195) were
associated with increased SLC2A2 expression, although the
correlations were weak (Fig. 5C-E).
The aforementioned data showed that with the increase of
SLC2A2 expression level, the expression of immune checkpoint
SIGLEC15 and SIRPa increased, indicating that GC was more likely to
exhibit immune escape, and thus, further spread and metastasize,
while the levels of MYC targets, TMB score and MSI score decreased
with the high expression of SLC2A2, resulting in a worse
immunotherapy effect in GC (19,20).
The results indicated that high expression of SLC2A2 may
lead to poor immunotherapy efficacy in GC.
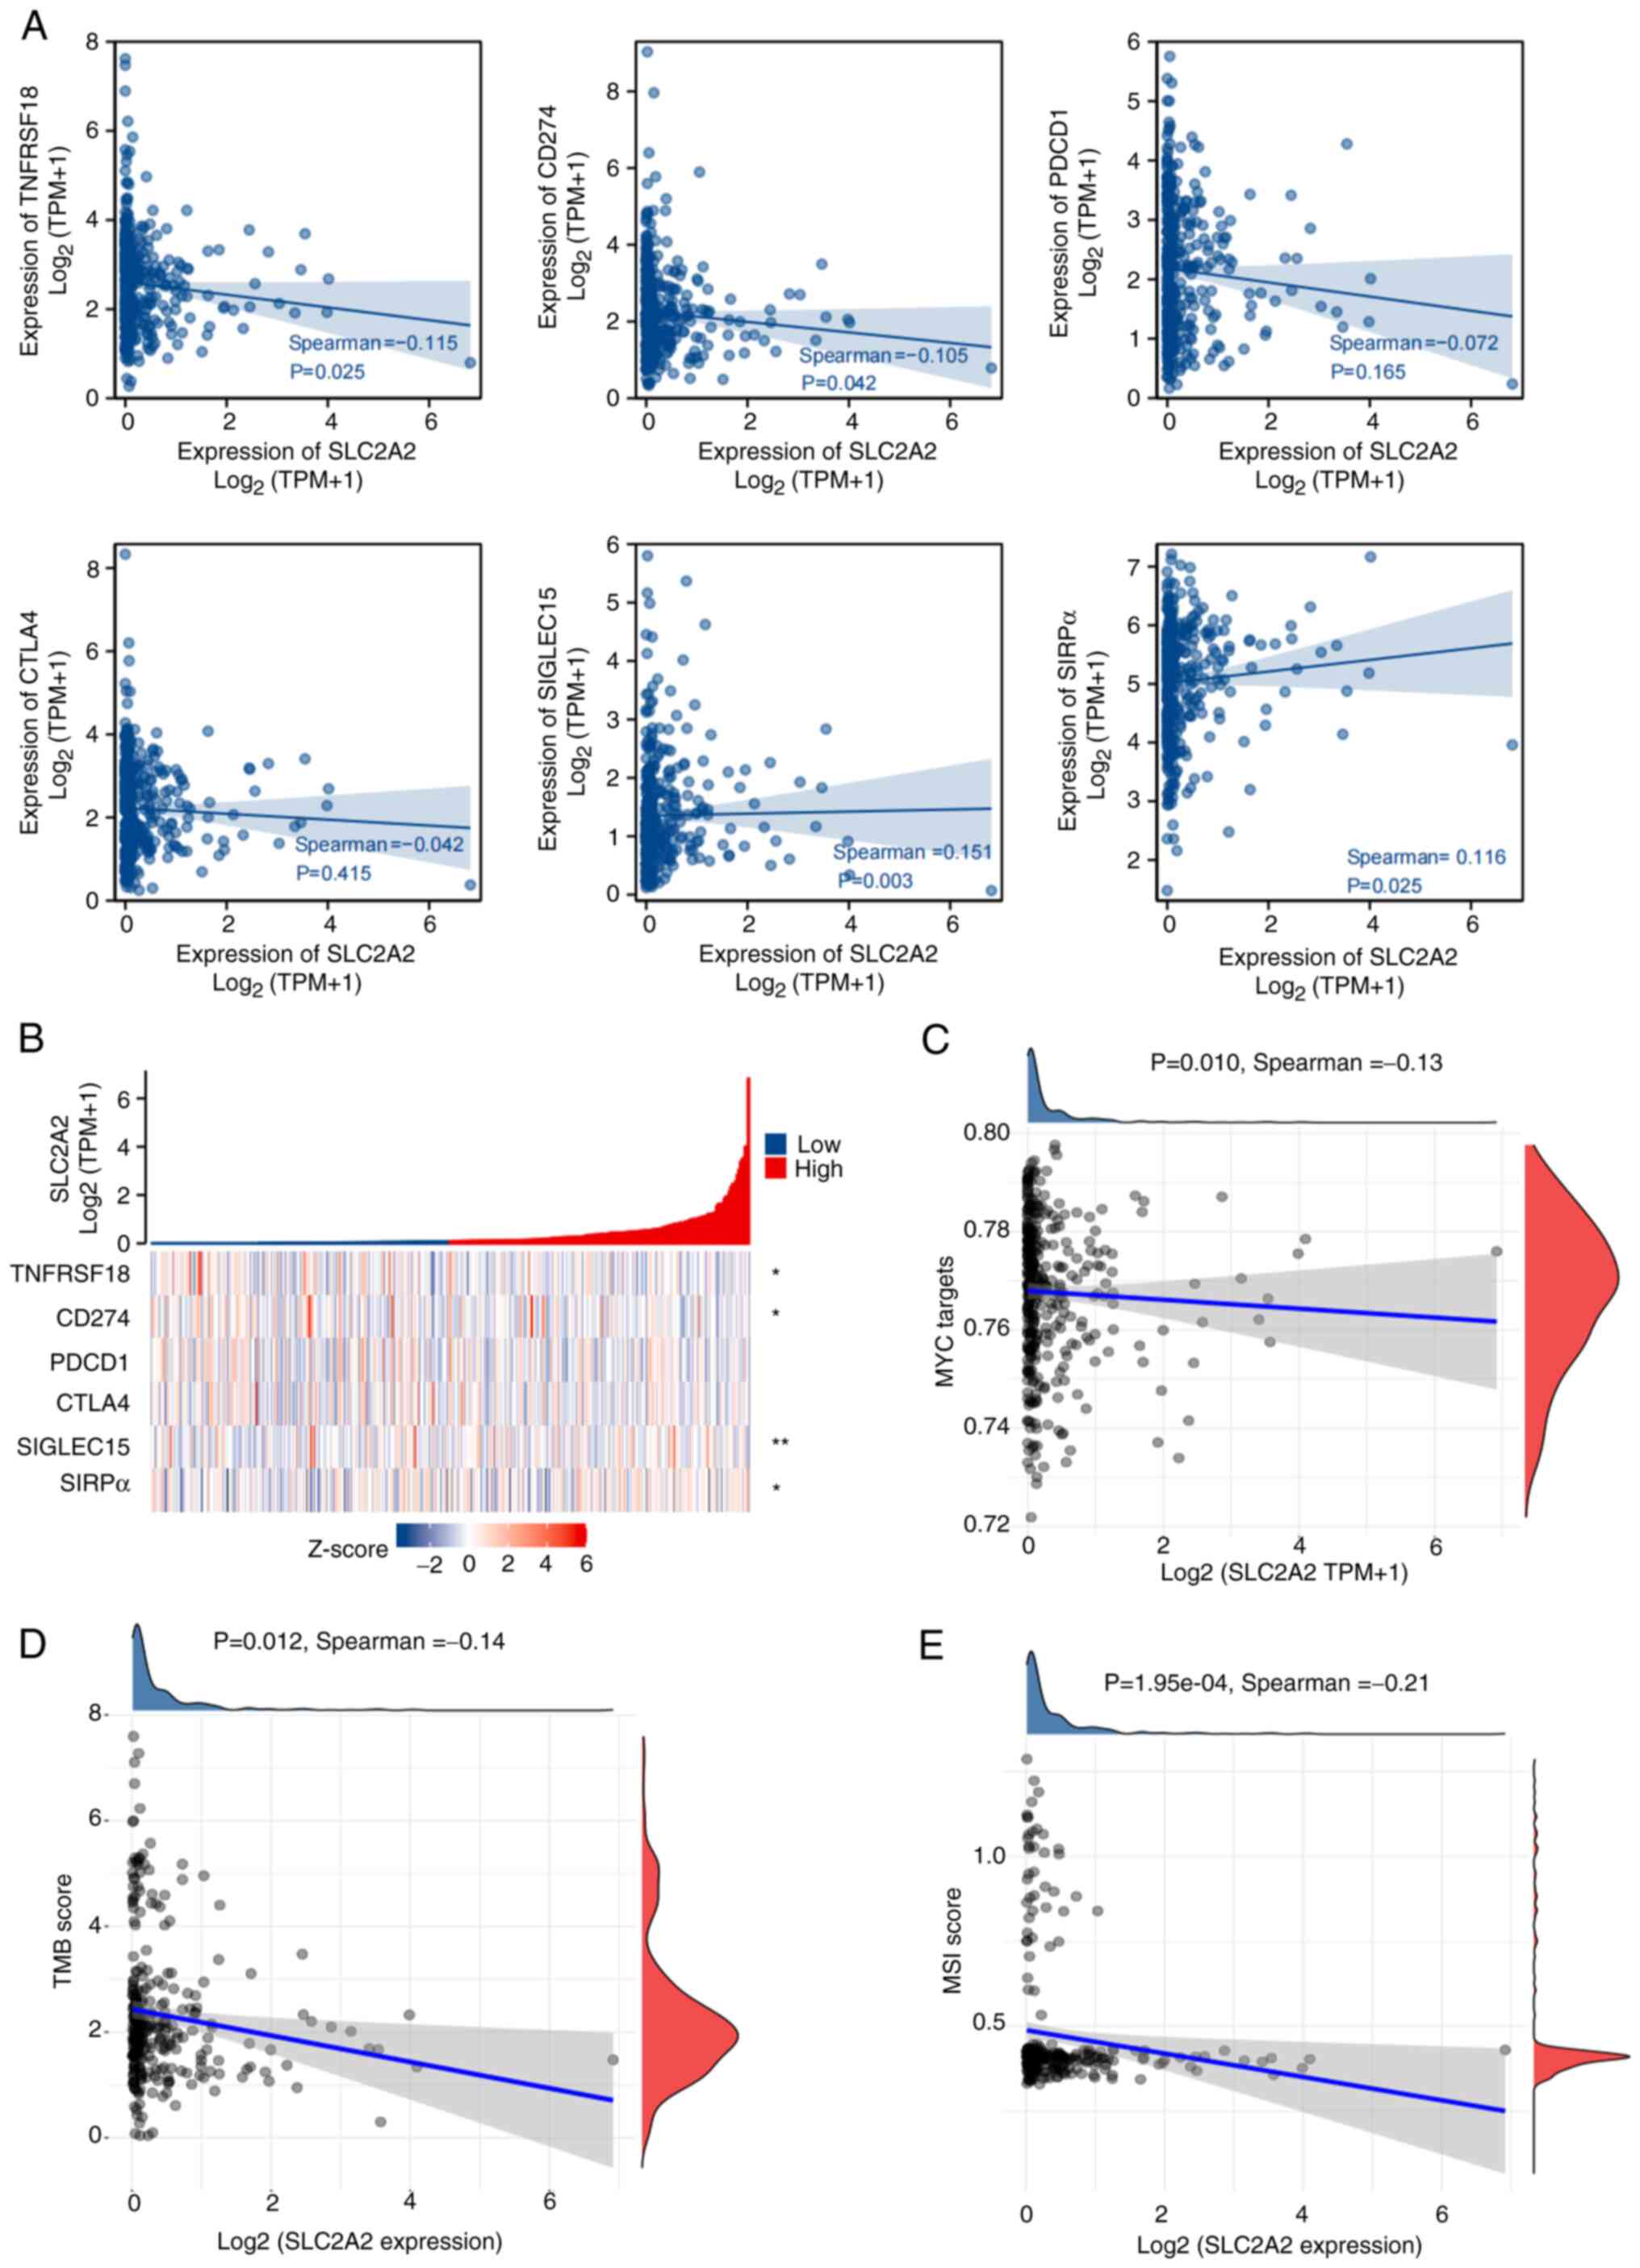 | Figure 5.Spearman's correlation between immune
checkpoints, MYC, TMB and MSI and SLC2A2 expression. (A)
Correlation between SLC2A2 and immune checkpoints. (B)
Heatmap of SLC2A2 co-expression with immune checkpoints. (C)
Association between SLC2A2 and MYC targets. (D) Association
between SLC2A2 and TMB score. (E) Association between
SLC2A2 and MSI score. CTLA4, cytotoxic T-lymphocyte
associated protein 4; MSI, microsatellite instability; PDCD1,
programmed cell death 1; SIGLEC15, sialic acid binding Ig-like
lectin 15; SIRPα, signal regulatory protein α; SLC2A2, solute
carrier family 2 member 2; TMB, tumor mutation burden; TNFRSF18,
TNFR superfamily 18; TPM, transcripts per million. |
To evaluate the association between drug sensitivity
and SLC2A2 expression, the IC50 score was
determined based on Genomics of Drug Sensitivity in Cancer
(12). IC50 scores of
the most common chemotherapy drugs for GC were significantly
increased in the high SLC2A2 expression group as follows:
5-Fluorouracil (P=0.0097), doxorubicin (P=0.00047), A-770041
(P=0.01), etoposide (P=0.0098), mitomycin C (P=0.0028),
parthenolide (P=0.012), saracatinib (P=0.01), imatinib (P=0.015)
and salubrinal (P=0.021) (Fig.
6).
Association between SLC2A2 and GC
prognosis
The effect of SLC2A2 on GC prognosis was
assessed using Kaplan-Meier analysis. High SLC2A2 expression
was associated with worse prognosis in patients with GC with
respect to OS (HR, 1.46; 95% CI, 1.05–2.03; P=0.024), DSS (HR,
1.59; 95% CI, 1.05–2.43; P=0.03) and PFI (HR, 1.46; 95% CI,
1.03–2.08; P=0.036) (Fig. 7A-C).
According to univariate analysis, OS was significantly associated
with high SLC2A2 expression (P=0.024), age >65 years
(P=0.005), T3 stage compared with T1&T2 stage (P=0.016), T4
stage compared with T1&T2 stage (P=0.028), M1 stage compared
with M0 stage (P=0.004), R1&R2 residual tumor (P<0.001), N1
stage compared with N0 stage(P=0.049) and N3 stage compared with N0
stage (P<0.001; Fig. 7D).
However, there was no significant relationship between OS and sex
(0.188) or N2 stage compared with N0 stage (P=0.06) of GC (Fig. 7D). Multivariate regression analysis
with the same variables demonstrated that GC could be independently
prognosticated by SLC2A2 (HR, 1.707; 95% CI, 1.155–2.521;
P=0.007; Fig. 7E). The association
between TNM stage and SLC2A2 expression is shown in the
Sankey diagram (Fig. 7F).
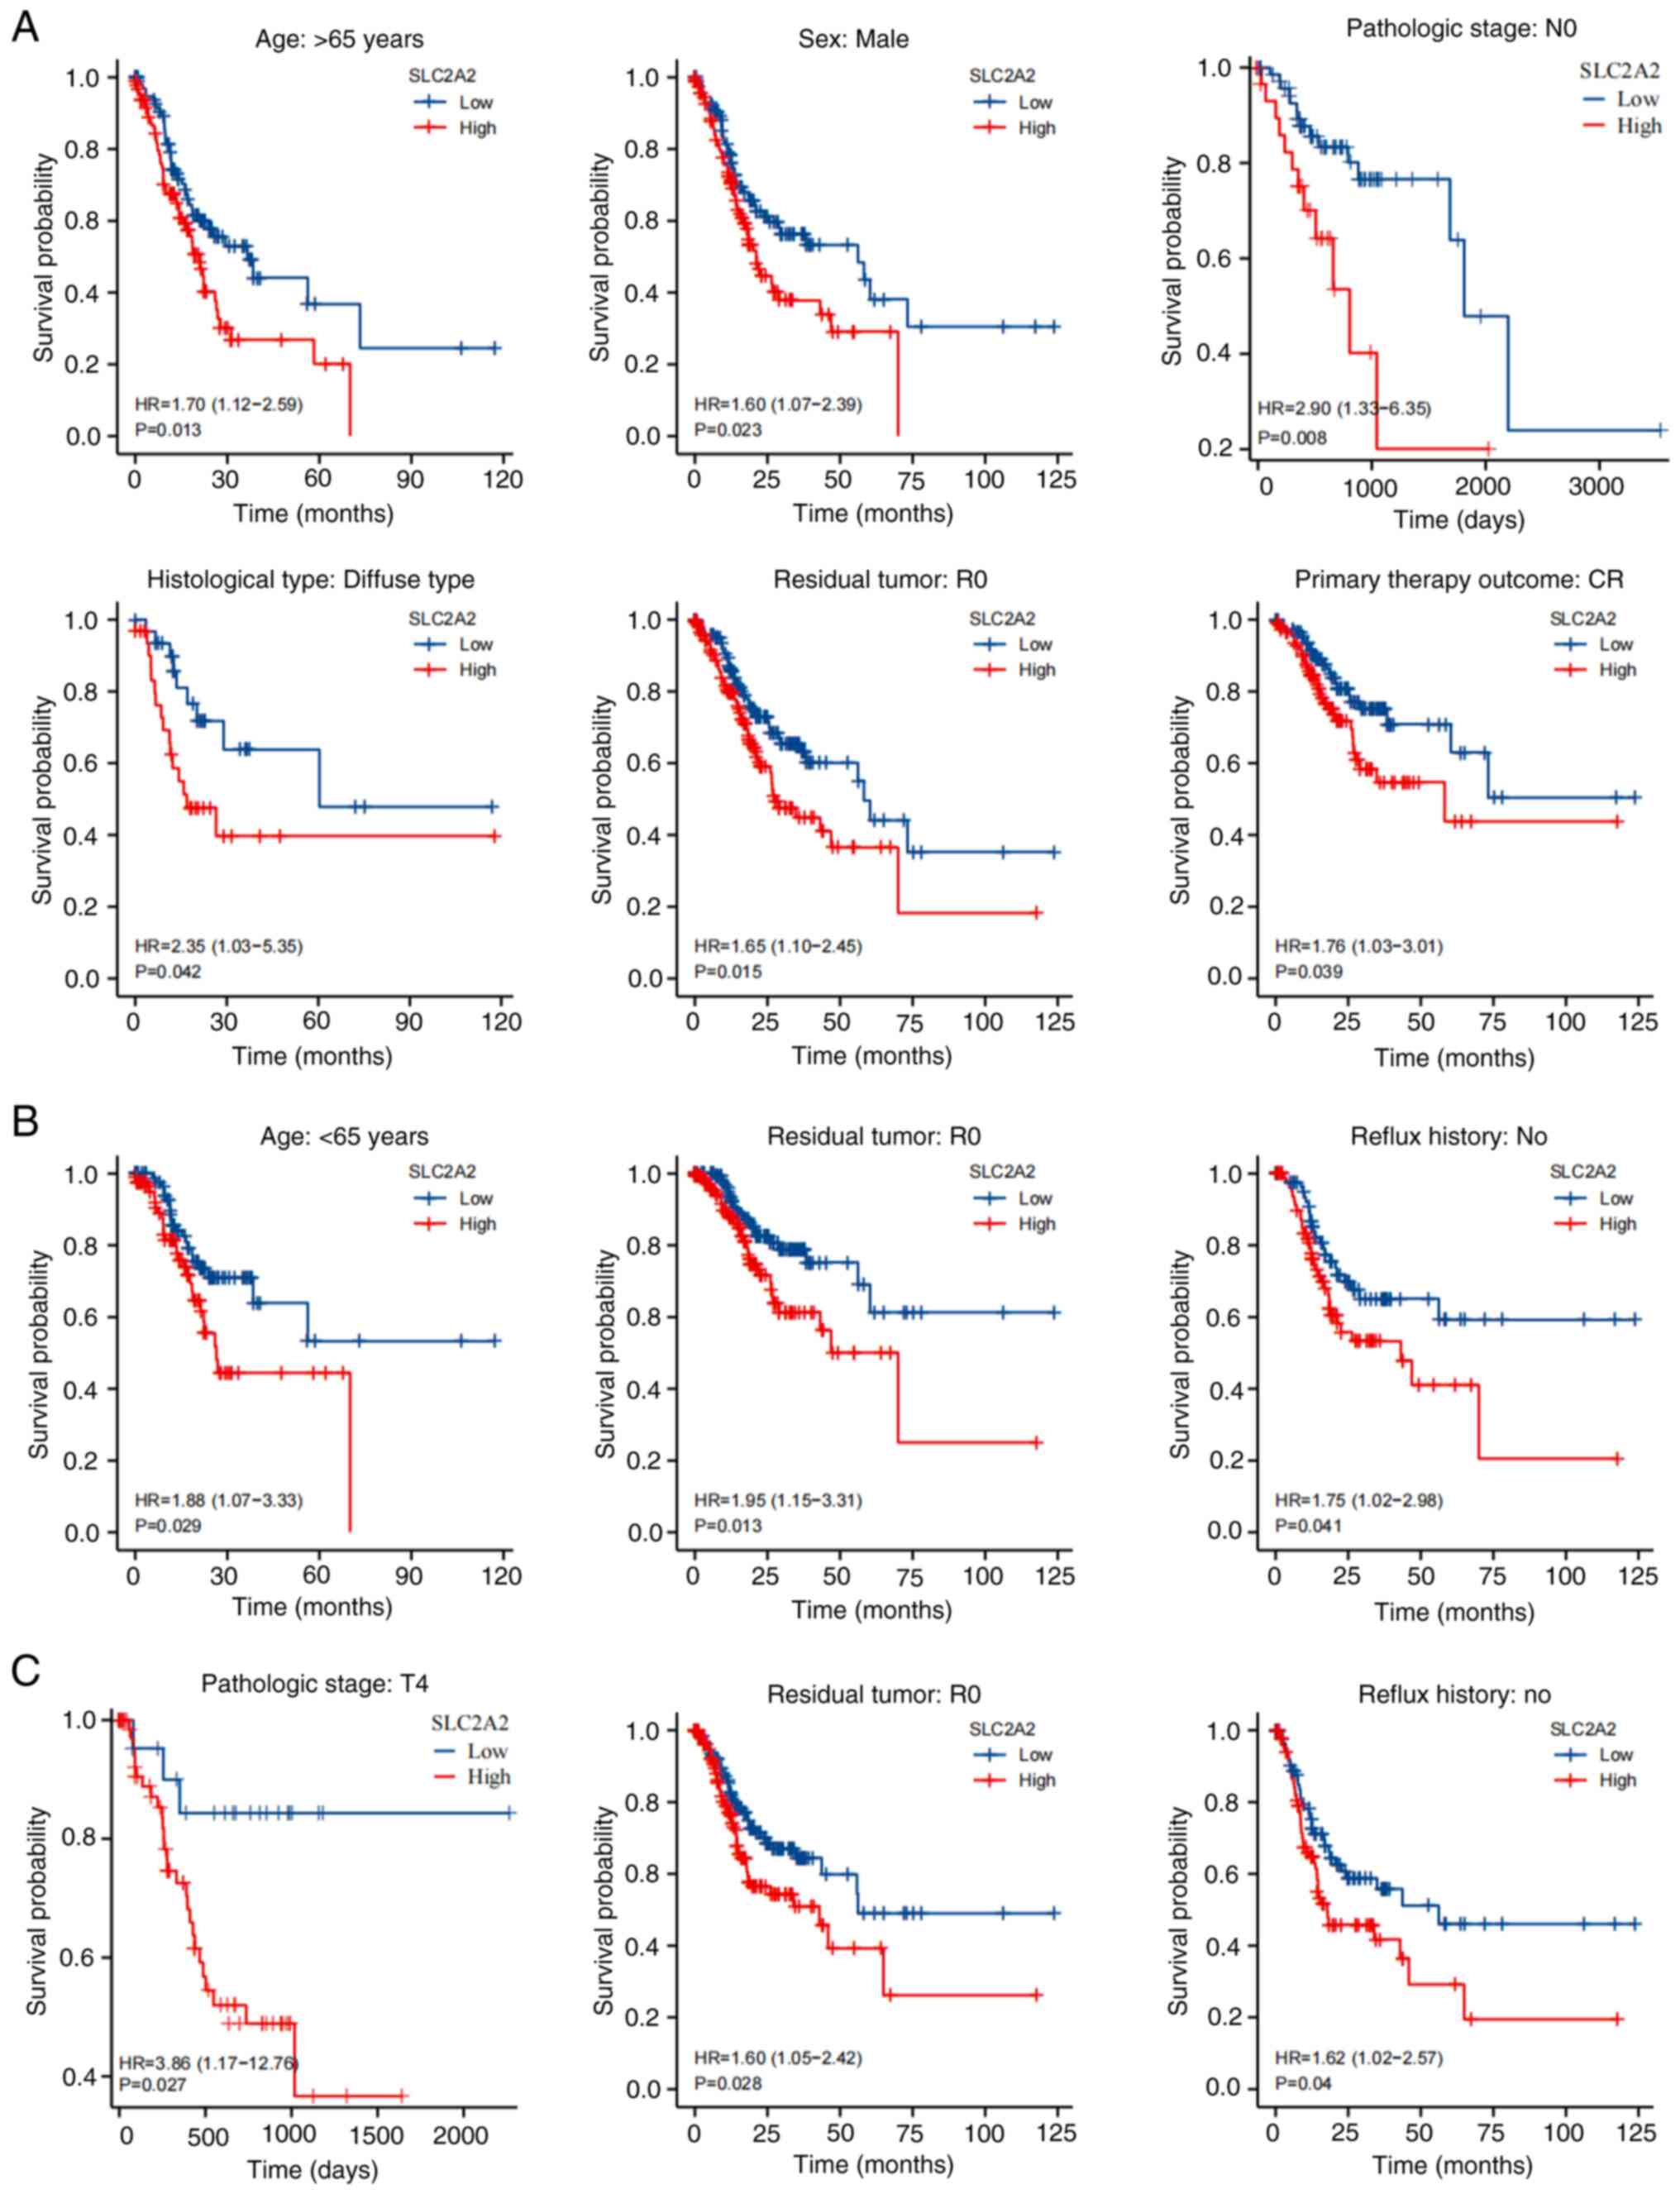
Additionally, subgroup analyses were performed based on variables
identified in the multivariate analysis. For OS rates, patients
with GC with high SLC2A2 expression had a significantly
worse prognosis when analyzing subgroups of patients based on age
>65 years (P=0.013), male sex (P=0.023), N0 stage (P=0.008),
diffuse histological type (P=0.042), R0 residual tumor (P=0.015)
and primary therapy outcome of complete response (P=0.039; Fig. 8A). For DSS rates, high SLC2A2
expression was associated with a worse prognosis in the R0 residual
tumor (P=0.013), age >65 years (P=0.029) and no reflux history
(P=0.041) subgroups (Fig. 8B). T4
stage (P=0.027), R0 residual tumor (P=0.028) and no reflux history
(P=0.04) subgroups of patients exhibited significant differences in
PFI rates between the high and low SLC2A2 expression groups
(Fig. 8C).
The association among SLC2A2 expression,
survival time and risk scores was calculated to determine the
predictive value, and the results showed that with the increasing
expression level of SLC2A2, the risk score of patients was
higher based on the heat map, scatter plot and risk curve (Fig. 9A). The ROC curve was used to verify
the sensitivity and specificity of SLC2A2 in the diagnosis
of GC. The ROC curve had an area under the curve (AUC) of 0.692
based on the clinical data of 624 patients with GC obtained from
GTEx and TCGA (Fig. 9B) and the AUC
for OS rates was 0.548, 0.612 and 0.786 at 1, 4 and 6 years,
respectively (Fig. 9C).
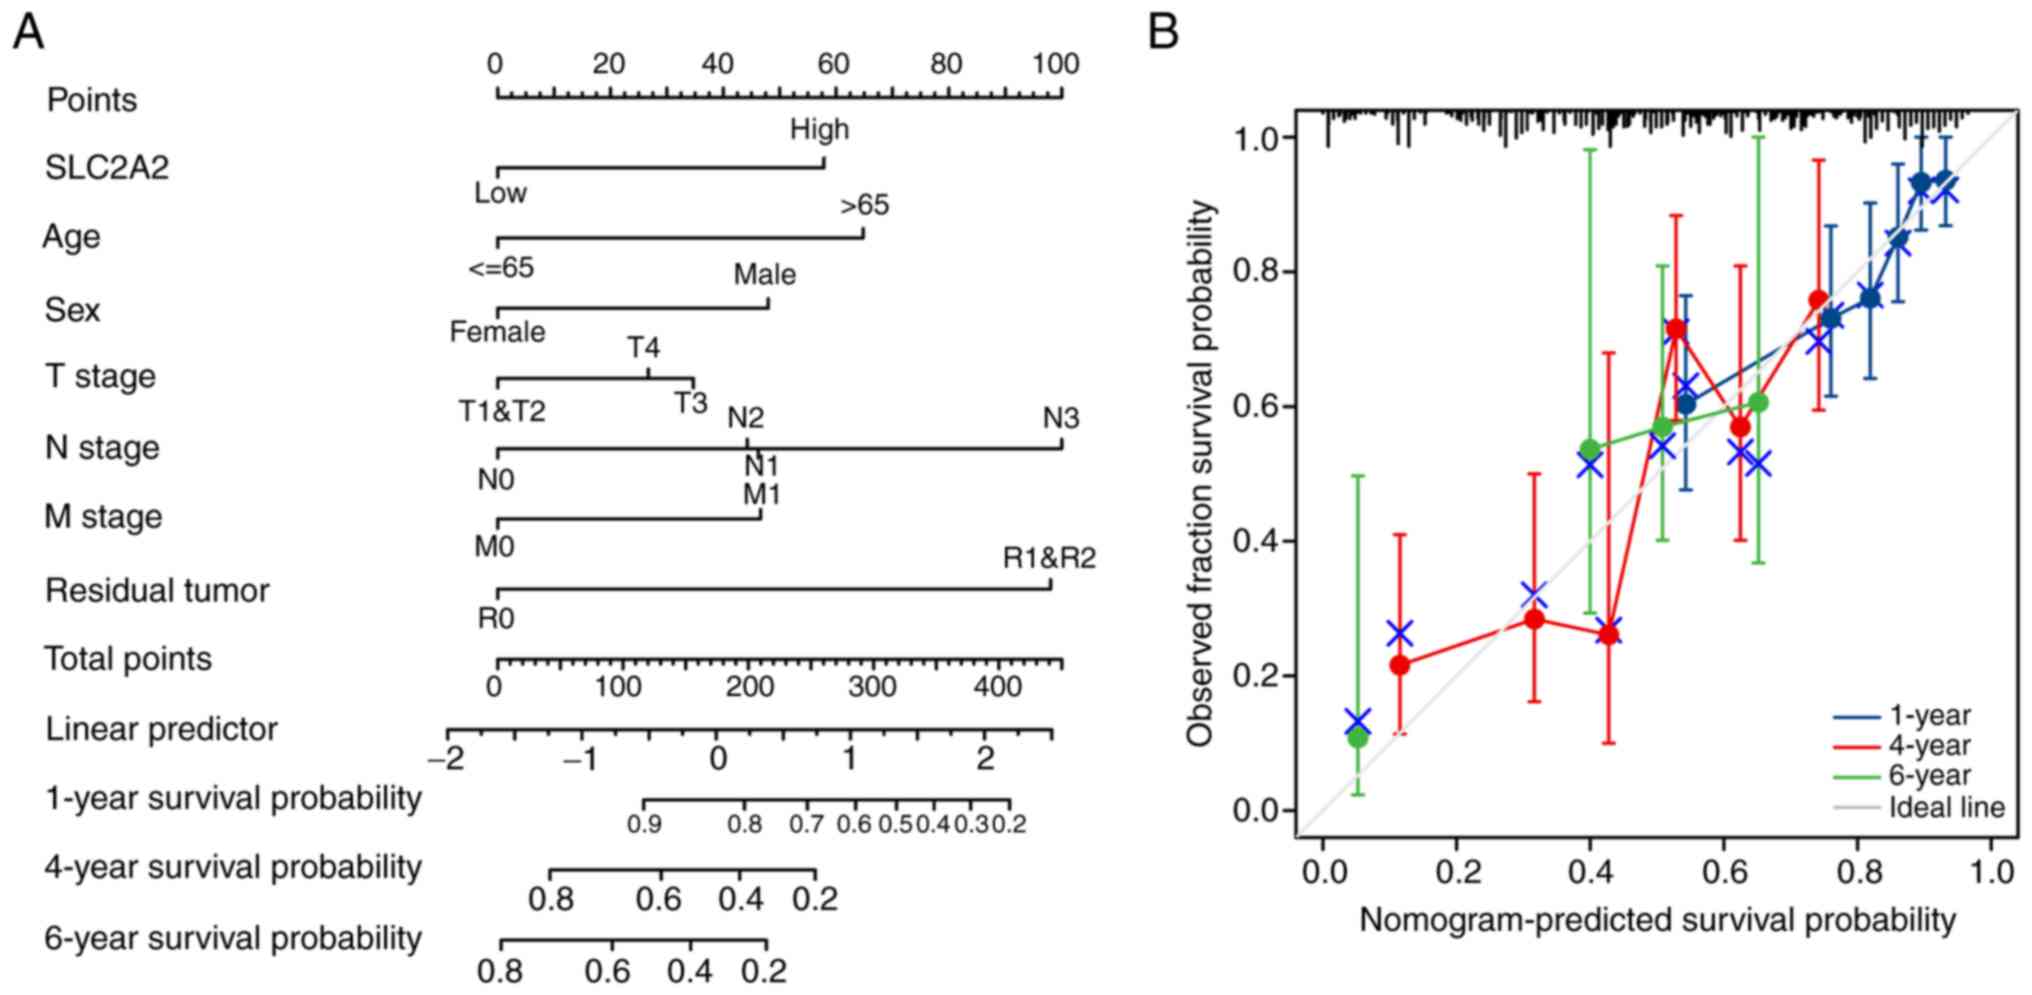
Finally, a nomogram model was constructed, its
predictive power was confirmed and its accuracy quantified. The
concordance index for the nomogram based on the clinical variables,
including SLC2A2 expression, age, sex, T stage, N stage, M
stage and the presence of residual tumor, was calculated as 0.707
(95% CI, 0.681–0.733; Fig. 10A).
According to the calibration plots, the predicted probability was
consistent with the observed outcome (Fig. 10B).
Validation of SLC2A2 expression and
its predictive value
To validate the differential expression of
SLC2A2, a comparison was made between healthy and GC tissues
using the HPA database. GC tissues (medium staining, moderate
intensity) exhibited higher levels of SLC2A2 protein than normal
tissues (low staining, weak intensity; Fig. 11A). For further analyses, two
microarray datasets, GSE38749 and GSE84437, and the corresponding
clinical data of patients with GC were obtained from the GEO
database. Patients with GC were grouped according to survival
status; the deceased group exhibited significantly higher levels of
SLC2A2 than the alive group (P=0.04), based on the GSE38749
dataset (Fig. 11B). Kaplan-Meier
survival analysis revealed an association between high
SLC2A2 expression and poorer prognosis in GC (HR, 5.35; 95%
CI, 1.31–21.95; P=0.02; Fig. 11C).
For the GSE84437 dataset, subgroup analysis was performed according
to age, T stage and N stage. Wilcoxon and Kruskal-Wallis tests
confirmed that SLC2A2 expression varied significantly with
age (>65 vs. ≤65 years; P=0.0094), T3 stage compared with
T1&T2 stage (P=0.019), N1 stage compared with N0 stage
(P=0.011) and N2&N3 stage compared with N0 stage (P<0.01)
(Fig. 11D-F). The effect of
SLC2A2 on GC prognosis was verified using Kaplan-Meier
analysis. High SLC2A2 expression was associated with a worse
prognosis in patients with GC with respect to OS (HR, 1.49; 95% CI,
1.22–1.83; P=0001), progression-free survival (HR, 1.45; 95% CI,
1.15–1.82; P=0.0014) and post-progression survival (HR, 1.47; 95%
CI, 1.15–1.88; P=0.0017; Fig.
11G-I). In terms of OS rates, patients with GC with high
SLC2A2 expression had a significantly worse prognosis in the
analysis of N3 stage (HR, 1.81; P=0.04), male (HR, 1.49; P=0.0022)
and female (HR, 1.54; P=0.015) subgroups of patients (Fig. 11J-L).
Immunohistochemical analysis of
SLC2A2
The TMA contained 46 samples, including 40 samples
of GC and 6 samples of adjacent gastric tissues (Table II). The GC samples comprised two
T2, 19 T3 and 19 T4 stage samples and seven N0, five N1, eight N2
and 20 N3 samples (Table II). IHC
staining showed that SLC2A2 was primarily expressed in the
cytoplasm and membrane of normal human gastric mucosal epithelial
and GC cells (Fig. 12A and D).
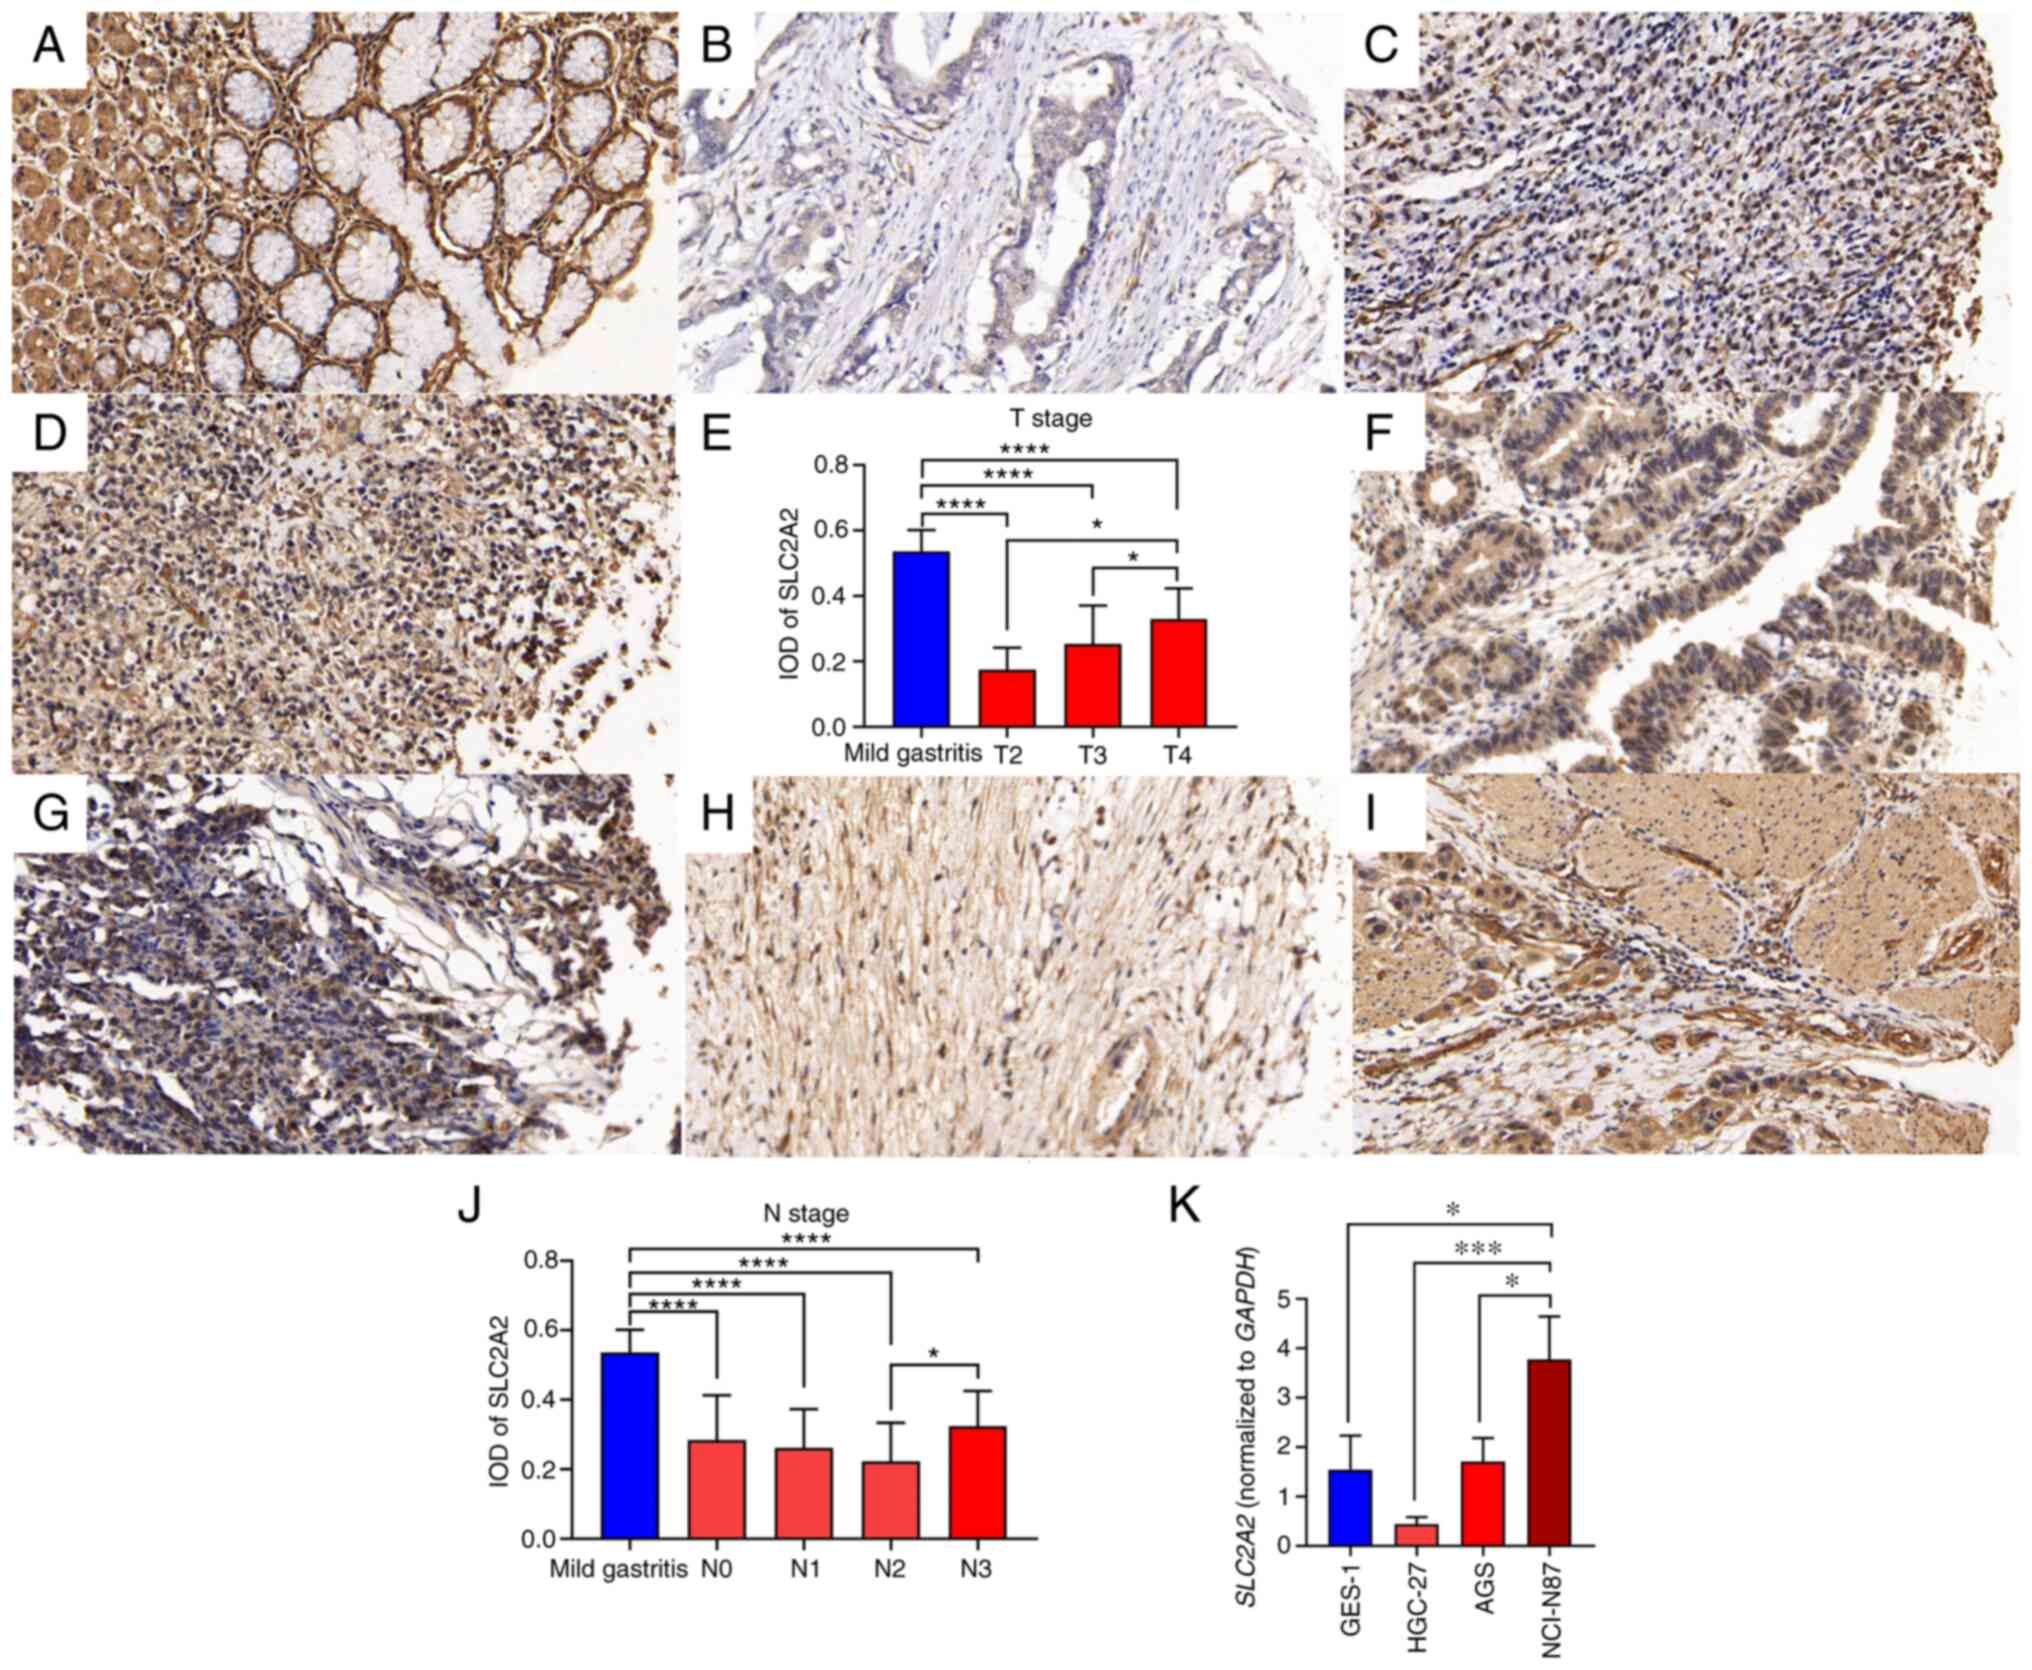 | Figure 12.IHC staining and reverse
transcription-quantitative PCR analysis of SLC2A2 in GC. (A) IHC
staining of SLC2A2 in mild gastritis. (B) IHC staining of SLC2A2 in
T2 stage of GC. (C) IHC staining of SLC2A2 in T3 stage of GC. (D)
IHC staining of SLC2A2 in T4 stage of GC. (E) IOD analysis of
SLC2A2 in different T stages. (F) IHC staining of SLC2A2 in the N0
stage of GC. (G) IHC staining of SLC2A2 in the N1 stage of GC. (H)
IHC staining of SLC2A2 in the N2 stage of GC. (I) IHC staining of
SLC2A2 in the N3 stage of GC. (J) IOD analysis of SLC2A2 in
different N stages. (K) Quantification of SLC2A2 mRNA expression.
Magnification, ×400. *P<0.05, ***P<0.001, ****P<0.0001, T2
vs. mild gastritis, T3 vs. mild gastritis, T4 vs. mild gastritis,
T4 vs. T2, T4 vs. T3, N0 vs. mild gastritis, N1 vs. mild gastritis,
N2 vs. mild gastritis, N3 vs. mild gastritis, and N3 vs. N2. GC,
gastric cancer; IHC, immunohistochemistry; IOD, integrated optical
density; SLC2A2, solute carrier family 2 member 2. |
| Table II.Baseline characteristics of 46
samples in the tissue microarray. |
Table II.
Baseline characteristics of 46
samples in the tissue microarray.
|
| Number of
samples |
|---|
|
|
|
|---|
| Characteristic | Gastric cancer | Adjacent gastric
tissue |
|---|
| Pathology |
|
|
| Mild
gastritis | 0 | 6 |
| Gastric
adenocarcinoma | 40 | 0 |
| Age, years |
|
|
|
≤65 | 26 | 4 |
|
>65 | 14 | 2 |
| Sex |
|
|
|
Female | 13 | 2 |
|
Male | 27 | 4 |
| T stage |
|
|
| 1 | 0 | - |
| 2 | 2 | - |
| 3 | 19 | - |
| 4 | 19 | - |
| N stage |
|
|
| 0 | 7 | - |
| 1 | 5 | - |
| 2 | 8 | - |
| 3 | 20 | - |
IHC staining showed that there were significant
differences in SLC2A2 expression among different T and N stages of
GC (Fig. 12A-J). SLC2A2 expression
in T4 GC was significantly higher than that in T3 (P=0.027) and T2
(P=0.0485) GC (Fig. 12E), and
SLC2A2 expression in N3 GC was significantly higher than that in N2
GC (P=0.0264; Fig. 12J). IHC
demonstrated that SLC2A2 expression in mild gastritis tissues was
significantly higher than that in GC tissues of different stages,
including N and T stages (P<0.0001).
RT-qPCR analysis of SLC2A2
To verify the differential expression of
SLC2A2 in normal gastric mucosal epithelial cells and GC
cell lines, RT-qPCR was performed. SLC2A2 expression in GC
cells with different degrees of differentiation was significantly
different (Fig. 12K). Among them,
HGC-27 cells were derived from relatively differentiated GC
tissues, NCI-N87 cells were isolated from male patients with GC
complicated with liver metastasis and AGS cells were derived from
an untreated primary GC excision fragment. All three types of GC
cells had different degrees of malignant transformation potential
(21–23). SLC2A2 expression was the
highest in NCI-N87 cells and significantly differed from that in
GES-1 (P=0.0174), AGS (P=0.026) and HGC-27 cells (P=0.0009),
indicating that the expression of SLC2A2 was related to the
degree of malignancy.
Discussion
Despite improvements in clinical diagnosis and
surgical techniques, chemotherapy resistance and metastasis are
major challenges in improving the prognosis of malignant GC
(24). Therefore, identifying
effective prognostic biomarkers and targets associated with
immunological interventions is a GC research hotspot (8,25).
Under hypoxic conditions, tumor cells require large amounts of
metabolites and nutrients to meet their high metabolic energy
demand (26). SLC2A2, an
important member of the SLC2A family, is mainly responsible for
transferring glucose into cells and may be involved in tumor
development and invasion (10). In
the present study, SLC2A2 was evaluated as a prospective
prognostic marker and chemotherapeutic target for GC.
In pan-cancer differential SLC2A2 expression
analysis, SLC2A2 expression was considerably downregulated
in most types of tumor but upregulated in GC, suggesting that
SLC2A2 may serve a different role in the occurrence and
development of GC compared with other types of tumor. It was
hypothesized that this was due to the continuous production of
gastric acid and accumulation of lactic acid, which results in a
lower pH and enhanced glycolytic metabolic activity in the GC
microenvironment compared with other malignant tumors (27,28).
GLUT, a promoter of the glycolytic pathway, is associated with the
upregulation of glucose metabolism in cancer cells (29). Therefore, the expression of glucose
transporters (GLUT1-3) in GC is higher than that in normal gastric
mucosa (30). The functional
enrichment analysis indicated that SLC2A2 expression was
associated with lipid metabolism. As part of tumor metabolic
reprogramming, abnormal tumor lipid and glucose metabolism serve an
important role in tumorigenesis, metastasis and prognosis (31–33).
Numerous studies have demonstrated that tumor cells are
characterized by deregulation of lipid metabolism, which has a
regulatory effect on the tumor immune microenvironment (34–36).
Immune infiltration levels were examined in high
and low SLC2A2 expression GC cases using QUANTISEQ based on
10 immune cell subtypes and an uncharacterized cell. In the
immunological correlation analysis between SLC2A2 and 10
different immune cells, high immune infiltration of M2 macrophages
and low immune infiltration of M1 macrophages were observed in
patients with GC with high SLC2A2 expression, although the
correlations were weak. However, in the analysis of immune
infiltration scores dividing GC into high expression and low
expression groups based on the median expression of SLC2A2,
only M1 macrophages showed significant differences, while M2
macrophages were markedly different between the high expression,
low expression and normal groups of SLC2A2. We speculate
that this is related to the small sample size of the normal group
in this analysis of immune score and the weak correlation between
SLC2A2 and macrophages. As is well known, there is a dynamic
balance of mutual inhibition between M1 polarization and M2
polarization of macrophages (37).
Since the GC high expression group of SLC2A2 has a lower
level of M1 macrophage infiltration, we have reason to speculate
that the infiltration level of M2 macrophages will also
correspondingly increase, and increasing the sample size of the
normal group for this immune score may enhance the significant
relationship between SLC2A2 and M2 macrophages. M2
macrophages are tumor-associated macrophages that promote the
growth and metastasis of GC by secreting proteins or cytokines,
such as chitinase 3 like 1 (37,38).
Therefore, it was hypothesized that high SLC2A2 expression
mainly affects the prognosis of GC by increasing infiltration of M2
macrophages with tumor-promoting characteristics and reducing the
infiltration of M1 macrophages with tumor-inhibiting
characteristics. Furthermore, tumor-associated neutrophils induce
the formation of neovessels via MMP-9, which influences tumor
intravasation and angiogenesis (39–41).
The high infiltration of M2 macrophages and neutrophils in tumors
is associated with shorter OS, suggesting that high SLC2A2
expression may contribute to immune suppression during cancer
progression (42–44). A recent study also demonstrated that
high solute carrier family 35 member A2 expression is associated
with cell metabolism and macrophage polarization during progression
of GC, indicating that the SLC family genes may promote cancer cell
proliferation and angiogenesis by regulating the metabolic activity
of immune and endothelial cells associated with GC cell metabolism
in the tumor microenvironment (45).
A significant inverse correlation was observed
between SLC2A2 expression and immune checkpoints, including
GITR and PD-L1. Immunotherapy has gained attention for its
potential to improve the quality of life in patients with cancer,
and TMB/MSI has been demonstrated as a key biomarker for immune
checkpoint inhibitor response (46,47).
The present study demonstrated that high SLC2A2 expression
was associated with decreased TMB and MSI scores in GC, which means
that the immunotherapy effect will be worse. Therefore, the
IC50 was used to evaluate the drug sensitivity
associated with SLC2A2 expression. The IC50 of
the most commonly used chemotherapy drugs for GC, including
5-fluorouracil, doxorubicin and etoposide, was significantly
increased the high SLC2A2 expression group. Based on these
findings, SLC2A2 may be a useful target for personalized
chemotherapy in GC.
Univariate and multivariate Cox regression analyses
demonstrated that GC was independently prognosticated by
SLC2A2. High SLC2A2 expression is positively
associated with higher OS for liver and breast cancer and other
malignancies (10,11). However, the present study
demonstrated that patients with GC with high SLC2A2 levels
had worse OS, DSS and PFI outcomes. It was hypothesized that this
discrepancy may be attributed to SLC2A2 serving a different
role in the glucose and lipid metabolism of GC. GC cells have a
different glucose metabolism compared with normal epithelial cells,
and GLUT1 expression is associated with intestinal gastric
carcinoma (48,49). In association with protein kinase B
signaling, SLC2A2 upregulation may enhance glucose
transportation, leading to tumor growth and progression of GC
(50,51). Apoptosis has been demonstrated to
occur in cancer cells following glucose starvation in previous
studies (52–54). Glucose is an important nutrient for
tumor growth and low SLC2A2 expression leads to GC cells
receiving less nutrition and, consequently, entering the glucose
starvation state, which induces cell apoptosis, and thus, serves an
inhibitory role in GC (55,56).
IHC also demonstrated that SLC2A2 expression in
mild gastritis tissues was significantly higher than that in GC
tissues of different stages, including N and T stages. It was
hypothesized that this may be due to abnormally enhanced metabolic
reprogramming in GC, such as aerobic glycolysis and lipid
metabolism, which may compensate for the promotion of glucose
transport in normal gastric tissues adjacent to cancer tissues,
thereby upregulating SLC2A2 expression. Although normal
mucosa samples derived from tissues adjacent to tumors in patients
with GC were characterized, the specific regulatory mechanisms of
high expression of SLC2A2 in normal gastric mucosa and the
formation and development of GC tissue require further study.
Furthermore, a recent study found that under glucose starvation,
cancer cells with high solute carrier family 7 member 11 expression
underwent disulfidptosis due to excessive accumulation of
disulfide, and treatment with GLUT inhibitor induced disulfidptosis
of cancer cells and effectively inhibited tumor growth (57). As a key member of the GLUT family,
SLC2A2 may be an effective tool to improve the prognosis of
GC by developing inhibitors of SLC2A2 to induce
disulfidptosis.
To conclude, SLC2A2 may be a prospective
prognostic marker and novel immunotherapy target for GC. The
prediction model may improve the prognosis of patients with GC in
clinical practice and SLC2A2 may serve as a novel
therapeutic target to provide novel immunotherapy plans for GC.
However, the present study had limitations. The predictive efficacy
of the model requires validation using GC samples from different
stages and multicenter prospective studies. Furthermore, the
potential molecular mechanism of action of SLC2A2 in GC
requires investigation.
Acknowledgements
Not applicable.
Funding
The present study was supported by Innovation Team and Talents
Cultivation Program of National Administration of Traditional
Chinese Medicine (grant no. ZYYCXTD-C-202208), Key-Area Research
and Development Program of Guangdong Province-Modernization of
Chinese Medicine in Lingnan (grant no. 2020B1111100011), Sanming
Project of Medicine in Shenzhen (grant no. SZZYSM202211002), and
Guangdong Basic and Applied Basic Research Foundation (grant no.
2020A1515110947).
Availability of data and materials
The datasets used and/or analyzed during the
current study are available from the corresponding author on
reasonable request.
Authors' contributions
WZ, DZ and SS collected and analyzed data and
prepared the figures. WZ, DZ, YW, SL and SZ carried out data
collection and wrote the manuscript. XC, YH, YL, XH, YX and SG
interpreted the data and revised the manuscript. HP and HL
conceived and designed the study. HL and HP confirm the
authenticity of all the raw data. All authors have read and
approved the final manuscript.
Ethics approval and consent to
participate
The present study was approved by the Medical
Ethics Committee of Shenzhen Traditional Chinese Medicine Hospital
(approval no. K2022-011-02; Shenzhen, China).
Patient consent for publication
Not applicable.
Competing interests
The authors declare that they have no competing
interests.
Glossary
Abbreviations
Abbreviations:
|
GC
|
gastric cancer
|
|
SLC2A2
|
solute carrier family 2 member 2
|
|
GLUT2
|
glucose transporter type 2
|
|
TMB
|
tumor mutation burden
|
|
TCGA
|
The Cancer Genome Atlas
|
|
GTEx
|
Genotype-Tissue Expression
|
|
DEG
|
differentially expressed gene
|
|
GO
|
Gene Ontology
|
|
KEGG
|
Kyoto Encyclopedia of Genes and
Genomes
|
|
BP
|
biological process
|
|
CC
|
cellular component
|
|
GSEA
|
gene set enrichment analysis
|
|
GITR
|
glucocorticoid-induced tumor necrosis
factor-related
|
|
TNFRSF18
|
TNFR superfamily 18
|
|
PDCD1
|
programmed cell death 1
|
|
CTLA4
|
cytotoxic T-lymphocyte associated
protein 4
|
|
SIGLEC15
|
sialic acid binding Ig-like lectin
15
|
|
IHC
|
immunohistochemistry
|
|
SIRPα
|
signal regulatory protein α
|
|
DSS
|
disease-specific survival
|
|
PFI
|
progression-free interval
|
|
HPA
|
Human Protein Atlas
|
|
GEO
|
Gene Expression Omnibus
|
|
OS
|
overall survival
|
|
MSI
|
microsatellite instability
|
|
TMA
|
tissue microarray
|
|
HR
|
hazard ratio
|
References
|
1
|
Shi J, Fu H, Jia Z, He K, Fu L and Wang W:
High expression of CPT1A predicts adverse outcomes: A potential
therapeutic target for acute myeloid leukemia. EBiomedicine.
14:55–64. 2016. View Article : Google Scholar : PubMed/NCBI
|
|
2
|
Granito A, Marinelli S, Negrini G, Menetti
S, Benevento F and Bolondi L: Prognostic significance of adverse
events in patients with hepatocellular carcinoma treated with
sorafenib. Ther Adv Gastroenterol. 9:240–249. 2016. View Article : Google Scholar : PubMed/NCBI
|
|
3
|
Xiaobin C, Zhaojun X, Tao L, Tianzeng D,
Xuemei H, Fan Z, Chunyin H, Jianqiang H and Chen L: Analysis of
related risk factors and prognostic factors of gastric cancer with
bone metastasis: A SEER-based study. J Immunol Res.
2022:32510512022. View Article : Google Scholar : PubMed/NCBI
|
|
4
|
Zhong Y, Kang W, Hu H, Li W, Zhang J and
Tian Y: Lobaplatin-based prophylactic hyperthermic intraperitoneal
chemotherapy for T4 gastric cancer patients: A retrospective
clinical study. Front Oncol. 13:9956182023. View Article : Google Scholar : PubMed/NCBI
|
|
5
|
Yang J, Wei H, Liu M, Huang T, Fang X, Ren
X, Huang T, Fang X, Ren X, Yuan H, et al: Prognostic biomarker HAMP
and associates with immune infiltration in gastric cancer. Int
Immunopharmacol. 108:1088392022. View Article : Google Scholar : PubMed/NCBI
|
|
6
|
Kim YH, Jeong DC, Pak K, Han ME, Kim JY,
Liangwen L, Kim HJ, Kim TW, Kim TH, Hyun DW and Oh SO: SLC2A2
(GLUT2) as a novel prognostic factor for hepatocellular carcinoma.
Oncotarget. 8:68381–68392. 2017. View Article : Google Scholar : PubMed/NCBI
|
|
7
|
Wei L, Sun J, Zhang N, Zheng Y, Wang X, Lv
L, Liu J, Xu Y, Shen Y and Yang M: Noncoding RNAs in gastric
cancer: Implications for drug resistance. Mol Cancer. 19:622020.
View Article : Google Scholar : PubMed/NCBI
|
|
8
|
Ding N, Zou Z, Sha H, Su S, Qian H, Meng
F, Chen F, Du S, Zhou S, Chen H, et al: iRGD synergizes with PD-1
knockout immunotherapy by enhancing lymphocyte infiltration in
gastric cancer. Nat Commun. 10:13362019. View Article : Google Scholar : PubMed/NCBI
|
|
9
|
Shi H, Wang H, Pan J, Liu Z and Li Z:
Comparing prognostic value of preoperative platelet indexes in
patients with resectable gastric cancer. Sci Rep. 12:64802022.
View Article : Google Scholar : PubMed/NCBI
|
|
10
|
Mukhopadhyay P, Ye J, Anderson KM,
Roychoudhury S, Rubin EH, Halabi S and Chappell RJ: Log-rank test
vs MaxCombo and difference in restricted mean survival time tests
for comparing survival under nonproportional hazards in
immuno-oncology trials: A systematic review and meta-analysis. JAMA
Oncol. 8:1294–1300. 2022. View Article : Google Scholar : PubMed/NCBI
|
|
11
|
Sperduto PW, Yang TJ, Beal K, Pan H, Brown
PD, Bangdiwala A, Shanley R, Yeh N, Gaspar LE, Braunstein S, et al:
Estimating survival in patients with lung cancer and brain
metastases: An update of the graded prognostic assessment for lung
cancer using molecular markers (lung-molGPA). JAMA Oncol.
3:827–831. 2017. View Article : Google Scholar : PubMed/NCBI
|
|
12
|
Abu N, Othman N, W Hon K, Nazarie WF and
Jamal R: Integrative meta-analysis for the identification of hub
genes in chemoresistant colorectal cancer. Biomark Med. 14:525–537.
2020. View Article : Google Scholar : PubMed/NCBI
|
|
13
|
Yoshikawa T, Inoue R, Matsumoto M, Yajima
T, Ushida K and Iwanaga T: Comparative expression of hexose
transporters (SGLT1, GLUT1, GLUT2 and GLUT5) throughout the mouse
gastrointestinal tract. Histochem Cell Biol. 135:183–194. 2011.
View Article : Google Scholar : PubMed/NCBI
|
|
14
|
Zhang Y, Liu Y, Huang J, Hu Z and Miao Y:
Identification of new head and neck squamous cell carcinoma
subtypes and development of a novel score system (PGSscore) based
on variations in pathway activity between tumor and adjacent
non-tumor samples. Comput Struct Biotechnol J. 20:4786–4805. 2022.
View Article : Google Scholar : PubMed/NCBI
|
|
15
|
Pasini FS, Zilberstein B, Snitcovsky I,
Roela RA, Mangone FR, Ribeiro UJ Jr, Nonogaki S, Brito GC,
Callegari GD, Cecconello I, et al: A gene expression profile
related to immune dampening in the tumor microenvironment is
associated with poor prognosis in gastric adenocarcinoma. J
Gastroenterol. 49:1453–1466. 2014. View Article : Google Scholar : PubMed/NCBI
|
|
16
|
Yoon SJ, Park J, Shin Y, Choi Y, Park SW,
Kang SG, Son HY and Huh YM: Deconvolution of diffuse gastric cancer
and the suppression of CD34 on the BALB/c nude mice model. BMC
Cancer. 20:3142020. View Article : Google Scholar : PubMed/NCBI
|
|
17
|
Manning L, O'Rourke KI, Knowles DP, Marsh
SA, Spencer YI, Moffat E, Wells GA and Czub S: A collaborative
Canadian-United Kingdom evaluation of an immunohistochemistry
protocol to diagnose bovine spongiform encephalopathy. J Vet Diagn
Invest. 20:504–508. 2008. View Article : Google Scholar : PubMed/NCBI
|
|
18
|
Livak KJ and Schmittgen TD: Analysis of
relative gene expression data using real-time quantitative PCR and
the 2(−Delta Delta C(T)) method. Methods. 25:402–408. 2001.
View Article : Google Scholar : PubMed/NCBI
|
|
19
|
Qin Y, Liu H, Huang X, Huang L, Liao L, Li
J, Zhang L, Li W and Yang J: GIMAP7 as a potential predictive
marker for pan-cancer prognosis and immunotherapy efficacy. J
Inflamm Res. 15:1047–1061. 2022. View Article : Google Scholar : PubMed/NCBI
|
|
20
|
He J, Chen Z, Xue Q, Sun P, Wang Y, Zhu C
and Shi W: Identification of molecular subtypes and a novel
prognostic model of diffuse large B-cell lymphoma based on a
metabolism-associated gene signature. J Transl Med. 20:1862022.
View Article : Google Scholar : PubMed/NCBI
|
|
21
|
Li J, Xue H, Xiang Z, Song S, Yan R, Ji J,
Zhu Z, Wei C and Yu Y: Genetic profiles affect the biological
effects of serine on gastric cancer cells. Front Pharmacol.
11:11832020. View Article : Google Scholar : PubMed/NCBI
|
|
22
|
Seeneevassen L, Giraud J, Molina-Castro S,
Sifré E, Tiffon C, Beauvoit C, Staedel C, Mégraud F, Lehours P,
Martin OCB, et al: Leukaemia inhibitory factor (LIF) inhibits
cancer stem cells tumorigenic properties through hippo kinases
activation in gastric cancer. Cancers (Basel). 12:20112020.
View Article : Google Scholar : PubMed/NCBI
|
|
23
|
Ma J, Chen M, Wang J, Xia HH, Zhu S, Liang
Y, Gu Q, Qiao L, Dai Y, Zou B, et al: Pancreatic duodenal
homeobox-1 (PDX1) functions as a tumor suppressor in gastric
cancer. Carcinogenesis. 29:1327–1333. 2008. View Article : Google Scholar : PubMed/NCBI
|
|
24
|
Wang Y, Fang Y, Zhao F, Gu J, Lv X, Xu R,
Zhang B, Fang Z and Li Y: Identification of GGT5 as a novel
prognostic biomarker for gastric cancer and its correlation with
immune cell infiltration. Front Genet. 13:8102922022. View Article : Google Scholar : PubMed/NCBI
|
|
25
|
Xu W, Sun T, Wang J, Li H, Chen B, Zhou Y,
Wang T, Wang S, Liu J and Jiang H: LMO3 downregulation in PCa: A
prospective biomarker associated with immune infiltration. Front
Genet. 13:9451512022. View Article : Google Scholar : PubMed/NCBI
|
|
26
|
Zhao Y, Liu Y, Lin L, Huang Q, He W, Zhang
S, Dong S, Wen Z, Rao J, Liao W and Shi M: The lncRNA MACC1-AS1
promotes gastric cancer cell metabolic plasticity via AMPK/Lin28
mediated mRNA stability of MACC1. Mol Cancer. 17:692018. View Article : Google Scholar : PubMed/NCBI
|
|
27
|
Osumi H, Horiguchi H, Kadomatsu T, Tashiro
K, Morinaga J, Takahashi T, Ikeda K, Ito T, Suzuki M, Endo M and
Oike Y: Tumor cell-derived angiopoietin-like protein 2 establishes
a preference for glycolytic metabolism in lung cancer cells. Cancer
Sci. 111:1241–1253. 2020. View Article : Google Scholar : PubMed/NCBI
|
|
28
|
Luo F, Liu X, Yan N, Li S, Cao G, Cheng Q,
Xia Q and Wang H: Hypoxia-inducible transcription factor-1alpha
promotes hypoxia-induced A549 apoptosis via a mechanism that
involves the glycolysis pathway. BMC Cancer. 6:262006. View Article : Google Scholar : PubMed/NCBI
|
|
29
|
Kim SL, Lee ST, Min IS, Park YR, Lee JH,
Kim DG and Kim SW: Lipocalin 2 negatively regulates cell
proliferation and epithelial to mesenchymal transition through
changing metabolic gene expression in colorectal cancer. Cancer
Sci. 108:2176–2186. 2017. View Article : Google Scholar : PubMed/NCBI
|
|
30
|
Krawczyk M, Pastuch-Gawolek G, Pluta A,
Erfurt K, Dominski A and Kurcok P: 8-hydroxyquinoline
glycoconjugates: Modifications in the linker structure and their
effect on the cytotoxicity of the obtained compounds. Molecules.
24:41812019. View Article : Google Scholar : PubMed/NCBI
|
|
31
|
Wang N, Chen S, Zhang B, Li S, Jin F, Gao
D, Liu H and Jiang Y: 8u, a pro-apoptosis/cell cycle arrest
compound, suppresses invasion and metastasis through HSP90α
downregulating and PI3K/Akt inactivation in hepatocellular
carcinoma cells. Sci Rep. 8:3092018. View Article : Google Scholar : PubMed/NCBI
|
|
32
|
Zuo D, Li C, Liu T, Yue M, Zhang J and
Ning G: Construction and validation of a metabolic risk model
predicting prognosis of colon cancer. Sci Rep. 11:68372021.
View Article : Google Scholar : PubMed/NCBI
|
|
33
|
Cohnen J, Kornstädt L, Hahnefeld L,
Ferreiros N, Pierre S, Koehl U, Deller T, Geisslinger G and
Scholich K: Tumors provoke inflammation and perineural microlesions
at adjacent peripheral nerves. Cells. 9:3202020. View Article : Google Scholar : PubMed/NCBI
|
|
34
|
Jiang N, Zhang Z, Chen X, Zhang G, Wang Y,
Pan L, Yan C, Yang G, Zhao L, Han J and Xue T: Plasma lipidomics
profiling reveals biomarkers for papillary thyroid cancer
diagnosis. Front Cell Dev Biol. 9:6822692021. View Article : Google Scholar : PubMed/NCBI
|
|
35
|
Xu Y, Li H, Fan L, Chen Y, Li L, Zhou X,
Li R, Cheng Y, Chen H and Yuan Z: Development of
photosensitizer-loaded lipid droplets for photothermal therapy
based on thiophene analogs. J Adv Res. 28:165–174. 2020. View Article : Google Scholar : PubMed/NCBI
|
|
36
|
Zheng M, Mullikin H, Hester A, Czogalla B,
Heidegger H, Vilsmaier T, Vattai A, Chelariu-Raicu A, Jeschke U,
Trillsch F, et al: Development and validation of a novel 11-gene
prognostic model for serous ovarian carcinomas based on lipid
metabolism expression profile. Int J Mol Sci. 21:91692020.
View Article : Google Scholar : PubMed/NCBI
|
|
37
|
Chen Y, Zhang S, Wang Q and Zhang X:
Tumor-recruited M2 macrophages promote gastric and breast cancer
metastasis via M2 macrophage-secreted CHI3L1 protein. J Hematol
Oncol. 10:362017. View Article : Google Scholar : PubMed/NCBI
|
|
38
|
Messex JK, Byrd CJ and Liou GY: Signaling
of macrophages that contours the tumor microenvironment for
promoting cancer development. Cells. 9:9192020. View Article : Google Scholar : PubMed/NCBI
|
|
39
|
Yuan J, Liang H, Li J, Li M, Tang B, Ma H,
Xie X, Yin X, Zhang L and Ren Z: Peripheral blood neutrophil count
as a prognostic factor for patients with hepatocellular carcinoma
treated with sorafenib. Mol Clin Oncol. 7:837–842. 2017. View Article : Google Scholar : PubMed/NCBI
|
|
40
|
Li X, Li Y, Lu W, Chen M, Ye W and Zhang
D: The tumor vessel targeting strategy: A double-edged sword in
tumor metastasis. Cells. 8:16022019. View Article : Google Scholar : PubMed/NCBI
|
|
41
|
Siracusano G, Tagliamonte M, Buonaguro L
and Lopalco L: Cell surface proteins in hepatocellular carcinoma:
From bench to bedside. Vaccines (Basel). 8:412020. View Article : Google Scholar : PubMed/NCBI
|
|
42
|
Brodsky AS, Khurana J, Guo KS, Wu EY, Yang
D, Siddique AS, Wong IY, Gamsiz Uzun ED and Resnick MB: Somatic
mutations in collagens are associated with a distinct tumor
environment and overall survival in gastric cancer. BMC Cancer.
22:1392022. View Article : Google Scholar : PubMed/NCBI
|
|
43
|
Cao L, Che X, Qiu X, Li Z, Yang B, Wang S,
Hou K, Fan Y, Qu X and Liu Y: M2 macrophage infiltration into tumor
islets leads to poor prognosis in non-small-cell lung cancer.
Cancer Manag Res. 11:6125–6138. 2019. View Article : Google Scholar : PubMed/NCBI
|
|
44
|
Meng J, Chen Y, Lu X, Ge Q, Yang F, Bai S,
Liang C and Du J: Macrophages and monocytes mediated activation of
oxidative phosphorylation implicated the prognosis and clinical
therapeutic strategy of wilms tumour. Comput Struct Biotechnol J.
20:3399–3408. 2022. View Article : Google Scholar : PubMed/NCBI
|
|
45
|
Huang Z, Yang H, Lao J and Deng W: Solute
carrier family 35 member A2 (SLC35A2) is a prognostic biomarker and
correlated with immune infiltration in stomach adenocarcinoma. PLoS
One. 18:e2873032023.
|
|
46
|
Chen L, Diao L, Yang Y, Yi X, Rodriguez
BL, Li Y, Villalobos PA, Cascone T, Liu X, Tan L, et al:
CD38-mediated immunosuppression as a mechanism of tumor cell escape
from PD-1/PD-L1 blockade. Cancer Discov. 8:1156–1175. 2018.
View Article : Google Scholar : PubMed/NCBI
|
|
47
|
Kim Y, Song S, Lee M, Swatloski T, Kang
JH, Ko YH, Park WY, Jeong HS and Park K: Integrative genomic
analysis of salivary duct carcinoma. Sci Rep. 10:149952020.
View Article : Google Scholar : PubMed/NCBI
|
|
48
|
Liu W, Yang LJ, Liu YL, Yuan DS, Zhao ZM,
Wang Q, Yan Y and Pan HF: Dynamic characterization of intestinal
metaplasia in the gastric corpus mucosa of Atp4a-deficient mice.
Biosci Rep. 40:BSR201818812020. View Article : Google Scholar : PubMed/NCBI
|
|
49
|
Yuan LW, Yamashita H and Seto Y: Glucose
metabolism in gastric cancer: The cutting-edge. World J
Gastroenterol. 22:2046–2059. 2016. View Article : Google Scholar : PubMed/NCBI
|
|
50
|
Wang J, Fang Y and Liu T: TRIM32 promotes
the growth of gastric cancer cells through enhancing AKT activity
and glucose transportation. Biomed Res Int.
2020:40276272020.PubMed/NCBI
|
|
51
|
Kim WS, Kim YY, Jang SJ, Kimm K and Jung
MH: Glucose transporter 1 (GLUT1) expression is associated with
intestinal type of gastric carcinoma. J Korean Med Sci. 15:420–424.
2000. View Article : Google Scholar : PubMed/NCBI
|
|
52
|
Berthe A, Flament S, Grandemange S,
Zaffino M, Boisbrun M and Mazerbourg S: Δ2-Troglitazone promotes
cytostatic rather than pro-apoptotic effects in breast cancer cells
cultured in high serum conditions. Cell Cycle. 15:3402–3412. 2016.
View Article : Google Scholar : PubMed/NCBI
|
|
53
|
Go S, Kramer TT, Verhoeven AJ, Oude ER and
Chang JC: The extracellular lactate-to-pyruvate ratio modulates the
sensitivity to oxidative stress-induced apoptosis via the cytosolic
NADH/NAD+ redox state. Apoptosis. 26:38–51. 2021.
View Article : Google Scholar : PubMed/NCBI
|
|
54
|
Ferrer CM, Lynch TP, Sodi VL, Falcone JN,
Schwab LP, Peacock DL, Vocadlo DJ, Seagroves TN and Reginato MJ:
O-GlcNAcylation regulates cancer metabolism and survival stress
signaling via regulation of the HIF-1 pathway. Mol Cell.
54:820–831. 2014. View Article : Google Scholar : PubMed/NCBI
|
|
55
|
Blum A, Mostow K, Jackett K, Kelty E,
Dakpa T, Ryan C and Hagos E: KLF4 regulates metabolic homeostasis
in response to stress. Cells. 10:8302021. View Article : Google Scholar : PubMed/NCBI
|
|
56
|
Harris JC, Scully MA and Day ES: Cancer
cell membrane-coated nanoparticles for cancer management. Cancers
(Basel). 11:18362019. View Article : Google Scholar : PubMed/NCBI
|
|
57
|
Liu X, Nie L, Zhang Y, Yan Y, Wang C,
Colic M, Olszewski K, Horbath A, Chen X, Lei G, et al: Actin
cytoskeleton vulnerability to disulfide stress mediates
disulfidptosis. Nat Cell Biol. 25:404–414. 2023. View Article : Google Scholar : PubMed/NCBI
|