Introduction
Oxidative stress is a condition that involves the
excessive production of reactive oxygen species (ROS) to higher
levels than antioxidants, and is closely associated with
carcinogenesis and cancer progression (1). Excessive ROS production is toxic for
cell survival; however, cancer cells exhibit metabolic
characteristics enabling them to adjust the antioxidant status and
promote ROS-mediated metastasis (2,3).
Peroxisome proliferator-activated receptors (PPARs) are a type of
nuclear receptor with three members: PPARα, PPARγ and PPARδ. Among
them, PPARγ acts as a pivotal regulator of fatty acid degradation.
PPARγ activation facilitates fatty acid uptake (4,5), and
it has been reported that PPARγ agonists promote the expression of
the fatty acid transport protein and acetyl-co-enzyme A (CoA)
dehydrogenase (ACAD) medium chain (ACADM) in rat liver (6). PPARγ has also been reported to be
downregulated in cells treated with hydrogen peroxide
(H2O2), which indicates an association
between oxidative stress and PPARγ signaling (7). In addition, PPARγ interacts with the
Wnt/β-catenin pathway to modulate oxidative stress and promote
carcinogenesis (8).
Hypoxia is a hallmark of solid tumors. Cancer cells
reprogram their metabolic characteristics to adapt to hypoxic
conditions. Apart from the well-known Warburg effect, fatty acid
metabolism reprograming provides energy and macromolecules required
for the proliferation, division and survival of cancer cells
(9). Fatty acid degradation mainly
occurs via β-oxidation, is processed in mitochondria, and is
involved in mitochondrial ROS and ATP production and acetyl-CoA
recycling (10). β-oxidation is the
main form of fatty acid degradation. ACADs consist of ACAD
short-chain (ACADS), ACADM, ACAD long-chain and ACAD very-long
chain, which degrade short, medium, long and very long-chain fatty
acids, respectively (11).
Overactive fatty acid β-oxidation is reported to produce ROS and
promote metastasis (12).
Inhibition of fatty acid oxidation reduces tumor growth and
metastasis (13,14); however, ACADM activity suppresses
cancer progression (11,15). This conflicting evidence indicates
that the role of fatty acid β-oxidation in cancer cells remains
elusive.
Oxidative stress and hypoxia are promoters of
carcinogenesis, and involve PPARγ. However, the real effect of
PPARγ signaling in hypoxic cancer cells remains unclear. Therefore,
the present study aimed to assess the effect of the modulation of
PPARγ signaling with its agonist, pioglitazone, on hypoxic HepG2
cells.
Materials and methods
Cell culture
HepG2 cells were purchased from the China Center for
Type Culture Collection and were cultured in DMEM (Gibco; Thermo
Fisher Scientific, Inc.) supplemented with 10% FBS (Gibco; Thermo
Fisher Scientific, Inc.), 100 U/ml penicillin and 10 µg/ml
streptomycin in an incubator containing 5% CO2 at 37°C.
The potential presence of mycoplasma in the cell line was detected
regularly with a PCR kit (cat. no. C0301S, Beyotime Biotech. Inc.,
China) followed by the manufacturer's protocol, and no mycoplasma
was detected.
Drug administration protocols
The concentration and duration of drug
administration depend on the sensitivity and resistance of the
cells used. Therefore, the concentration of cobalt chloride
(CoCl2) and pioglitazone (Sigma-Aldrich) used in the
experiments ranged from 100 to 300 µM and from 10 to 100 µM,
respectively (16–21). Based on the literature (16–21), a
concentration gradient of CoCl2 and pioglitazone was
tested by Cell Counting Kit-8 (CCK-8) assay in vitro (data
not shown). Cells were then treated with CoCl2 (200 µM)
and pioglitazone (40 µM) for 24, 48 or 72 h.
CCK-8 assay
HepG2 cells were seeded into a 96-well plate and
cultured overnight. Before treatment, cells were replenished with
medium and treated with different concentrations of
CoCl2 ranging from 100 to 300 µM. When the treatment
ended at 24 h or 48 h, 10 µl CCK-8 reagent (Vazyme Biotech Co.,
Ltd.) was added to each well, and the plate was incubated at 37°C
for 1 h. Subsequently, the absorbance at 450 nm was measured using
a microplate reader (SpectraMax i3×; Molecular Devices, LLC). The
optical density of each well was normalized to the control group
and calculated.
Reverse transcription
(RT)-quantitative (q)PCR
Gene expression levels were quantified by RT-qPCR.
Total RNA was isolated from cells using TRI Reagent®
(Sigma-Aldrich; Merck KGaA) according to the manufacturer's
protocol. The concentration of RNA was determined using NanoDrop™
2000 (Thermo Fisher Scientific, Inc.). cDNA was synthesized from
0.5–2.5 µg RNA by using the HiScript® II 1st Strand cDNA
Synthesis Kit (Vazyme Biotech Co., Ltd.) at 42°C for 5 min, 37°C
for 15 min and 85°C for 5 sec, performed on a T100 thermocycler
(Bio-Rad Laboratories, Inc.). Gene expression was determined by
qPCR using specific primers and SYBR Green (Vazyme Biotech Co.,
Ltd.) in a QuantStudio™ 3 system (Thermo Fisher Scientific, Inc.)
with the following thermocycling conditions: Denaturing at 95°C for
10 min, followed by 40 cycles of denaturing at 95°C for 15 sec and
annealing and extension at 60°C for 1 min. Relative gene expression
was calculated using the 2−ΔΔCq method (22). The primers used for qPCR are listed
in Table I. Gene expression was
measured in duplicate and was normalized using ribosomal protein
S18 as the housekeeping gene.
 | Table I.Primers for reverse
transcription-quantitative PCR. |
Table I.
Primers for reverse
transcription-quantitative PCR.
| Gene | Forward primer,
5′→3′ | Reverse primer
(5′-3′) |
|---|
| RPS18 |
TGCGAGTACTCAACACCAACA |
CTTCGGCCCACACCCTTAAT |
| PPARγ |
AGAGCCTTCCAACTCCCTCA |
TCTCCGGAAGAAACCCTTGC |
| CD36 |
TGTGCAAAATCCACAGGAAGTG |
GGCTAGAAAACGAACTCTGTACG |
| ACADM |
GGGTTCGGGCGATGCTG |
CTGCTGTTCGGTGAACTCAAA |
| ACADS |
TGAATGGAACCAAAGCCTGGA |
AGGCACTGATGCCCTTGTTTT |
| HMOX1 |
ACCTTCCCCAACATTGCCAG |
CAACTCCTCAAAGAGCTGGATG |
| BCL2 |
AGATTGATGGGATCGTTGCCT |
AGTCTACTTCCTCTGTGATGTTGT |
Western blotting
Protein samples were prepared in lysis buffer (25
mmol/l HEPES, 150 mmol/l potassium acetate, 2 mmol/l EDTA pH 8.0,
0.1% NP-40, 10 mmol/l sodium fluoride, 50 mmol/l PMSF, 1 µg/µl
aprotinin, 1 µg/µl pepstatin, 1 µg/µl leupeptin and 1 mmol/l
dithiothreitol). The protein determination method was the BCA
protein assay (Beyotime Institute of Biotechnology), which was
performed according to the manufacturer's protocol using bovine
serum albumin (BSA; Servicebio, Ltd.) to prepare a standard curve.
SDS-PAGE was performed using 10–20 µg protein/lane and 4–15% gels
(Beyotime Institute of Biotechnology), followed by transblotting to
a 0.2 µm nitrocellulose membrane (Amersham; Cytiva). The membranes
were blocked with 5% skimmed milk (in buffer containing 10 mM Tris
pH 8.0, 150 mM NaCl and 0.05% Tween 20) for 1 h at room
temperature. The membranes were incubated overnight with primary
antibody at 4°C and then incubated with HRP-conjugated secondary
antibody for 1 h at room temperature. Protein band intensities were
determined and detected with BeyoECL Star (Beyotime Institute of
Biotechnology) using the Amersham™ Imager 680 system (Amersham;
Cytiva). The primary antibodies included anti-hypoxia-inducible
factor (HIF)-1α (rabbit monoclonal antibody (mAb); cat. no. 36169S;
Cell Signaling Technology, Inc.) and β-actin (rabbit mAb; cat. no.
4970S; Cell Signaling Technology, Inc.), diluted 1:1,000 in 1% BSA.
The secondary antibody was HRP-conjugated goat anti-rabbit
immunoglobulin G (cat. no. 5127S; Cell Signaling Technology, Inc.))
diluted 1:1,000.
Fluorescence microscopy
Live and dead cell staining
Live and dead cell staining was performed using the
Live & Dead Kit (BioScience) following the manufacturer's
instructions. HepG2 cells treated in the presence or without 200 µM
CoCl2 (Co), 40 µM pioglitazone (P) and both (Co + P) for 72 h, or
HepG2 cells treated with or without 200 µM CoCl2 (Co), 40 µM
pioglitazone (P) and both (Co + P) for 48 h. At the end of the
treatment, cells were replenished with serum-free DMEM containing 2
µM calcein-acetoxymethyl ester (calcein-AM) and 4.5 µM propidium
iodide (PI), and then incubated for another 30 min at 37°C. The
plate was observed under a fluorescence microscope (Leica DFC450;
Leica Microsystems, Inc.). The integrated density of calcein-AM and
PI was analyzed using ImageJ software (National Institutes of
Health) version 1.54.
5-Ethynyl-2′-deoxyuridine (EdU)
staining
EdU staining was performed using the BeyoClick
EdU-488 kit (Beyotime Institute of Biotechnology) following the
manufacturer's instructions. Cells were seeded into coverslips, and
then cultured and treated as aforementioned. A total of 10 µM EdU
solution was added to the culture medium 6 h before the end of
treatment. After incorporation of EdU, coverslips were washed with
PBS and fixed with 4% paraformaldehyde for 30 min at room
temperature. Coverslips were then washed again with PBS and
incubated with 0.3% Triton (Beyotime Institute of Biotechnology)
for 10 min at room temperature. After washing with PBS, coverslips
were incubated with BeyoClick-reactive solution containing labeled
azide for 30 min at room temperature. Coverslips were washed with
PBS, sealed with mounting medium containing DAPI and then observed
under a fluorescence microscope (Olympus ix73; Olympus
Corporation). Cell count was carried out with ImageJ software
(National Institutes of Health) version 1.54 using manual and
automatic methods.
ROS staining
ROS staining was performed using a DHE
(Dihydroethidium) assay (Abcam.) following the manufacturer's
instructions. Cells were cultured and treated as aforementioned. At
the end of treatment, cells were replenished with serum-free DMEM
containing 5 µM DHE. Cells were cultured for another 30 min at 37°C
and then observed under a fluorescence microscope (Leica DFC450;
Leica Microsystems, Inc.). Integrated fluorescence density was
analyzed using ImageJ.
Statistical analysis
Data are presented as the mean ± standard deviation
from ≥3 independent experiments. Data analysis was performed using
GraphPad Prism (version 7; GraphPad; Dotmatics). Multiple group
comparisons were first performed with analysis of variance (one-way
ANOVA), followed by Bonferroni post hoc test if the results of
ANOVA achieved statistical significance. P<0.05 was considered
to indicate a statistically significant difference.
Results
PPARγ-associated fatty acid metabolism
genes are downregulated in hypoxic HepG2 cells
CoCl2 has been widely used to induce the
hypoxia of cultured cells in vitro (23). In the present study,
CoCl2 was used to imitate the hypoxic conditions in
which HepG2 cells could survive. The maximum dose (400 µM)of
CoCl2 that maintained >80% cell viability was
determined using a CCK-8 assay (Fig.
1A). The expression of the HIF-1α protein was notably increased
in a dose-dependent manner in CoCl2-treated HepG2 cells,
which demonstrated that HepG2 cells were under hypoxic conditions
(Fig. 1B). The expression of the
antioxidant gene heme oxygenase 1 (HMOX1) was significantly
increased ~10-fold higher in hypoxic HepG2 cells treated with 400
µM CoCl2 than control HepG2 cells (Fig. 1C). By contrast, the mRNA expression
of PPARγ was significantly downregulated about 50% in HepG2 cells
treated with 400 µM CoCl2 (Fig. 1C). PPARG is the gene encoding PPARγ
(24). In-line with the
downregulation of PPARγ, several key regulator genes associated
with fatty acid metabolism, including CD36, ACADM and ACADS
(11), were significantly
downregulated in HepG2 cells treated with 400 µM CoCl2
than control HepG2 cells (Fig. 1C).
These results indicated that downregulation of PPARγ was
accompanied by an increased severity of hypoxia in HepG2 cells.
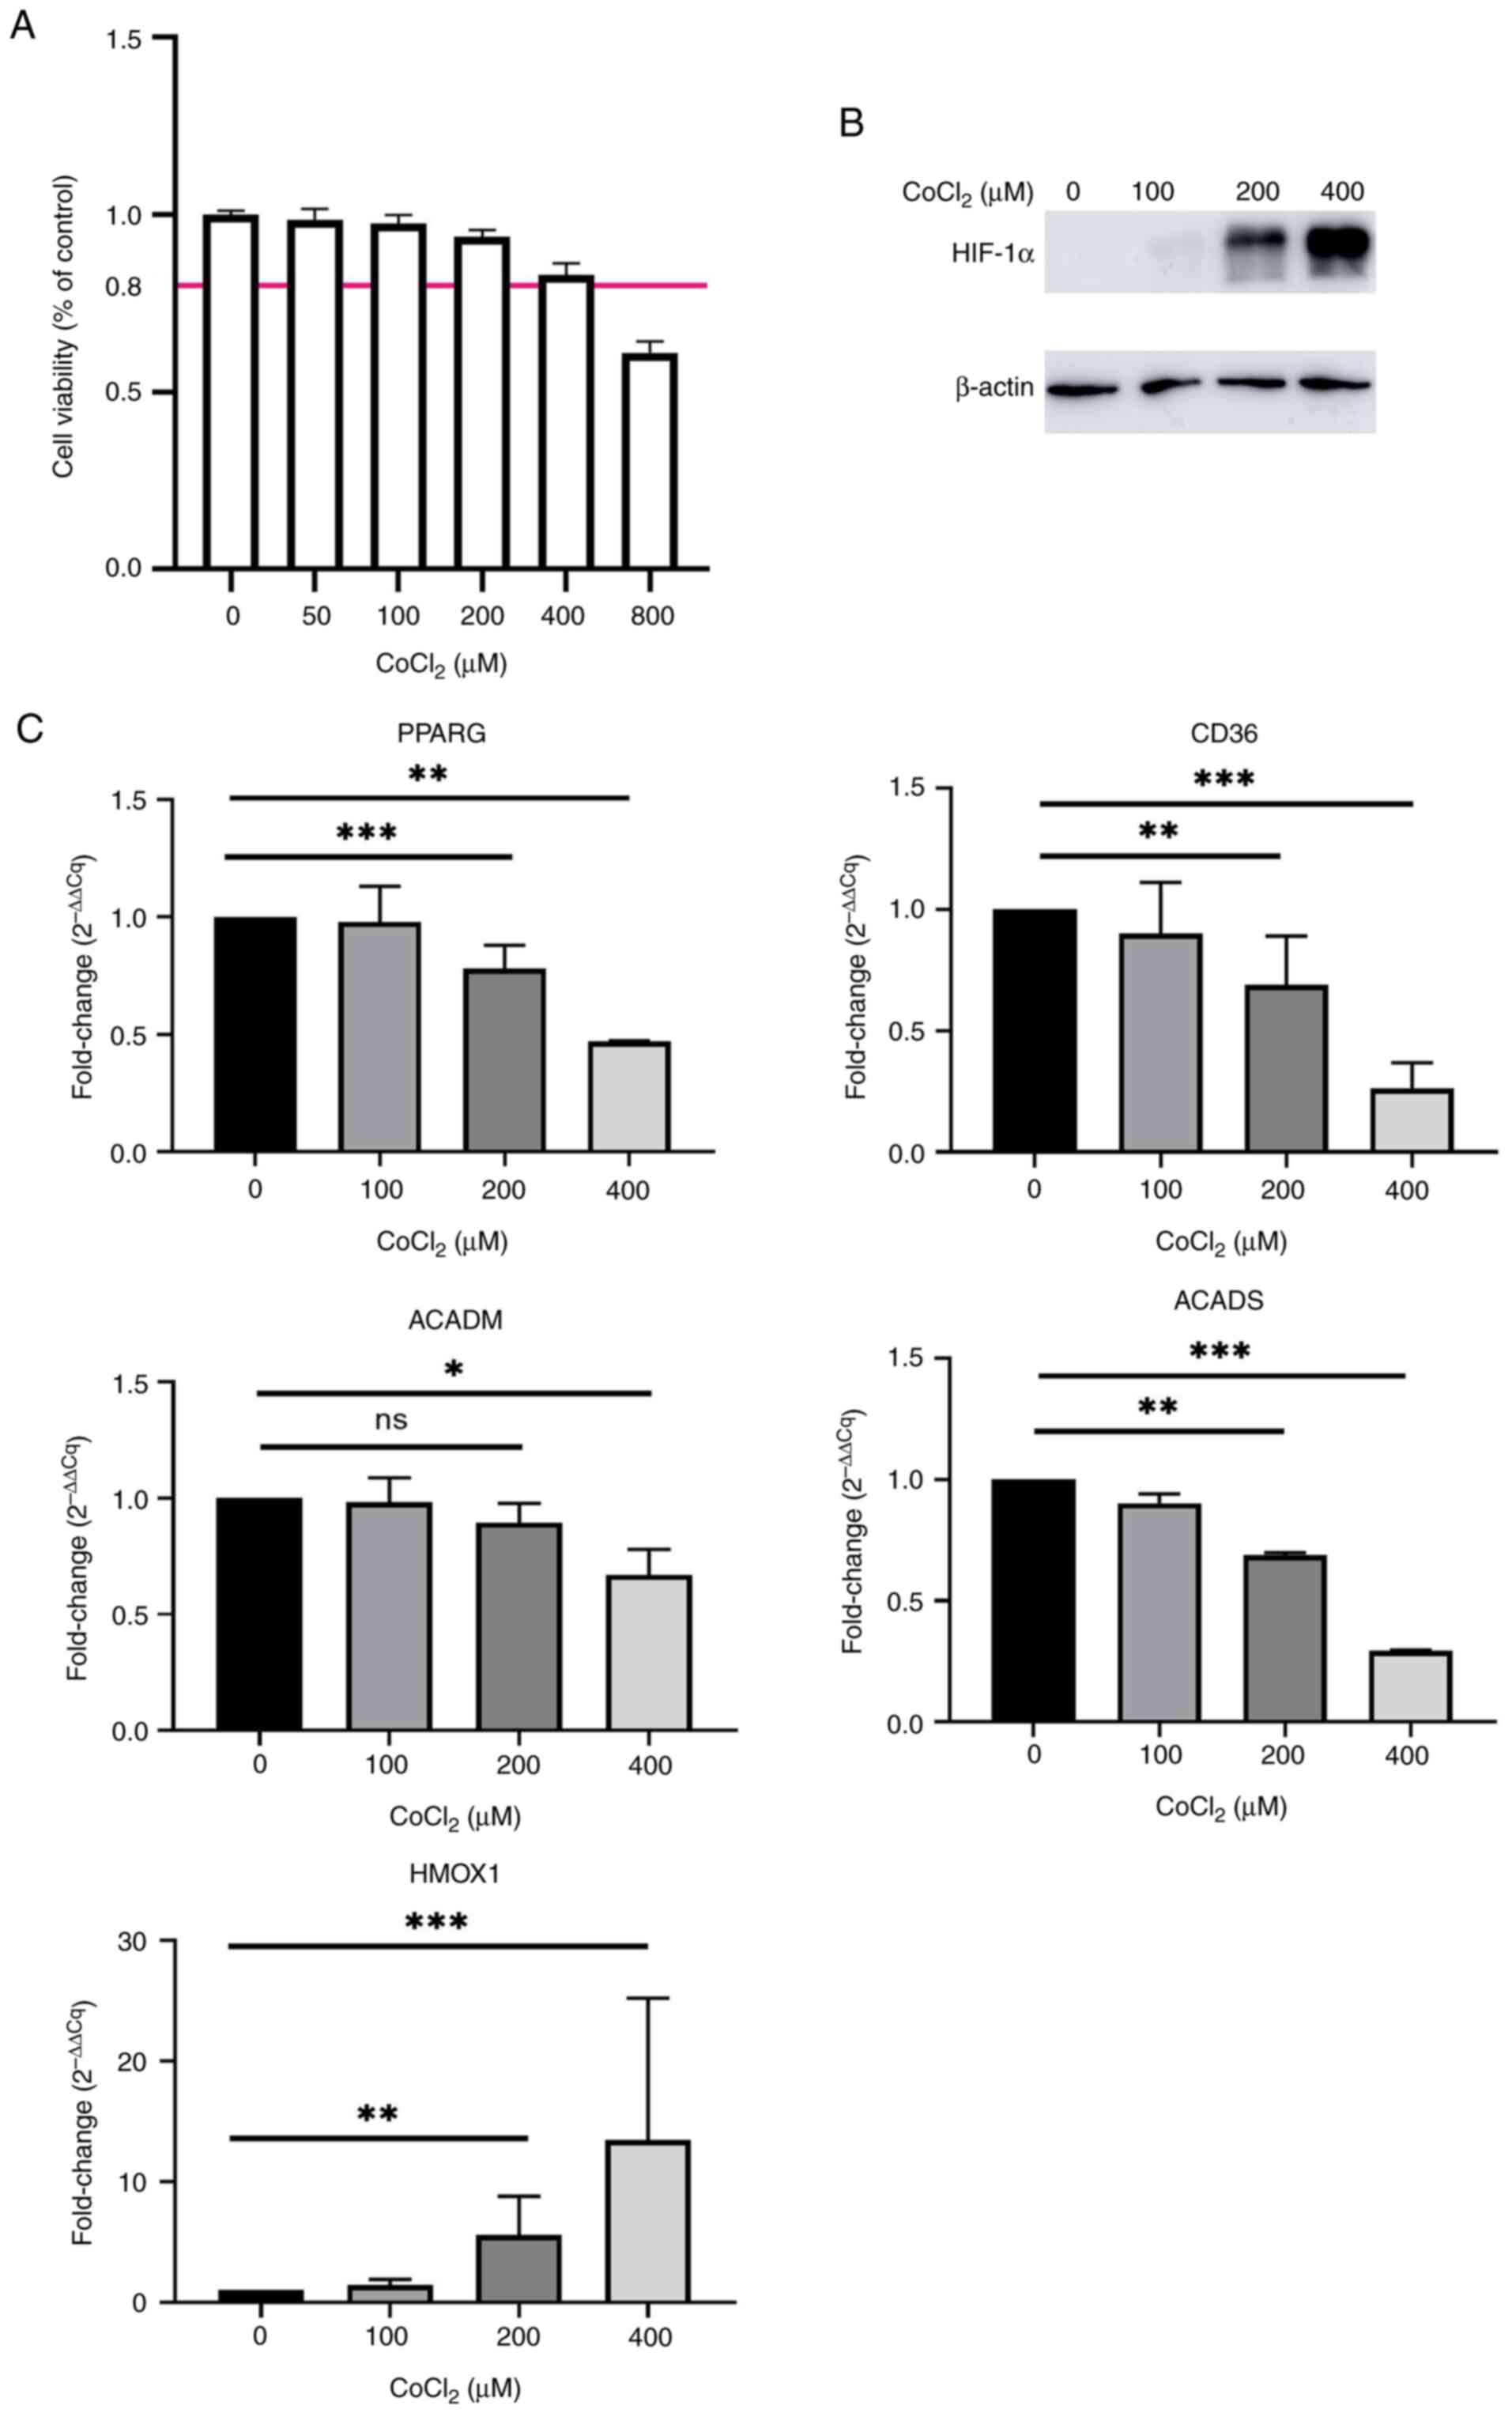 | Figure 1.mRNA expression of PPARγ is
downregulated in CoCl2-treated HepG2 cells. (A)
Viability of HepG2 cells treated with a gradient dose of
CoCl2 for 24 h. (B) Protein expression of HIF-1α in
HepG2 cells treated with different doses of CoCl2 for 24
h. β-actin was used as a loading control. (C) mRNA expression of
PPARγ, CD36, ACADM, ACADS and HMOX1 in HepG2 cells treated with
different doses of CoCl2 for 24 h (n=3-4). *P<0.05;
**P<0.01; ***P<0.001. PPARγ, peroxisome
proliferator-activated receptor γ; HIF-1α, hypoxia-inducible
factor-1α; ACAD, acetyl-co-enzyme A dehydrogenase; ACADM, ACAD
medium-chain; ACADS, ACAD short-chain; HMOX1, heme oxygenase 1; ns,
not significant; CoCl2, cobalt chloride; Cq,
quantification cycle. |
PPARγ agonist pioglitazone decreases
cell proliferation and induces cell death in hypoxic HepG2
cells
To determine whether the activation of PPARγ
promoted the death of hypoxic HepG2 cells, pioglitazone, an
established PPARγ agonist (25),
was added to activate PPARγ signaling in hypoxic HepG2 cells.
Pioglitazone (20–60 µM) in combination with 200 µM CoCl2
significantly reduced the viability of HepG2 cells treated with 200
µM CoCl2 alone (Fig.
2A). Following treatment with pioglitazone, the proliferation
of hypoxic HepG2 cells was further inhibited, and markedly few
EdU+ cells were observed following treatment with a
combination of CoCl2 and pioglitazone compared with
cells treated with CoCl2 alone (Fig. 2B). The EdU+ cell ratio of
hypoxic HepG2 cells was calculated, and the results revealed that
pioglitazone significantly inhibited the proliferation of hypoxic
HepG2 cells treated with CoCl2 (Fig. 2C). In the combination group of
hypoxia and pioglitazone, the number of calcein-AM+
cells and their fluorescence intensity were notably reduced
compared with those in HepG2 cells treated with hypoxia only
(Fig. 2D). The integrated density
of calcein-AM and PI was calculated in repeated staining
experiments. The cell confluence was low in the CO+P. PI staining
cannot stain the detached dead cells. With optimization of
treatment time, the CO + P showed the most dead cells, and the
results suggested that pioglitazone in combination with
CoCl2 promoted the death of HepG2 cells treated with
CoCl2 alone (Fig. 2E).
These results demonstrated that the activation of PPARγ abolished
the survival and proliferation abilities of hypoxic HepG2
cells.
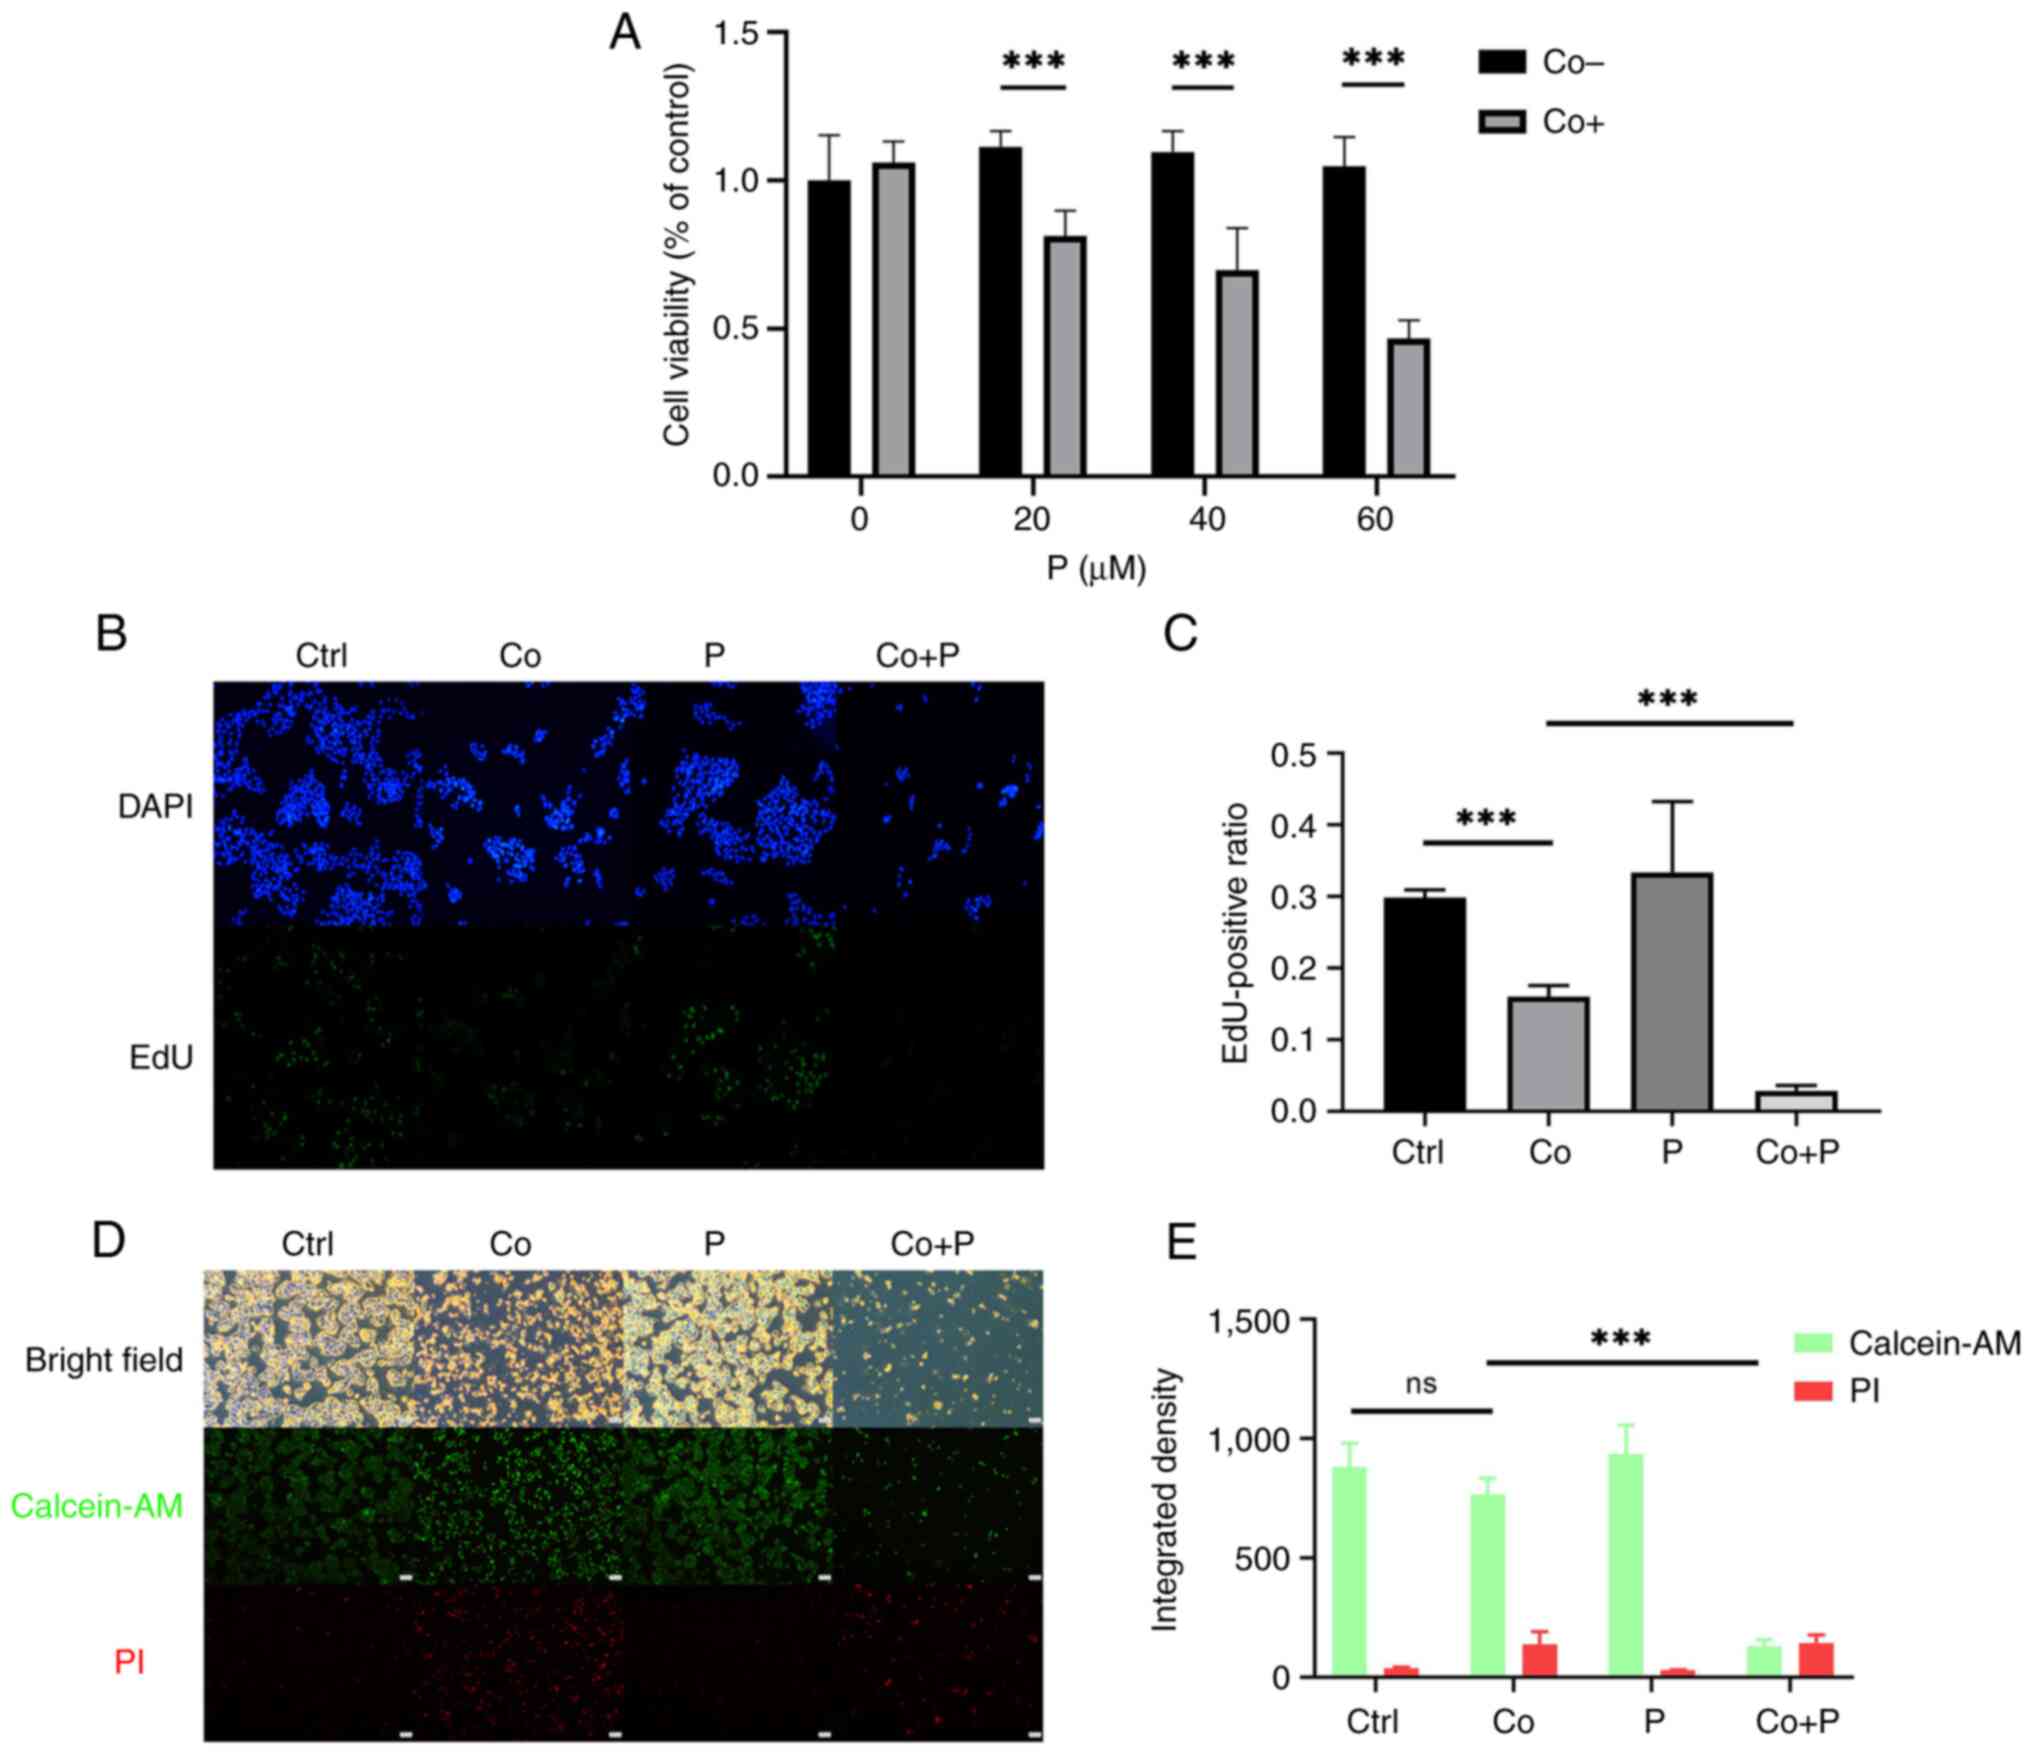 | Figure 2.A PPARγ agonist inhibits the
proliferation and promotes the death of hypoxic HepG2 cells. (A)
HepG2 cells were treated with 20, 40 and 60 µM P with or without
200 µM Co for 48 h. P was added 24 h before Co. Cell viability was
measured using a Cell Counting Kit-8 assay. (B) EdU staining of
HepG2 cells treated with or without 200 µM Co, 40 µM P, and both Co
+ P for 48 h (magnification, ×40). P was added 24 h before Co. (C)
EdU+ cells were counted using ImageJ software version
1.54, and the positive ratio was compared between different groups.
(D) Calcein-AM and PI double staining of HepG2 cells treated with
or without 200 µM Co, 40 µM P and both Co + P for 72 h (scale bar,
500 µm). P was added 24 h before Co. (E) Integrated density of
calcein-AM and PI was calculated using ImageJ (n=3-4).
***P<0.001. PPARγ, peroxisome proliferator-activated receptor γ;
P, pioglitazone; Co, cobalt chloride; EdU,
5-ethynyl-2′-deoxyuridine; Ctrl, control; calcein-AM,
calcein-acetoxymethyl ester; PI, propidium iodide; ns, not
significant; BF, bright field. |
PPARγ agonist pioglitazone induces the
death of hypoxic HepG2 cells via aggravation of oxidative
stress
In the present study, pioglitazone was demonstrated
to induce the death of hypoxic HepG2 cells treated with
CoCl2. Given the PPARγ agonist pioglitazone increased
intracellular ROS production and then exacerbated the oxidative
stress of hypoxic HepG2 cells, it was hypothesized that
supplementation of an antioxidant could rescue hypoxic HepG2 cells.
To assess this hypothesis, N-acetyl-L cysteine (NAC) was added to
scavenge intracellular ROS in hypoxic HepG2 cells treated with
pioglitazone. Following addition of NAC, the number of calcein-AM
positive cells was markedly increased, whilst the number of PI
positive cells was notably decreased compared to cells treated with
Co + P (Fig. 3A). Furthermore,
following NAC treatment, the integrated fluorescence intensity of
PI of cells was significantly diminished compared with cells
treated with Co + P (Fig. 3C). DHE
staining was then performed to directly assess intracellular ROS
production in HepG2 cells. The staining results demonstrated that
increased red fluorescence in the Co + P group vs. Co group,
indicated the PPARγ agonist notably increased intracellular ROS in
hypoxic HepG2 cells, which could be scavenged by NAC (Fig. 3B). The comparison of quantified
integrated fluorescence density revealed that the PPARγ agonist
significantly increased integrated fluorescence in the Co + P group
vs. Co group, whilst NAC significantly reduced integrated
fluorescence in the Co + P + Nac group vs. Co + P group (Fig. 3D). The results demonstrated that the
PPARγ agonist pioglitazone induced cell death through the
production of excessive ROS and the induction of oxidative stress
in hypoxic HepG2 cells.
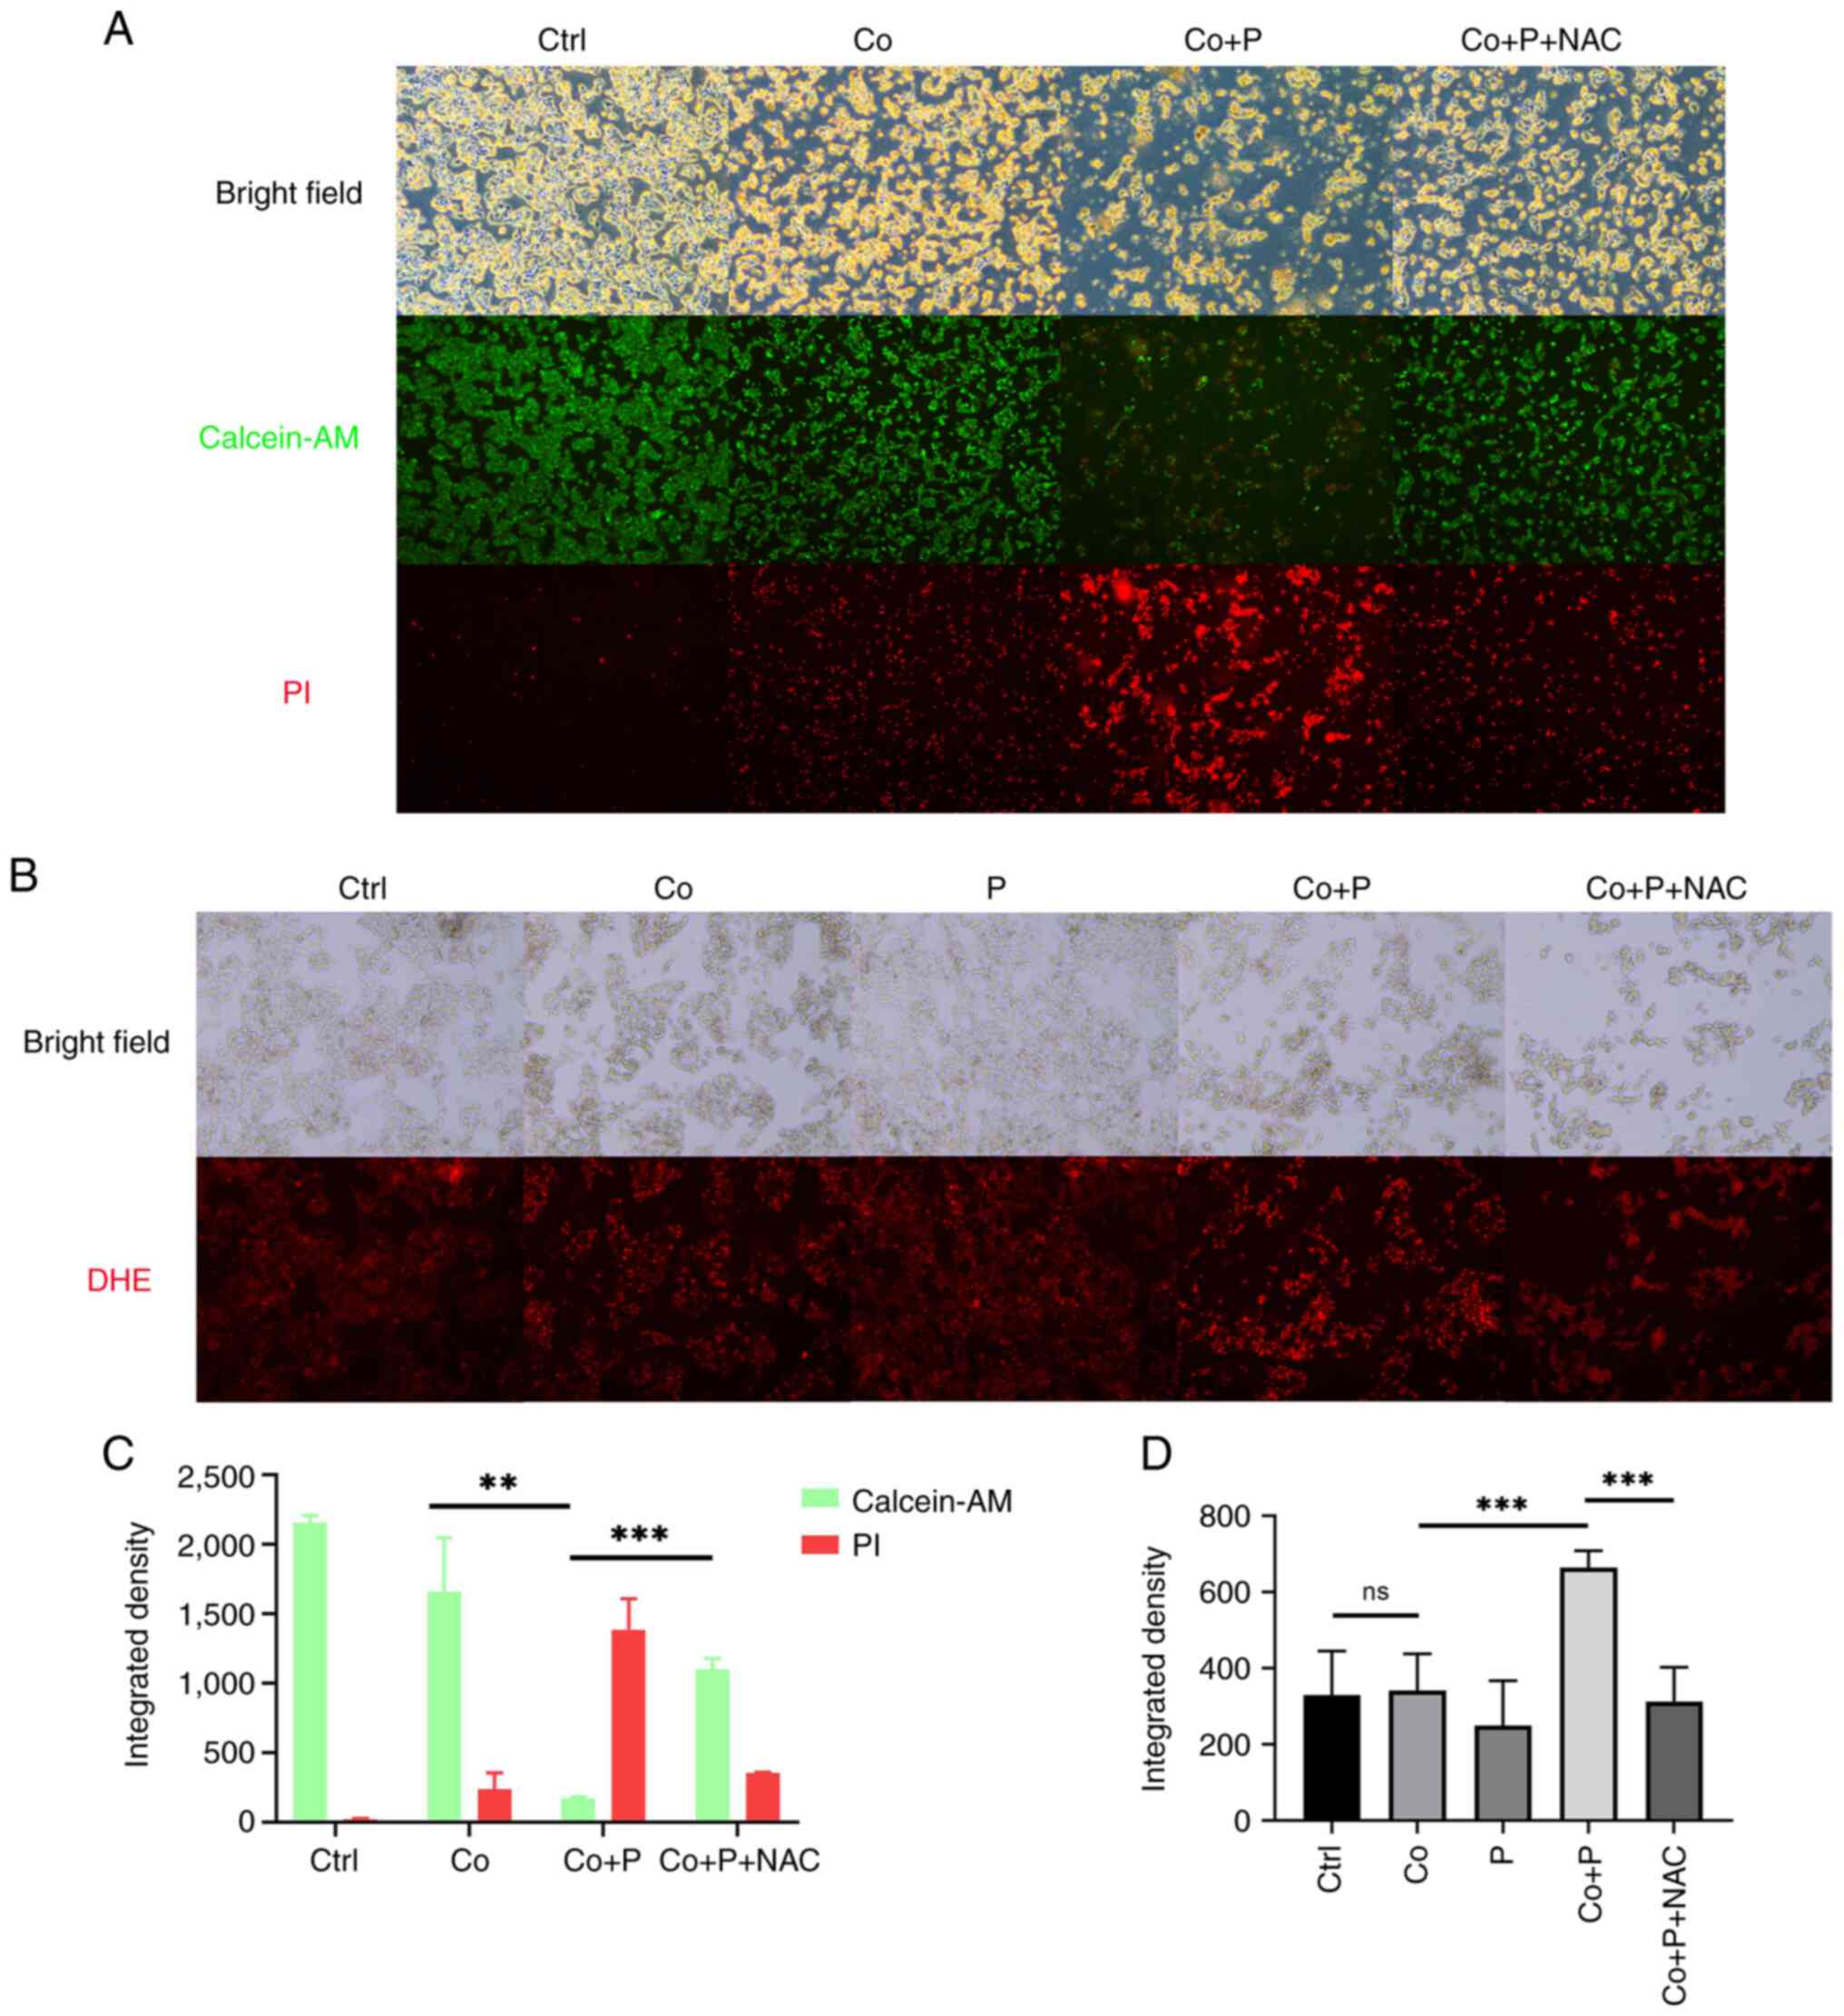 | Figure 3.A PPARγ agonist increases the levels
of intracellular reactive oxygen species to induce cell death. (A)
Calcein-AM and PI double staining of HepG2 cells treated with or
without 200 µM Co, 40 µM P and both Co + P for 48 h (magnification,
×50). (B) DHE staining of HepG2 cells treated with or without 200
µM Co, 40 µM P and both Co + P for 48 h (magnification, ×50).
Integrated density of fluorescence was measured and calculated in
samples of panels (C) A and (D) B. (n=3-4). **P<0.01;
***P<0.001. PPARγ, peroxisome proliferator-activated receptor γ;
calcein-AM, calcein-acetoxymethyl ester; PI, propidium iodide; P,
pioglitazone; Co, cobalt chloride; NAC, N-acetyl-L cysteine; DHE,
dihydroethidium; Ctrl, control; ns, not significant; BF, bright
field. |
PPARγ agonist-mediated induction of
ROS production may not occur through fatty acid oxidation but
through impairment of B-cell lymphoma-2 (BCL2) expression
Fatty acid oxidation has been reported to be a
source of ROS in cancer cells (17). Therefore, whether PPARγ increased
intracellular ROS production in hypoxic HepG2 cells was assessed by
enhancing fatty acid oxidation. The mRNA expression of PPARG, CD36,
ACADM and ACADS was measured. The expression of genes including
PPARG, CD36, ACADM and ACADS significantly reduced about 50% in
HepG2 cells treated with CoCl2. However, the
downregulated expression of these genes was not reverted by the
PPARγ agonist (Fig. 4A-D). In
addition, the expression of the antioxidant gene HMOX1 was also
measured to evaluate the antioxidant reactivity of hypoxic HepG2
cells treated with the PPARγ agonist. However, the results revealed
that the PPARγ agonist did not significantly stimulate the
expression of HMOX1 in Co + P group compare to Co group (Fig. 4E).
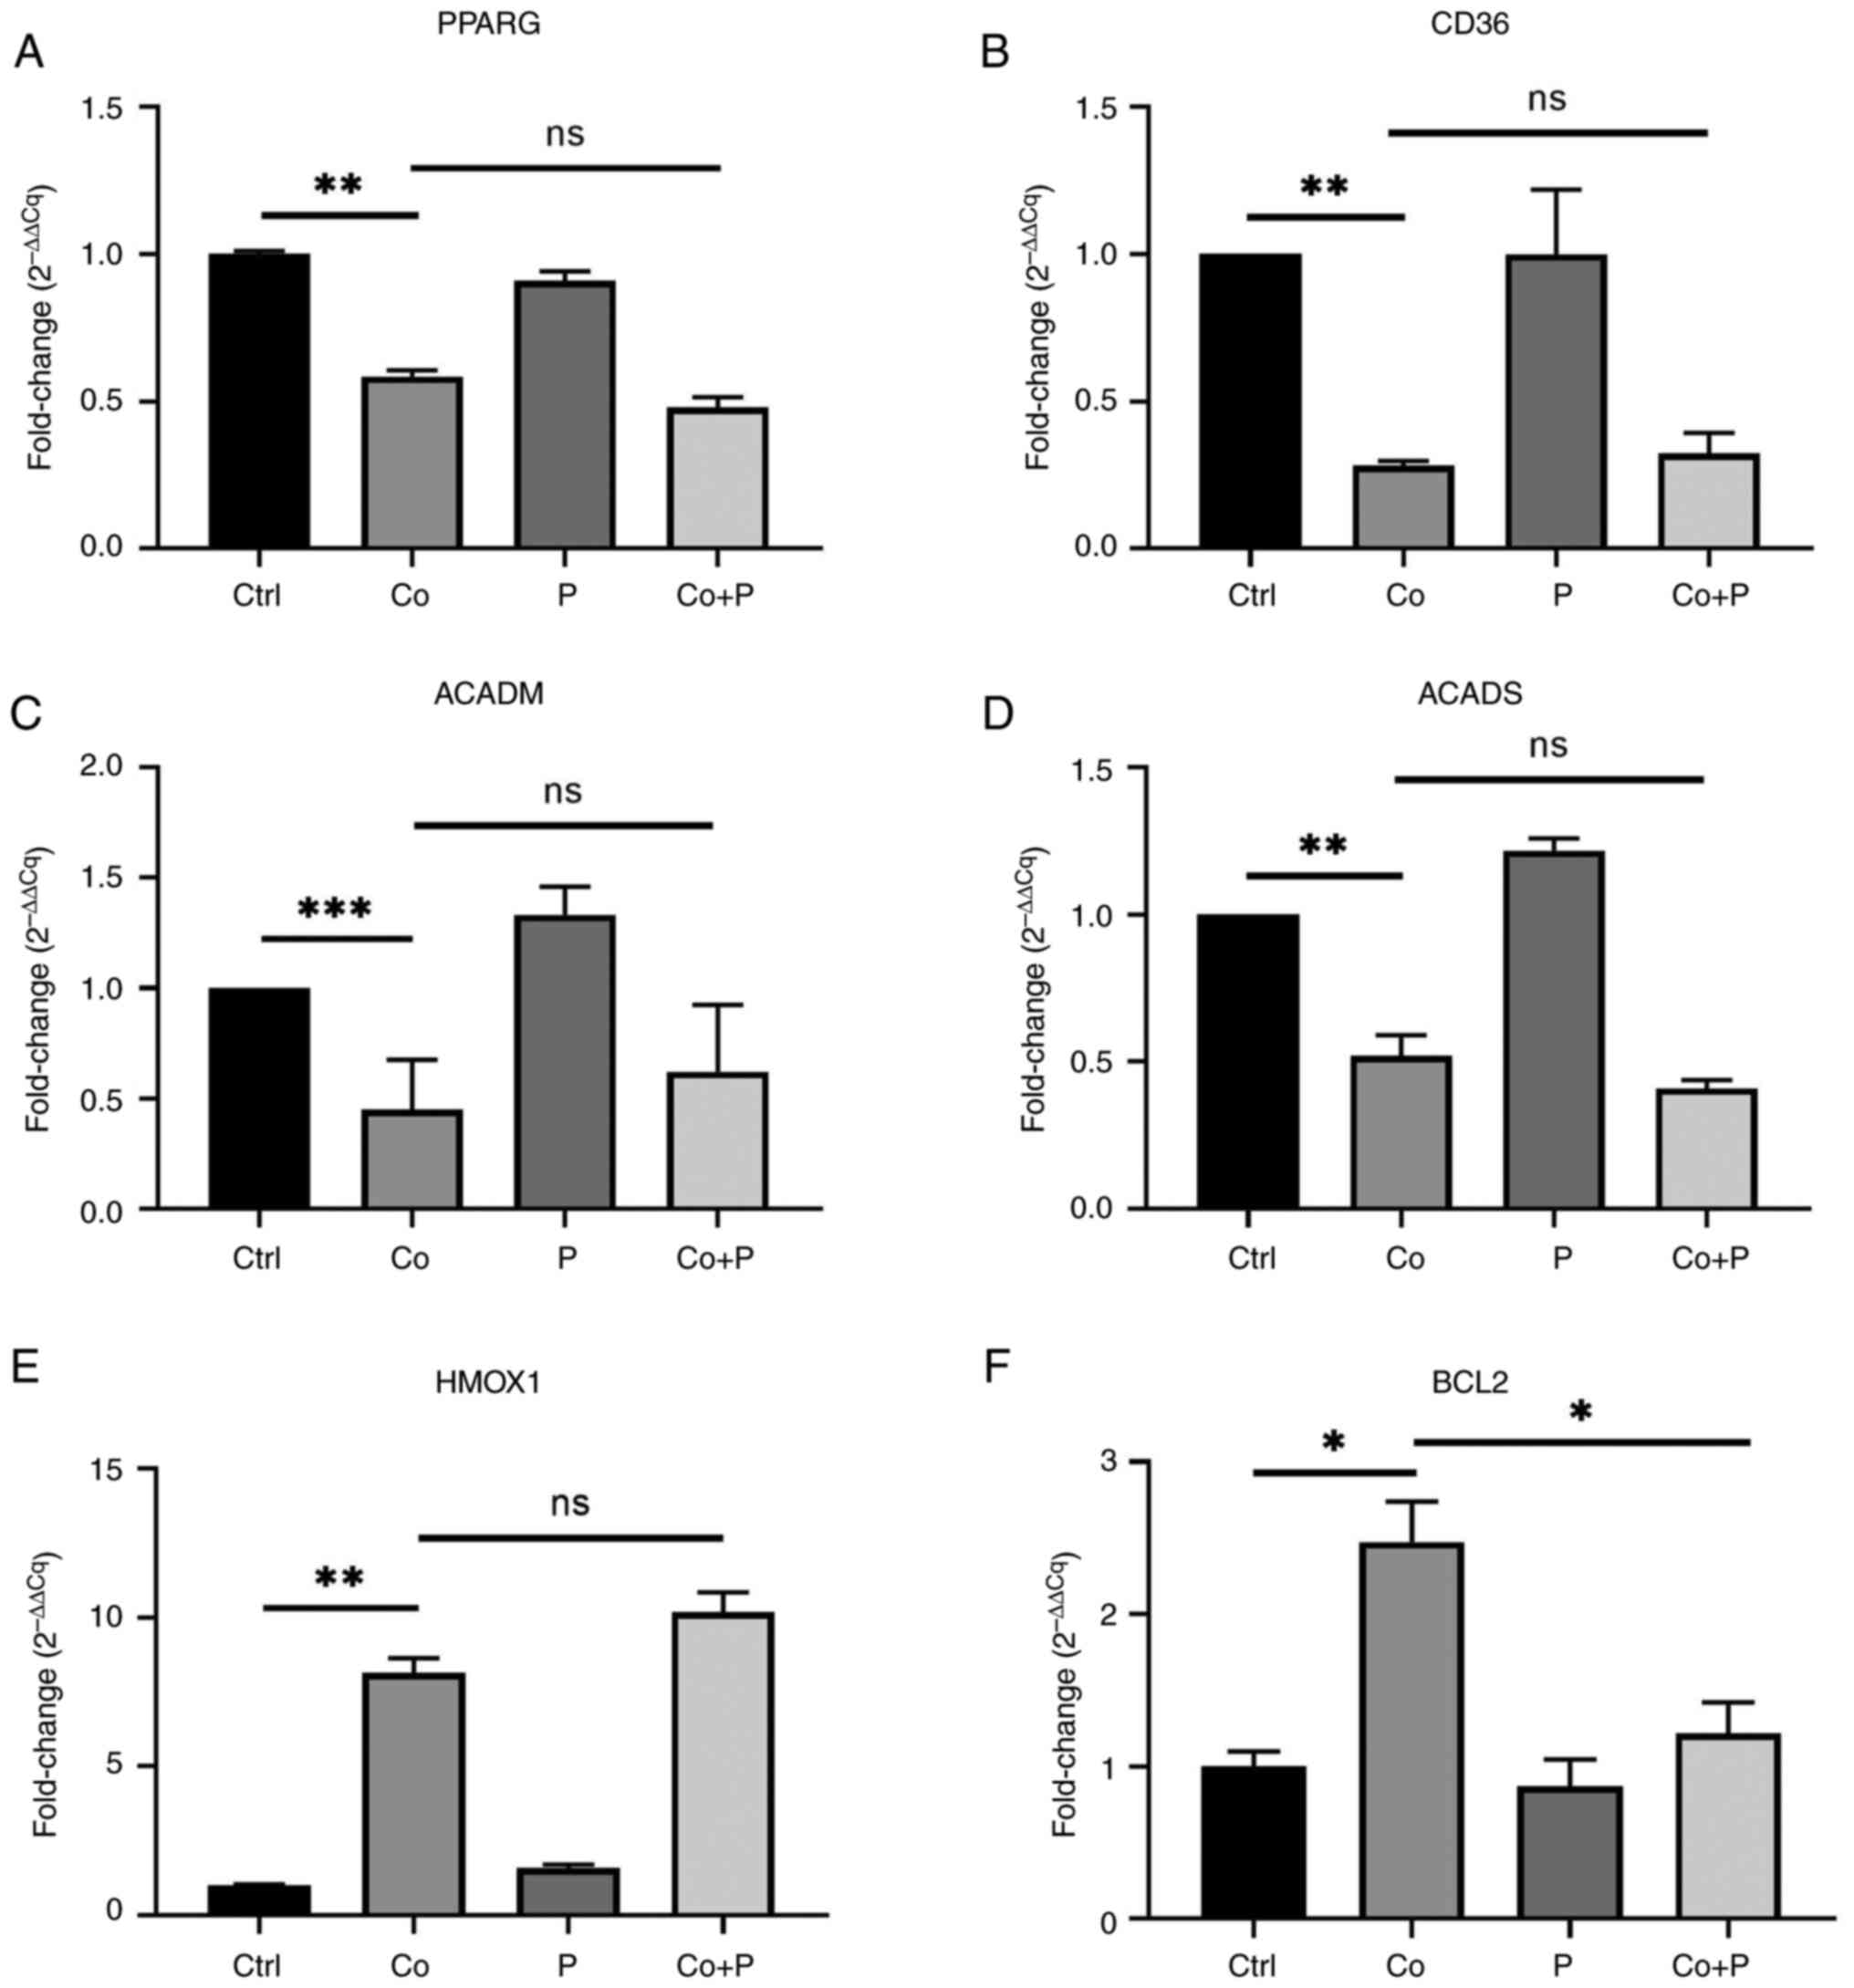 | Figure 4.A PPARγ agonist downregulates
anti-apoptotic gene expression but does not revert downregulated
expression of fatty acid metabolism-related genes. HepG2 cells were
treated with or without 200 µM Co, 40 µM P or both Co + P for 48 h.
The mRNA expression of (A) PPARγ, (B) CD36, (C) ACADM, (D) ACADS,
(E) HMOX1 and (F) BCL2 was measured and analyzed (n=3-4).
*P<0.05; **P<0.01; ***P<0.001. PPARγ, peroxisome
proliferator-activated receptor γ; Co, cobalt chloride; P,
pioglitazone; ACAD, acetyl-co-enzyme A dehydrogenase; ACADM, ACAD
medium-chain; ACADS, ACAD short-chain; HMOX1, heme oxygenase 1;
BCL2, B-cell lymphoma-2; Ctrl, control; ns, not significant; Cq,
quantification cycle. |
BCL2 has been reported to be a key regulator of
mitochondrial ROS production, and is able to confer anti-apoptotic
effects to cancer cells with oxidative stress (18). Therefore, whether the aforementioned
PPARγ agonist regulated intracellular ROS production by modulating
BCL2 expression was assessed. The mRNA expression of BCL2 was
measured, and the data indicated that hypoxic HepG2 cells had a
significantly higher expression of BCL2 than control cells, and the
PPARγ agonist significantly decreased the expression of BCL2 in Co
+ P group cells compared to Co group cells (Fig. 4F). These results indicated that the
PPARγ agonist pioglitazone increased intracellular ROS production
in hypoxic HepG2 cells, not via upregulation of the expression of
fatty acid degrading genes, but via downregulation of the
expression of the anti-apoptotic gene BCL2.
Discussion
The generation of a hypoxic environment and the
activation of HIF-1 are common features of advanced cancer
(26). The response to hypoxia is
mainly attributed to HIFs. CoCl2-induced chemical
hypoxia is one of the most commonly used models of cell hypoxia
in vitro, and the use of CoCl2 in vitro
has been reported to increase HIF-1α/2α in a dose-and
time-dependent manner (23).
CoCl2 strongly stabilizes HIFs, thereby mimicking
hypoxia and inducing the upregulation of a range of hypoxic
adaptive responses, many of which have potential carcinogenic
effects (27). As alteration of the
cellular adaptation to hypoxia is also fundamental in cancer
treatment (26), it was
hypothesized that it would be meaningful to assess the mechanism
and to identify an approach to abolish the resistance of cells to
CoCl2. Nevertheless, the hypoxic response can also be
detrimental for tumorigenesis. Cobalt is cytotoxic and induces
apoptosis and necrosis at high concentrations (27). Horev-Azaria et al (28) reported that CoCl2
decreased the viability of NCI-H441 cells by 30–40% at 0.4 mM after
48 and 72 h, and of HepG2 cells by 70–100% at 0.4 mM after 48 and
72 h via MTT assay.
The experiments carried out in the present study
revealed that the downregulation of the expression of PPARG and
fatty acid oxidation genes was accompanied by increased expression
of HIF-1α in hypoxic HepG2 cells. The PPARγ agonist pioglitazone
specifically stimulated excessive ROS production in hypoxic HepG2
cells to induce cell death and inhibit cell proliferation. Notably,
the effect of this PPARγ agonist did not depend on fatty acid
oxidation, but on the downregulation of BCL2 expression in hypoxic
HepG2 cells. Thus, the results of the current study reveal a
negative association between PPARγ and BCL2 in regulating ROS
production in hypoxic HepG2 cells.
Under hypoxic conditions, cancer cells dynamically
modulate the intake and degradation of fatty acids to balance ROS
production (11,14,29).
Fatty acid degradation mainly occurs via β-oxidation and is
catalyzed by ACADs. Fatty acid oxidation can be regulated in
numerous tissues by activating the PPAR signaling pathway. PPARs
are nuclear receptors that regulate lipid metabolism by promoting
gene transcription (30,31). It has been reported that PPARγ
serves an important role in tumor cell proliferation and death, as
well as in angiogenesis, invasion and metastasis (32). Once activated by a ligand, PPARγ
binds to DNA-specific PPAR response elements and modulates the
transcription of its target genes, such as CD36, ACADM and ACADS,
which may be important regulatory targets of fatty acid metabolism
in tumor cells. CD36 stimulates tumor development and metastasis by
allowing cells to absorb lipids from the extracellular environment,
and promotes fatty acid synthetase oxidation to produce ATP
(33,34). CD36 is expressed at a high level in
glioblastoma, and the reduction in CD36 leads to a loss of
self-renewal and tumor initiation ability (35). ACADM reflects fatty acid metabolism
and gemcitabine sensitivity in pancreatic cancer, potentially
providing a reliable way to measure the efficacy of chemotherapy
(36). ACADS is a potential
methylation biomarker associated with the proliferation and
metastasis of hepatocellular carcinoma (37). PPARγ is the key regulator of ACADM
transcription, which first catalyzes the reaction of the
β-oxidation cycle for 4–10-carbon fatty acids (6). PPARγ signaling is dysregulated in
cancer cells under hypoxia or oxidative stress (7,38). In
the present study, it was hypothesized that the association between
PPARγ and fatty acid oxidation may be essential for ROS regulation
in hypoxic cancer cells. PPARγ and its downstream genes, including
CD36, ACADM and ACADS, were all downregulated in hypoxic HepG2
cells. HMOX1 is a key enzymes to antagonize harmful ROS of
cytoplasm (39). The marked
increase in HMOX1 gene expression in hypoxic HepG2 cells observed
in the current study suggests a cellular adjustment of the redox
status to regulate ROS production.
Pioglitazone is an established PPARγ agonist, and is
approved for the clinical treatment of diabetes. Despite its effect
on glucose metabolism, pioglitazone has been reported to enhance
fatty acid β-oxidation (25). Given
that impaired PPARγ activity confers cancer cells tolerance to
hypoxia, activation of PPARγ signaling should disrupt the
intracellular metabolic balance of hypoxic HepG2 cells. The results
of the present study revealed that pioglitazone decreased the
viability of hypoxic HepG2 cells by inhibiting cell proliferation
and inducing cell death. However, the effect of PPARγ in hypoxia is
controversial. It has been reported that the PPAR agonist
pioglitazone protects against hypoxia-induced fetal growth
inhibition (40). Similarly,
another PPARγ agonist has been reported to have a protective effect
against hypoxia in cardiac myocytes (41). However, inhibition of PPARγ and
HIF-1α potentiated the sensitivity of HepG2 cells to a tyrosine
kinase inhibitor (42). It could be
assumed that the conflicting PPARγ effect in hypoxia may be due to
differences in metabolic characteristics between cancer and benign
cells. In the present study, it was demonstrated that the PPARγ
agonist pioglitazone abolished the hypoxia tolerance of HepG2
cells.
Oxidative stress is a status of excessive ROS
compared with antioxidants. Cancer cells have aberrant redox
homeostasis to tolerate high ROS levels, and adjust their
antioxidant status to facilitate ROS-driven proliferation and to
avoid ROS-induced senescence, apoptosis or ferroptosis (1). Glutathione (GSH) is a fast reactive
endogenous antioxidant that scavenges intracellular ROS (43). Cysteine is the necessary source of
GSH biosynthesis, and NAC is widely used as the source of GSH
production (44). It can be
hypothesized that the PPARγ agonist pioglitazone induces the death
of hypoxic HepG2 cells by increasing the production of excessive
ROS, and the effect of pioglitazone may be neutralized by
NAC-stimulated GSH production. The results of the present study
demonstrated that the above PPARγ agonist specifically increased
intracellular ROS production in hypoxic HepG2 cells. By contrast,
NAC protected hypoxic HepG2 cells against this PPARγ agonist by
scavenging intracellular ROS and reducing PPARγ agonist-mediated
cell death. An association between the PPARγ agonist pioglitazone
and excessive ROS production was also demonstrated in hypoxic HepG2
cells. Similarly, this PPARγ agonist has been reported to increase
intracellular ROS production in lung cancer cells exposed to
γ-radiation (45). Nevertheless,
pioglitazone has been reported to inhibit the ROS production of
cardiac fibroblasts treated under anoxia-reoxygenation conditions
(46). Therefore, it can be
hypothesized that the diverse effects of this PPARγ agonist result
from the dysregulated redox status of hypoxic cancer cells.
Mitochondria are the main producers of cellular ROS,
including superoxide and/or H2O2, via aerobic
metabolism (47). ROS production is
tightly controlled, and HIFs alter the structure and activity of
the electron transport chain to regulate ROS production under
hypoxia (48). Stimulating fatty
acid oxidation has been reported to disturb the redox balance of
hypoxic cancer cells. Furthermore, increased expression of ACADM
has been reported to decrease cell proliferation and invasion in
solid tumors, whilst impaired ACADM activity promotes cancer
progression (11,15). In the present study, it was
demonstrated that the mRNA expression of fatty acid-degrading
genes, including PPARG, ACADM and ACADS, was downregulated, and the
PPARγ agonist pioglitazone promoted excessive ROS production in
hypoxic HepG2 cells. However, the results of the present study do
not suggest that the PPARγ agonist upregulated fatty acid oxidation
in hypoxic HepG2 cells. PPARγ expression has been reported to be
dysregulated in esophageal cancer, and a PPARγ agonist inhibited
cancer cell proliferation in vitro and cancer progression
in vivo via the Akt-P21CIP1 signaling pathway
(49). Moreover, the PPARγ agonist
lobeglitazone has been reported to inhibit thyroid cancer cell
metastasis by suppressing the MAPK signaling pathway (50). The evidence implies that the effect
of PPARγ agonists is not confined to modulating fatty acid
metabolism. Moreover, the PPARα activator fenofibrate has been
reported to induce apoptosis in human hepatocellular carcinoma
cells by increasing ROS production (51). In view of PPARα-dependent apoptosis,
PPARα can be considered an E3 ubiquitin ligase able of inducing the
ubiquitination and degradation of BCL2, thus leading to apoptosis
(52). BCL2 is a mitochondrial
membrane protein that regulates ROS production and serves as an
anti-apoptotic effector in the endogenous apoptosis pathway
(53). Therefore, downregulation of
BCL2 by PPARγ agonists stimulates excessive ROS production in
hypoxic HepG2 cells. The results of the present study indicate a
negative association between BCL2 expression and PPARγ activity in
hypoxic HepG2 cells. This mechanism appears to be essential for
regulating ROS production in hypoxic HepG2 cells.
In conclusion, PPARγ downregulation appears to be
required for redox homeostasis in hypoxic HepG2 cells. In the
present study, the PPARγ agonist pioglitazone stimulated excessive
ROS production in hypoxic HepG2 cells to induce cell death and
inhibit cell proliferation via downregulation of BCL2 expression.
Notably, differences between lack of oxygen-induced hypoxia and
CoCl2-induced chemical hypoxia may lead to proapoptotic
responses, and the genes induced by the two modes of hypoxia may
not overlap. However, other anti-apoptotic genes potentially
modulated by pioglitazone were not included in the present study,
and therefore further experiments are needed to fully assess the
role of pioglitazone in CoCl2-induced hypoxic HepG2
cells.
Acknowledgements
The authors would like to thank the Translational
Medical Center at The First Affiliated Hospital of Zhengzhou
University for providing access to analytical instruments.
Funding
The present study was supported by the Health Commission of
Henan Province (grant nos. LHGJ20190155 and LHGJ20210287).
Availability of data and materials
The data generated in the present study are included
in the figures and/or tables of this article.
Authors' contributions
GH conceived the study, performed the experiments,
and analyzed and interpreted the data. MZ conceived the study and
analyzed and interpreted the data. MW and WX performed the
experiments. XD and XH interpreted the data and revised the
manuscript. XD and MZ confirm the authenticity of all the raw data.
JR and MZ funded the study, and interpreted the data. All authors
have read and approved the final version of the manuscript.
Ethics approval and consent to
participate
Not applicable.
Patient consent for publication
Not applicable.
Competing interests
The authors declare that they have no competing
interests.
References
|
1
|
Hayes JD, Dinkova-Kostova AT and Tew KD:
Oxidative Stress in Cancer. Cancer Cell. 38:167–197. 2020.
View Article : Google Scholar : PubMed/NCBI
|
|
2
|
Kaminski MM, Sauer SW, Kaminski M, Opp S,
Ruppert T, Grigaravicius P, Grudnik P, Grone HJ, Krammer PH and
Gülow K: T cell activation is driven by an ADP-dependent
glucokinase linking enhanced glycolysis with mitochondrial reactive
oxygen species generation. Cell Rep. 2:1300–1315. 2012. View Article : Google Scholar : PubMed/NCBI
|
|
3
|
Ishikawa K, Takenaga K, Akimoto M,
Koshikawa N, Yamaguchi A, Imanishi H, Nakada K, Honma Y and Hayashi
J: ROS-Generating Mitochondrial DNA mutations can regulate tumor
cell metastasis. Science. 320:661–664. 2008. View Article : Google Scholar : PubMed/NCBI
|
|
4
|
Zong X, Cao X, Wang H, Xiao X, Wang Y and
Lu Z: Cathelicidin-WA Facilitated intestinal fatty acid absorption
through enhancing PPAR-ү dependent barrier function. Front Immunol.
10:16742019. View Article : Google Scholar : PubMed/NCBI
|
|
5
|
Angela M, Endo Y, Asou HK, Yamamoto T,
Tumes DJ, Tokuyama H, Yokote K and Nakayama T: Fatty acid metabolic
reprogramming via mTOR-mediated inductions of PPARү directs early
activation of T cells. Nat Commun. 7:136832016. View Article : Google Scholar : PubMed/NCBI
|
|
6
|
Seo YS, Kim JH, Jo NY, Choi KM, Baik SH,
Park JJ, Kim JS, Byun KS, Bak YT, Lee CH, et al: PPAR agonists
treatment is effective in a nonalcoholic fatty liver disease animal
model by modulating fatty-acid metabolic enzymes. J Gastroenterol
Hepatol. 23:102–109. 2008. View Article : Google Scholar : PubMed/NCBI
|
|
7
|
Small DM, Morais C, Coombes JS, Bennett
NC, Johnson DW and Gobe GC: Oxidative stress-induced alterations in
PPAR-ү and associated mitochondrial destabilization contribute to
kidney cell apoptosis. Am J Physiol Renal Physiol. 307:F814–F822.
2014. View Article : Google Scholar : PubMed/NCBI
|
|
8
|
Vallee A and Lecarpentier Y: Crosstalk
between peroxisome proliferator-activated receptor gamma and the
canonical WNT/β-Catenin pathway in chronic inflammation and
oxidative stress during carcinogenesis. Front Immunol. 9:7452018.
View Article : Google Scholar : PubMed/NCBI
|
|
9
|
Koundouros N and Poulogiannis G:
Reprogramming of fatty acid metabolism in cancer. Br J Cancer.
122:4–22. 2020. View Article : Google Scholar : PubMed/NCBI
|
|
10
|
Carracedo A, Cantley LC and Pandolfi PP:
Cancer metabolism: fatty acid oxidation in the limelight. Nat Rev
Cancer. 13:227–232. 2013. View
Article : Google Scholar : PubMed/NCBI
|
|
11
|
Ma APY, Yeung CLS, Tey SK, Mao X, Wong
SWK, Ng TH, Ko FCF, Kwong EML, Tang AHN, Ng IO, et al: Suppression
of ACADM-Mediated fatty acid oxidation promotes hepatocellular
carcinoma via aberrant CAV1/SREBP1 Signaling. Cancer Res.
81:3679–3692. 2021. View Article : Google Scholar : PubMed/NCBI
|
|
12
|
Wang C, Shao L, Pan C, Ye J, Ding Z, Wu J,
Du Q, Ren Y and Zhu C: Elevated level of mitochondrial reactive
oxygen species via fatty acid beta-oxidation in cancer stem cells
promotes cancer metastasis by inducing epithelial-mesenchymal
transition. Stem Cell Res Ther. 10:1752019. View Article : Google Scholar : PubMed/NCBI
|
|
13
|
Amoedo ND, Sarlak S, Obre E, Esteves P,
Begueret H, Kieffer Y, Rousseau B, Dupis A, Izotte J, Bellance N,
et al: Targeting the mitochondrial trifunctional protein restrains
tumor growth in oxidative lung carcinomas. J Clin Invest.
131:e1330812021. View Article : Google Scholar : PubMed/NCBI
|
|
14
|
Li XX, Wang ZJ, Zheng Y, Guan YF, Yang PB,
Chen X, Peng C, He JP, Ai YL, Wu SF, et al: Nuclear Receptor Nur77
facilitates melanoma cell survival under metabolic stress by
protecting fatty acid oxidation. Mol Cell. 69:480–492. e72018.
View Article : Google Scholar : PubMed/NCBI
|
|
15
|
Hsieh CH, Cheung CHY, Liu YL, Hou CL, Hsu
CL, Huang CT, Yang TS, Chen SF, Chen CN, Hsu WM, et al:
Quantitative Proteomics of Th-MYCN transgenic mice reveals aurora
kinase inhibitor altered metabolic pathways and enhanced ACADM To
suppress neuroblastoma progression. J Proteome Res. 18:3850–3866.
2019. View Article : Google Scholar : PubMed/NCBI
|
|
16
|
Pacary E, Tixier E, Coulet F, Roussel S,
Petit E and Bernaudin M: Crosstalk between HIF-1 and ROCK pathways
in neuronal differentiation of mesenchymal stem cells, neurospheres
and in PC12 neurite outgrowth. Mol Cell Neurosci. 35:409–423. 2007.
View Article : Google Scholar : PubMed/NCBI
|
|
17
|
Befani C, Mylonis I, Gkotinakou IM,
Georgoulias P, Hu CJ, Simos G and Liakos P: Cobalt stimulates
HIF-1-dependent but inhibits HIF-2-dependent gene expression in
liver cancer cells. Int J Biochem Cell Biol. 45:2359–2368. 2013.
View Article : Google Scholar : PubMed/NCBI
|
|
18
|
Zhigalova N, Artemov A, Mazur A and
Prokhortchouk E: Transcriptome sequencing revealed differences in
the response of renal cancer cells to hypoxia and CoCl2 treatment.
F1000Res. 4:15182015. View Article : Google Scholar : PubMed/NCBI
|
|
19
|
Zhao Y, Lützen U, Gohlke P, Jiang P,
Herdegen T and Culman J: Neuroprotective and antioxidative effects
of pioglitazone in brain tissue adjacent to the ischemic core are
mediated by PI3K/Akt and Nrf2/ARE pathways. J Mol Med (Berl).
99:1073–1083. 2021. View Article : Google Scholar : PubMed/NCBI
|
|
20
|
Jiao XX, Lin SY, Lian SX, Qiu YR, Li ZH,
Chen ZH, Lu WQ, Zhang Y, Deng L, Jiang Y and Hu GH: Inhibition of
the breast cancer by PPARγ agonist pioglitazone through JAK2/STAT3
pathway. Neoplasma. 67:834–842. 2020. View Article : Google Scholar : PubMed/NCBI
|
|
21
|
Tsubaki M, Takeda T, Tomonari Y, Kawashima
K, Itoh T, Imano M, Satou T and Nishida S: Pioglitazone inhibits
cancer cell growth through STAT3 inhibition and enhanced AIF
expression via a PPARγ-independent pathway. J Cell Physiol.
233:3638–3647. 2017. View Article : Google Scholar : PubMed/NCBI
|
|
22
|
Livak KJ and Schmittgen TD: Analysis of
relative gene expression data using real-time quantitative PCR and
the 2(−Delta Delta C(T)) Method. Methods. 25:402–408. 2001.
View Article : Google Scholar : PubMed/NCBI
|
|
23
|
Munoz-Sanchez J and Chanez-Cardenas ME:
The use of cobalt chloride as a chemical hypoxia model. J Appl
Toxicol. 39:556–570. 2019. View Article : Google Scholar : PubMed/NCBI
|
|
24
|
Ran Y, Hu C, Wan J, Kang Q, Zhou R, Liu P,
Ma D, Wang J and Tang L: Integrated investigation and experimental
validation of PPARG as an oncogenic driver: Implications for
prognostic assessment and therapeutic targeting in hepatocellular
carcinoma. Front Pharmacol. 14:12983412023. View Article : Google Scholar : PubMed/NCBI
|
|
25
|
Hsiao PJ, Chiou HC, Jiang HJ, Lee MY,
Hsieh TJ and Kuo KK: Pioglitazone enhances cytosolic lipolysis,
β-oxidation and autophagy to ameliorate hepatic steatosis. Sci Rep.
7:90302017. View Article : Google Scholar : PubMed/NCBI
|
|
26
|
Petrova V, Annicchiarico-Petruzzelli M,
Melino G and Amelio I: The hypoxic tumour microenvironment.
Oncogenesis. 7:102018. View Article : Google Scholar : PubMed/NCBI
|
|
27
|
Simonsen LO, Harbak H and Bennekou P:
Cobalt metabolism and toxicology-A brief update. Sci Total Environ.
432:210–215. 2012. View Article : Google Scholar : PubMed/NCBI
|
|
28
|
Horev-Azaria L, Kirkpatrick CJ, Korenstein
R, Marche PN, Maimon O, Ponti J, Romano R, Rossi F, Golla-Schindler
U, Sommer D, et al: Predictive toxicology of cobalt nanoparticles
and ions: Comparative in vitro study of different cellular models
using methods of knowledge discovery from data. Toxicol Sci.
122:489–501. 2011. View Article : Google Scholar : PubMed/NCBI
|
|
29
|
Choi HJ, Jhe YL, Kim J, Lim JY, Lee JE,
Shin MK and Cheong JH: FoxM1-dependent and fatty acid
oxidation-mediated ROS modulation is a cell-intrinsic drug
resistance mechanism in cancer stem-like cells. Redox Biol.
36:1015892020. View Article : Google Scholar : PubMed/NCBI
|
|
30
|
Sprecher DL, Massien C, Pearce G, Billin
AN, Perlstein I, Willson TM, Hassall DG, Ancellin N, Patterson SD,
Lobe DC and Johnson TG: Triglyceride: High-Density Lipoprotein
cholesterol effects in healthy subjects administered a peroxisome
proliferator activated receptor δ agonist. Arterioscler Thromb Vasc
Biol. 27:359–365. 2007. View Article : Google Scholar : PubMed/NCBI
|
|
31
|
Froment P, Gizard F, Defever D, Staels B,
Dupont J and Monget P: Peroxisome proliferator-activated receptors
in reproductive tissues: From gametogenesis to parturition. J
Endocrinol. 189:199–209. 2006. View Article : Google Scholar : PubMed/NCBI
|
|
32
|
Wagner N and Wagner KD: Peroxisome
proliferator-activated receptors and the hallmarks of cancer.
Cells. 11:24322022. View Article : Google Scholar : PubMed/NCBI
|
|
33
|
Kuemmerle NB, Rysman E, Lombardo PS,
Flanagan AJ, Lipe BC, Wells WA, Pettus JR, Froehlich HM, Memoli VA,
Morganelli PM, et al: Lipoprotein lipase links dietary fat to solid
tumor cell proliferation. Mol Cancer Ther. 10:427–436. 2011.
View Article : Google Scholar : PubMed/NCBI
|
|
34
|
Pepino MY, Kuda O, Samovski D and Abumrad
NA: Structure-Function of CD36 and importance of fatty acid signal
transduction in fat metabolism. Annu Rev Nutr. 34:281–303. 2014.
View Article : Google Scholar : PubMed/NCBI
|
|
35
|
Hale JS, Otvos B, Sinyuk M, Alvarado AG,
Hitomi M, Stoltz K, Wu Q, Flavahan W, Levison B, Johansen ML, et
al: Cancer stem cell-specific scavenger receptor CD36 drives
glioblastoma progression. Stem Cells. 32:1746–1758. 2014.
View Article : Google Scholar : PubMed/NCBI
|
|
36
|
Yang Y, Gu H, Zhang K, Guo Z, Wang X, Wei
Q, Weng L, Han X, Lv Y, Cao M, et al: Exosomal ACADM sensitizes
gemcitabine-resistance through modulating fatty acid metabolism and
ferroptosis in pancreatic cancer. BMC Cancer. 23:7892023.
View Article : Google Scholar : PubMed/NCBI
|
|
37
|
Chen D, Feng X, Lv Z, Xu X, Lu Y, Wu W, Wu
H, Liu H, Cao L, Ye S, et al: ACADS acts as a potential methylation
biomarker associated with the proliferation and metastasis of
hepatocellular carcinomas. Aging (Albany NY). 11:8825–8844. 2019.
View Article : Google Scholar : PubMed/NCBI
|
|
38
|
Xu R, Luo X, Ye X, Li H, Liu H, Du Q and
Zhai Q: SIRT1/PGC-1α/PPAR-ү correlate with hypoxia-induced
chemoresistance in non-small cell lung cancer. Front Oncol.
11:6827622021. View Article : Google Scholar : PubMed/NCBI
|
|
39
|
Abe K, Ikeda S, Nara M, Kitadate A, Tagawa
H and Takahashi N: Hypoxia-induced oxidative stress promotes
therapy resistance via upregulation of heme oxygenase-1 in multiple
myeloma. Cancer Med. 12:9709–9722. 2023. View Article : Google Scholar : PubMed/NCBI
|
|
40
|
Lane SL, Dodson RB, Doyle AS, Park H,
Rathi H, Matarrazo CJ, Moore LG, Lorca RA, Wolfson GH and Julian
CG: Pharmacological activation of peroxisome proliferator-activated
receptor ү (PPAR-ү) protects against hypoxia-associated fetal
growth restriction. FASEB J. 33:8999–9007. 2019. View Article : Google Scholar : PubMed/NCBI
|
|
41
|
Kilter H, Werner M, Roggia C, Reil JC,
Schafers HJ, Kintscher U and Bohm M: The PPAR-gamma agonist
rosiglitazone facilitates Akt rephosphorylation and inhibits
apoptosis in cardiomyocytes during hypoxia/reoxygenation. Diabetes
Obes Metab. 11:1060–1067. 2009. View Article : Google Scholar : PubMed/NCBI
|
|
42
|
Feng J, Dai W, Mao Y, Wu L, Li J, Chen K,
Yu Q, Kong R, Li S, Zhang J, et al: Simvastatin re-sensitizes
hepatocellular carcinoma cells to sorafenib by inhibiting
HIF-1α/PPAR-ү/PKM2-mediated glycolysis. J Exp Clin Cancer Res.
39:242020. View Article : Google Scholar : PubMed/NCBI
|
|
43
|
Liu T, Sun L, Zhang Y, Wang Y and Zheng J:
Imbalanced GSH/ROS and sequential cell death. J Biochem Mol
Toxicol. 36:e229422021. View Article : Google Scholar : PubMed/NCBI
|
|
44
|
Aldini G, Altomare A, Baron G, Vistoli G,
Carini M, Borsani L and Sergio F: N-Acetylcysteine as an
antioxidant and disulphide breaking agent: The reasons why. Free
Radic Res. 52:751–762. 2018. View Article : Google Scholar : PubMed/NCBI
|
|
45
|
Han EJ, Im CN, Park SH, Moon EY and Hong
SH: Combined treatment with peroxisome proliferator-activated
receptor (PPAR) γ ligands and gamma radiation induces apoptosis by
PPARγ-independent up-regulation of reactive oxygen species-induced
deoxyribonucleic acid damage signals in non-small cell lung cancer
cells. Int J Radiat Oncol Biol Phys. 85:e239–248. 2013. View Article : Google Scholar : PubMed/NCBI
|
|
46
|
Chen K, Li D, Zhang X, Hermonat PL and
Mehta JL: Anoxia-reoxygenation stimulates collagen type-I and MMP-1
expression in cardiac fibroblasts: Modulation by the PPAR-gamma
ligand pioglitazone. J Cardiovasc Pharmacol. 44:6822004. View Article : Google Scholar : PubMed/NCBI
|
|
47
|
Cadenas S: Mitochondrial uncoupling, ROS
generation and cardioprotection. Biochim Biophys Acta Bioenerg.
1859:940–950. 2018. View Article : Google Scholar : PubMed/NCBI
|
|
48
|
Fuhrmann DC and Brune B: Mitochondrial
composition and function under the control of hypoxia. Redox Biol.
12:208–215. 2017. View Article : Google Scholar : PubMed/NCBI
|
|
49
|
Sawayama H, Ishimoto T, Watanabe M,
Yoshida N, Sugihara H, Kurashige J, Hirashima K, Iwatsuki M, Baba
Y, Oki E, et al: Small molecule agonists of PPAR-ү exert
therapeutic effects in esophageal cancer. Cancer Res. 74:575–585.
2014. View Article : Google Scholar : PubMed/NCBI
|
|
50
|
Jin JQ, Han JS, Ha J, Baek HS and Lim DJ:
Lobeglitazone, A peroxisome proliferator-activated receptor-gamma
agonist, inhibits papillary thyroid cancer cell migration and
invasion by suppressing p38 MAPK signaling pathway. Endocrinol
Metab (Seoul). 36:1095–1110. 2021. View Article : Google Scholar : PubMed/NCBI
|
|
51
|
Jiao HL and Zhao BL: cytotoxic effect of
peroxisome proliferator fenofibrate on human HepG2 hepatoma cell
line and relevant mechanisms. Toxicol Appl Pharmacol. 185:172–179.
2002. View Article : Google Scholar : PubMed/NCBI
|
|
52
|
Gao J, Liu Q, Xu Y, Gong X, Zhang R, Zhou
C, Su Z, Jin J, Shi H, Shi J and Hou Y: PPARα induces cell
apoptosis by destructing Bcl2. Oncotarget. 6:44635–44642. 2015.
View Article : Google Scholar : PubMed/NCBI
|
|
53
|
Chong SJ, Low IC and Pervaiz S:
Mitochondrial ROS and involvement of Bcl-2 as a mitochondrial ROS
regulator. Mitochondrion. 19(Pt A): 39–48. 2014. View Article : Google Scholar : PubMed/NCBI
|


