Introduction
Gliomas are the most common malignant tumors of the
central nervous system (CNS) (1).
The World Health Organization classifies glioma as grade I–IV
(2,3). Although the study of grade II–III
glioma has improved clinical treatment, numerous patients with
grade II–III glioma will relapse later, resulting in poor prognosis
and reduced quality of life (4). As
a result of this prognostic heterogeneity, the molecular
classification should be incorporated into the evaluation of
patients with grade II–III glioma. As precision medicine becomes
increasingly prevalent, traditional markers such as mutations of
the isocitrate dehydrogenase gene and deletions of chromosome 1p
and 19q may not be sufficient for individual risk assessment of
patients with grade II–III glioma (5,6).
Therefore, it is imperative that novel biomarkers are identified
that are effective in optimizing their treatment.
Changes in energy metabolism are one of the most
significant biological characteristics associated with cancer
(7). The Warburg effect refers to
the change from oxidative phosphorylation to aerobic glycolysis,
which can provide energy for cancer cells (8).
The metabolism of cancer cells is reprogrammed to
improve glucose uptake, so it can also provide more energy to
cancer cells, even though aerobic glycolysis produces less energy
than mitochondrial oxidative phosphorylation (9,10).
There is increasing evidence that this reprogramming of metabolic
activity by tumor cells serves an important role in the development
of various cancer types (11,12).
The glycolysis-related risk model constructed by Liu et al
(13) provided an improved
understanding of rectal cancer. Additionally, Reuss et al
(14) found that ketogenic diets
for management targeting the Warburg effect could effectively halt
the progression of grade II–III glioma to more aggressive subtypes.
Long non-coding RNAs (lncRNAs) are a class of RNA molecules with
specific functions that participate in genome organization, cell
structure and gene expression through a variety of interactions.
lncRNAs regulate gene expression through epigenetic regulation,
transcriptional regulation and post-transcriptional regulation,
thereby participating in biological processes such as cell
proliferation, differentiation and apoptosis in cancer (15). In recent years, lncRNAs have been
found to be involved in tumor cell growth, proliferation and energy
acquisition (16,17). For example, LINC00092 directly binds
to 6-phosphofructo-2-kinase/fructose-2,6-biphosphatase 2 to promote
tumorigenesis (18). Sun et
al (19) constructed a
prognostic risk model to predict Lung adenocarcinoma patient's
survival and response to immunotherapy based on hub oxidative
stress-related lncRNAs using bioinformatics analysis. As a result
of these newly identified features, prognosis can be more
accurately predicted and a greater understanding of how lncRNAs
contribute to cancer development can be gained.
The present study demonstrated a potential
association between glycolysis-related lncRNAs and grade II–III
glioma using bioinformatics approaches. The present results may be
helpful to understand the cell energy metabolism of grade II–III
glioma in the future.
Materials and methods
Data acquisition
All the information of patients with grade II–III
glioma was obtained from The Cancer Genome Atlas database (Center
for Cancer Genomics at the National Cancer Institute; http://portal.gdc.cancer.gov/). The Perl language
(http://www.perl.org/) was used to merge
RNA-sequencing results into matrix files. The data of 479 patients
were obtained and the patients were randomly divided into two
groups using the R (version 4.2.3; http://www.R-project.org/) package ‘caret’ (20). The first group (n=240) was used for
training and the other group (n=239) was used for testing. All data
regarding the clinical characteristics of all patients are shown in
Table SI.
Glycolysis-related gene
acquisition
A total of 243 glycolysis-related gene profiles
(21) (Table SII) were obtained from the
Molecular Signatures Database (http://www.gsea-msigdb.org) labeled ‘Hallmark
glycolysis’ and ‘Kyoto Encyclopedia of Genes and Genomes (KEGG)
glycolysis gluconeogenesis’.
Screening glycolysis-related
lncRNAs
The lncRNA annotation files were obtained from the
Generic Code Database (https://www.gencodegenes.org/human/). Subsequently,
lncRNA information related to glycolysis-related gene expression
was obtained. The selection criteria were set as |R|>0.5 and
P<0.001.
Construction of seven
glycolysis-related lncRNAs prognostic signature and risk model
The training set was used to construct the
prognostic model. As previously reported by Sun et al
(22), a gene signature with high
performance and stability was constructed using a combination of
machine learning algorithms, including the Least Absolute Shrinkage
and Selection Operator (LASSO) algorithm, and multivariate Cox
analyses. Univariate Cox analysis was applied to determine which
glycolysis-related lncRNAs were associated with overall survival
(OS) among patients with grade II–III glioma (P<0.05).
Subsequently, LASSO regression analysis was conducted to analyze
the glycolysis-related lncRNAs using the package ‘glmnet’ in R
(23). Upon reaching the minimum
partial likelihood deviance, the optimal lambda was identified.
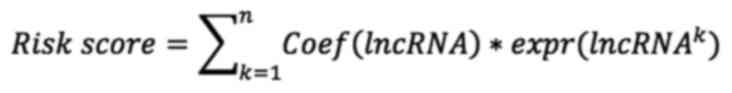
Finally, a risk characteristics and prognosis model based on seven
glycolysis-related lncRNAs was constructed as follows:
Coef (lncRNA) refers to the coefficient associated
with survival. Expr is the expression of lncRNAs.
Validation of the seven
glycolysis-related lncRNAs risk model
Kaplan-Meier (K-M) analysis was applied to compare
OS between two groups using the R package ‘survival’ (24) (version 3.5–0). The package
‘timeROC’(25) (version 0.4) was
used to verify the predictive ability of the established risk
model. The concordance index (C-index) was estimated to evaluate
the discrimination of the model. Principal component analysis (PCA)
and t-distributed stochastic neighbor embedding (t-SNE) analysis
were used to visually distinguish two groups.
Construction and assessment of the
nomogram
Independent prognostic factor analysis was conducted
in R with the package ‘survival’. The R package ‘rms’ (26) was further applied to construct a
nomogram and the predictive ability of the nomogram was
evaluated.
Exploration of the tumor immune
microenvironment and tumor mutation burden (TMB)
To quantitatively analyze tumor tissue
transcriptomic data, the CIBERSORT algorithm was used, which led to
the estimation of the absolute number of immune and stromal cells
present in the tumor tissues. Furthermore, the single sample Gene
Set Enrichment Analysis (ssGSEA) algorithm was used to assess the
difference between high- and low-risk groups in terms of the
ability to resist tumor infiltration (27). The ESTIMATE algorithm was used to
determine the stromal score, immune score and ESTIMATE score of
grade II–III glioma samples (28).
The package ‘maftools’ was used to analyze the TMB (29).
Exploration of the therapeutic
significance of the risk model
Drug information was obtained from the Genomics of
Cancer Drug Sensitivity (GDSC) website (30) (http://www.cancerrxgene.org), and the R package
‘pRRophetic’ (31) was used to
predict IC50 values to explore possible clinical
adjuvant drugs for the treatment of grade II–III glioma (https://www.cancerrxgene.org). To determine if the
risk model was associated with immunotherapy, the expression levels
of key genes in the two groups of immune checkpoints were
compared.
Functional enrichment analysis
Differentially expressed genes (DEGs) were
identified using the package ‘limma’ (32). The ‘clusterProfiler’ package was
used to study the related functions and pathways of DEGs bias
(33). GSEA was used to compare
potential pathways between the two groups. The R package
‘ggalluvival’ (34) (version
0.12.5) was used to visualize the association between lncRNAs and
risk factors (protective/risk) in a Sankey diagram.
Construction of the lncRNA-mRNA
co-expression network
Cytoscape software (version 3.9.0; http://cytoscape.org) was used to visualize the
lncRNA-mRNA co-expression network.
Cell culture
The HA1800 human normal astrocyte cell line and the
SHG-44 human glioma cell line were purchased from American Type
Culture Collection (35). HA1800
and SHG-44 cells were cultured in DMEM (Gibco; Thermo Fisher
Scientific, Inc.) supplemented with 10% fetal bovine serum (Gibco;
Thermo Fisher Scientific, Inc.) and antibiotics (100 U/ml
penicillin and 100 µg/ml streptomycin). Cells were incubated at
37°C with 5% CO2.
Transfection
Colorectal neoplasia differentially expressed
(CRNDE) small interfering RNA (siRNA), si-CRNDE-1
(5′-GGTGTTAAGTGTGATGCTTCC-3′) or siCRNDE-2
(5′-GGATGCTGTCAGCTAAGTTCA-3′), and negative control siRNA
(5′-UUCUCCGAACGUGUCACGUTT-3′) were purchased from Shanghai
GenePharma Co., Ltd (cat. no. A10001). CRNDE expression in SHG-44
cells was silenced by siRNA transfection using
Lipofectamine® RNAiMax reagent (Invitrogen; Thermo
Fisher Scientific, Inc.) according to the manufacturer's
instructions. The transfection compound was prepared at room
temperature for 20 min. The concentration of siRNA used was 50 nM.
After culturing in the incubator (37°C) for 48 h, the cells and
cell cultures were harvested for subsequent experiments, and the
transfection efficiency was evaluated by reverse
transcription-quantitative PCR (RT-qPCR).
RT-qPCR
The cell density for RNA extraction was
1×10⁶. Total RNA was extracted using the
TRIzol® reagent (Thermo Fisher Scientific, Inc.), and
cDNA was obtained by reverse transcription using the
TransScript® First-Strand cDNA Synthesis SuperMix
(Shanghai Yeasen Biotechnology Co., Ltd.). The cDNA was amplified
using the Hieff UNICON universal Blue qPCR SYBR Green Master Mix
kit (YEASEN Corporation, China). RNA extraction, cDNA synthesis and
qPCR were all performed according to the manufacturer's protocols.
The reaction volume was 20 µl, including 10 µl of Universal Blue
qPCR SYBR Green Master Mix, 7.6 µl of nucleic acid-free water, 0.2
µl of each primer, and 2 µl of cDNA product. The PCR cycling
conditions were as follows: 95°C for 2 min for 1 cycle, 95°C for 10
sec and 60°C for 30 sec for 40 cycles, and the melting curve was
then determined. GAPDH was used as an internal reference and
relative mRNA expression was calculated using the 2−ΔΔCq
method (36,37). The experiment was repeated three
times. The primer sequences were as follows: GAPDH forward,
5′-AAGGTGAAGGTCGGAGTCAAC-3′ and reverse,
5′-GGGGTCATTGATGGCAACAAT-3′; and CRNDE forward,
5′-TGGATGCTGTCAGCTAAGTTCAC-3′ and reverse,
5′-TTCCAGTGGCATCCTCCTTATC-3′.
Cell Counting Kit-8 (CCK-8)
assays
The effect of CRNDE expression on the proliferation
of SHG-44 cells was detected using a CCK-8 assay (Dojindo
Laboratories, Inc.). Briefly, after the cells were cultured in
96-well plates (6×10³ cells/well) for 0, 24, 48, 72 and
96 h, 20 µl CCK-8 cell proliferation agent was added to each well
and incubated for 2 h at 37°C and the absorbance of the cell
culture medium was measured at a wavelength of 450 nm.
Colony formation assays
After transfection, SHG-44 cells were cultured in
6-well plates (5×10³ cells/well) for 12 days. After
fixation with 4% paraformaldehyde solution at room temperature for
20 min, the cells were stained with 0.1% crystal violet at room
temperature for 15 min (Beyotime Institute of Biotechnology).
Measurement of the extracellular
acidification rate (ECAR)
SHG-44 cells were seeded in 6-well plates
(3×10⁵ cells/well) and incubated for 24 h. Prior to the
assay, cells were subjected to serum deprivation to enhance glucose
uptake. Subsequently, the cells were washed three times with PBS
buffer. Following this, the cells were stimulated with 100 nM
insulin for 30 min. A glucose uptake assay kit (Abcam) was used to
quantify glucose uptake, with all results being normalized to the
cell number.
Statistical analysis
All statistical analyses were conducted in the R and
Perl software and the statistical results of samples were expressed
as mean ± standard deviation. All assays were done at least three
times independently. Independent Student's t-tests were applied to
determine the difference between the two groups. Correlation
analysis was performed using the Pearson correlation test. For the
analysis of differences between K-M curves, the log-rank test was
performed. If there is no special description for the above method,
P<0.05 was considered to indicate a statistically significant
difference.
Results
Screening of glycolytic lncRNAs in
patients with low-grade glioma
Fig. 1 shows the
process of the present study. A total of 14,056 lncRNAs and 243
glycolytic genes were screened for subsequent Pearson correlation
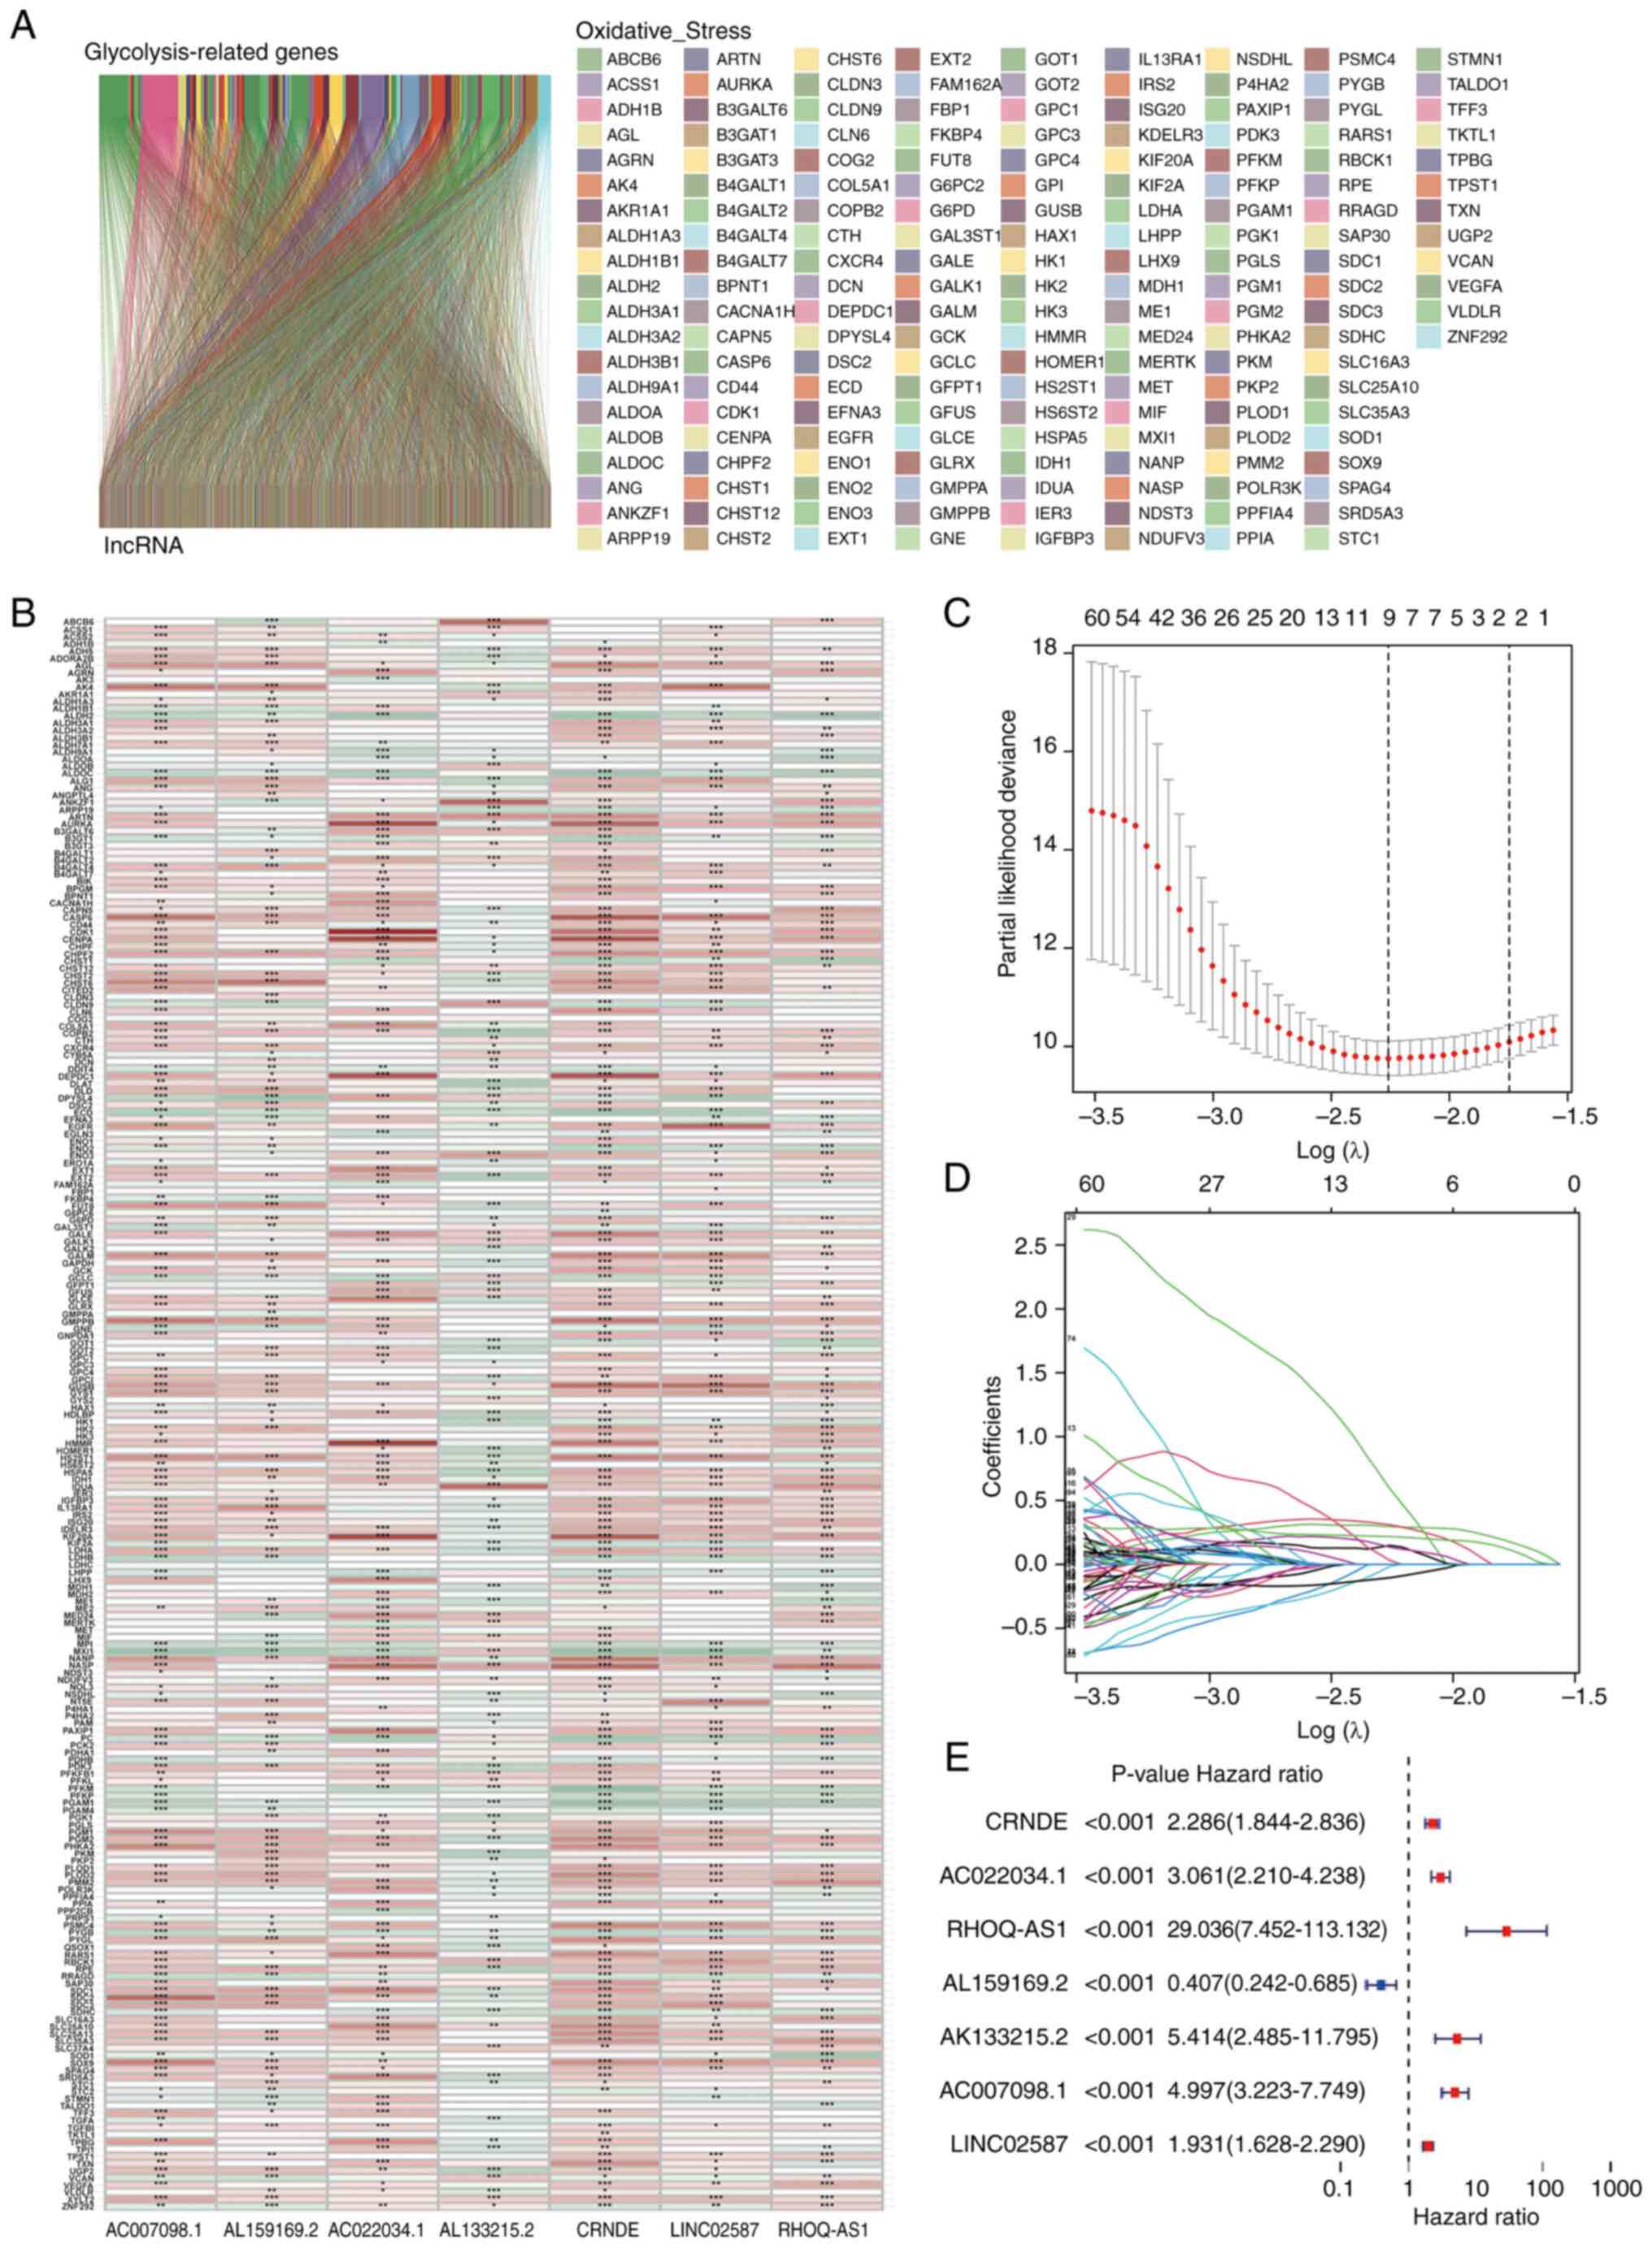
analysis (21). The co-results
among lncRNAs and mRNAs of Pearson correlation test are shown in
Table SIII and 1,889 glycolytic
lncRNAs were identified. Additionally, the consistent part of the
expression between glycolytic genes and glycolytic lncRNAs was
shown in the Sankey diagram, and their correlation was visually
demonstrated (Fig. 2A and B).
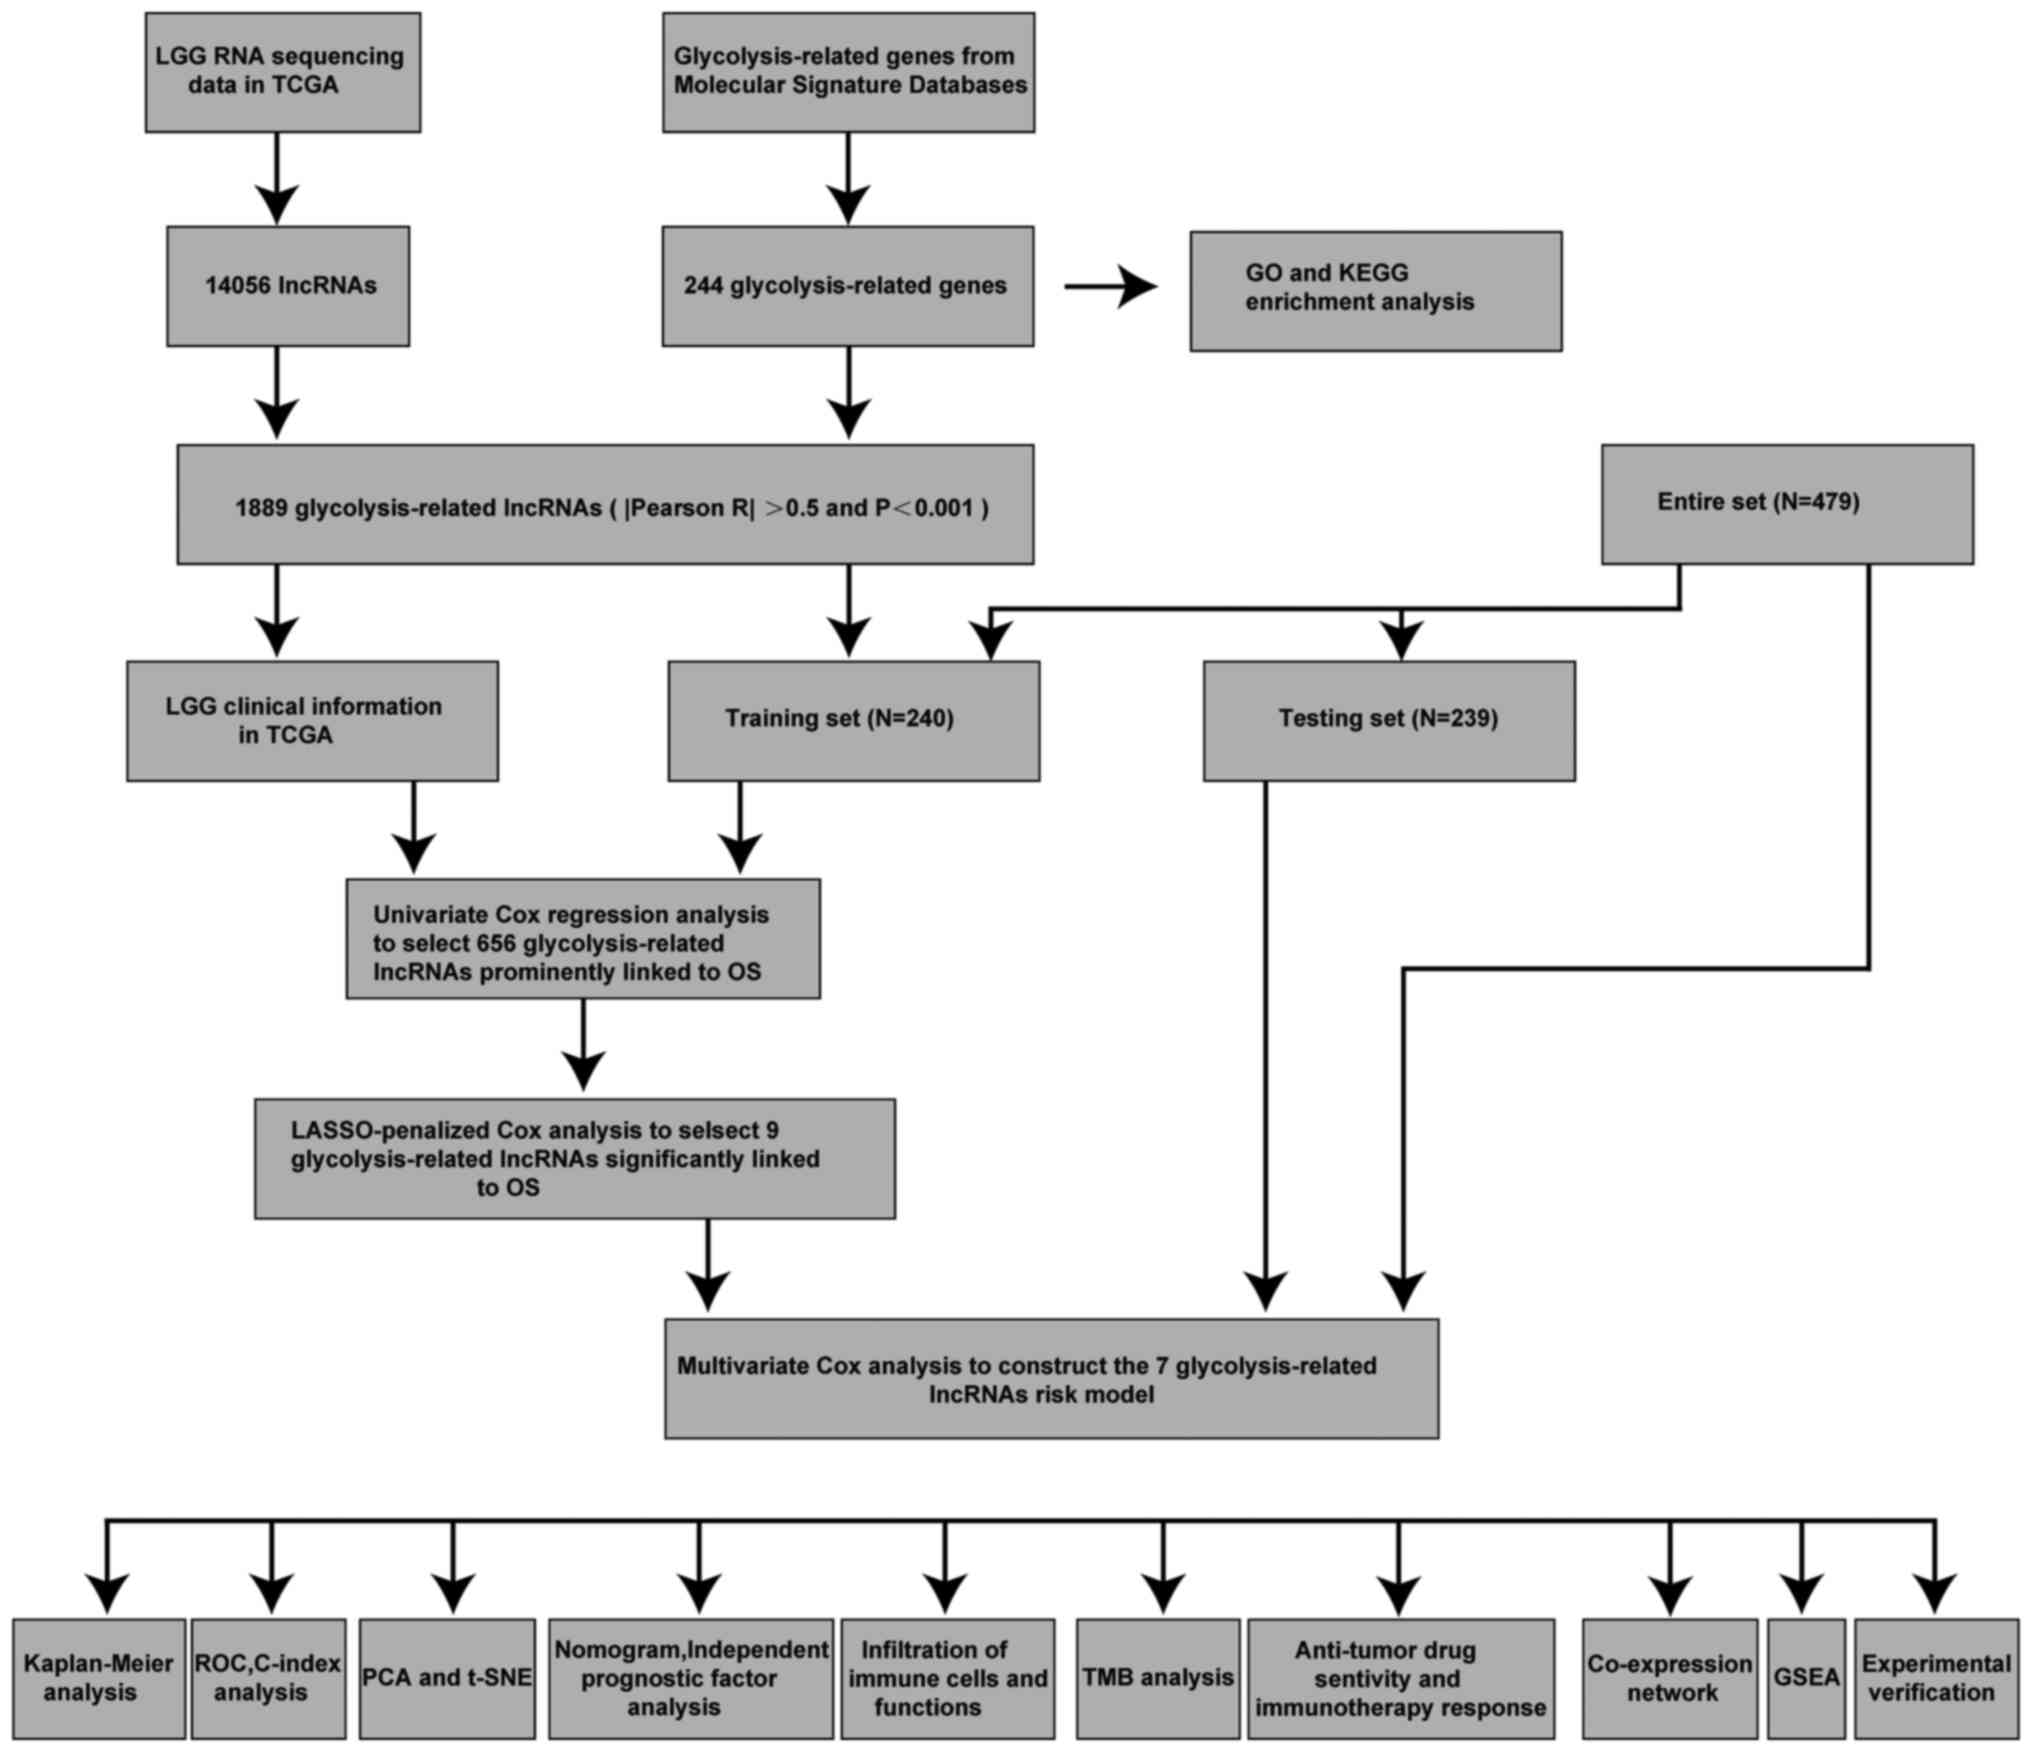 | Figure 1.Workflow of the present study.
C-index, concordance index; GO, Gene Ontology; GSEA, Gene Set
Enrichment Analysis; KEGG, Kyoto Encyclopedia of Genes and Genomes;
LASSO, Least Absolute Shrinkage and Selection Operator; LGG,
low-grade glioma; lncRNA, long non-coding RNA; OS, overall
survival; PCA, principal component analysis; ROC, receiver
operating characteristic; t-SNE, t-distributed stochastic neighbor
embedding; TCGA, The Cancer Genome Atlas; TMB, tumor mutation
burden. |
Constructing a glycolytic lncRNAs risk
model
Univariate Cox analysis was used to screen
glycolytic lncRNAs. In the end, 656 prognostic lncRNAs were
identified in the training set (Table
SIV). LASSO regression analysis was performed on these
survival-related lncRNAs to further screen key lncRNAs for model
construction. Finally, nine lncRNAs were retained (Fig. 2C and D). Subsequently, multivariate
Cox regression analysis was performed and seven glycolytic lncRNAs,
including CRNDE, AC022034.1, Ras homolog family member Q
(RHOQ-AS1), AL159169.2, AL133215.2, AC007098.1 and LINC02587, were
identified (Fig. 2E; Table SV). Finally, the calculation
formula was determined using the Cox regression model coefficient
and lncRNA expression: CRNDE × 0.530754428201569 + AC022034.1 ×
0.51597198629815 + RHOQ-AS1 × 4.0070016692408 + AL159169.2
×-1.33589967405211 + AL133215.2 × 0.902923079138878 + AC007098.1 ×
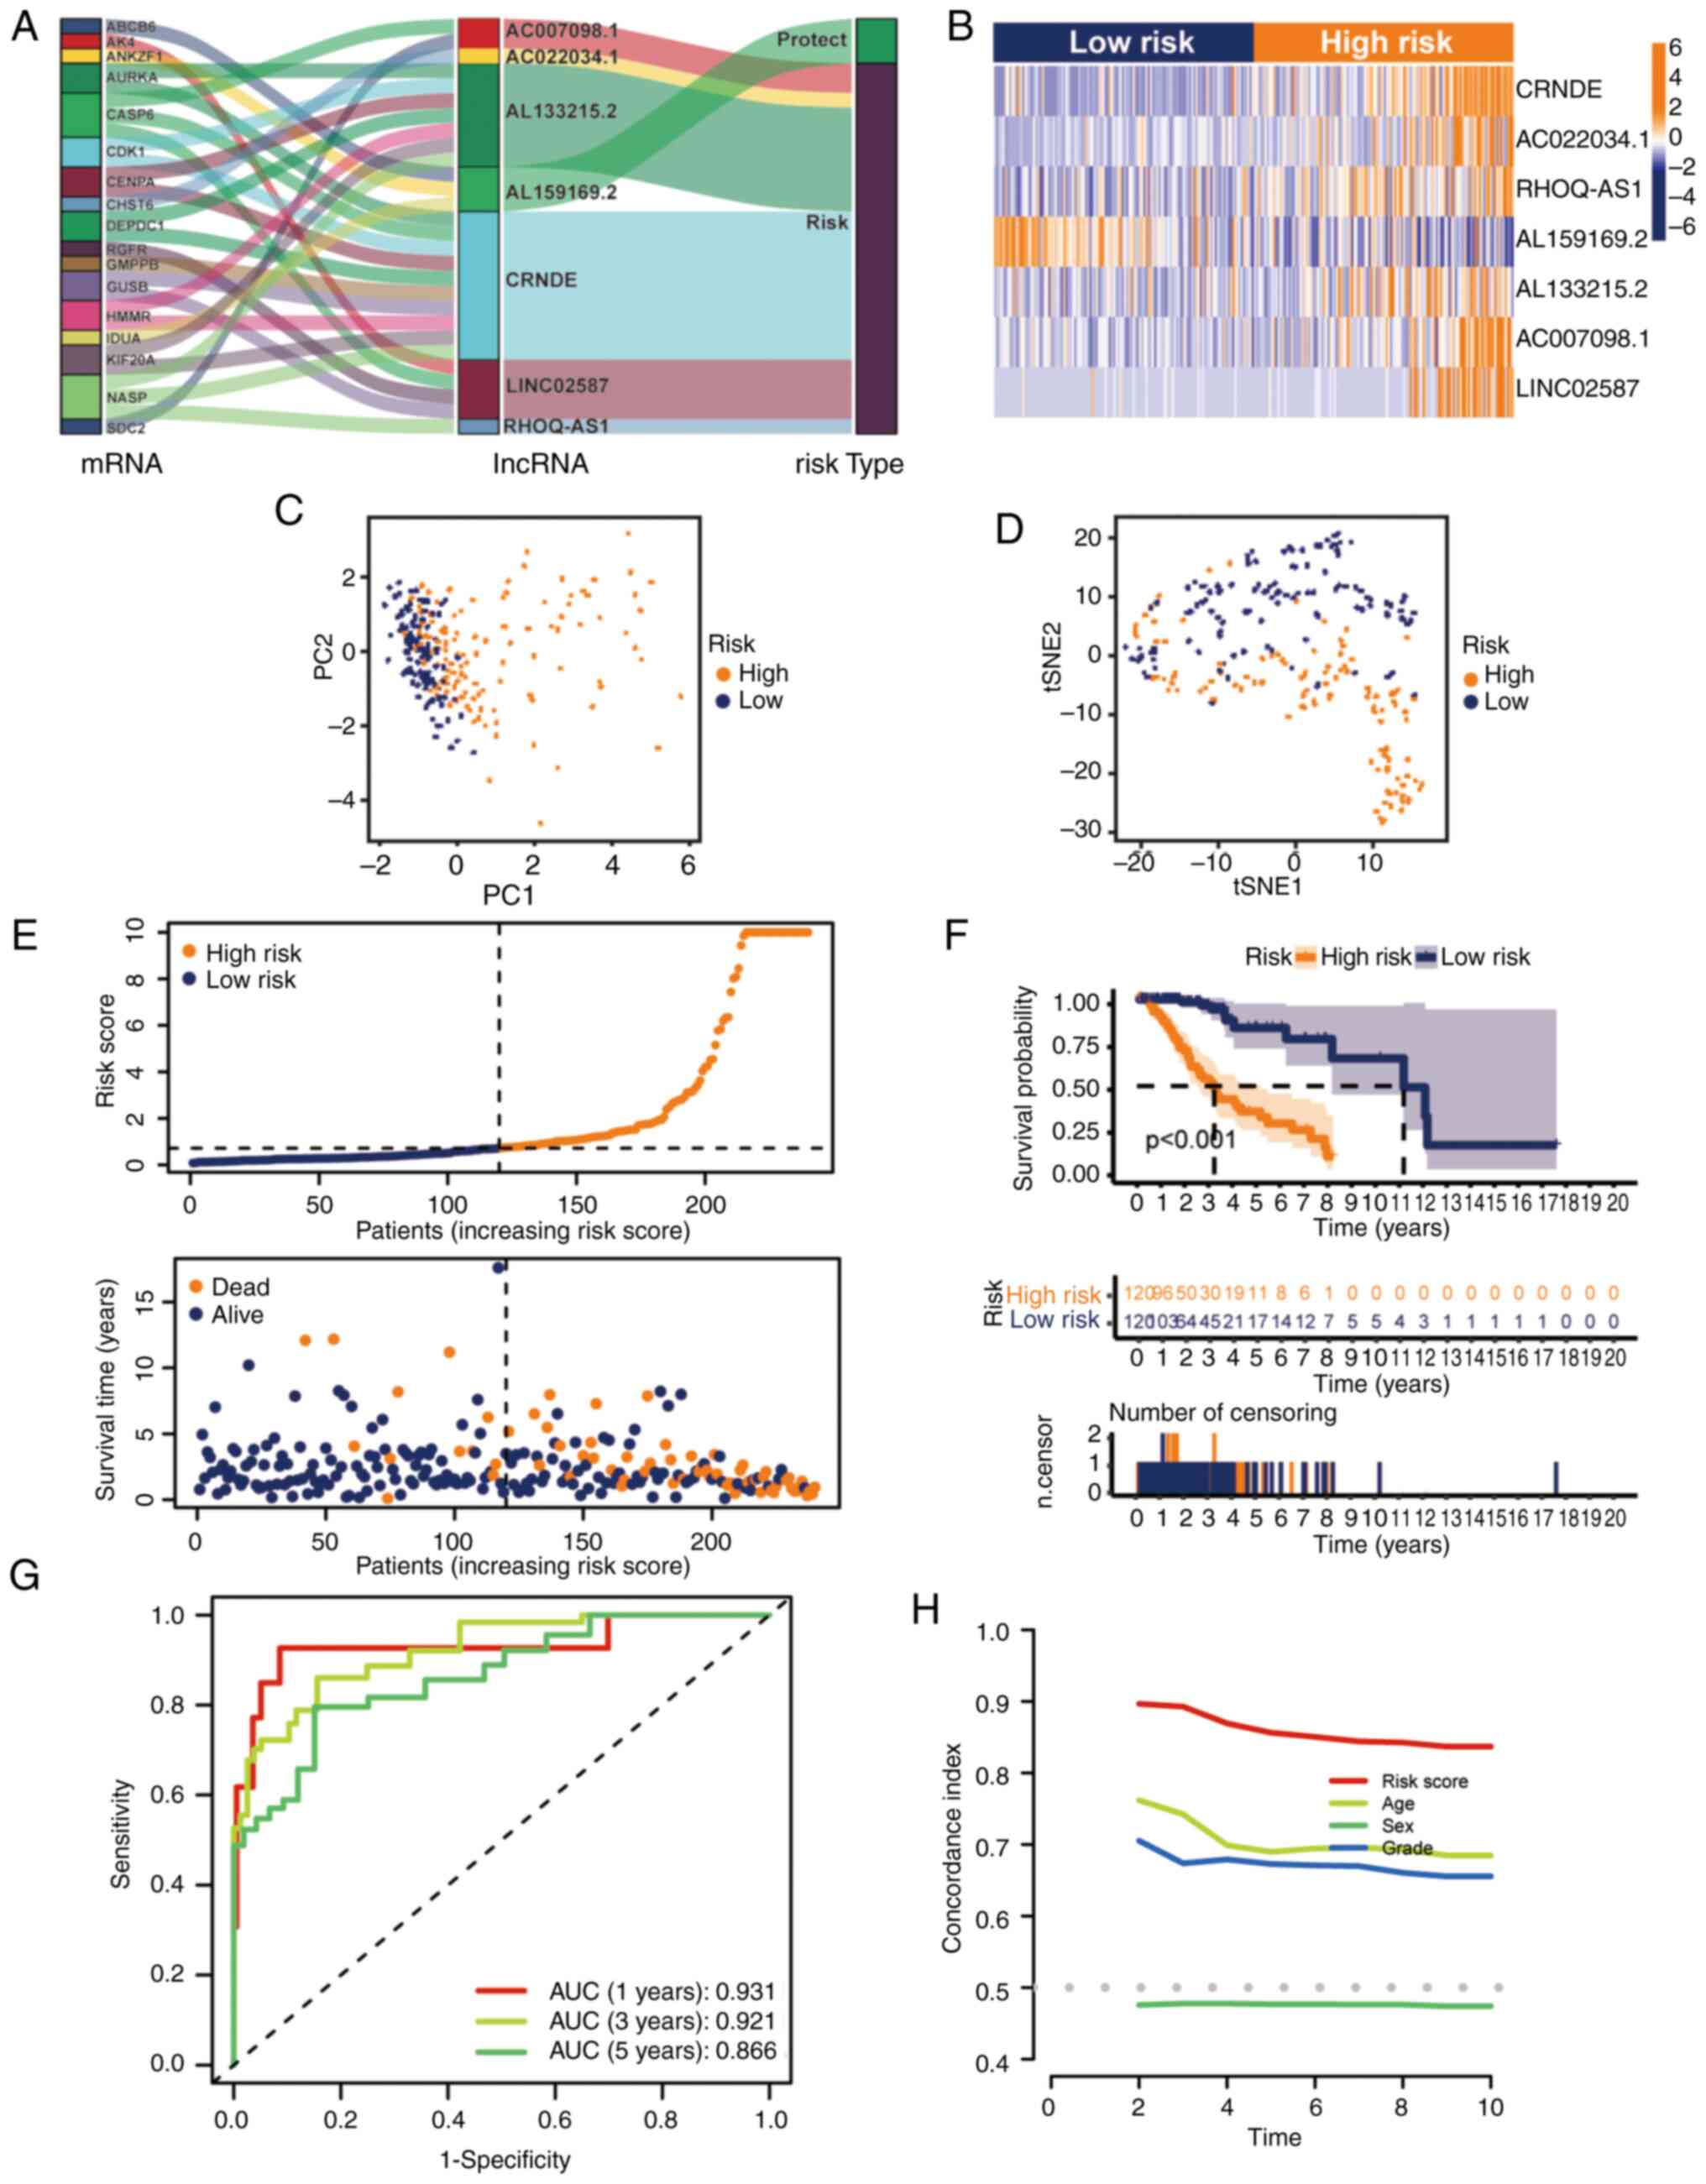
0.660037199843563 + LINC02587 × 0.29755586476417. AL159169.2, with
a negative coefficient, tended to be a protective factor, and the
other six lncRNAs tended to be risk factors, which was confirmed by
the Sankey diagram (Fig. 3A).
Additionally, the relative expression levels of the seven hub
glycolytic lncRNAs were evaluated (Fig.
3B). Patients in the high-risk group had higher expression
levels of destructive lncRNAs than patients in the low-risk group
(Fig. 3A and B). Subsequently, the
performance of the risk formula was verified using PCA and t-SNE
algorithms. The results indicated that there was a difference
between the two groups of patients with grade II–III glioma, which
clearly showed that the situation of patients with grade II–III
glioma in the two groups was different (Fig. 3C and D). Furthermore, the survival
of the two groups of patients with grade II–III glioma in the
training set were compared (Fig.
3E). The OS of different groups in the training set was
compared by K-M analysis. The results demonstrated that patients
with grade II–III glioma in the low-risk group had an improved OS
(Fig. 3F; P<0.001). The receiver
operating characteristic curve showed that the seven glycolytic
lncRNAs had high accuracy in diagnostic efficacy, and the areas
under the curve (AUCs) of 1-, 3- and 5-year prediction were 0.931,
0.921 and 0.866, respectively (Fig.
3G). The C-index of the risk model also showed that the risk
model had good reliability (Fig.
3H).
Confirmation of glycolytic lncRNAs
risk model
The test set of patients with grade II–III glioma
was subsequently used to evaluate the reliability of the model
(n=239). K-M analysis indicated the survival of the two groups of
patients with grade II–III glioma, and the results demonstrated
that the OS of the low-risk group was improved compared with that
of the high-risk group (Fig. 4A;
P<0.001). Fig. 4B-D shows the
distribution of the risk scores, survival time in the two groups
and the expression of the seven lncRNAs in the test set. There was
a notable difference between the two groups in the PCA and t-SNE
analysis (Fig. 4E and F). In the
test set, the predicted AUC values of the risk model for 1, 3 and 5
years were 0.846, 0.833 and 0.788, respectively (Fig. 4G). C-index analysis also illustrated
that the risk model had good reliability (Fig. 4H). Finally, the entire set of
patients with grade II–III glioma (n=479) was used to verify the
prognostic ability of the model, indicating consistency with the
aforementioned validation (Fig.
4I-P). It was evident that the established risk model was
capable of reliably distinguishing patients with grade II–III
glioma based on their risk profile.
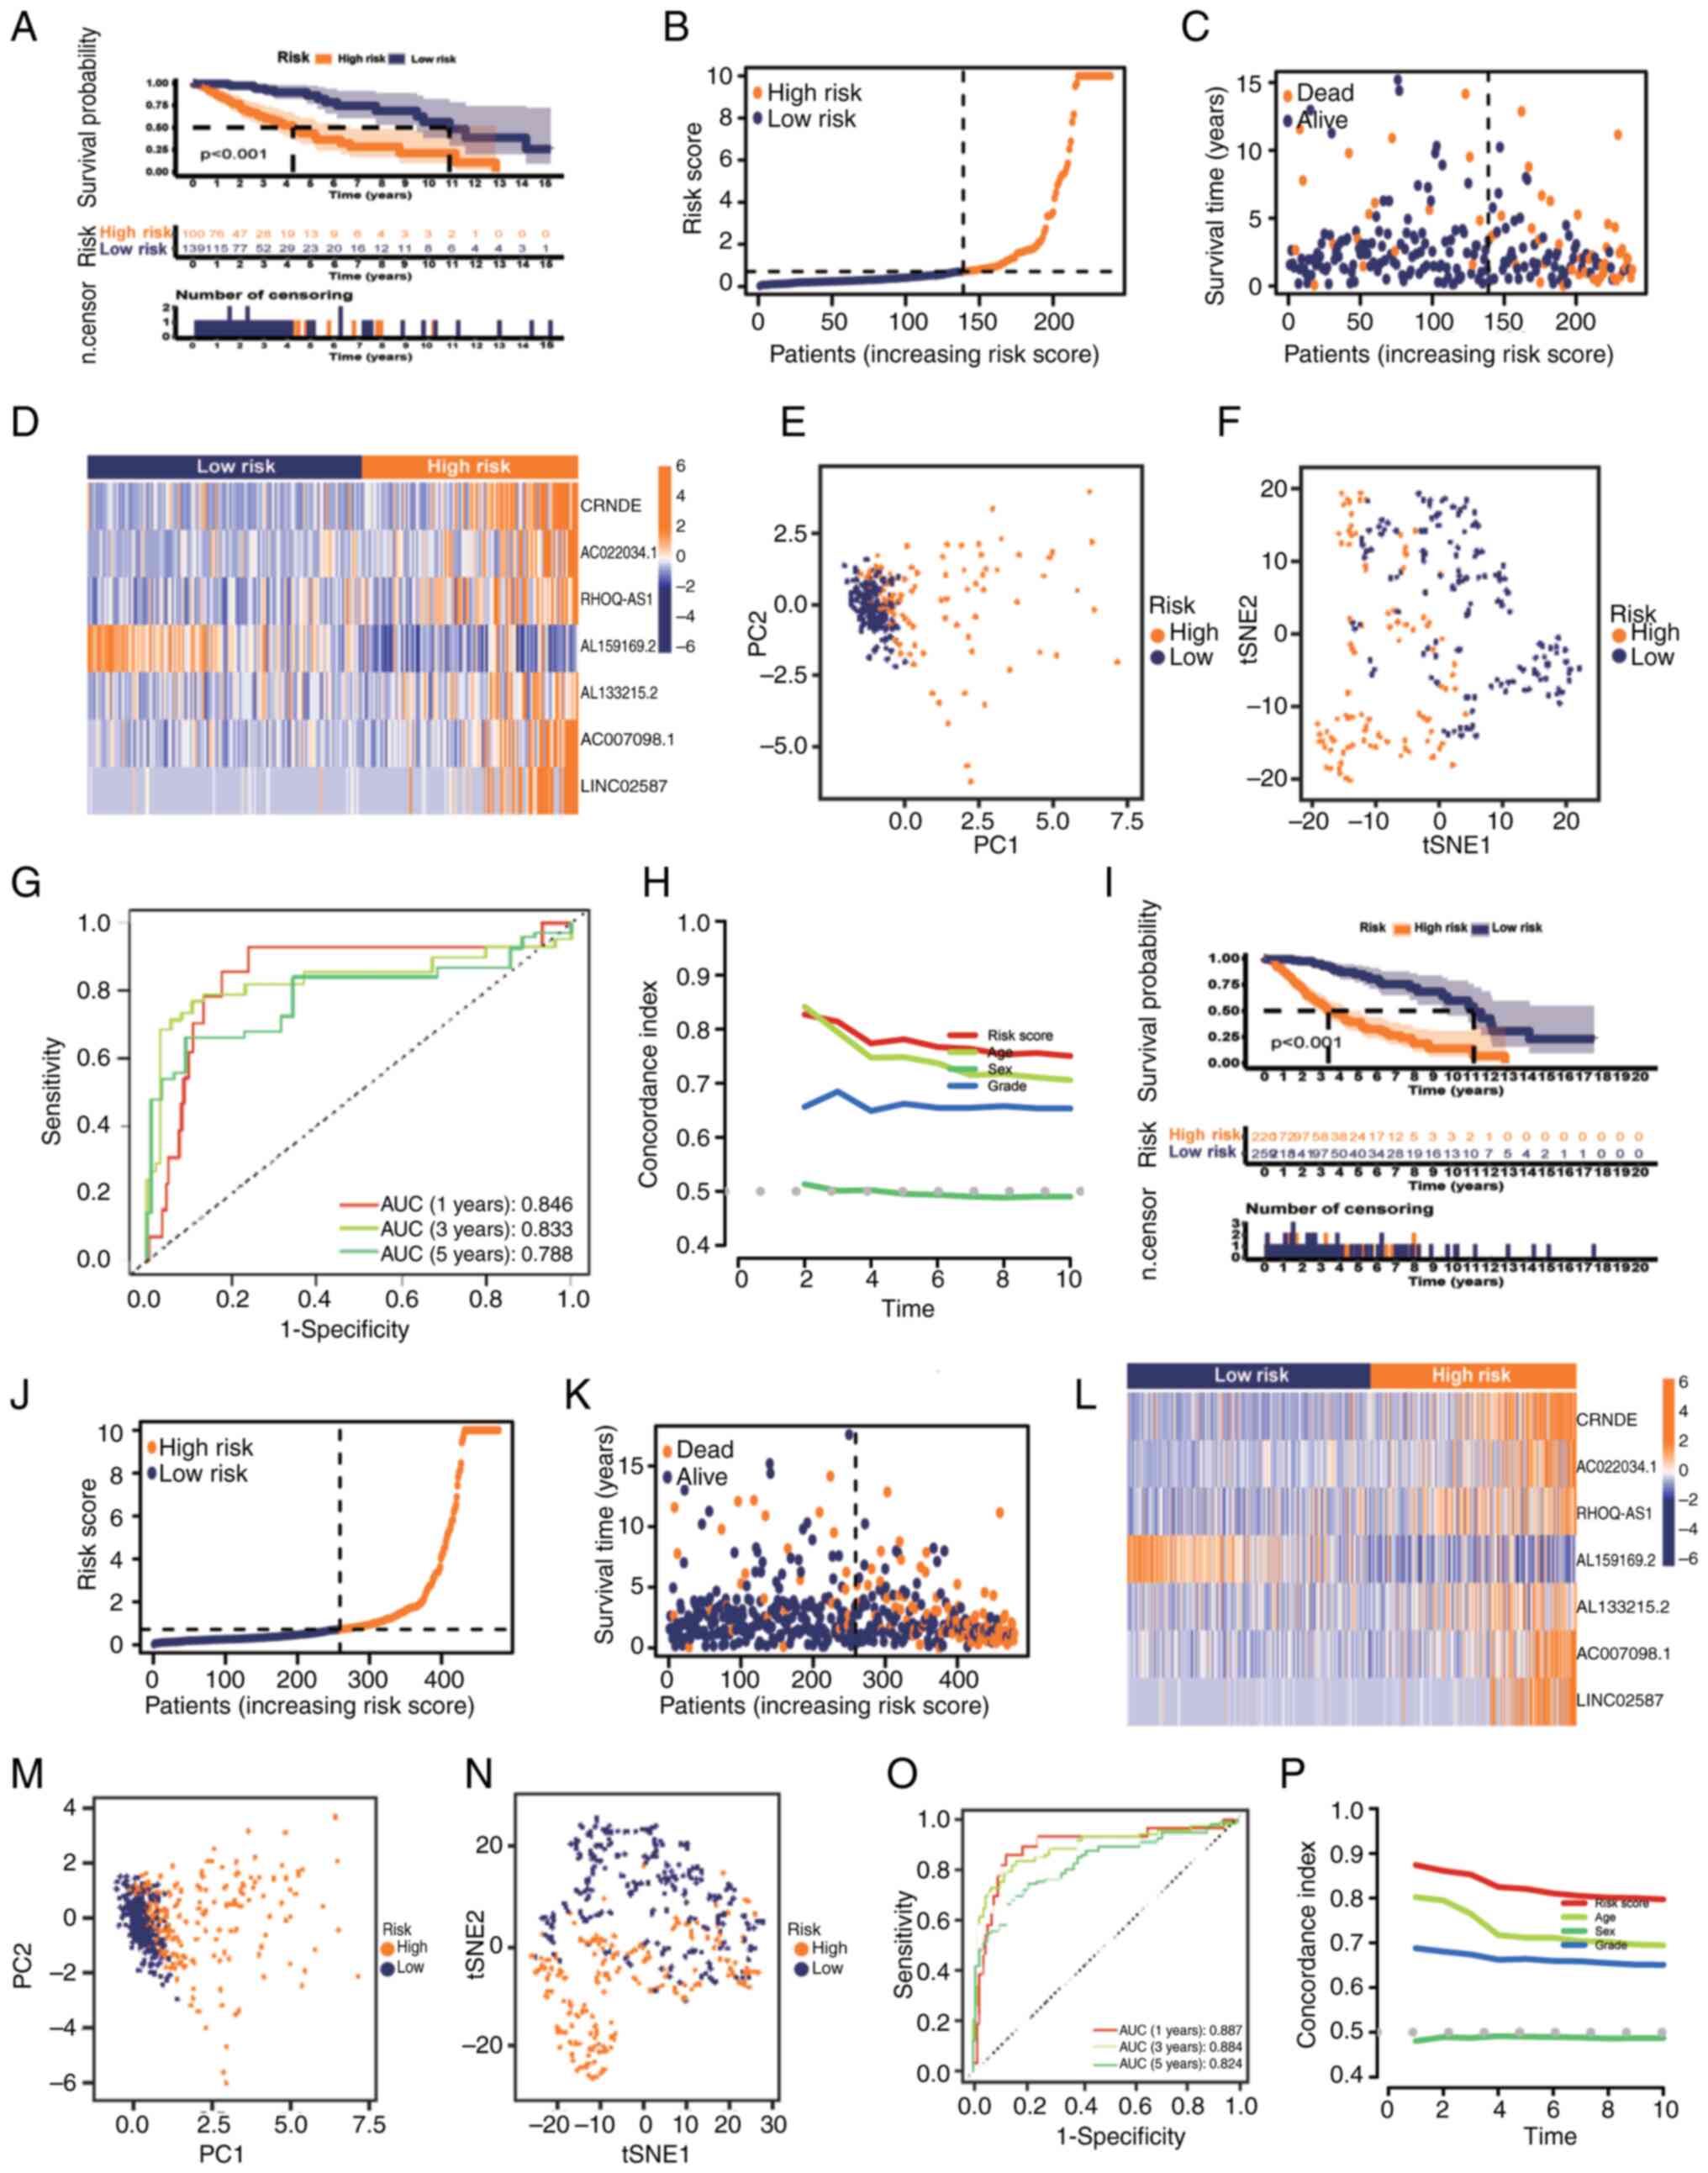 | Figure 4.Prognostic value of the risk model of
the seven glycolysis-related lncRNAs in the testing and entire
sets. (A) K-M analysis results, (B) distribution of risk scores,
(C) survival status and survival time patterns, (D) relative
expression levels of seven hub lncRNAs, (E) PCA results, (F) tSNE
results, (G) ROC curves for 1-, 3- and 5-year OS using the risk
model, and (H) C-index analysis based on the testing set. (I) K-M
analysis results, (J) distribution of risk scores, (K) survival
status and survival time patterns, (L) relative expression levels
of seven hub lncRNAs, (M) PCA results, (N) tSNE results, (O) ROC
curves for 1-, 3- and 5-year OS using the risk model and (P)
Concordance index analysis based on the entire set. AUC, area under
the curve; K-M, Kaplan-Meier; lncRNA, long non-coding RNA; OS,
overall survival; PC, principal component; PCA, principal component
analysis; ROC, receiver operating characteristic; tSNE,
t-distributed stochastic neighbor embedding. |
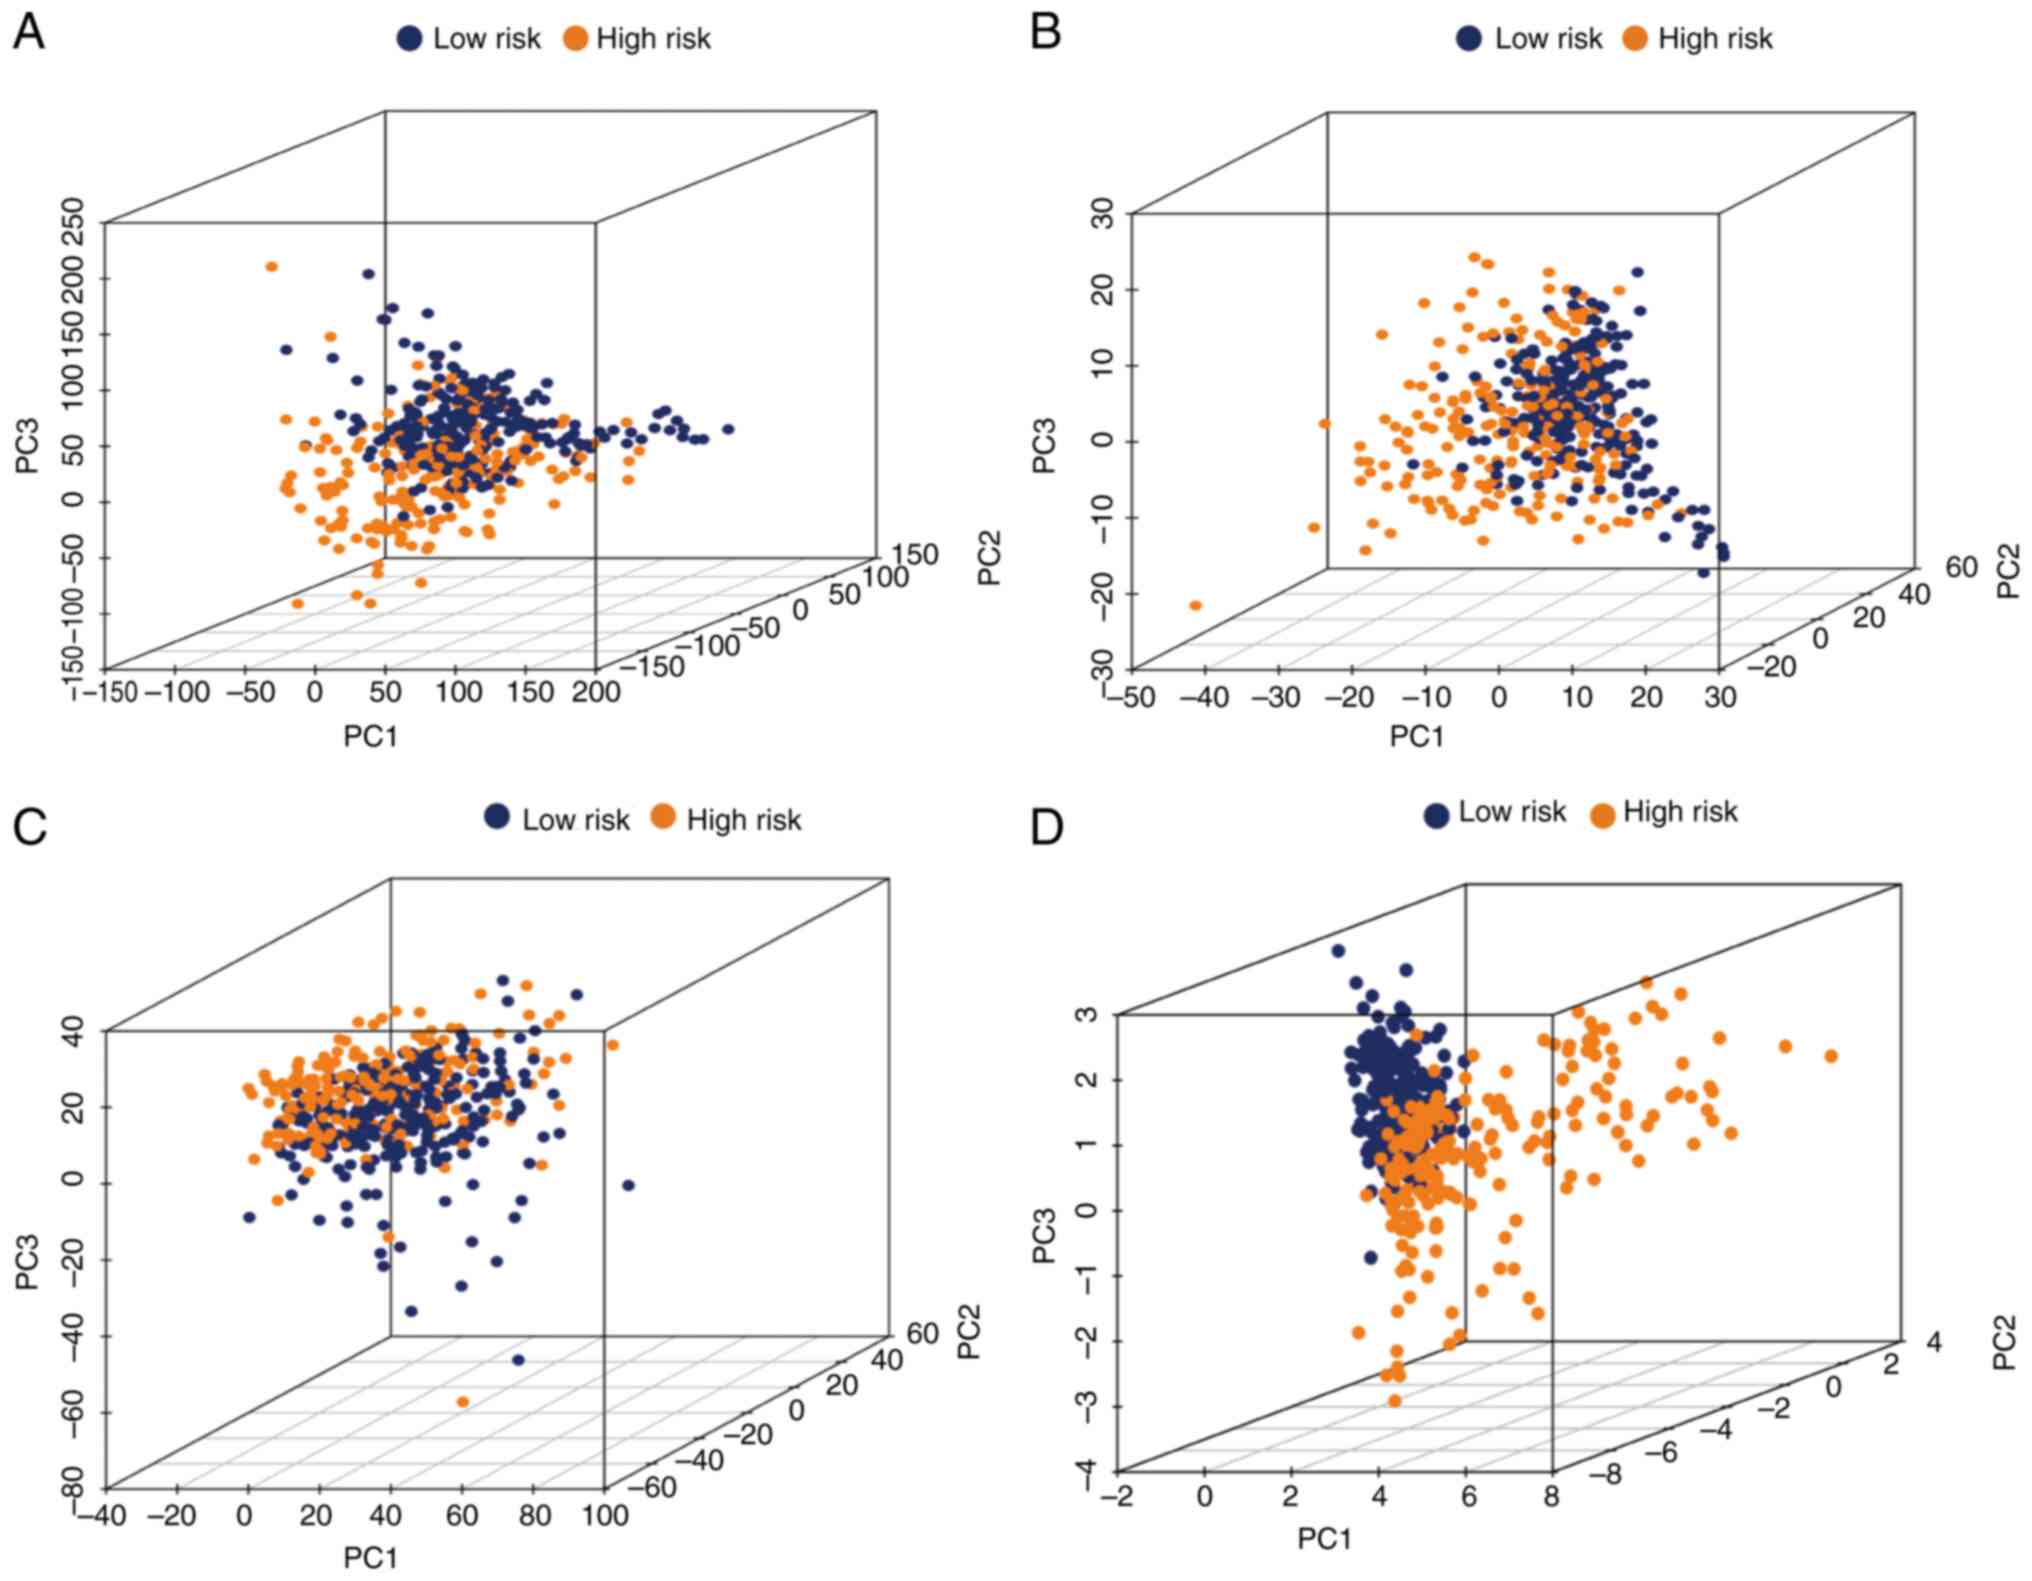
PCA
To further estimate the distribution of the two
groups, PCA was conducted using the whole gene expression profile,
243 glycolytic gene profiles, 1,889 glycolysis-related lncRNAs and
the risk model (Fig. 5A-D). This
risk model clearly indicated that patients with grade II–III glioma
could be correctly classified by the metabolism of glycolysis
between the two groups.
Independence of prognostic signature
and construction of the nomogram
The next step was to verify the accuracy of the
model based on seven lncRNAs associated with glycolysis for
independent prediction of prognosis in grade II–III glioma. This
was performed using univariate and multivariate Cox regression
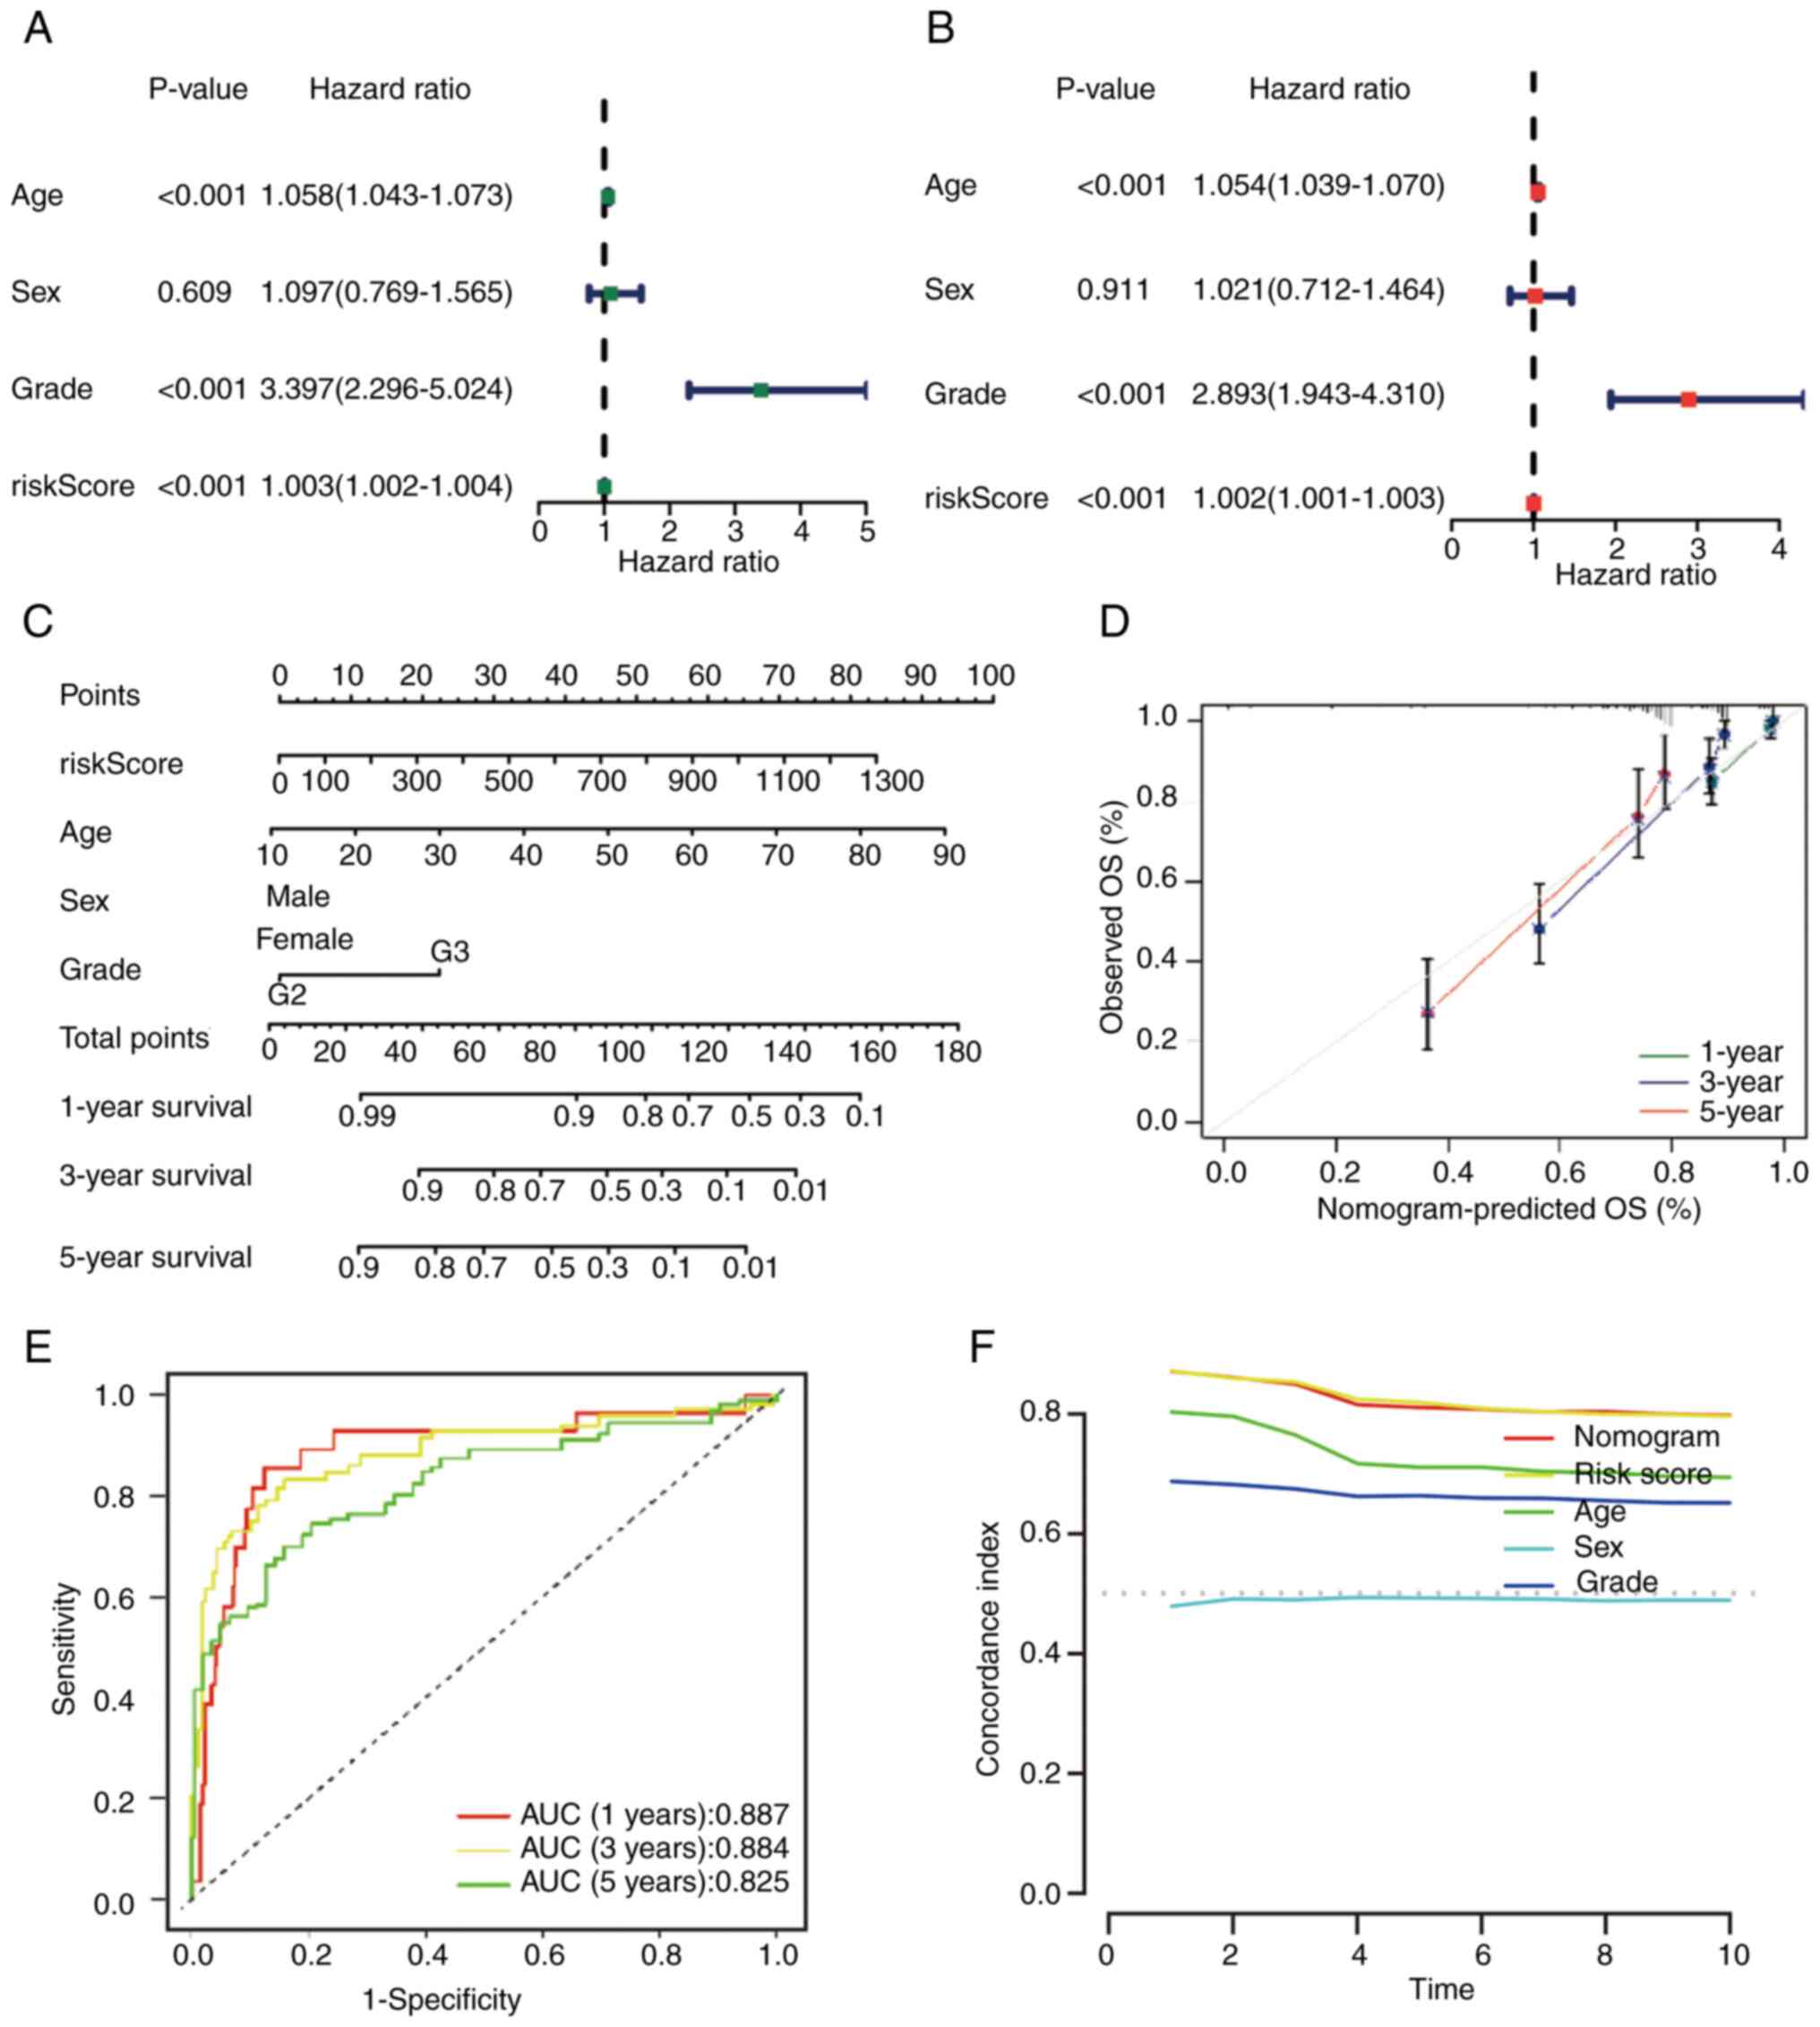
analysis. The results of univariate regression analysis [hazard
ratio (HR), 1.003; 95% CI, 1.002–1.004; P<0.001] indicated that
the model could accurately predict the prognosis of patients, and
multivariate regression analysis (HR, 1.002; 95% CI, 1.001–1.003;
P<0.001) also revealed similar results (Fig. 6A and B). In summary, the risk model
was an independent prognostic factor for grade II–III glioma. A
nomogram was constructed by combining multiple clinical factors
with the constructed risk score to predict the survival rates of
patients with grade II–III glioma (38) (Fig.
6C). Subsequently, the reliability of the nomogram was
verified, and the results demonstrated that the actual observed
value was similar to the predicted value (Fig. 6D). Additionally, the AUC values for
the OS rate at each time point were 0.887, 0.884 and 0.825,
respectively (Fig. 6E). Compared
with the C-index of other clinical features, the nomogram and risk
score had higher values (Fig.
6F).
Evaluation of the tumor
microenvironment (TME)
In view of the extensive research on the TME in the
evaluation and treatment of grade II–III glioma, a number of immune
assessment methods were applied to determine the difference in the
degree of immune infiltration between the two subgroups. First,
some basic scores of patients with grade II–III glioma were
analyzed using the ESTIMATE algorithm. The results of this
indicated that with the increase of the risk level of patients with
grade II–III glioma, the immune, stromal and ESTIMATE scores also
increased (Fig. 7A-C). Using gene
set variation analysis, it was revealed that high-risk grade II–III
glioma was related to the change of some immune functions such as
‘cytolytic_activity’, ‘inflammation-promoting’ and ‘CCR’ (Fig. 7D). Subsequently, the categories and
proportions of immune cells were analyzed using the CIBERSORT
algorithm. The distribution differences and proportion changes of
immune cells in the two groups were analyzed (Fig. 7E and F). Additionally, which immune
cells were more common in high-risk populations was summarized
(Fig. 7G. Finally, the immune cell
infiltration of patients with grade II–III glioma in different risk
groups was studied using the ssGSEA algorithm. The results
indicated that the number of immune cell subsets in the high-risk
group was higher (Fig. 7H).
Additionally, some important immune functions were significantly
upregulated in the high-risk group (Fig. 7I). In summary, it could be seen that
patients with grade II–III glioma in the high- and low-risk groups
had distinct immune infiltration differences, which may lead to
differences in prognosis between the two groups.
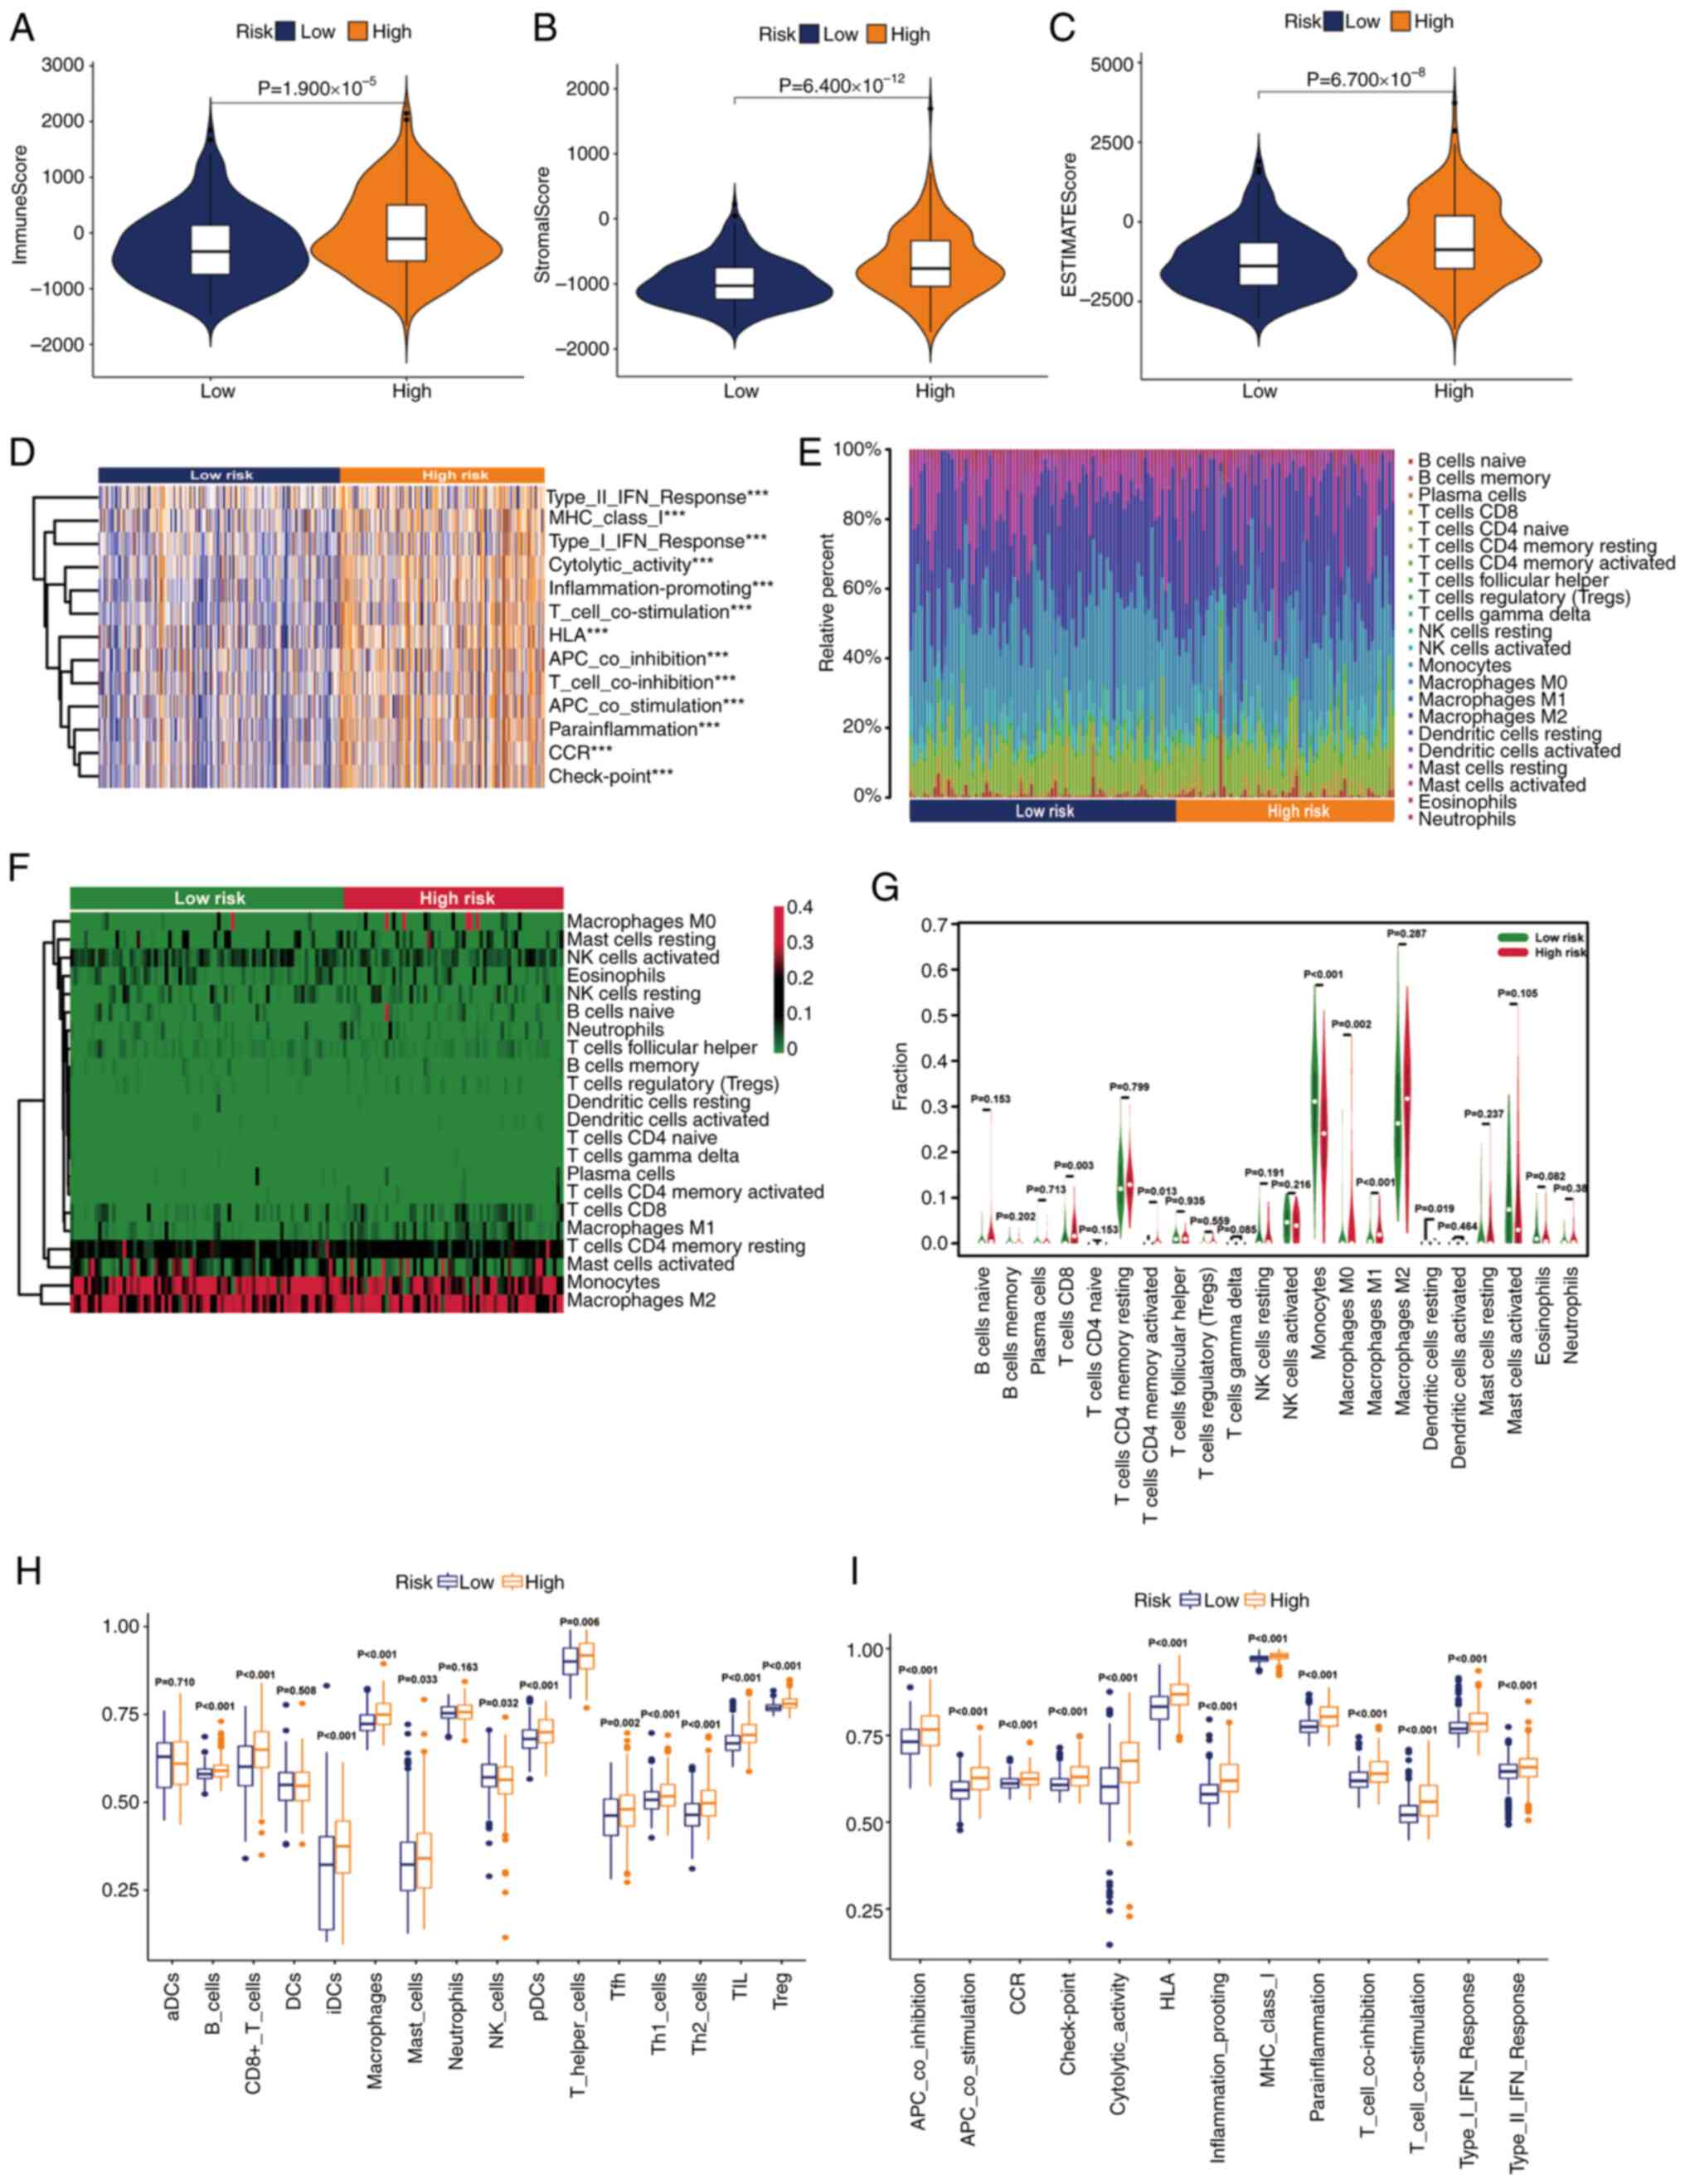 | Figure 7.Stratification analysis of the risk
score in immune features. Differences in the (A) immune score, (B)
stromal score and (C) ESTIMATE score. (D) Gene set variation
analysis of immune-related pathways in the two groups. (Expression
features of 22 immune cells in a (E) box plot, (F) heatmap and (G)
violin plot based on the CIBERSORT algorithm. Differences in the
(H) immune cells and (I) immune functions based on the single
sample Gene Set Enrichment Analysis algorithm (***P<0.001). ns,
not significant; aDC, activated dendritic cell; APC, adenomatous
polyposis coli; CCR, chemokine receptor; DC, dendritic cell; HLA,
human leukocyte antigen; iDC, immature dendritic cell; MHC, major
histocompatibility complex; NK, natural killer; pDC, plasmacytoid
dendritic cell; Tfh, T follicular helper cell; Th1, type 1 T
helper; Th2, type 2 T helper; TIL, tumor-infiltrating lymphocyte;
Treg, regulatory T cell. |
Analysis of somatic mutation
landscape
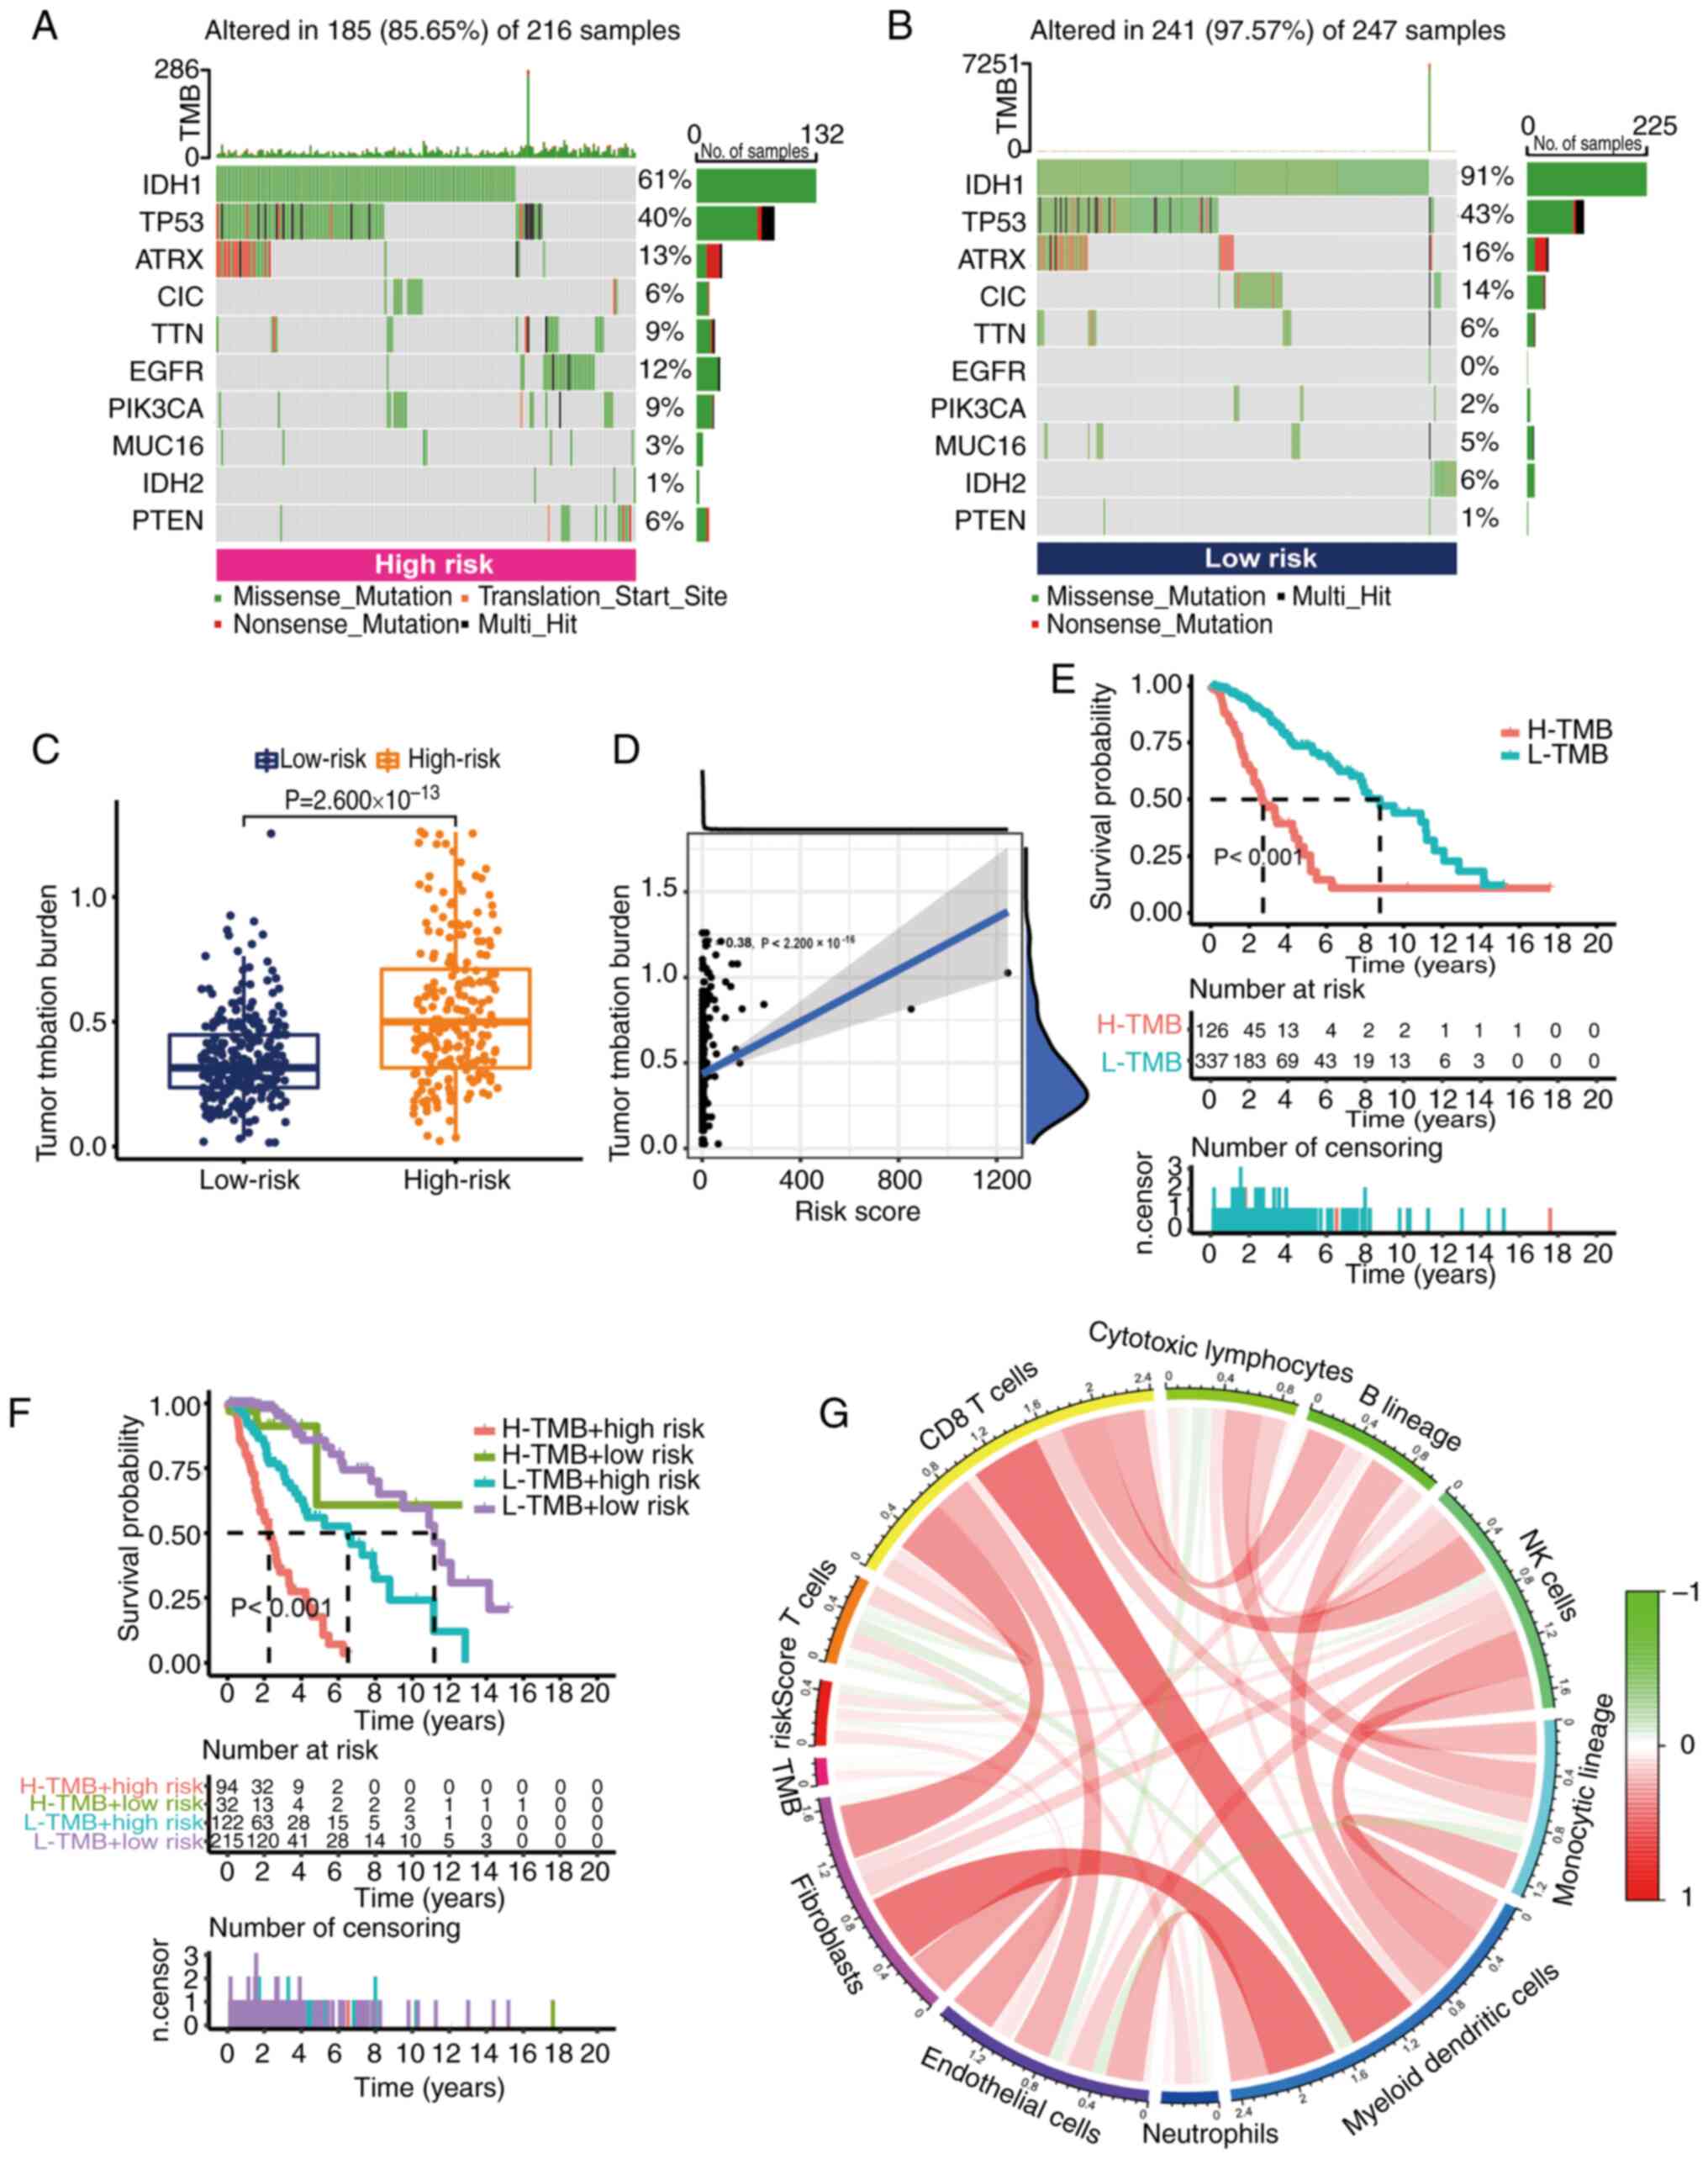
TMB is a molecular marker that is used to quantify
the mutations that tumor cells take as part of immunotherapy. It
can evaluate whether immunotherapy is effective. The present study
further explored the somatic mutation rate in the high- and
low-risk groups. The results demonstrated that the mutation rate of
the low-risk group [241 cases (97.57%) in 247 samples] appeared to
be higher than that of the high-risk group [185 cases (85.65%) in
216 samples]. The top-ranked driver mutant genes are shown in
Fig. 8A and B. Further quantitative
analysis demonstrated that the TMB score was significantly
increased in the high-risk group (Fig.
8C). Additionally, a positive correlation between risk score
and TMB was demonstrated by Spearman correlation analysis.
According to the median TMB score, grade II–III glioma samples were
divided into two groups: High TMB group and low TMB group.
According to the results of K-M analysis, the OS of the high TMB
group was worse (Fig. 8E). When
both risk score and TMB were considered in the K-M analysis, the
risk score eliminated the better OS of low TMB. This suggested that
the risk score could predict the prognosis of grade II–III glioma
in a superior way than TMB (Fig.
8F). At the same time, the main immune cells associated with
TMB were CD8 T cells and natural killer cells (Fig. 8G).
Exploration of potential drugs and
assessment of immunotherapy response
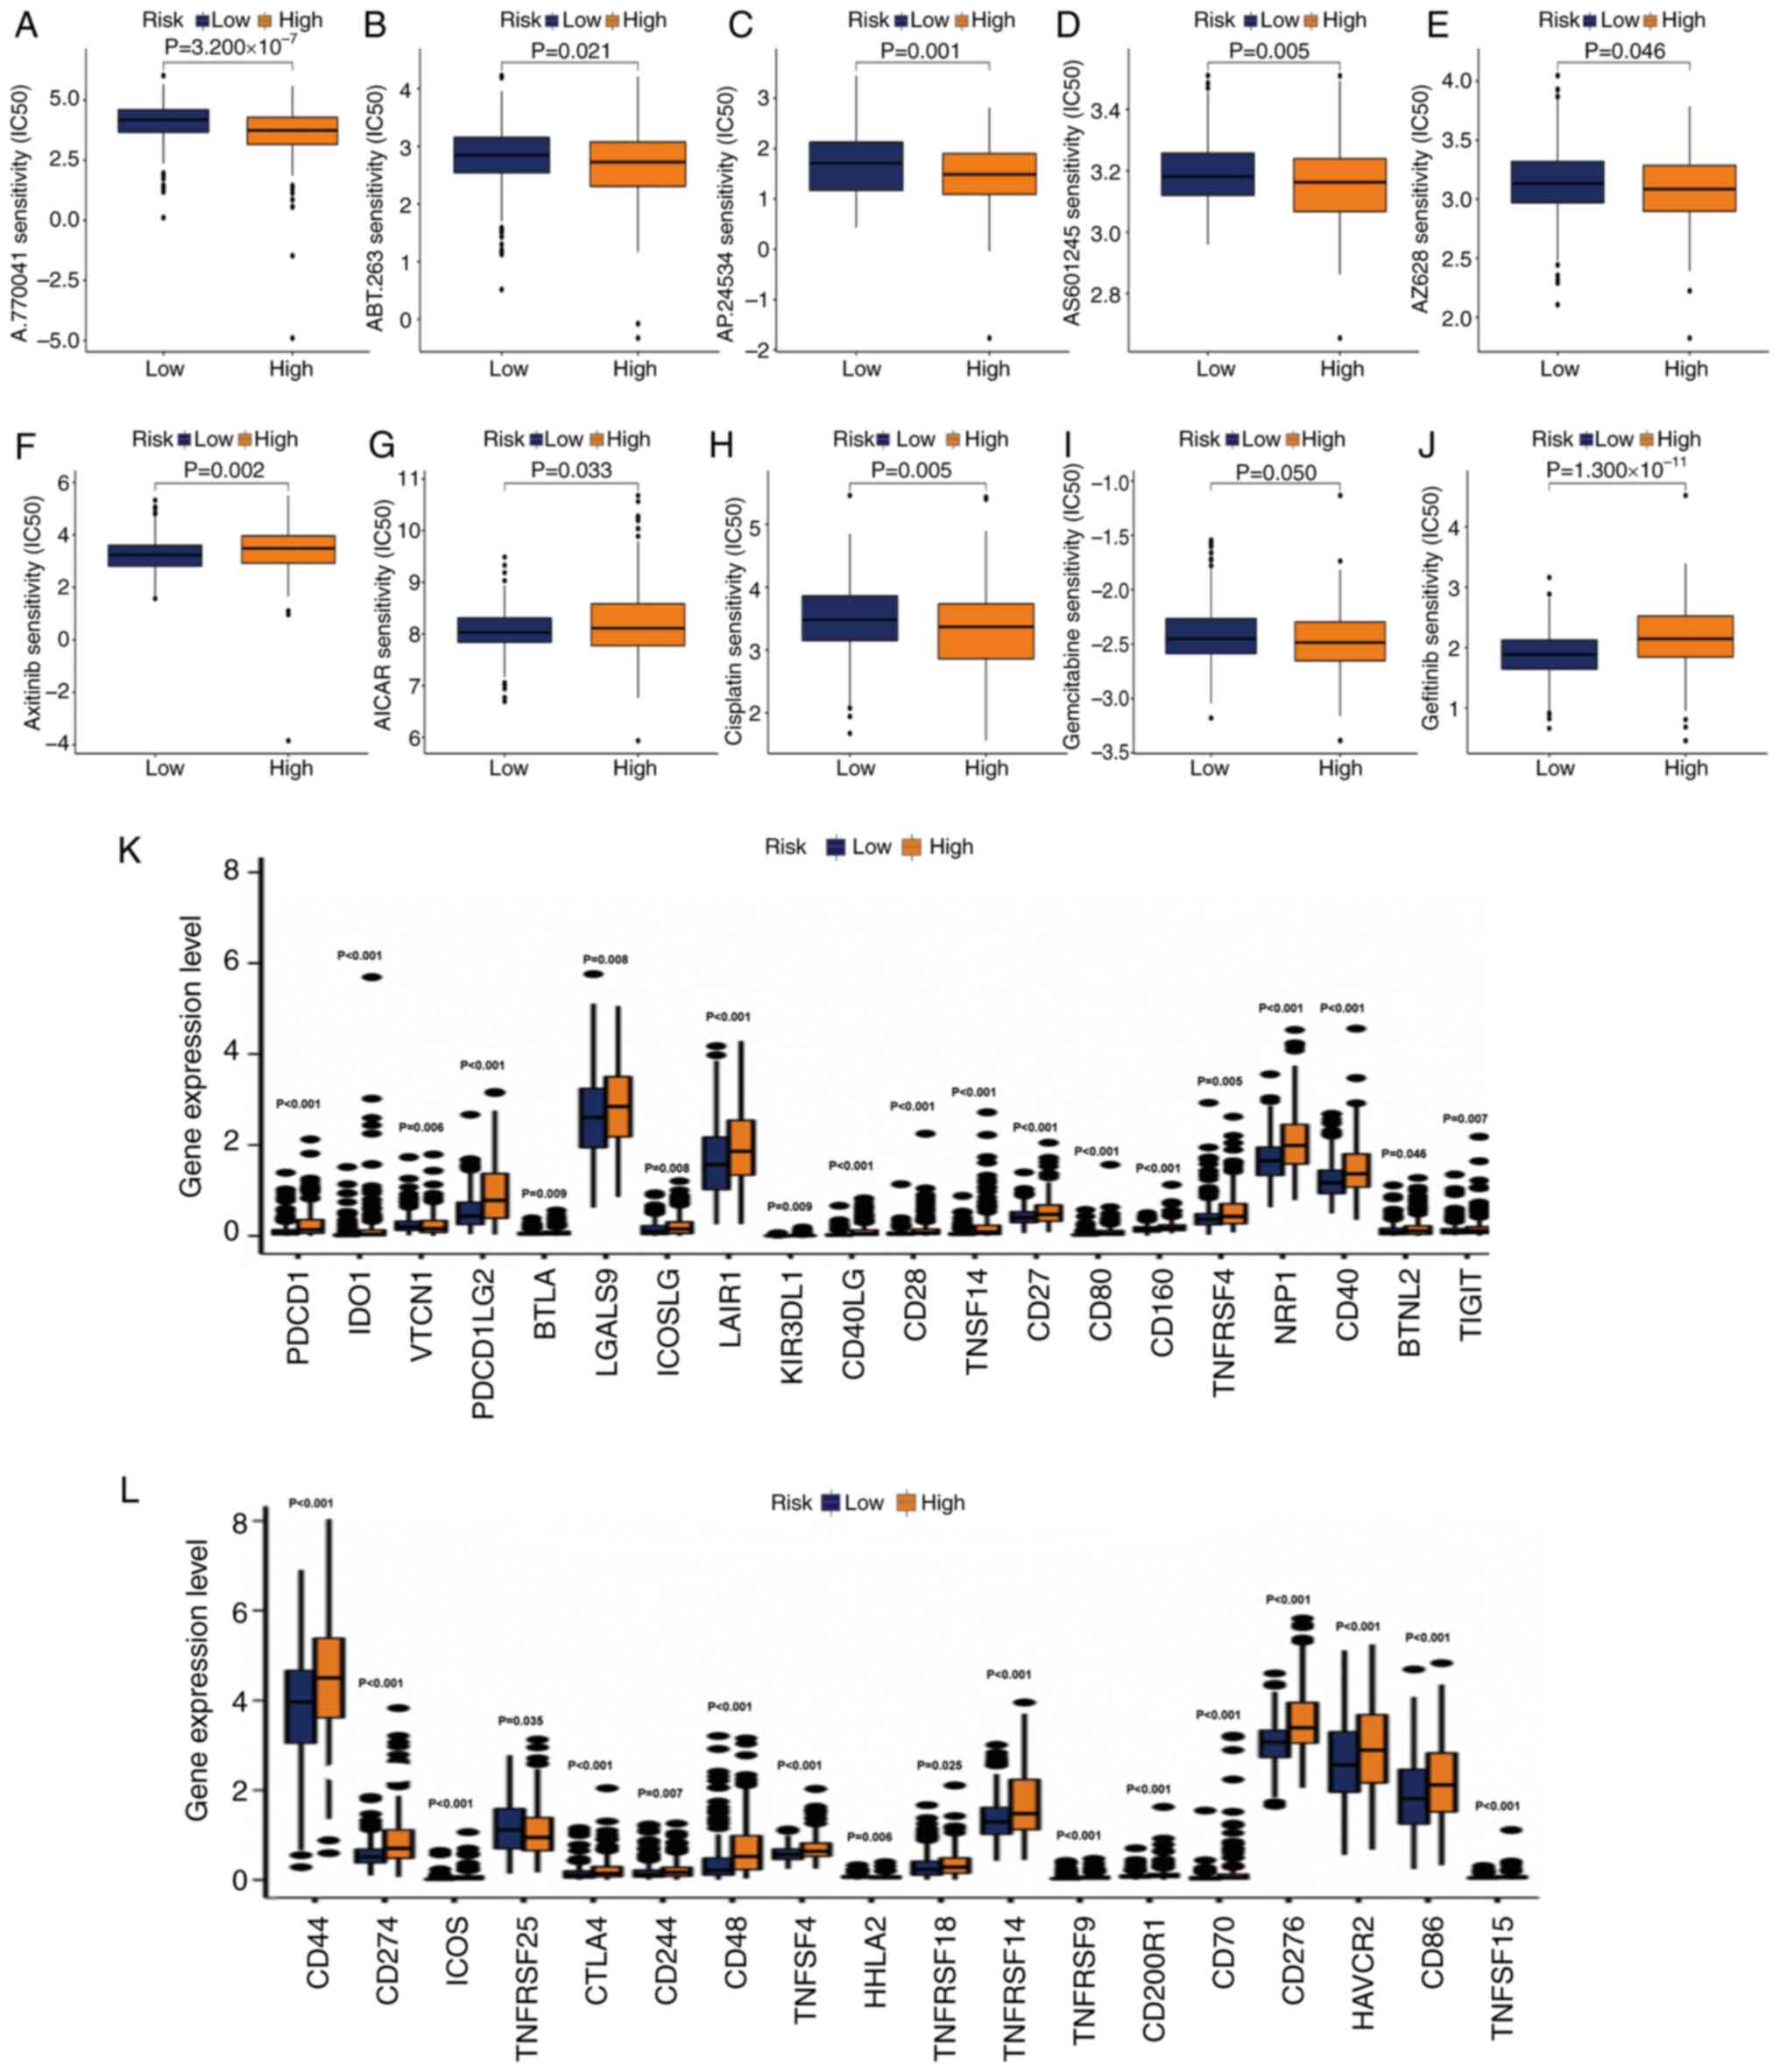
Considering the significant difference in prognosis
between the two groups of grade II–III glioma samples, some
potential drugs for precise treatment were selected. It was
hypothesized that the response to drugs may be different between
the two groups. The R package ‘pRRophetic’ was used to screen
potential drugs based on the IC50 value in the GDSC
genomics database. The IC50 estimates of A.770041,
ABT.263, AP.24534, AS601245 and AZ628 were relatively high in
low-risk samples.
This suggested that patients with grade II–III
glioma in the high-risk group may benefit from the use of these
compounds (Fig. 9A-J). The
IC50 values of axitinib and
5-aminoimidazole-4-carboxamide ribonucleotide were increased in the
high-risk group, indicating that these two drugs may be used for
the treatment of patients with grade II–III glioma in the low-risk
group (Fig. 9F and G). The
IC50 of commonly used antitumor drugs in the two groups
was determined. In the low-risk group, the IC50 of
cisplatin (Fig. 9H) and gemcitabine
(Fig. 9I) was higher. The
IC50 of gefitinib was higher in the high-risk group
(Fig. 9J), indicating that the risk
score had high accuracy in predicting the sensitivity to antitumor
drugs. Finally, it was explored whether the activation of immune
checkpoint genes was consistent in the two groups. Consistent with
our hypothesis, the activation of immune checkpoint genes in
high-risk populations was generally relatively high (Fig. 9K and L).
Functional enrichment analysis
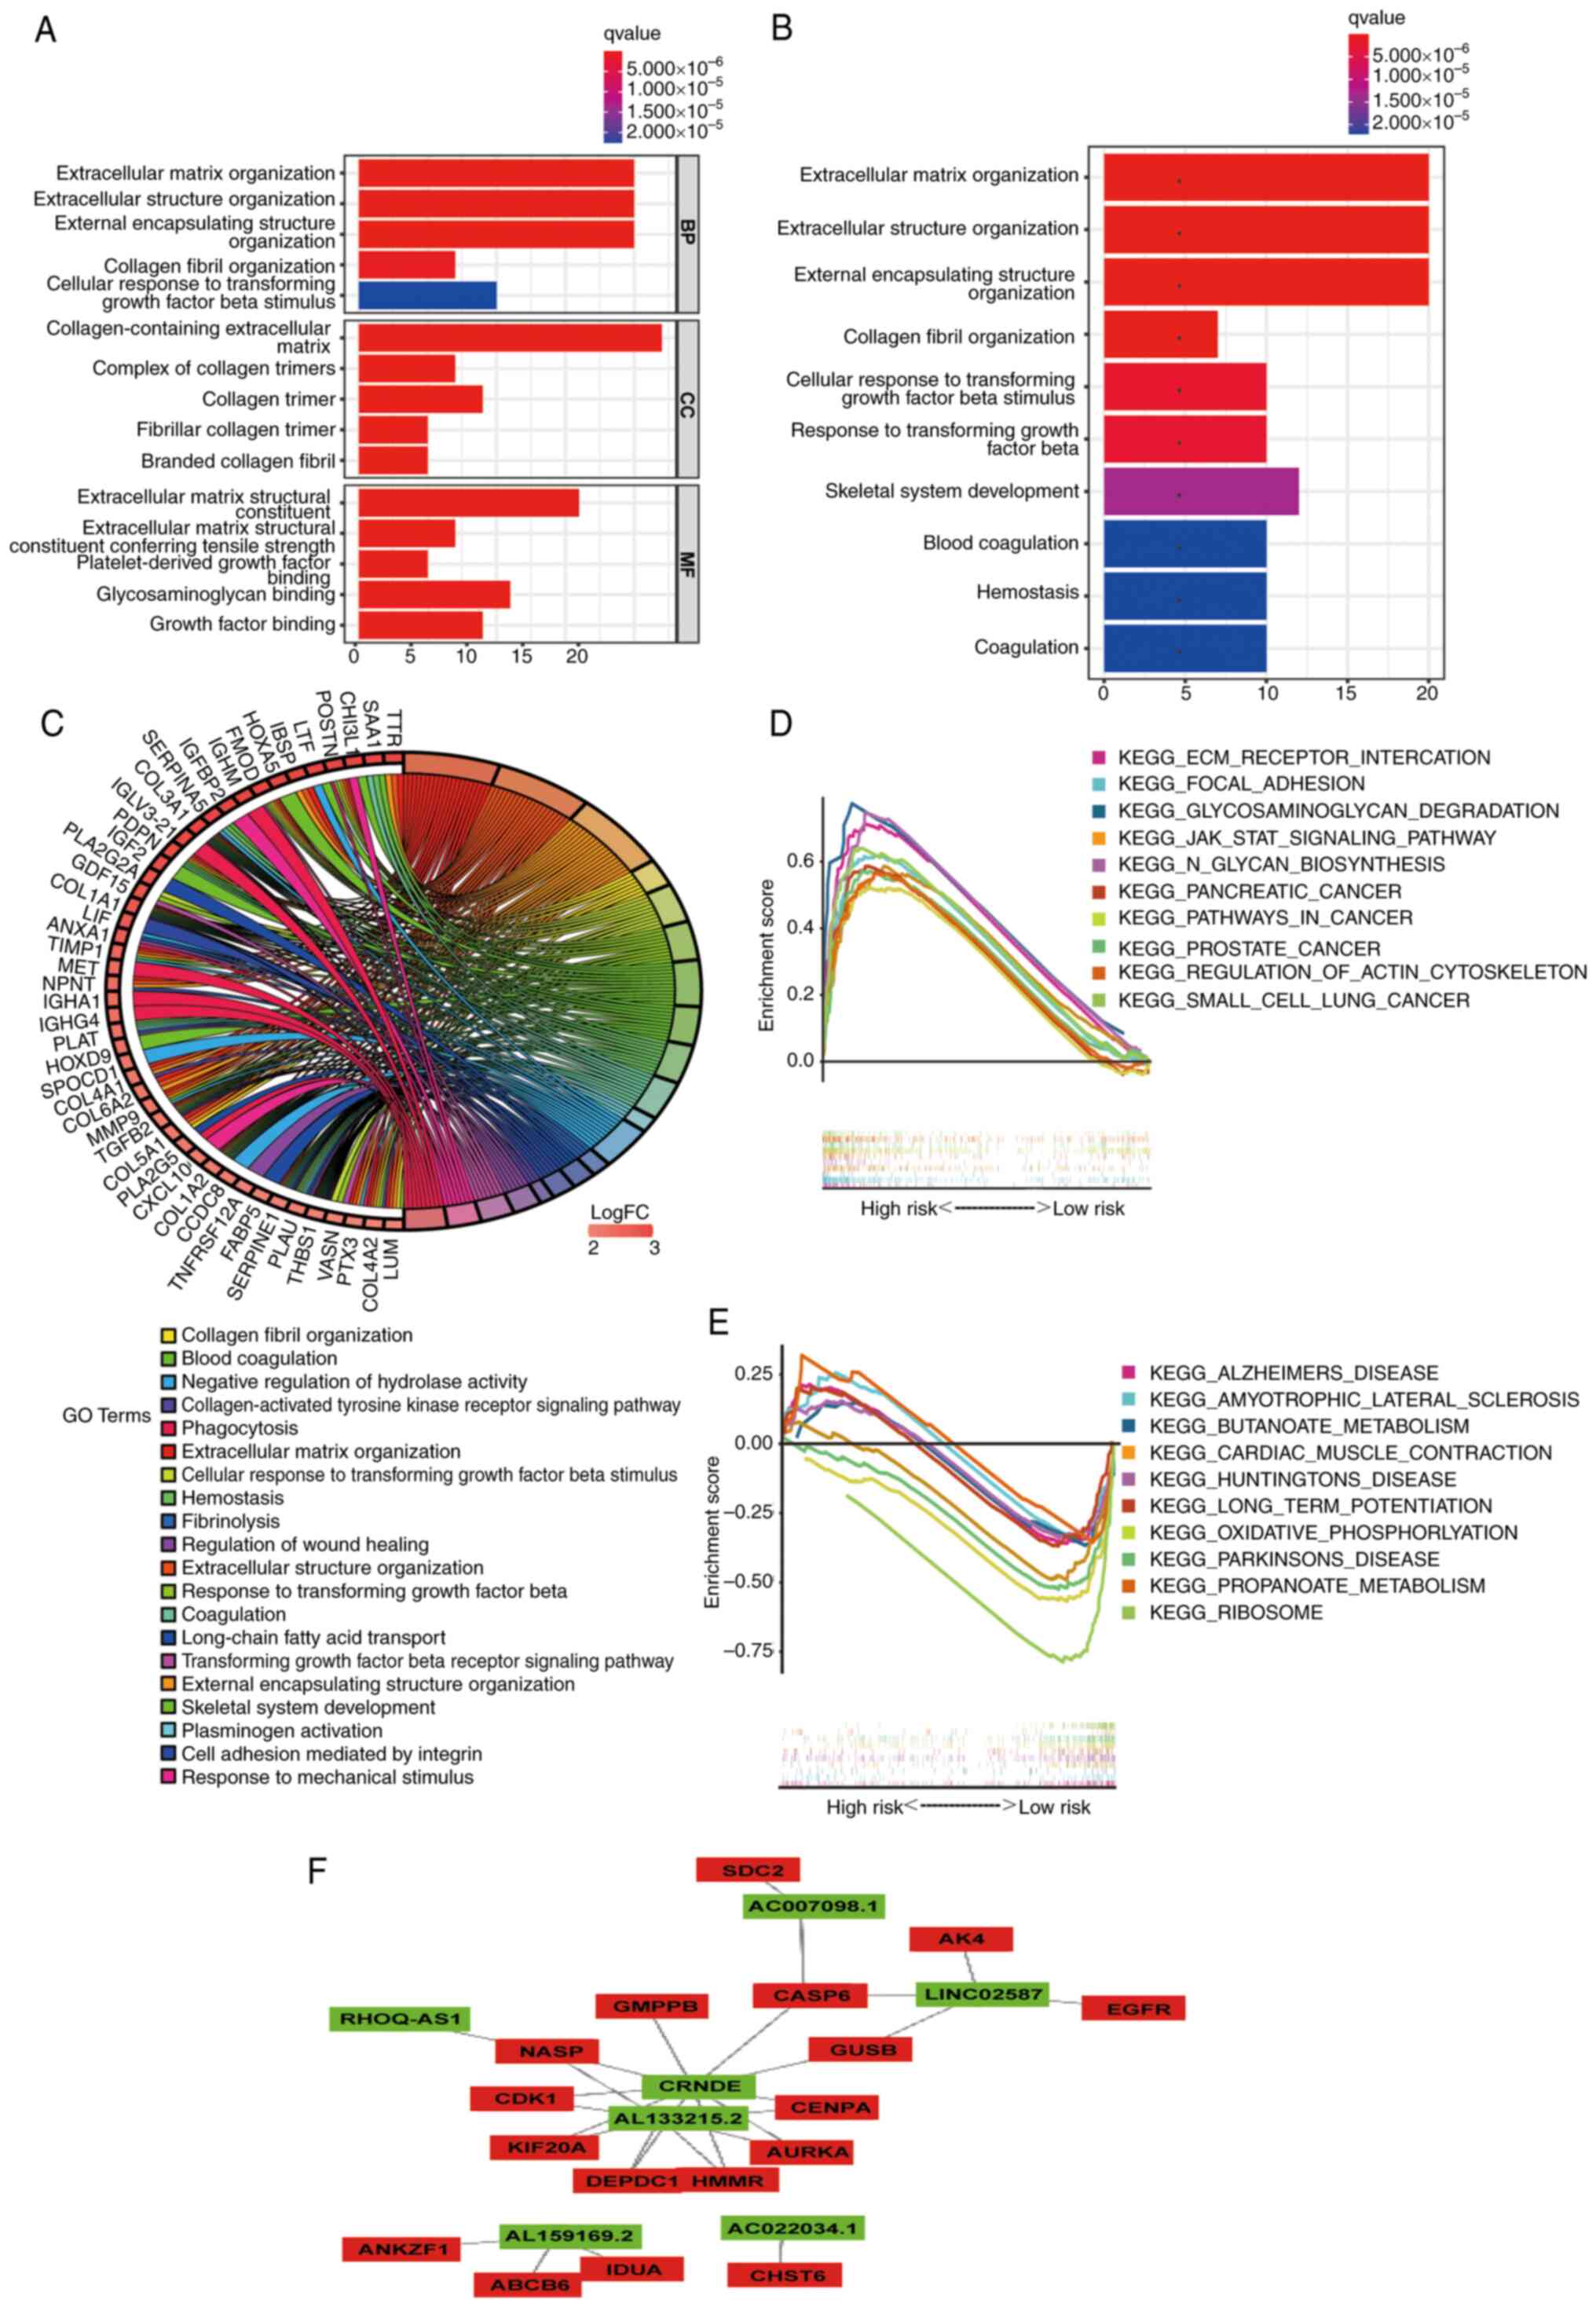
In order to examine the mechanism that leads to
significant differences between the two groups in a multi-level
analysis, Gene Ontology (GO) and KEGG analyses were performed on 89
DEGs (|log2 fold change|>2.0; P<0.05; Table SVI). According to GO analysis
(Fig. 10A; Table SVII), DEGs were mainly enriched in
tissue-related BPs. In terms of molecular functions, these DEGs
were mainly concentrated in ‘extracellular matrix structural
constituent’ and ‘glycosaminoglycan binding’. In addition, KEGG
analysis showed that the DEGs were concentrated in ‘extracellular
structure organization’ (Fig. 10B and
C; Table SVII). Subsequently,
through GSEA of KEGG, it was revealed that the pathways enriched in
the high-risk (Fig. 10D; Table SVIII) and low-risk (Fig. 10E; Table SVIII) groups were different.
Finally, a lncRNA-mRNA interaction network was constructed using
Cytoscape software (Fig. 10F). The
aforementioned results may provide some ideas regarding the
mechanism of glycolysis-related lncRNAs in grade II–III glioma
carcinogenesis.
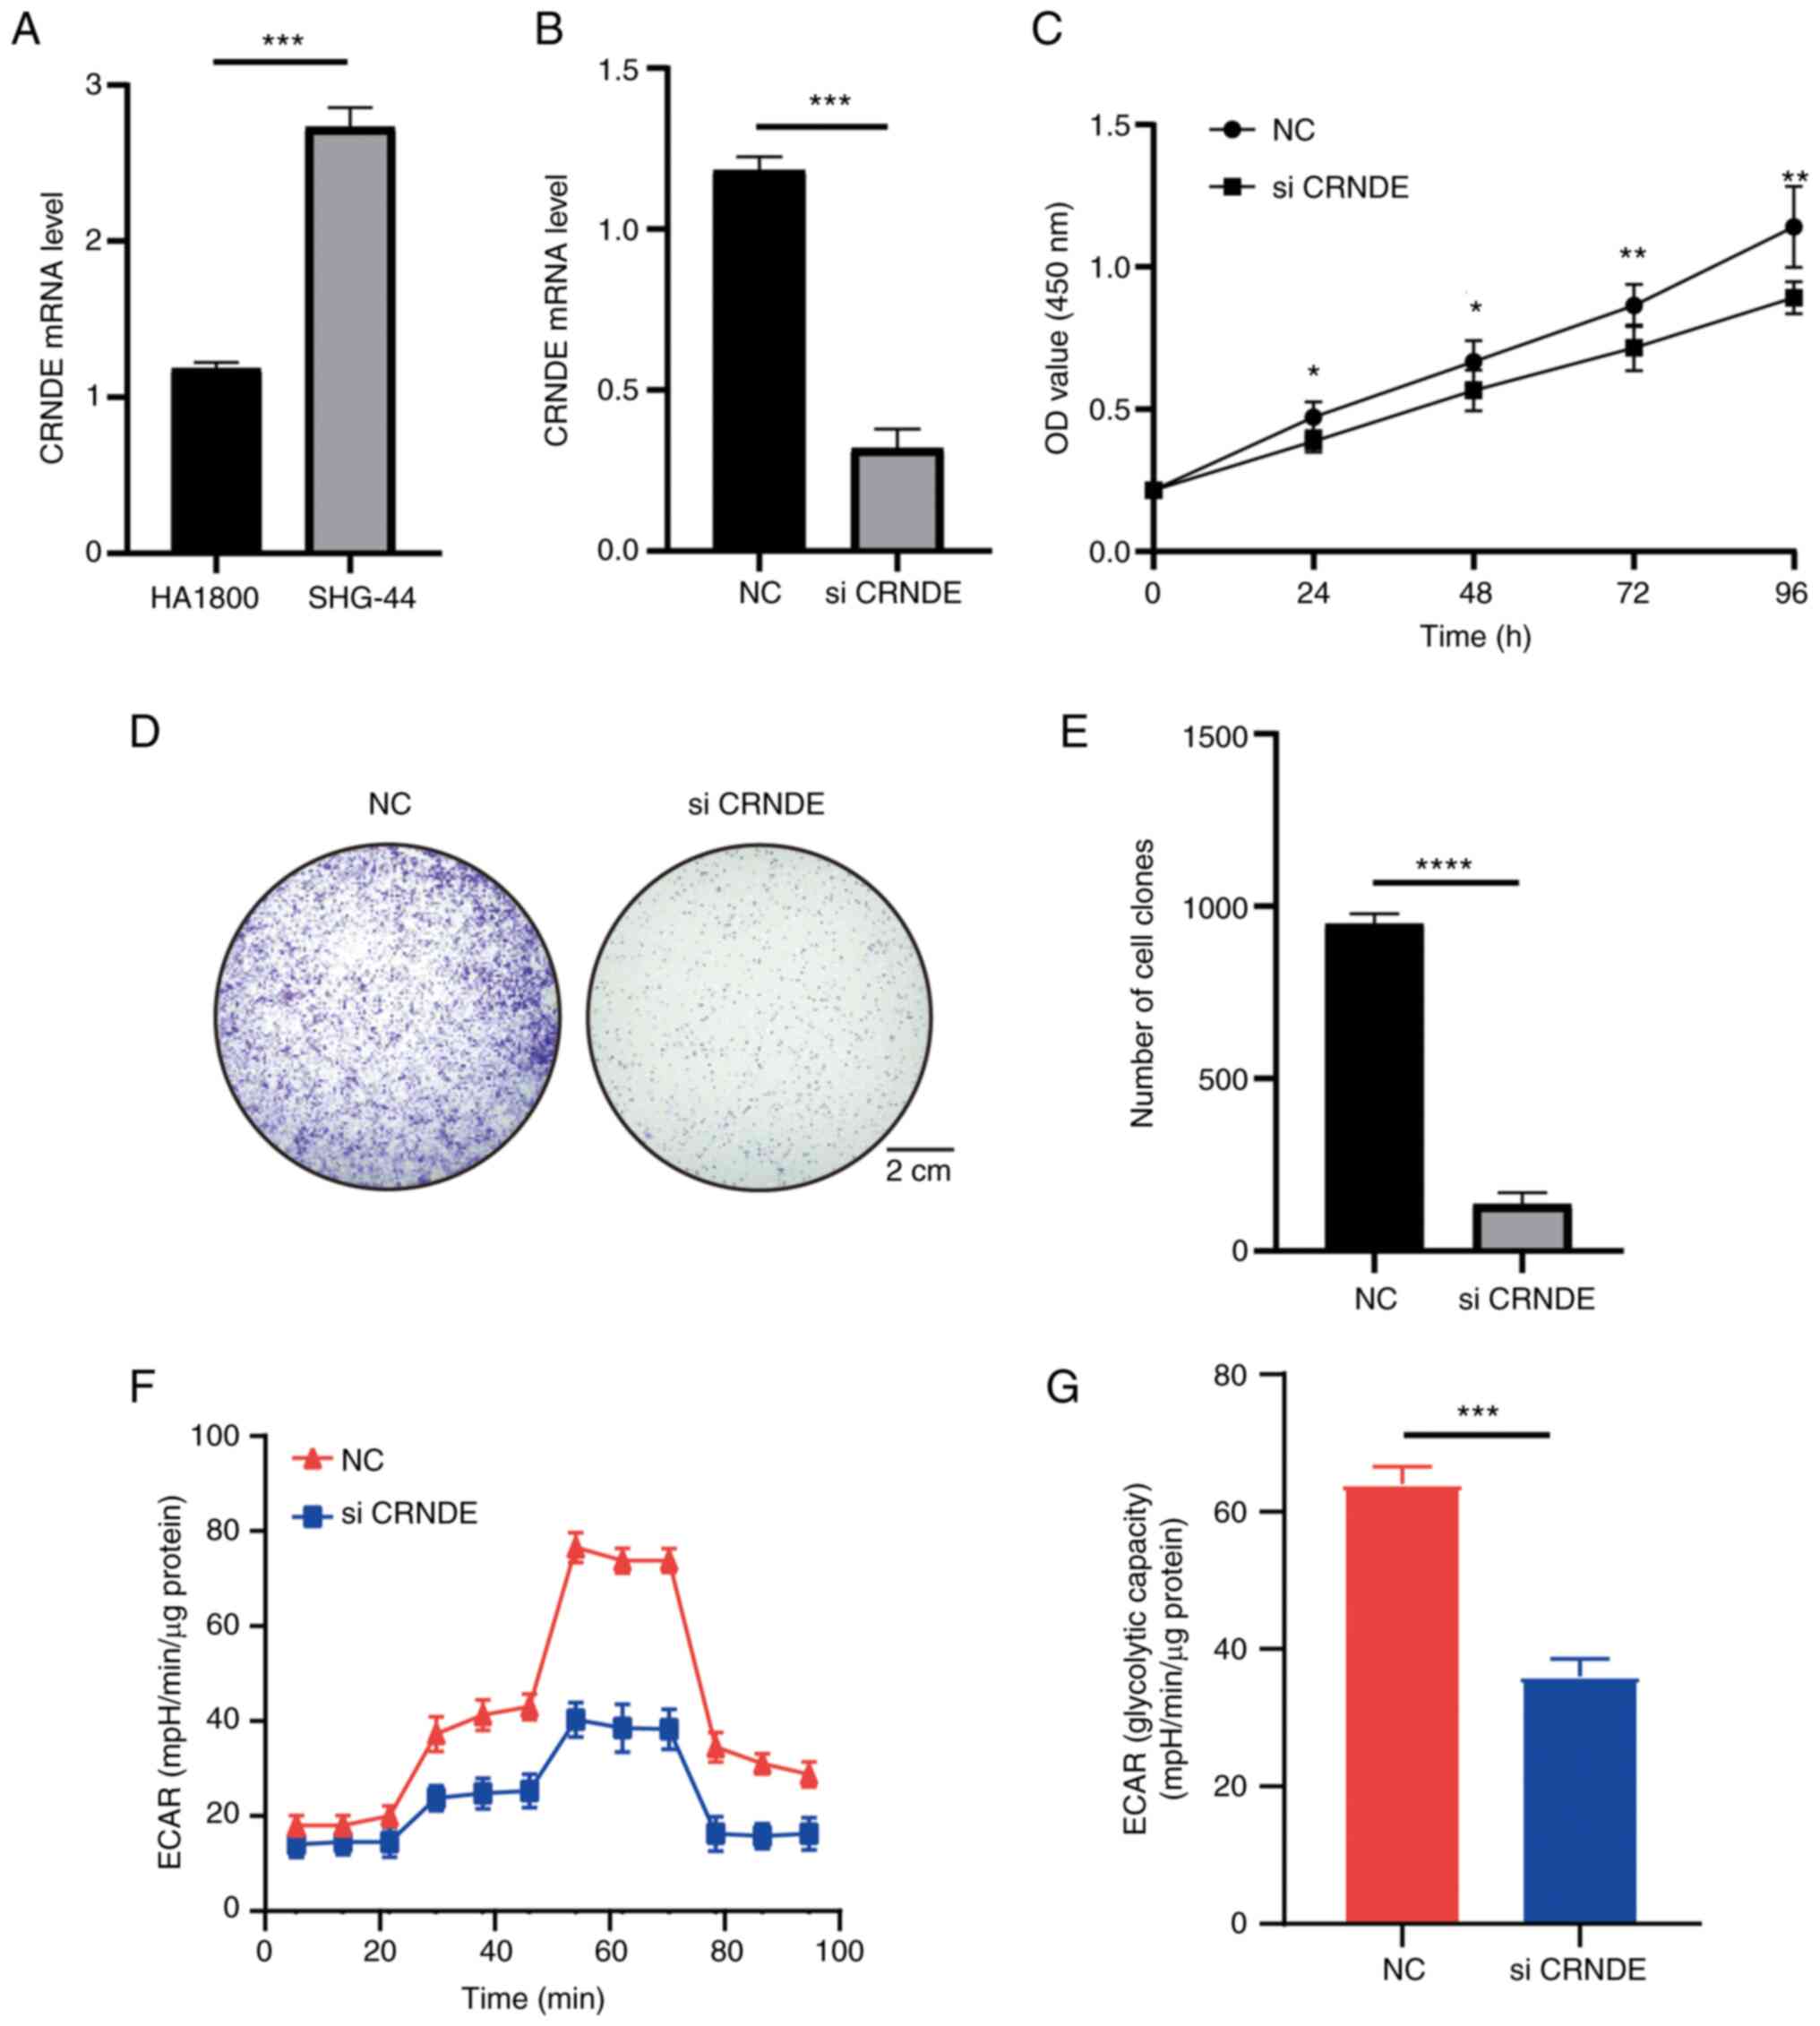
CRNDE is highly expressed in SHG-44
cells and regulates proliferation
Due to the extensive research on CRNDE, CRNDE was
chosen for validation (39,40). The high CRNDE expression in grade
II–III glioma was verified using cell lines. The experiments
revealed high CRNDE expression in SHG-44 cells compared with HA1800
cells (Fig. 11A). In addition, the
effects of CRNDE on cell functions were investigated. The function
of CRNDE in SHG-44 cells was investigated via knockdown experiments
and RT-qPCR confirmed that CRNDE was knocked down in SHG-44 cells
(Fig. 11B). The results of the
CCK-8 assay indicated that CRNDE could increase cell viability,
which was the same as the results of database analysis (Fig. 11C). The colony formation assay also
indicated that knockdown of CRNDE significantly inhibited the
proliferation of SHG-44 cells (Fig.
11D and E). In addition, the potential regulatory role of CRNDE
in glucose metabolism in grade II–III glioma was investigated using
the ECAR method. The results demonstrated that knockdown of CRNDE
reduced the ECAR and glycolysis (Fig.
11F and G). The experiments further confirmed the results of
previous analyses.
Discussion
Grade II–III glioma is rare among adult CNS tumors,
but accounts for the highest proportion of childhood CNS
neuromalignancies (41,42). Preserving isocitrate
dehydrogenase-mutated cell lines has been difficult, limited by the
high heterogeneity of low-grade glioma, and thus, there has been
little research on this tumor, early clinical diagnosis methods,
prognosis prediction and precise treatment. However, with the
deepening of research on other tumors, it has been found that
lncRNAs are multifunctional tumor regulators. For example,
LINC00473 overexpression inhibits microRNA (miR)-502-3p via the
competing endogenous RNA mechanism, upregulates the expression of
lysine methyltransferase 5A, promotes the expression of cyclin D1
and CDK2, and facilitates cell cycle progression (43,44).
In addition, research on the metabolic processes of tumor cells has
also gained increasing attention. Among them, glucose metabolism,
as a key process of biological energy metabolism, has been widely
studied in the regulation of tumor progression (45,46).
These frontier hotspots in tumor research were also the starting
point of the present study.
The present study used univariate/multivariate Cox
regression analysis and LASSO regression analysis to identify seven
lncRNAs (CRNDE, AC022034.1, RHOQ-AS1, AL159169.2, AL133215.2,
AC007098.1 and LINC02587). Among these lncRNAs, CRNDE has been
extensively studied (39,47). In previous studies, CRNDE has been
considered to be an important oncogenic lncRNA and Han et al
(48) pointed out in 2017 that this
lncRNA could cross-act with miR-181a-5p and ultimately regulate
colon cancer cells through the Wnt signaling pathway proliferation
and increase its drug resistance. A similar study by Zhang et
al (49) also indicated that
CRNDE could mediate the resistance of gastric cancer cells to
5-FU/oxaliplatin by altering the apoptosis process of gastric
cancer cells by regulating alternative splicing events. Notably,
CRNDE is a confirmed oncogenic lncRNA that is upregulated in
gliomas and studies have also confirmed that knocking down the
expression of this lncRNA can help improve the drug resistance of
gliomas (50,51). Although the mechanism of this lncRNA
in the process of glycolysis is still unclear, a number of studies
have indicated that the process of glycolysis is directly related
to the proliferation, migration and apoptosis of tumor cells, which
is consistent with the role of CRNDE in other studies and which
also confirms the way the lncRNA may function (52,53).
The present study verified the levels of CRNDE not only using
bioinformatics analysis but also using RT-qPCR. The present study
demonstrated that CRNDE could significantly increase SHG-44 cell
viability and proliferation. There are fewer studies on AC022034.1
and AC007098.1. Wang et al (54,55)
used bioinformatics analysis to identify four key lncRNAs involved
in the regulation of the TME in colon cancer and pointed out that
the lncRNA was also involved in the immune process of this cancer.
There are no corresponding research reports for the remaining four
lncRNAs, which may be novel directions for future research. To the
best of the authors' knowledge, the present study was the first to
report that the HR of RHOQ-AS1 suggested that the risk value of
RHOQ-AS1 was particularly high and further exploration needs to be
continued to improve the related research in the future. A number
of studies have shown that the abnormal glycolytic process of cells
can cause changes in the composition and biological properties of
the TME (56,57). Therefore, a similar exploration was
also carried out in the present study. The degree of infiltration
of various T cell subtypes increased significantly as the risk
increased. A major study by Peng et al (58) in 2016 revealed that glycolysis (the
Warburg effect) promoted the maturation and activation of T cells
(especially type 1 T helper cells) and in this activation process,
IFN-γ (type II–IFN) served a key role, which is consistent with the
present results. A comprehensive study by D'Angelo et al
(59) indicated that ~50% of
patients with grade II–III glioma exhibited enhanced T lymphocyte
infiltration. A study by Guo et al (60) revealed that CD8+ T cells
activated and released chemokine ccl4 in grade II–III glioma and
produced a cascade effect that led to further release of chemokine
ccl5 from microglia, which ultimately promoted the progression of
grade II–III glioma. Combined with the results of the present
analysis, it can be inferred that the higher the degree of
infiltration of the T cell population, the more improved the
prognosis of the patients. External validation of model
effectiveness is an important part of evaluating model
generalization ability and practical application potential. The
present study attempted to externally validate the model in three
CGGA datasets (CGGA301, CGGA325 and CGGA693). Unfortunately, it was
not possible to retrieve all the lncRNAs involved in the model in
the above three data sets, so external verification could not be
performed for at present. This may be due to the large differences
in the detection of lncRNA in different sequencing batches. This
suggests that it is necessary to conduct a sufficient depth of
lncRNA sequencing for patient samples during the clinical
transformation of the model.
Functional enrichment analysis suggested that
extracellular matrix-related pathways were significantly altered in
patients with grade II–III glioma. The latest study by Tao et
al (61) indicated that matrix
stiffness could increase the malignancy of glioma cells through the
activation of the Wnt signaling pathway. The Wnt pathway and
glycolysis are closely related in the progression of tumor cells.
For example, Jiang et al (62) revealed that activating Toll-like
receptor 9 could simultaneously inhibit the activation and
infiltration of macrophages in HCC brought about by the Wnt pathway
and glycolysis. Similarly, Fan et al (63) found that autophagy could upregulate
glycolysis in HCC cells through the Wnt pathway and deteriorate
tumor cell invasion. Although the present study did not directly
identify the enrichment of the Wnt pathway, other studies (64,65)
have suggested that the Wnt pathway affects tumor progression by
regulating glucose metabolism and they may be tightly connected
through the extracellular matrix together.
In conclusion, the present study used a large sample
of human grade II–III glioma in a database, and screened out seven
key lncRNAs related to glycolysis to construct a good model that
could accurately predict the prognosis of patients with grade
II–III glioma. Multiple aspects of grade II–III glioma were further
examined, including the biology and molecular mechanism of drug
resistance. In addition, the aforementioned analyses were verified
by cell function experiments, aiming to provide novel ideas for the
clinical diagnosis of grade II–III glioma.
Supplementary Material
Supporting Data
Supporting Data
Supporting Data
Supporting Data
Supporting Data
Supporting Data
Supporting Data
Supporting Data
Acknowledgements
Not applicable.
Funding
Funding: No funding was received.
Availability of data and materials
The data generated in the present study may be
requested from the corresponding author.
Authors' contributions
TY designed the implementation of the research. RZ
and ZC made contributions to the acquisition of data. BZ and XZ
participated in the research design and implementation. QH and XY
participated in the analysis and interpretation of data. All
authors read and approved the final version of the manuscript. RZ
and ZC confirm the authenticity of all the raw data.
Ethics approval and consent to
participate
Not applicable.
Patient consent for publication
Not applicable.
Competing interests
The authors declare that have no competing
interests.
References
|
1
|
Ostrom QT, Patil N, Cioffi G, Waite K,
Kruchko C and Barnholtz-Sloan JS: CBTRUS Statistical Report:
Primary Brain and Other Central Nervous System Tumors Diagnosed in
the United States in 2013–2017. Neuro Oncol. 22 (12 Suppl
2):iv1–iv96. 2020. View Article : Google Scholar : PubMed/NCBI
|
|
2
|
Ostrom QT, Bauchet L, Davis FG, Deltour I,
Fisher JL, Langer CE, Pekmezci M, Schwartzbaum JA, Turner MC, Walsh
KM, et al: The epidemiology of glioma in adults: A ‘state of the
science’ review. Neuro Oncol. 16:896–913. 2014. View Article : Google Scholar : PubMed/NCBI
|
|
3
|
Cancer Genome Atlas Research Network, .
Brat DJ, Verhaak RG, Aldape KD, Yung WK, Salama SR, Cooper LA,
Rheinbay E, Miller CR, Vitucci M, et al: Comprehensive, Integrative
Genomic Analysis of Diffuse Lower-Grade Gliomas. N Engl J Med.
372:2481–2498. 2015. View Article : Google Scholar : PubMed/NCBI
|
|
4
|
Okita Y, Narita Y, Miyahara R, Miyakita Y,
Ohno M and Shibui S: Health-related quality of life in long-term
survivors with Grade II gliomas: The contribution of disease
recurrence and Karnofsky Performance Status. Jpn J Clin Oncol.
45:906–913. 2015. View Article : Google Scholar : PubMed/NCBI
|
|
5
|
Batsios G, Viswanath P, Subramani E, Najac
C, Gillespie AM, Santos RD, Molloy AR, Pieper RO and Ronen SM:
PI3K/mTOR inhibition of IDH1 mutant glioma leads to reduced 2HG
production that is associated with increased survival. Sci Rep.
9:105212019. View Article : Google Scholar : PubMed/NCBI
|
|
6
|
Zhang C, Yu R, Li Z, Song H, Zang D, Deng
M, Fan Y, Liu Y, Zhang Y and Qu X: Comprehensive analysis of genes
based on chr1p/19q co-deletion reveals a robust 4-gene prognostic
signature for lower grade glioma. Cancer Manag Res. 11:4971–4984.
2019. View Article : Google Scholar : PubMed/NCBI
|
|
7
|
Ganapathy-Kanniappan S and Geschwind JF:
Tumor glycolysis as a target for cancer therapy: Progress and
prospects. Mol Cancer. 12:1522013. View Article : Google Scholar : PubMed/NCBI
|
|
8
|
Liberti MV and Locasale JW: The warburg
effect: How does it benefit cancer cells? Trends Biochem Sci.
41:211–218. 2016. View Article : Google Scholar : PubMed/NCBI
|
|
9
|
Locasale JW and Cantley LC: Metabolic flux
and the regulation of mammalian cell growth. Cell Metab.
14:443–451. 2011. View Article : Google Scholar : PubMed/NCBI
|
|
10
|
Ganapathy-Kanniappan S: Molecular
intricacies of aerobic glycolysis in cancer: Current insights into
the classic metabolic phenotype. Crit Rev Biochem Mol Biol.
53:667–682. 2018. View Article : Google Scholar : PubMed/NCBI
|
|
11
|
Liu YC, Lin P, Zhao YJ, Wu LY, Wu YQ, Peng
JB, He Y and Yang H: Pan-cancer analysis of clinical significance
and associated molecular features of glycolysis. Bioengineered.
12:4233–4246. 2021. View Article : Google Scholar : PubMed/NCBI
|
|
12
|
Yang J, Ren B, Yang G, Wang H, Chen G, You
L, Zhang T and Zhao Y: The enhancement of glycolysis regulates
pancreatic cancer metastasis. Cell Mol Life Sci. 77:305–321. 2020.
View Article : Google Scholar : PubMed/NCBI
|
|
13
|
Liu Z, Liu Z, Zhou X, Lu Y, Yao Y, Wang W,
Lu S, Wang B, Li F and Fu W: A glycolysis-related two-gene risk
model that can effectively predict the prognosis of patients with
rectal cancer. Hum Genomics. 16:52022. View Article : Google Scholar : PubMed/NCBI
|
|
14
|
Reuss AM, Groos D, Buchfelder M and
Savaskan N: The Acidic Brain-Glycolytic switch in the
microenvironment of malignant glioma. Int J Mol Sci. 22:55182021.
View Article : Google Scholar : PubMed/NCBI
|
|
15
|
Alexander RP, Fang G, Rozowsky J, Snyder M
and Gerstein MB: Annotating non-coding regions of the genome. Nat
Rev Genet. 11:559–571. 2010. View Article : Google Scholar : PubMed/NCBI
|
|
16
|
Fan C, Tang Y, Wang J, Xiong F, Guo C,
Wang Y, Zhang S, Gong Z, Wei F, Yang L, et al: Role of long
non-coding RNAs in glucose metabolism in cancer. Mol Cancer.
16:1302017. View Article : Google Scholar : PubMed/NCBI
|
|
17
|
Zhao N, Zhang J, Zhao Q, Chen C and Wang
H: Mechanisms of long Non-Coding RNAs in biological characteristics
and aerobic glycolysis of glioma. Int J Mol Sci. 22:111972021.
View Article : Google Scholar : PubMed/NCBI
|
|
18
|
Zhao L, Ji G, Le X, Wang C, Xu L, Feng M,
Zhang Y, Yang H, Xuan Y, Yang Y, et al: Long noncoding RNA
LINC00092 acts in Cancer-Associated fibroblasts to drive glycolysis
and progression of ovarian cancer. Cancer Res. 77:1369–1382. 2017.
View Article : Google Scholar : PubMed/NCBI
|
|
19
|
Sun X, Huang X, Sun X, Chen S, Zhang Z, Yu
Y and Zhang P: Oxidative Stress-Related lncRNAs are potential
biomarkers for predicting prognosis and immune responses in
patients With LUAD. Front Genet. 13:9097972022. View Article : Google Scholar : PubMed/NCBI
|
|
20
|
Chen C, Liu YQ, Qiu SX, Li Y, Yu NJ, Liu K
and Zhong LM: Five metastasis-related mRNAs signature predicting
the survival of patients with liver hepatocellular carcinoma. BMC
Cancer. 21:6932021. View Article : Google Scholar : PubMed/NCBI
|
|
21
|
Zhao J, Wang L and Wei B: Identification
and validation of an energy Metabolism-Related lncRNA-mRNA
signature for Lower-Grade glioma. Biomed Res Int.
2020:37082312020.PubMed/NCBI
|
|
22
|
Sun X, Song J, Lu C, Sun X, Yue H, Bao H,
Wang S and Zhong X: Characterization of cuproptosis-related lncRNA
landscape for predicting the prognosis and aiding immunotherapy in
lung adenocarcinoma patients. Am J Cancer Res. 13:778–801.
2023.PubMed/NCBI
|
|
23
|
Jerome Friedman TH and RT: Regularization
paths for generalized linear models via coordinate descent. J Stat
Softw. 33:1–22. 2010.PubMed/NCBI
|
|
24
|
Wu X, Sui Z, Zhang H, Wang Y and Yu Z:
Integrated analysis of lncRNA-Mediated ceRNA network in lung
adenocarcinoma. Front Oncol. 10:5547592020. View Article : Google Scholar : PubMed/NCBI
|
|
25
|
He Y, Zhang J, Chen Z, Sun K, Wu X, Wu J
and Sheng L: A seven-gene prognosis model to predict biochemical
recurrence for prostate cancer based on the TCGA database. Front
Surg. 9:9234732022. View Article : Google Scholar : PubMed/NCBI
|
|
26
|
Iasonos A, Schrag D, Raj GV and Panageas
KS: How to build and interpret a nomogram for cancer prognosis. J
Clin Oncol. 26:1364–1370. 2008. View Article : Google Scholar : PubMed/NCBI
|
|
27
|
Zhuang W, Sun H, Zhang S, Zhou Y, Weng W,
Wu B, Ye T, Huang W, Lin Z, Shi L and Shi K: An immunogenomic
signature for molecular classification in hepatocellular carcinoma.
Mol Ther Nucleic Acids. 25:105–115. 2021. View Article : Google Scholar : PubMed/NCBI
|
|
28
|
Chakraborty H and Hossain A: R package to
estimate intracluster correlation coefficient with confidence
interval for binary data. Comput Methods Programs Biomed.
155:85–92. 2018. View Article : Google Scholar : PubMed/NCBI
|
|
29
|
Mayakonda A, Lin DC, Assenov Y, Plass C
and Koeffler HP: Maftools: Efficient and comprehensive analysis of
somatic variants in cancer. Genome Res. 28:1747–1756. 2018.
View Article : Google Scholar : PubMed/NCBI
|
|
30
|
Wang Z, Li J, Zhang P, Zhao L, Huang B, Xu
Y, Wu G and Xia Q: The Role of ERBB signaling pathway-related genes
in kidney renal clear cell carcinoma and establishing a prognostic
risk assessment model for patients. Front Genet. 13:8622102022.
View Article : Google Scholar : PubMed/NCBI
|
|
31
|
Geeleher P, Cox N and Huang RS:
pRRophetic: An R package for prediction of clinical
chemotherapeutic response from tumor gene expression levels. PLoS
One. 9:e1074682014. View Article : Google Scholar : PubMed/NCBI
|
|
32
|
Ritchie ME, Phipson B, Wu D, Hu Y, Law CW,
Shi W and Smyth GK: limma powers differential expression analyses
for RNA-sequencing and microarray studies. Nucleic Acids Res.
43:e472015. View Article : Google Scholar : PubMed/NCBI
|
|
33
|
Yu G, Wang LG, Han Y and He QY:
clusterProfiler: An R package for comparing biological themes among
gene clusters. OMICS. 16:284–287. 2012. View Article : Google Scholar : PubMed/NCBI
|
|
34
|
Brunson JC: Ggalluvial: Layered grammar
for alluvial plots. J Open Source Softw. 5:20172020. View Article : Google Scholar : PubMed/NCBI
|
|
35
|
Li XN, Du ZW and Huang Q: Modulation
effects of hexamethylene bisacetamide on growth and differentiation
of cultured human malignant glioma cells. J Neurosurg. 84:831–838.
1996. View Article : Google Scholar : PubMed/NCBI
|
|
36
|
Gulhan PY, Eroz R, Ataoglu O, İnce N,
Davran F, Öztürk CE, Gamsızkan Z and Balbay OA: The evaluation of
both the expression and serum protein levels of Caspase-3 gene in
patients with different degrees of SARS-CoV2 infection. J Med
Virol. 94:897–905. 2022. View Article : Google Scholar : PubMed/NCBI
|
|
37
|
Livak KJ and Schmittgen TD: Analysis of
relative gene expression data using real-time quantitative PCR and
the 2(−Delta Delta C(T)) method. Methods. 25:402–408. 2001.
View Article : Google Scholar : PubMed/NCBI
|
|
38
|
Feng Q, Qian C and Fan S: A
hypoxia-related long non-coding RNAs signature associated with
prognosis in lower-grade glioma. Front Oncol. 11:7715122021.
View Article : Google Scholar : PubMed/NCBI
|
|
39
|
Lu Y, Sha H, Sun X, Zhang Y, Wu Y, Zhang
J, Zhang H, Wu J and Feng J: CRNDE: An oncogenic long non-coding
RNA in cancers. Cancer Cell Int. 20:1622020. View Article : Google Scholar : PubMed/NCBI
|
|
40
|
Zhang J, Yin M, Peng G and Zhao Y: CRNDE:
An important oncogenic long non-coding RNA in human cancers. Cell
Prolif. 51:e124402018. View Article : Google Scholar : PubMed/NCBI
|
|
41
|
Choi S, Yu Y, Grimmer MR, Wahl M, Chang SM
and Costello JF: Temozolomide-associated hypermutation in gliomas.
Neuro Oncol. 20:1300–1309. 2018. View Article : Google Scholar : PubMed/NCBI
|
|
42
|
Bale TA and Rosenblum MK: The 2021 WHO
classification of tumors of the central nervous system: An update
on pediatric low-grade gliomas and glioneuronal tumors. Brain
Pathol. 32:e130602022. View Article : Google Scholar : PubMed/NCBI
|
|
43
|
Li J, Qian Y, Zhang C, Wang W, Qiao Y,
Song H, Li L, Guo J, Lu D and Deng X: LncRNA LINC00473 is involved
in the progression of invasive pituitary adenoma by upregulating
KMT5A via ceRNA-mediated miR-502-3p evasion. Cell Death Dis.
12:5802021. View Article : Google Scholar : PubMed/NCBI
|
|
44
|
Zhang X, Gejman R, Mahta A, Zhong Y, Rice
KA, Zhou Y, Cheunsuchon P, Louis DN and Klibanski A: Maternally
expressed gene 3, an imprinted noncoding RNA gene, is associated
with meningioma pathogenesis and progression. Cancer Res.
70:2350–2358. 2010. View Article : Google Scholar : PubMed/NCBI
|
|
45
|
Vander Heiden MG, Cantley LC and Thompson
CB: Understanding the Warburg effect: The metabolic requirements of
cell proliferation. Science. 324:1029–1033. 2009. View Article : Google Scholar : PubMed/NCBI
|
|
46
|
Pavlova NN and Thompson CB: The emerging
hallmarks of cancer metabolism. Cell Metab. 23:27–47. 2016.
View Article : Google Scholar : PubMed/NCBI
|
|
47
|
Ma X, Jin W, Zhao C, Wang X and Wang K:
CRNDE: A valuable long noncoding RNA for diagnosis and therapy of
solid and hematological malignancies. Mol Ther Nucleic Acids.
28:190–201. 2022. View Article : Google Scholar : PubMed/NCBI
|
|
48
|
Han P, Li JW, Zhang BM, Lv JC, Li YM, Gu
XY, Yu ZW, Jia YH, Bai XF, Li L, et al: The lncRNA CRNDE promotes
colorectal cancer cell proliferation and chemoresistance via
miR-181a-5p-mediated regulation of Wnt/β-catenin signaling. Mol
Cancer. 16:92017. View Article : Google Scholar : PubMed/NCBI
|
|
49
|
Zhang F, Wang H, Yu J, Yao X, Yang S, Li
W, Xu L and Zhao L: LncRNA CRNDE attenuates chemoresistance in
gastric cancer via SRSF6-regulated alternative splicing of PICALM.
Mol Cancer. 20:62021. View Article : Google Scholar : PubMed/NCBI
|
|
50
|
Momtazmanesh S and Rezaei N: Long
non-coding RNAs in diagnosis, treatment, prognosis, and progression
of glioma: A State-of-the-Art review. Front Oncol. 11:7127862021.
View Article : Google Scholar : PubMed/NCBI
|
|
51
|
Zhao Z, Liu M, Long W, Yuan J, Li H, Zhang
C, Tang G, Jiang W, Yuan X, Wu M and Liu Q: Knockdown lncRNA CRNDE
enhances temozolomide chemosensitivity by regulating autophagy in
glioblastoma. Cancer Cell Int. 21:4562021. View Article : Google Scholar : PubMed/NCBI
|
|
52
|
DeBerardinis RJ, Lum JJ, Hatzivassiliou G
and Thompson CB: The biology of cancer: Metabolic reprogramming
fuels cell growth and proliferation. Cell Metab. 7:11–20. 2008.
View Article : Google Scholar : PubMed/NCBI
|
|
53
|
Deberardinis RJ, Sayed N, Ditsworth D and
Thompson CB: Brick by brick: Metabolism and tumor cell growth. Curr
Opin Genet Dev. 18:54–61. 2008. View Article : Google Scholar : PubMed/NCBI
|
|
54
|
Wang Y, Liu J, Ren F, Chu Y and Cui B:
Identification and validation of a four-long non-coding RNA
signature associated with immune infiltration and prognosis in
colon cancer. Front Genet. 12:6711282021. View Article : Google Scholar : PubMed/NCBI
|
|
55
|
Wang G, Liu P, Li J, Jin K, Zheng X and
Xie L: Novel prognosis and therapeutic response model of
immune-related lncRNA pairs in clear cell renal cell carcinoma.
Vaccines (Basel). 10:11612022. View Article : Google Scholar : PubMed/NCBI
|
|
56
|
Vitale I, Manic G, Coussens LM, Kroemer G
and Galluzzi L: Macrophages and Metabolism in the Tumor
Microenvironment. Cell Metab. 30:36–50. 2019. View Article : Google Scholar : PubMed/NCBI
|
|
57
|
Wang ZH, Peng WB, Zhang P, Yang XP and
Zhou Q: Lactate in the tumour microenvironment: From immune
modulation to therapy. EBioMedicine. 73:1036272021. View Article : Google Scholar : PubMed/NCBI
|
|
58
|
Peng M, Yin N, Chhangawala S, Xu K, Leslie
CS and Li MO: Aerobic glycolysis promotes T helper 1 cell
differentiation through an epigenetic mechanism. Science.
354:481–484. 2016. View Article : Google Scholar : PubMed/NCBI
|
|
59
|
D'Angelo F, Ceccarelli M, Tala, Garofano
L, Zhang J, Frattini V, Caruso FP, Lewis G, Alfaro KD, Bauchet L,
et al: The molecular landscape of glioma in patients with
Neurofibromatosis 1. Nat Med. 25:176–187. 2019. View Article : Google Scholar : PubMed/NCBI
|
|
60
|
Guo X, Pan Y, Xiong M, Sanapala S,
Anastasaki C, Cobb O, Dahiya S and Gutmann DH: Midkine activation
of CD8+ T cells establishes a neuron-immune-cancer axis
responsible for low-grade glioma growth. Nat Commun. 11:21772020.
View Article : Google Scholar : PubMed/NCBI
|
|
61
|
Tao B, Song Y, Wu Y, Peng T, Peng L, Xia
K, Xia X, Chen L and Zhong C: Matrix stiffness promotes glioma cell
stemness by activating BCL9L/Wnt/β-catenin signaling. Aging (Albany
NY). 13:5284–5296. 2021. View Article : Google Scholar : PubMed/NCBI
|
|
62
|
Jiang Y, Han Q, Zhao H and Zhang J:
Promotion of epithelial-mesenchymal transformation by
hepatocellular carcinoma-educated macrophages through
Wnt2b/β-catenin/c-Myc signaling and reprogramming glycolysis. J Exp
Clin Cancer Res. 40:132021. View Article : Google Scholar : PubMed/NCBI
|
|
63
|
Fan Q, Yang L, Zhang X, Ma Y, Li Y, Dong
L, Zong Z, Hua X, Su D, Li H and Liu J: Autophagy promotes
metastasis and glycolysis by upregulating MCT1 expression and
Wnt/β-catenin signaling pathway activation in hepatocellular
carcinoma cells. J Exp Clin Cancer Res. 37:92018. View Article : Google Scholar : PubMed/NCBI
|
|
64
|
Zhou M, He J, Li Y, Jiang L, Ran J, Wang
C, Ju C, Du D, Xu X, Wang X, et al: N6-methyladenosine
modification of REG1α facilitates colorectal cancer progression via
β-catenin/MYC/LDHA axis mediated glycolytic reprogramming. Cell
Death Dis. 14:5572023. View Article : Google Scholar : PubMed/NCBI
|
|
65
|
Dong S, Liang S, Cheng Z, Zhang X, Luo L,
Li L, Zhang W, Li S, Xu Q, Zhong M, et al: ROS/PI3K/Akt and
Wnt/β-catenin signalings activate HIF-1α-induced metabolic
reprogramming to impart 5-fluorouracil resistance in colorectal
cancer. J Exp Clin Cancer Res. 41:152022. View Article : Google Scholar : PubMed/NCBI
|