Introduction
Lung cancer is one of the most leading causes of
cancer-related mortality worldwide. Various strategies have been
adopted for the management of this disease. Adenocarcinoma, located
in the mucus cells within airways, is a main type of lung cancer,
and accounts for ~40% of all lung cancers and is often diagnosed at
a late stage with concomitant poor prognosis (1).
Although tumor biomarkers have greatly improved the
diagnosis of this disease, the invasive, unpleasant and
inconvenient nature of current diagnostic procedures limit their
application (2). Hence, there is an
urgent need for identification of novel non-invasive biomarkers for
early tumor detection. microRNAs (miRNAs), a class of naturally
occurring small non-coding RNAs, usually 18–25 nucleotides (18–25
nt) in length, have been linked to cancer development. Recently,
altered miRNA expression has been reported in various types of
cancers, and the profiles of tissue miRNAs exhibit great potential
for application in cancer diagnosis (3,4).
In the present study, we demonstrated that a
specific miRNA, hsa-miR-155 (miR-155), shows great promise as a
novel non-invasive biomarker in serum for the diagnosis of
adenocarcinoma lung cancer. To validate whether altered levels of
miR-155 expression detected in serum could be a useful biomarker
for the diagnosis of NSCLC (non-small cell lung cancer),
particularly in adenocarcinoma, real-time relative quantitative
reverse transcription-polymerase chain reaction (RT-PCR) was
performed. The results were associated with ROC (receiver-operating
characteristic) curve analysis in both the patient and control
cohorts in order to ascertain i) whether miR-155 is able to be
reliably measured in serum, ii) whether there are any significant
differences between patients and controls regarding miR-155
expression in serum, and iii) whether analysis of miR-155
expression in serum may faciliate the diagnosis of lung
adenocarcinoma.
Materials and methods
Origin of the serum samples
All serum samples used in the present study were
collected at the Divison of Respiratory and Critical Care Medicine,
The First Affiliated Hospital of Zhengzhou University. Samples were
obained at both the out-patient and in-patient departments from
January 2012 to January 2013. The serum samples were obtained from
36 patients with lung cancer and 32 healthy volunteers whose age
and gender distributions showed no differences with the
patients.
All patients with lung cancer were pathologically
diagnosed, were diagnosed with lung cancer for the first time, and
did not receive prior chemotherapy, radiotherapy or other
tumor-specific treatment. To control disease heterogeneity, lung
adenocarcinoma patients at all stages from I to IV were involved in
the present study. Patients known to have a family history of
cancer or metastatic cancer from other or unknown origins were
excluded. All controls had no family history or past history of
cancer. All controls were non-smokers (Table I).
 | Table IDemographic information of the lung
adenocarcinoma cases and controls. |
Table I
Demographic information of the lung
adenocarcinoma cases and controls.
| Patients (n=36) | Controls (n=32) | P-value |
|---|
| Mean age (years) | 55.1 (SD 12.2) | 52.5 (SD 11.3) | 0.011a |
| Gender |
| Female | 25 | 22 | 0.003a |
| Male | 11 | 10 | |
| Smoking status |
| Packs/year | 36.8 (SD 12.6) | 0 | |
| Location of
tumor |
| Central | 8 | | |
| Peripheral | 28 | 0.000b | |
| Cancer stage |
| I | 6 | | |
| II | 8 | | |
| III | 15 | | |
| IV | 7 | | |
| Histology |
| AC of lung | 36 | | |
| SC of lung | 0 | | |
Serum collection and RNA extraction
Whole blood (2 ml) from every patient and negative
control was collected in regular tubes and immediately processed to
prevent contamination by cellular nucleic acids. Blood samples were
centrifuged at 2,000 rpm for 10 min at room temperature, and then
the upper supernatant, which was the serum sample, was transferred
to new RNase-free collection tubes, respectively, and stored at
−80°C for further processing.
Small RNA molecules with size <200 nucleotides
were extracted and purified from 200 μl of each serum sample, using
an E.Z.N.A.® miRNA kit (Omega Bio-Tek, Inc., Norcross,
GA, USA) and finally eluted into 15 μl of Elution solution
according to the manufacturer’s instructions.
Reverse transcription and real-time
RT-PCR
RNA was applied for RT by using the Veriti™ 96-Well
Thermal Cycler (Applied Biosystems, Foster City, CA, USA) and
Roche® Transcriptor First-Strand cDNA Synthesis kit (F.
Hoffmann-La Roche Ltd.), according to the manufacturer’s
instructions. The reaction included 1 μg total RNA, 2 μl random
hexamer primer at 60 μM, 4 μl 1X RT reaction buffer, 1 mM of each
dNTP, 10 U MultiScribe reverse transcriptase and PCR-grade water to
make a total volume of 20 μl. The RT reaction was incubated for 10
min at 25°C, followed by 30 min at 55°C, and then the transcriptor
reverse transcriptase was inactivated by heating at 85°C for 5 min.
The reaction was stopped by placing the tubes on ice for further
use.
Real-time PCR was performed to measure the
expression levels of target miRNAs, using Roche®
FastStart Universal SYBR-Green Master (ROX) PCR kit (F. Hoffmann-La
Roche Ltd.) on the 7500 Fast Real-time PCR system (Applied
Biosystems). The 20-μl PCR reaction included RT products,
Roche® ROX and the corresponding primers for the target
genes. The reactions were incubated in a 96-well plate at 95°C for
10 min, followed by 40 cycles of 95°C for 10 sec and 58°C for 30
sec. The threshold cycle (Ct) was defined as the fractional cycle
number at which the fluorescence passed the fixed threshold.
Expression levels of hsa-miR-21 and hsa-miR-155 were normalized in
relation to the expression of U6 RNA, a small nuclear RNA as an
internal control commonly used for miRNA quantification assay
(5). The primer sequences for miRNA
RT-PCR are shown as Table II. All
assays were performed in triplicate.
| Table IImiRNA real-time-PCR primer
sequences. |
Table II
miRNA real-time-PCR primer
sequences.
| Primer | Sequence (5′-3′) |
|---|
| U6 forward |
CTCGCTTCGGCAGCACA |
| U6 reverse |
AACGCTTCACGAATTTGCGT |
| miR-21 forward |
TAGCTTATCAGACTGATGTTGA |
| miR-155 forward |
TTAATGCTAATCGTGATAGGGGT |
| Universal
reverse | GTGCAGGGTCCGAGGT |
Detection of CEA and CA-125
Values for carcinoembryonic antigen (CEA) and
carbohydrate antigen 125 (CA-125) levels in the serum of the lung
adenocarcinoma patients and controls were determined at the
Clinical Laboratory of The First Affiliated Hospital of Zhengzhou
University.
Statistical analysis
Expression levels of the miRNAs were calculated by
cycle threshold (Ct) values with SDS 2.0 software (Applied
Biosystems). The concentrations from serum samples were normalized
using the 2−ΔΔCt method relative to U6 small nuclear RNA
(RNU6B) (6). The value of ΔCt was
calculated by subtracting the Ct values of RNU6B from the Ct values
of the miRNAs of interest in the study. The values of ΔΔCt were
then calculated by subtracting the ΔCt of the control samples from
the ΔCt of the cancer patients. The change in gene expression was
calculated using the equation 2−ΔΔCt(7).
The independent-samples t-test for unpaired data was
performed to compare differences in miRNA concentrations in serum
between cancer patients and healthy volunteers. A P-value <0.05
was considered to indicate a statistically significant result.
Receiver-operating characteristic (ROC) curves and
the area under the ROC curve (AUC) were used to assess the
feasibility of serum miRNA as a diagnostic tool for detecting lung
adenocarcinoma (8). The values for
specificity, sensitivity, positive/negative likelihood ratio and
Youden’s index for each factor and the combined groups were used to
determine the cut-off value for the serum miR-155 concentrations
with which to distinguish the patients and healthy controls. All
results are expressed as means ± SD
Results
miR-21 and miR-155 expression in serum of
adenocarcinoma patients and healthy control
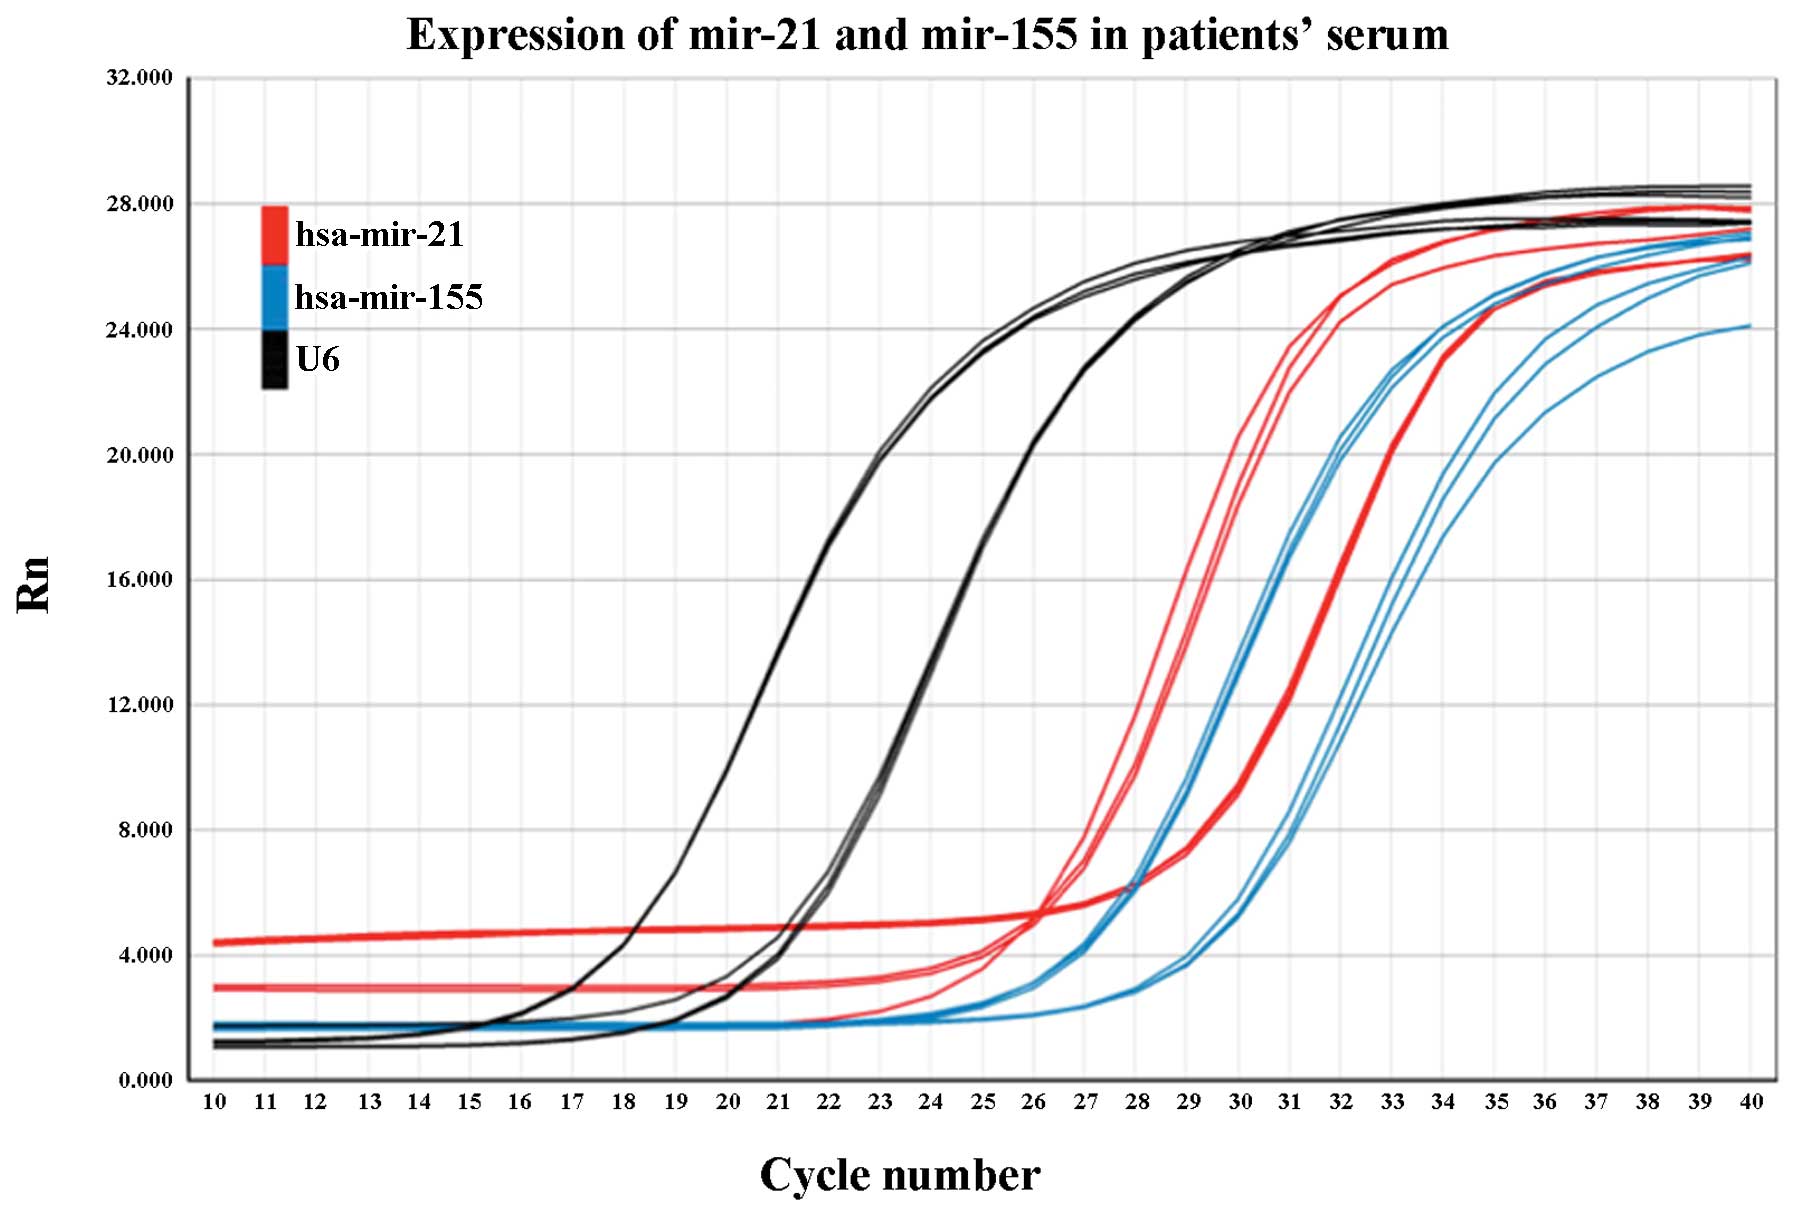
All samples were tested at least four times, and
there were triple repeat contrasts for each sample every time
RT-PCR was run. Results showed that the studied miRNAs could be
stably detected in the serum samples from both the patients and
healthy controls. However, low levels of miR-21 and miR-155
expression were noted in the control group, while U6, as an
internal reference, was easily amplified at high levels (Fig. 1).
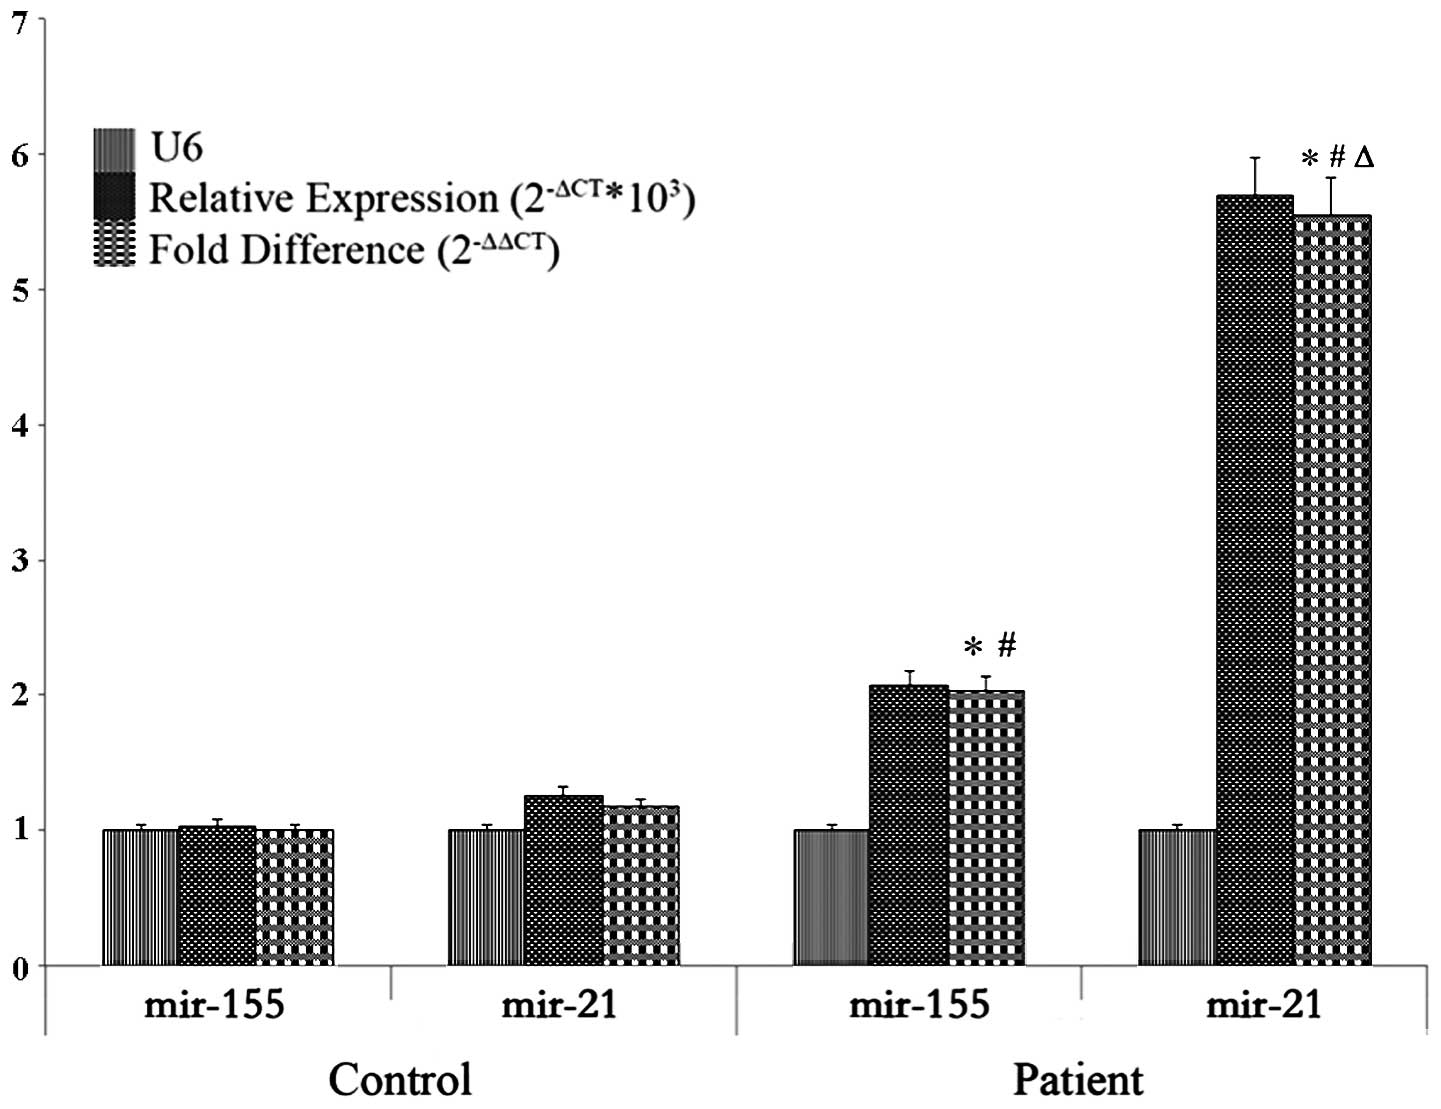
miR-21 and miR-155 were assessed in both control and
patient groups. 2−ΔCt was the relative expression value
while the fold-difference was determined after defining
miR-155control as the reference. In that case, the
fold-difference of miR-155control was 1, and the
miR-21control was 1.173, which indicated that the
expression of miR-21 in the control group was 1.173 times that of
the mean level of miR-155; the fold-difference of
miR-155patient was 2.034 and miR-21patient
was 5.546, which indicated levels were 2.034 times and 5.546 times
higher when compared with the expression levels of
miR-155control (P<0.05). In general, compared with
the patients and control groups, there were noticeable differences
in miR-21 and miR-155 expression, respectively between the two
groups. Within the patient group, significant differences were also
found between miR-21 and miR-155 expression (P<0.05) (Table III; Fig. 2).
| Table IIIRelative expression levels of miR-21
and miR-155 in the serum samples of the lung adenocarcinoma
patients and controls. |
Table III
Relative expression levels of miR-21
and miR-155 in the serum samples of the lung adenocarcinoma
patients and controls.
| Groups | miRNA | Ct value | U6 Ct value | ΔCt | ΔΔCt |
2−ΔCtx103 | Fold-difference
(2−ΔΔCt) |
|---|
| Control | miR-155 | 32.904±0.42 | 21.423±0.57 | 11.480±0.51 | 0.000±0.01 | 1.028±0.124 | 0.999±0.01 |
| miR-21 | 32.938±0.65 | | 11.514±0.58 | 0.0337±0.57 | 1.260±0.15 | 1.173±0.54 |
| Patient | miR-155 | 30.276±0.62 | 20.914±0.55 | 9.362±0.69 | −2.125±0.88 | 2.074±0.81 | 2.034±2.74a,b |
| miR-21 | 28.805±0.61 | | 7.891±0.67 | −3.597±0.80 | 5.696±1.89 | 5.546±6.43a,b,c |
CEA and CA-125 expression in serum of
adenocarcinoma patients and healthy controls
The difference in CEA and CA-125 expression between
the control and patient groups was significant. Thus we assessed
levels of these two factors in the present study, and analyzed
their value when combined with miR-155 expression. All CEA and
CA-125 tests were carried out at the Clinical Laboratory of our
hospital, and the results are shown in Table IV.
| Table IVExpression levels of CEA, CA-125,
miR-155 in the serum sampes of the lung adenocarcinoma patients and
controls. |
Table IV
Expression levels of CEA, CA-125,
miR-155 in the serum sampes of the lung adenocarcinoma patients and
controls.
| Groups | N | Mean | SD | SEM | P-value |
|---|
| CEA | Patient | 36 | 30.456 | 18.464 | 3.077 | |
| Control | 32 | 18.449 | 10.917 | 1.929 | 0.002 |
| CA-125 | Patient | 36 | 40.873 | 21.067 | 3.511 | |
| Control | 32 | 17.743 | 15.398 | 2.722 | 0.000 |
| miR-155 | Patient | 36 | 20.749 | 10.616 | 1.769 | |
| Control | 32 | 10.748 | 6.554 | 1.158 | 0.000 |
ROC analysis to evaluate diagnostic
efficiency
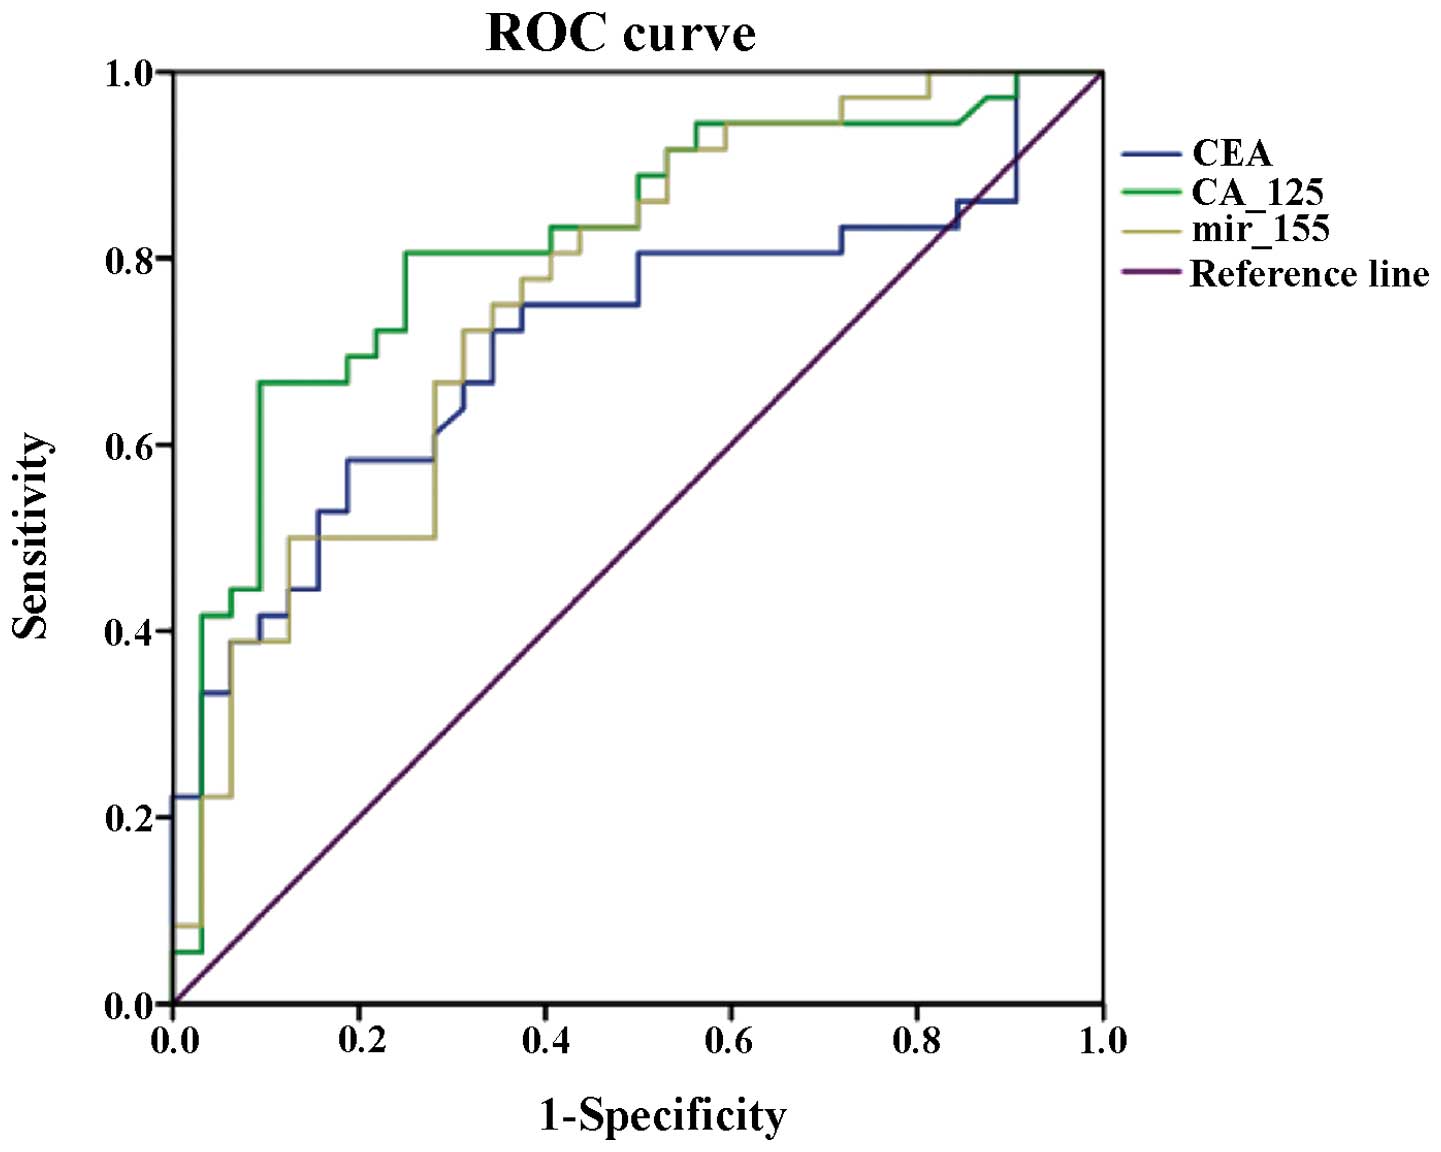
Receiver-operating characteristic analysis of CEA,
CA-125 and miR-155 was performed with SPSS 20.0, and the curve and
results are shown in Fig. 3 and
Table V. Regarding the area under
the ROC curve, CA-125 had the highest value at 0.816 and the value
for miR-155 was 0.761, while CEA had the lowest value of the three
at 0.712. Based on these results, further analysis with multiple
indices was carried out to evaluate their diagnostic value,
respectively, and in combination with each other.
| Table VArea under the ROC curve analysis of
CEA, CA-125 and miR-155 expression in the serum samples of the lung
adenocarcinoma patients and controls. |
Table V
Area under the ROC curve analysis of
CEA, CA-125 and miR-155 expression in the serum samples of the lung
adenocarcinoma patients and controls.
| | | | Asymptotic 95%
confidence interval |
|---|
| | | |
|
|---|
| Variables | Area | SEa | Asymptotic
significanceb | Lower bound | Upper bound |
|---|
| CEA | 0.712 | 0.063 | 0.003 | 0.588 | 0.837 |
| CA-125 | 0.816 | 0.053 | 0.000 | 0.712 | 0.919 |
| miR-155 | 0.761 | 0.058 | 0.000 | 0.648 | 0.875 |
For purposes of estimation, the sensitivity and
specificity values are better at high levels. Moreover, it is the
same when Youden’s index is used. The positive likelihood ratio
(+LR) indicates the probability for a correct diagnosis; higher
values are optimal; a value that approaches 10 is regarded as a
perfect suitable condition. The negative likelihood ratio (−LR) is
the indicator for the probability of a missed diagnosis; a lower
value is optimal.
In the present study, of all the three independent
assays for CEA, CA-125 and miR-155 each, miR-155 had the best
sensitivity and CA-125 had the best specificity, LRs and YI. In
regards to the combined group analysis, CEA + CA-125 had the best
score for specificity, LRs and YI. When we combined CEA or CA-125
with miR-155, the sensitivity of each group was highly improved
when compared with observation of the single marker alone.
Moreover, the CA-125 + miR-155 group had higher sensitivity, −LR
and YI than these values for the CEA + miR-155 group (Table VI).
| Table VIDiagnostic index of CEA, CA-125 and
miR-155 based on ROC analysis results. |
Table VI
Diagnostic index of CEA, CA-125 and
miR-155 based on ROC analysis results.
| Inspected
parameter | OOP | Sensitivity | Specificity | +LR | −LR | YI |
|---|
| CEA (ng/ml) | 26.532 | 0.583 | 0.812 | 3.101 | 0.514 | 0.395 |
| CA-125 (U/ml) | 32.386 | 0.667 | 0.906 | 7.096 | 0.368 | 0.573 |
| miR-155 (CT
value) | 14.880 | 0.722 | 0.687 | 2.308 | 0.405 | 0.409 |
| CEA + CA-125 | / | 0.889 | 0.750 | 3.556 | 0.148 | 0.639 |
| CEA + miR-155 | / | 0.833 | 0.718 | 2.954 | 0.233 | 0.552 |
| CA-125 +
miR-155 | / | 0.889 | 0.688 | 2.849 | 0.161 | 0.576 |
| CEA + CA-125 +
miR-155 | / | 0.916 | 0.656 | 2.663 | 0.128 | 0.573 |
Discussion
miRNAs, as a class of small non-coding RNAs, have
been found to be involved in cancer initiation and progression.
During the last decade, researchers have focused on the expression
profiles of types of miRNAs that may be used for classification,
diagnosis and prognosis of human malignancies (9).
The fact that more than 50% of miRNAs are located at
cancer-related chromosomal regions supports the idea that miRNAs
may play a role as oncogenes or tumor-suppressor genes involved in
cancer (10). The mechanisms of
miRNA expression are still lacking towards our understanding of
this type of small endogenetic RNAs since miRNAs frequently target
hundreds of mRNAs, and the related regulatory pathways are complex
as well. To provide a critical overview of miRNA dysregulation in
cancer, scientists must first discuss the methods currently
available to review miRNAs in genomic organization, biogenesis and
mechanisms of target recognition, and examine how these processes
are altered in tumorigenesis (11).
It is now known that miRNAs play major roles in the
regulation of gene expression during organism development (12). Researchers are currently using miRNA
expression signatures to classify human cancers and are trying to
define miRNA markers that might predict favorable prognosis
(13). In the field of lung cancer
research, it is probable that the differences in miRNA expression
may simply be a surrogate for cytogenetic changes in lung cancers
(14). Genome-wide expression
profiling of miRNAs was found to be significantly different between
primary lung cancers and corresponding non-cancerous lung tissues.
The microarray data were validated by both solution hybridization
detection method and real-time RT-PCR analysis for miRNAs. In this
way, miRNAs might prove useful in the diagnosis and treatment of
cancer.
During the last decade of the 20th century, the most
important oncologically related miRNAs have been identified as the
miR-21 and let-7 families (15),
which are the main research subjects in the field of cancer,
including lung cancer. Researchers have made marked achievements in
increasing the knowledge concerning miRNAs. For example, research
results on miR-21 expression profiles have demonstrated a link
between miR-21 and epidermal growth factor receptor (EGFR) gene
mutations. Moreover, high levels of miR-21 expression have been
reported in various types of human tumors (16), including but not specifically in
lung cancer. Considering this, we aimed to identify more specific
options to assistant lung cancer detection and diagnosis. Another
reason why we decided to study miR-155 was that previous reports
showed that a high level of human miR-155 expression was
significantly an unfavorable prognostic factor independently
associated with lung cancer progression (17), which indicates that miR-155 could be
a strong potential regulator in NSCLC.
Previous research results on miR-155 were from
patient tissues and others were based on in vitro study of
lung cancer cell lines (3).
Moreover, different non-invasive methods were developed to identify
the expression of miR-155, such as patient sputum screening
inspection (18). For clinical
application purposes, of all the above approaches, either they are
not reflections of real-time activities of miRNAs in human bodies,
or the pathologic samples are not easy and convenient to be
collected. In addition, it is barely possible to obtain stable and
reliable results in sputum. In order to make an effort in improving
these issues, we observed miR-155 levels in serum and chose miR-21
as a positive control. We then aimed to ascertain the role of
miR-155 in lung adenocarcinoma occurrence and progression.
As shown in Table
III, we compared the levels of miR-155 and miR-21 expression
between control and patient groups by defining the level of
miR-155control as the standard reference. Based on this,
miR-155patient was overexpressed (P<0.05) which was
similar to the miR-21 expression in the two groups. The difference
in miR-21 levels between the two groups was more marked than that
of miR-155. The results indicated that the use of miR-21 as
positive control between patient and control groups was a good
choice; in this way the fold-difference was easily discerned.
However, further study is still required to estimate whether
miR-155 is suitable for use as a potential novel factor in lung
adenocarcinoma diagnosis, even after confirming it was highly
expressed in the lung cancer patient group.
To better understand the clinical value of miR-155
in diagnosis and prognosis in lung adenocarcinoma, it was compared
with classic biomarkers currently used to benefit clinical outcome.
We tested CEA, a glycoprotein involved in cell adhesion, which is
not usually present in the peripheral blood of healthy adults and
the measurement of which is mainly used as a tumor marker as its
expression is specific to cancer cells, particularly
adenocarcinomas (19). It can,
therefore, be used to distinguish between these and other similar
cancers or benign diseases (20).
Another biomarker we tested was CA-125, which is encoded by the
MUC16 gene, which is a member of the mucin family glycoproteins
that has been shown to play a role in advanced tumorigenesis and
tumor proliferation by several different mechanisms. It has been
identified as a tumor marker or biomarker that may be elevated in
the peripheral blood of patients with specific types of cancers
(21).
While the value of miR-155 was estimated for the
diagnosis of lung adenocarcinoma patients independently and also
combined with serum CEA or CA-125 levels, we used a
receiver-operating characteristic curve analysis method (22), and several indices were used to
identify the efficacy of each combination group.
The index of sensitivity (also called the true
positive rate) relates to the ability of a test to identify
positive results. While specificity (sometimes called the true
negative rate) relates to the ability of a test to identify
negative results. The specificity of a test is defined as the
proportion of patients that are known not to have the disease who
will test negative for it. These two measures are closely related
to the concepts of type I and type II errors. A perfect predictor
would be described as having 100% sensitivity and 100% specificity.
However, theoretically any predictor possesses a minimum boundary
error. For any test, there is usually a trade-off between the
measures. This trade-off can be represented graphically as a
receiver operating characteristic curve (23). The OOP (optimal operating point) is
determined with the highest of Youden’s index (YI), which is
defined as ‘sensitivity + specificity - 1’. It is also called
Youden’s J statistic, a statistic that captures the performance of
a diagnostic test.
Compared with the diagnostic value of CEA, CA-125
and miR-155 individually, miR-155 reached the highest sensitivity
at 0.722, which was quite appropriate for early detection of the
disease. Of all the three studied markers, CA-125 had the best YI,
+LR and −LR scores, which indicates that it is a suitable indicator
for adenocarcinoma diagnosis. CA-125 is sufficiently reliable for
cancer monitoring. Yet, we were not satisfied with the existing
biomarker and wished to explore novel ones for lung cancer
diagnosis. This was because confirmation of this disease at a very
early stage is greatly beneficial to improving the outcome and
prognosis for patients. In this case, sensitivity of a biomarker
shows great importance for improving therapeutic strategy. We were
interested in identifying the effectiveness of the combination of
CEA, CA-125 and miR-155 with each other as different groups. The
‘CA-125 + CEA’ combination had the best score for YI, while the
‘CA-125 + miR-155’ combination showed significantly enhanced
sensitivity when compared with CA-125. Based on ROC curve analysis,
miR-155 had a better AUC than CEA. In addition, relative research
has suggested that CEA blood test is not reliable for diagnosing
cancer or as a screening test for early detection of cancer. This
motivated us to take advantage of a dual test of miR-155 and CA-125
to ameliorate missed diagnosis particularly at the very early stage
of lung adenocarcinoma.
In summary, miR-155 is a useful novel tumor marker
for lung cancer. It can be stably measured in patient serum with
marked differences when compared with health controls. It shows a
better specificity than CA-125 and CEA in adenocarcinoma diagnosis.
Abnormal high serum concentrations of miR-155 are mainly found in
cancers, particularly in NSCLC. Combined testing of miR-155
improves the utility of CA-125 as a tumor marker in lung
adenocarcinoma, and using both markers simultaneously increases the
tumor marker sensitivity in lung adenocarcinoma diagnosis.
Moreover, considering the characteristics of miRNAs, non-coding and
short in length, we are able to test its expression in peripheral
blood without severe invasion, and more importantly, there is a
possibility that we are able to manually modulate miRNA levels
easily to cause an alteration in the expression of cancer-related
downstream proteins, which are targeted and regulated by the
corresponding miRNAs. Currently, the investigation of miRNAs as
biomarkers for improving the diagnosis of NSCLC by our research
team is just at the onset. We believe that profound effects and
benefits provided by miRNAs in disease diagnosis, therapy and
prognosis will be achieved in the near future.
References
|
1
|
Nirasawa S, Kobayashi D, Tsuji N,
Kuribayashi K and Watanabe N: Diagnostic relevance of overexpressed
Nanog gene in early lung cancers. Oncol Rep. 22:587–591.
2009.PubMed/NCBI
|
|
2
|
Duffy MJ: Role of tumor markers in
patients with solid cancers: a critical review. Eur J Intern Med.
18:175–184. 2007. View Article : Google Scholar : PubMed/NCBI
|
|
3
|
Esquela-Kerscher A and Slack FJ: OncomiRs
- microRNAs with a role in cancer. Nat Rev Cancer. 6:259–269. 2006.
View Article : Google Scholar
|
|
4
|
Calin GA and Croce CM: MicroRNA signatures
in human cancers. Nat Rev Cancer. 6:857–866. 2006. View Article : Google Scholar : PubMed/NCBI
|
|
5
|
Soejima M, Tsuchiya Y, Egashira K, Kawano
H, Sagawa K and Koda Y: Development and validation of a SYBR Green
I–based real-time polymerase chain reaction method for detection of
haptoglobin gene deletion in clinical materials. Transfusion.
6:1322–1327. 2010.
|
|
6
|
Alam MS, Mohon AN, Mustafa S, Khan WA,
Islam N, Karim MJ, Khanum H, Sullivan DJ Jr and Haque R: Real-time
PCR assay and rapid diagnostic tests for the diagnosis of
clinically suspected malaria patients in Bangladesh. Malar J.
10:1752011. View Article : Google Scholar : PubMed/NCBI
|
|
7
|
Pfaffl MW: A new mathematical model for
relative quantification in real-time RT-PCR. Nucleic Acids Res.
9:e452001. View Article : Google Scholar : PubMed/NCBI
|
|
8
|
Akobeng AK: Understanding diagnostic tests
3: receiver operating characteristic curves. Acta Paediatr.
5:644–647. 2007. View Article : Google Scholar : PubMed/NCBI
|
|
9
|
Galasso M, Sandhu SK and Volinia S:
MicroRNA expression signatures in solid malignancies. Cancer J.
3:238–243. 2012. View Article : Google Scholar : PubMed/NCBI
|
|
10
|
Calin GA, Sevignani C, Dumitru CD, et al:
Human microRNA genes are frequently located at fragile sites and
genomic regions involved in cancers. Proc Natl Acad Sci USA.
101:2999–3004. 2004. View Article : Google Scholar : PubMed/NCBI
|
|
11
|
Farazi TA, Spitzer JI, Morozov P and
Tuschl T: miRNAs in human cancer. J Pathol. 2:102–115. 2011.
View Article : Google Scholar
|
|
12
|
Ambros V: MicroRNA pathways in flies and
worms: growth, death, fat, stress, and timing. Cell. 113:673–676.
2003. View Article : Google Scholar : PubMed/NCBI
|
|
13
|
Lu J, Getz G, Miska EA, Alvarez-Saavedra
E, Lamb J, Peck D, et al: MicroRNA expression profiles classify
human cancers. Nature. 435:834–838. 2005. View Article : Google Scholar : PubMed/NCBI
|
|
14
|
Keller A, Leidinger P, Borries A,
Wendschlag A, Wucherpfennig F, Scheffler M, Huwer H, Lenhof HP and
Meese E: miRNAs in lung cancer - studying complex fingerprints in
patient’s blood cells by microarray experiments. BMC Cancer.
9:353–363. 2009.PubMed/NCBI
|
|
15
|
Esquela-Kerscher A, Trang P, Wiggins JF,
Patrawala L, Cheng A, Ford L, Weidhaas JB, Brown D, Bader AG and
Slack FJ: The let-7 microRNA reduces tumor growth in mouse models
of lung cancer. Cell Cycle. 6:759–764. 2008. View Article : Google Scholar : PubMed/NCBI
|
|
16
|
Schetter AJ, Leung SY, Sohn JJ, Zanetti
KA, Bowman ED, Yanaihara N, Yuen ST, Chan TL, et al: MicroRNA
expression profiles associated with prognosis and therapeutic
outcome in colon adenocarcinoma. JAMA. 299:425–436. 2008.
View Article : Google Scholar : PubMed/NCBI
|
|
17
|
Yanaihara N, Caplen N, Bowman E, Seike M,
Kumamoto K, Yi M, Stephens RM, Okamoto A, Yokota J, Tanaka T, Calin
GA, Liu CG, Croce CM and Harris CC: Unique microRNA molecular
profiles in lung cancer diagnosis and prognosis. Cancer Cell.
3:189–198. 2006. View Article : Google Scholar : PubMed/NCBI
|
|
18
|
Roa W, Brunet B, Guo L, Amanie J,
Fairchild A, Gabos Z, Nijjar T, Scrimger R, Yee D and Xing J:
Identification of a new microRNA expression profile as a potential
cancer screening tool. Clin Invest Med. 2:E1242010.PubMed/NCBI
|
|
19
|
Grunnet M and Sorensen JB:
Carcinoembryonic antigen (CEA) as tumor marker in lung cancer. Lung
Cancer. 2:138–143. 2012. View Article : Google Scholar : PubMed/NCBI
|
|
20
|
Okamura K, Takayama K, Izumi M, Harada T,
Furuyama K and Nakanishi Y: Diagnostic value of CEA and CYFRA 21–1
tumor markers in primary lung cancer. Lung Cancer. 1:45–49.
2013.
|
|
21
|
Li X, Asmitananda T, Gao L, Gai D, Song Z,
Zhang Y, Ren H, Yang T, Chen T and Chen M: Biomarkers in the lung
cancer diagnosis: a clinical perspective. Neoplasma. 5:500–507.
2012. View Article : Google Scholar : PubMed/NCBI
|
|
22
|
Demler OV, Pencina MJ and D’Agostino RB
Sr: Equivalence of improvement in area under ROC curve and linear
discriminant analysis coefficient under assumption of normality.
Stat Med. 12:1410–1418. 2011.PubMed/NCBI
|
|
23
|
Søreide K: Receiver-operating
characteristic curve analysis in diagnostic, prognostic and
predictive biomarker research. J Clin Pathol. 1:1–5. 2009.
|