Introduction
Barrett’s esophagus (BE) is the physical phenomenon
that the stratified squamous epithelia of the lower esophagus are
substituted by metaplastic simple columnar epithelia. BE is a type
of precancerosis of esophagus adenocarcinoma (EAC). The incidence
of EAC has markedly increased, especially in Western industrialized
countries (1). For BE patients, the
risk of developing EAC has increased 30–125-fold compared to
individuals not suffering from BE. Therefore, BE is considered the
key risk factor for EAC (2).
However, the factors that play a critical role in the
transformation of BE to EAC remain unclear. In recent years, tumor
stem cells have been regarded as the source of tumor growth,
metastasis and recurrence due to their potential of self-renewal
and differentiation. Tumor stem cells are known to exist in
different tumors from several types of tissues and organs. Tumor
cells, especially poorly differentiated tumor cells exhibit similar
phenotypes and biological characteristics as stem cells. For
example, they both have the ability of self-renewal and
differentiation (3,4). Therefore, it may be assumed that tumor
stem cells are the source of the transformation of BE to EAC.
Octamer transcription factor-3 (OCT3) and SOX2 are the
transcription factors necessary to maintain cell totipotency; they
play critical roles in the regulation of embryo development and are
involved in self-renewal of embryonic stem cells or primordial germ
cells. OCT3 and SOX2 combine to form an OCT3/SOX2 complex, bind to
target genes in a sequence-specific manner and play a vital role in
the signal regulation network of stem cells (5,6). Our
previous studies demonstrated that according to gene chip analysis,
the expression of OCT3, SOX2 and their downstream candidate gene
TCL1/AKT1 were upregulated in BE tissue (7). Therefore, we assumed that during the
progression of the transformation of BE to EAC, OCT3 and SOX2 in
the metaplastic simple columnar epithelium were activated and
combined to form the OCT3/SOX2 complex, they switched on the
TCL1/AKT1 signal pathway, and then promoted the transformation of
epithelium cells to stem cells with the ability of continued
proliferation and differentiation. In the present study, firstly,
the expressions of OCT3, SOX2, TCL1 and AKT1 in BE and EAC tissue,
respectively, was observed, and then the stem-like cells (SP and
slow cycle cells) were isolated from EAC cell lines (OE33) and
their biological characteristics were observed. Furthermore, the
present study demonstrated the impact of OCT3 siRNA on the
expression of SOX2, TCL1 and AKT1, and described the biological
characteristics of stem-like cells.
Materials and methods
Clinical specimens
The biopsy specimens of BE from 58 patients were
obtained by endoscopy and the specimens of EAC were from surgical
ablation performed in 42 patients at the Second Affiliated Hospital
of the Third Military Medical University. At the same time, 30
normal esophagus tissue specimens were obtained through endoscopy.
Routine histopathologic analysis was performed by experienced
gastrointestinal pathologists to confirm the diagnosis. The
specimens were cut into sections, snap-frozen in liquid nitrogen
and stored at −80°C for future RNA extraction. The study was
approved by the Institutional Human Ethics Committee.
Cell lines and antibodies
Human poorly differentiated EAC cell line OE33 was
purchased from the European Collection of Cell Cultures (ECACC;
Salisbury, UK), and maintained in Dulbecco’s modified Eagle’s
medium (DMEM) supplemented with 10% fetal bovine serum (FBS) at
37°C in a humidified atmosphere of 5% CO2 and 95% air.
The cell line was established from a poorly differentiated lower
esophageal adenocarcinoma of a female Caucasian patient who had
Barrett’s metaplasia (8).
Anti-human OCT3, anti-human SOX2, anti-human TCL1 and anti-human
AKT1 antibodies were purchased from Santa Cruz Biotechnology, Inc.
(Santa Cruz, CA, USA). Anti-β-actin, horseradish peroxidase
(HRP)-coupled antibodies were from BioDev-Tech Co. (Beijing,
China).
Immunohistochemical detection
Protein expression was detected by
immunohistochemistry using the LSAB kit (Dako, Denmark) according
to the manufacturer’s instructions. The 5 μm sections made from BE,
EAC or normal esophagus tissue were deparaffinized in xylene and
microwaved in 10 mM citrate buffer (pH 6.0) to unmask the epitopes.
The OCT3, SOX2, TCL1 and AKT1 antibodies (Santa Cruz Biotechnology,
Inc.) were diluted 1:100, and the HRP-labeled secondary antibody
was diluted 1:1,000. The sections were incubated with the target
antibodies overnight at 4°C. After washing three times, the
sections were incubated with HRP-labeled antibodies for 30 min at
room temperature. Thereafter, the sections were stained for 5 min
with diaminobenzidine tetrahydrochloride (DAB), counterstained with
hematoxylin, dehydrated and mounted onto Diatex. Positive cells
showed brownish yellow nuclei or cytoplasm. Ten visual fields under
the microscope were selected and were analyzed with Image-Pro Plus
version 6.2 software (Media Cybernetics) using a special function
called ‘measurement of integrated absorbance’, which evaluates both
the area and the intensity of positive staining. Using this
function, integrated absorbance of all positive staining of the
proteins in each image was measured and its proportion of the total
area of each image was calculated. The density of β-actin was used
as positive control and buffer at the same concentration was used
as negative control.
Protein extraction and western blot
analysis
Total cellular protein was extracted on ice for 30
min in lysis buffer [50 mmol/l Tris-HCl, 150 mmol/l NaCl, 5 mmol/l
EDTA, 1 mmol/l phenylmethylsulfonyl fluoride (PMSF) and protease
inhibitors (PIs)]. For western blot analyses, 50 μg protein from
each sample was denatured in 2X loading buffer at 100°C for 5 min,
separated by sodium dodecyl sulfate-polyacrylamide gel
electrophoresis (SDS-PAGE) gel and then transferred onto a
nitrocellulose membrane. The membranes were then incubated in 5%
skim milk at room temperature for 2 h, followed by addition of the
first antibody (1:1,000) and incubation at 4°C overnight. The
following day, the membranes were washed three times with
phosphate-buffered saline (PBS), followed by incubation with the
secondary antibody at room temperature for 2 h. The protein bands
were finally visualized on X-ray film using ECL. The images were
subjected to grayscale analysis using BandScan software.
Primer pairs and hydrolysis probe for
real-time PCR
The primers and hydrolysis probes for OCT3, COT4,
SOX2 and GAPDH were designed by Universal Probe Library Assay
Design Center (Roche, Mannheim, Germany) (Table I). The primers were synthesized by
TIB MolBiol (USA) and the hydrolysis probe was purchased from
Roche.
 | Table IThe primers of OCT3 and SOX2. |
Table I
The primers of OCT3 and SOX2.
| Gene | Primer
sequences | Location | Length (bp) | No. |
|---|
| OCT3/4 | F:
5′-AGCAAAACCCGGAGGAGT-3′ | 443–460 | 114 | #35 |
| NM_002701 | R:
5′-CCACATCGGCCTGTGTATATC-3′ | 536–556 | | 4687680001 |
| SOX2 | F:
5′-TTGCTGCCTCTTTAAGACTAGGA-3′ | 76–98 | 75 | #35 |
| NM_003106 | R:
5′-CTGGGGCTCAAACTTCTCTC-3′ | 131–150 | | 4687680001 |
| GAPDH | F:
5′-AGCCACATCGCTCAGACA-3′ | 83–101 | 66 | #60 |
| R:
5′-GCCCAATACGACCAAATCC-3′ | 130–148 | | 4688589001 |
| OCT3/4 | F:
5′-TCCCTTCGCAAGCCCTCAT-3′ | −2–17 | 408 | |
| Specific | R:
5′-TGACGGTGCAGGGCTCCGGGGAGGCCCCATC-3′ | 376–406 | | |
RNA isolation, RT-PCR and real-time
RT-PCR analysis
RNA was extracted from tissue samples using the High
Pure RNA Tissue kit (Roche) and from cell lines using the RNeasy
Mini kit (Qiagen, Hilden, Germany) according to the manufacturer’s
recommendations. The cDNA preparation from total RNA was performed
with 500 ng RNA (20 μl total volume) using the Script cDNA
Synthesis kit (Bio-Rad, Munich, Germany). Quantitative analysis of
target gene transcripts was performed by real-time RT-PCR using the
QuantiTect SYBR-Green PCR kit (Qiagen). For the amplification, an
initial denaturation at 95°C for 15 min, followed by 15 sec at
94°C, 30 sec at 55°C and 30 sec at 72°C for 35 cycles was used.
Samples were run on a LightCycler® 480 Real-Time PCR
system (Roche). The relative expressions were calculated by
normalization to GAPDH gene expression.
Isolation of side population (SP) and
main population (MP) cells from the OE33 cell line using Hoechst
33342 dye
The cells were suspended in pre-warmed RPMI-1640
containing 2% FBS and 2 mM HEPES (HBSS) at 1×10⁶
cells/ml at 37°C for 10 min, and incubated at 37°C for an
additional 90 min in a shaking bath with 5 μg/ml (8.1 μM) Hoechst
33342 dye. Control cells were incubated with 50 μM verapamil
(Sigma, St. Louis, MO, USA) for 15 min at 37°C before Hoechst dye
addition. After centrifugation at 1,300 rpm at 4°C for 5 min, cells
were washed and resuspended in cold HBSS containing 20 μg/l PI and
then placed immediately on ice. The SP/MP cells were gated
separately and analyzed using an LSR II flow cytometer (BD
Biosciences, San Jose, CA, USA). The blue light signal was
collected by a 450/20 band pass filter, and the red light signal
was collected by a 675 nm pass filter. PI-positive dead cells were
removed. Among the PI-negative cells, Hoechst 33342-negative or
weakly-positive cells were considered the SP subgroup, and Hoechst
33342-positive cells were considered the MP group.
Isolation of slow cycle cells and rapid
cycle cells from the OE33 cell line by Dil dye
Cells were incubated at 37°C for 5 min with 5 μl/ml
Dil dye. Then, the cells were washed three times with RPMI-1640 to
remove the Dil dye. After culturing for 5–6 weeks, only very few
cells were illuminated under the inverted fluorescence microscope.
Next, the cells were isolated using the LSR II flow cytometer and
the red light signal was collected by an 585/40 nm filter. Slow
cycle cells were Dil-positive and rapid cycle cells were
Dil-negative.
Colony forming efficiency assay
The isolated cells were plated at 300 cells/well in
a six-well tissue culture plate and grown for 14 days until
macroscopic cell clones were demonstrated. The cells were then
fixed with 95% cold methanol for 15 min at 4°C and stained with
0.5% methylene blue solution for 2 min in order to count the number
of colonies by microscopy. Colony forming efficiency was calculated
as the percentage of single cells that generated colonies at day
14. Cell clone formation rate = (number of clones/300) × 100%.
In vitro invasion assay
In the Transwell chamber assay (Chemicon, USA), 50
μl cell suspension (1×10⁵ cells/ml) was added into the
chamber’s upper insert. After 24 h in cell culture, the internal
cell layer was scraped from the chamber, fixated with 10% formalin,
Giemsa stained and membrane-penetrating cells were counted.
siRNA construction and cell
transfection
Three OCT3, SOX2 siRNA sequences purchased from
Qiagen (USA) were sequenced and blast compared. The results
confirmed consistency with human OCT3 and SOX2 cDNAs as registered
in GenBank. These sequences were mixed with Oligofectamine
(Invitrogen, USA) to obtain a concentration of 100 nM, and then
transfected into OE33 cells (1×10⁵ cells/ml). At the
same time, the blank control group (ConB), void vector group (ConA)
and negative transfection group (ConN) were placed. PBS was added
to the ConB group. Void vectors of the same concentration were
added to the ConA group. Negative sequences to the target genes
were added to the ConN group.
Statistical analysis
Data are summarized as means ± SD from three or more
independent experiments. Statistical analysis was performed by
using two-tailed Student’s t-test for paired data. p<0.05 was
considered to indicate a statistically significant difference.
Results
The expressions of OCT3, SOX2, TCL1 and
AKT1 increase in BE tissue compared to normal esophagus tissue,
respectively, but decrease compared to EAC tissue
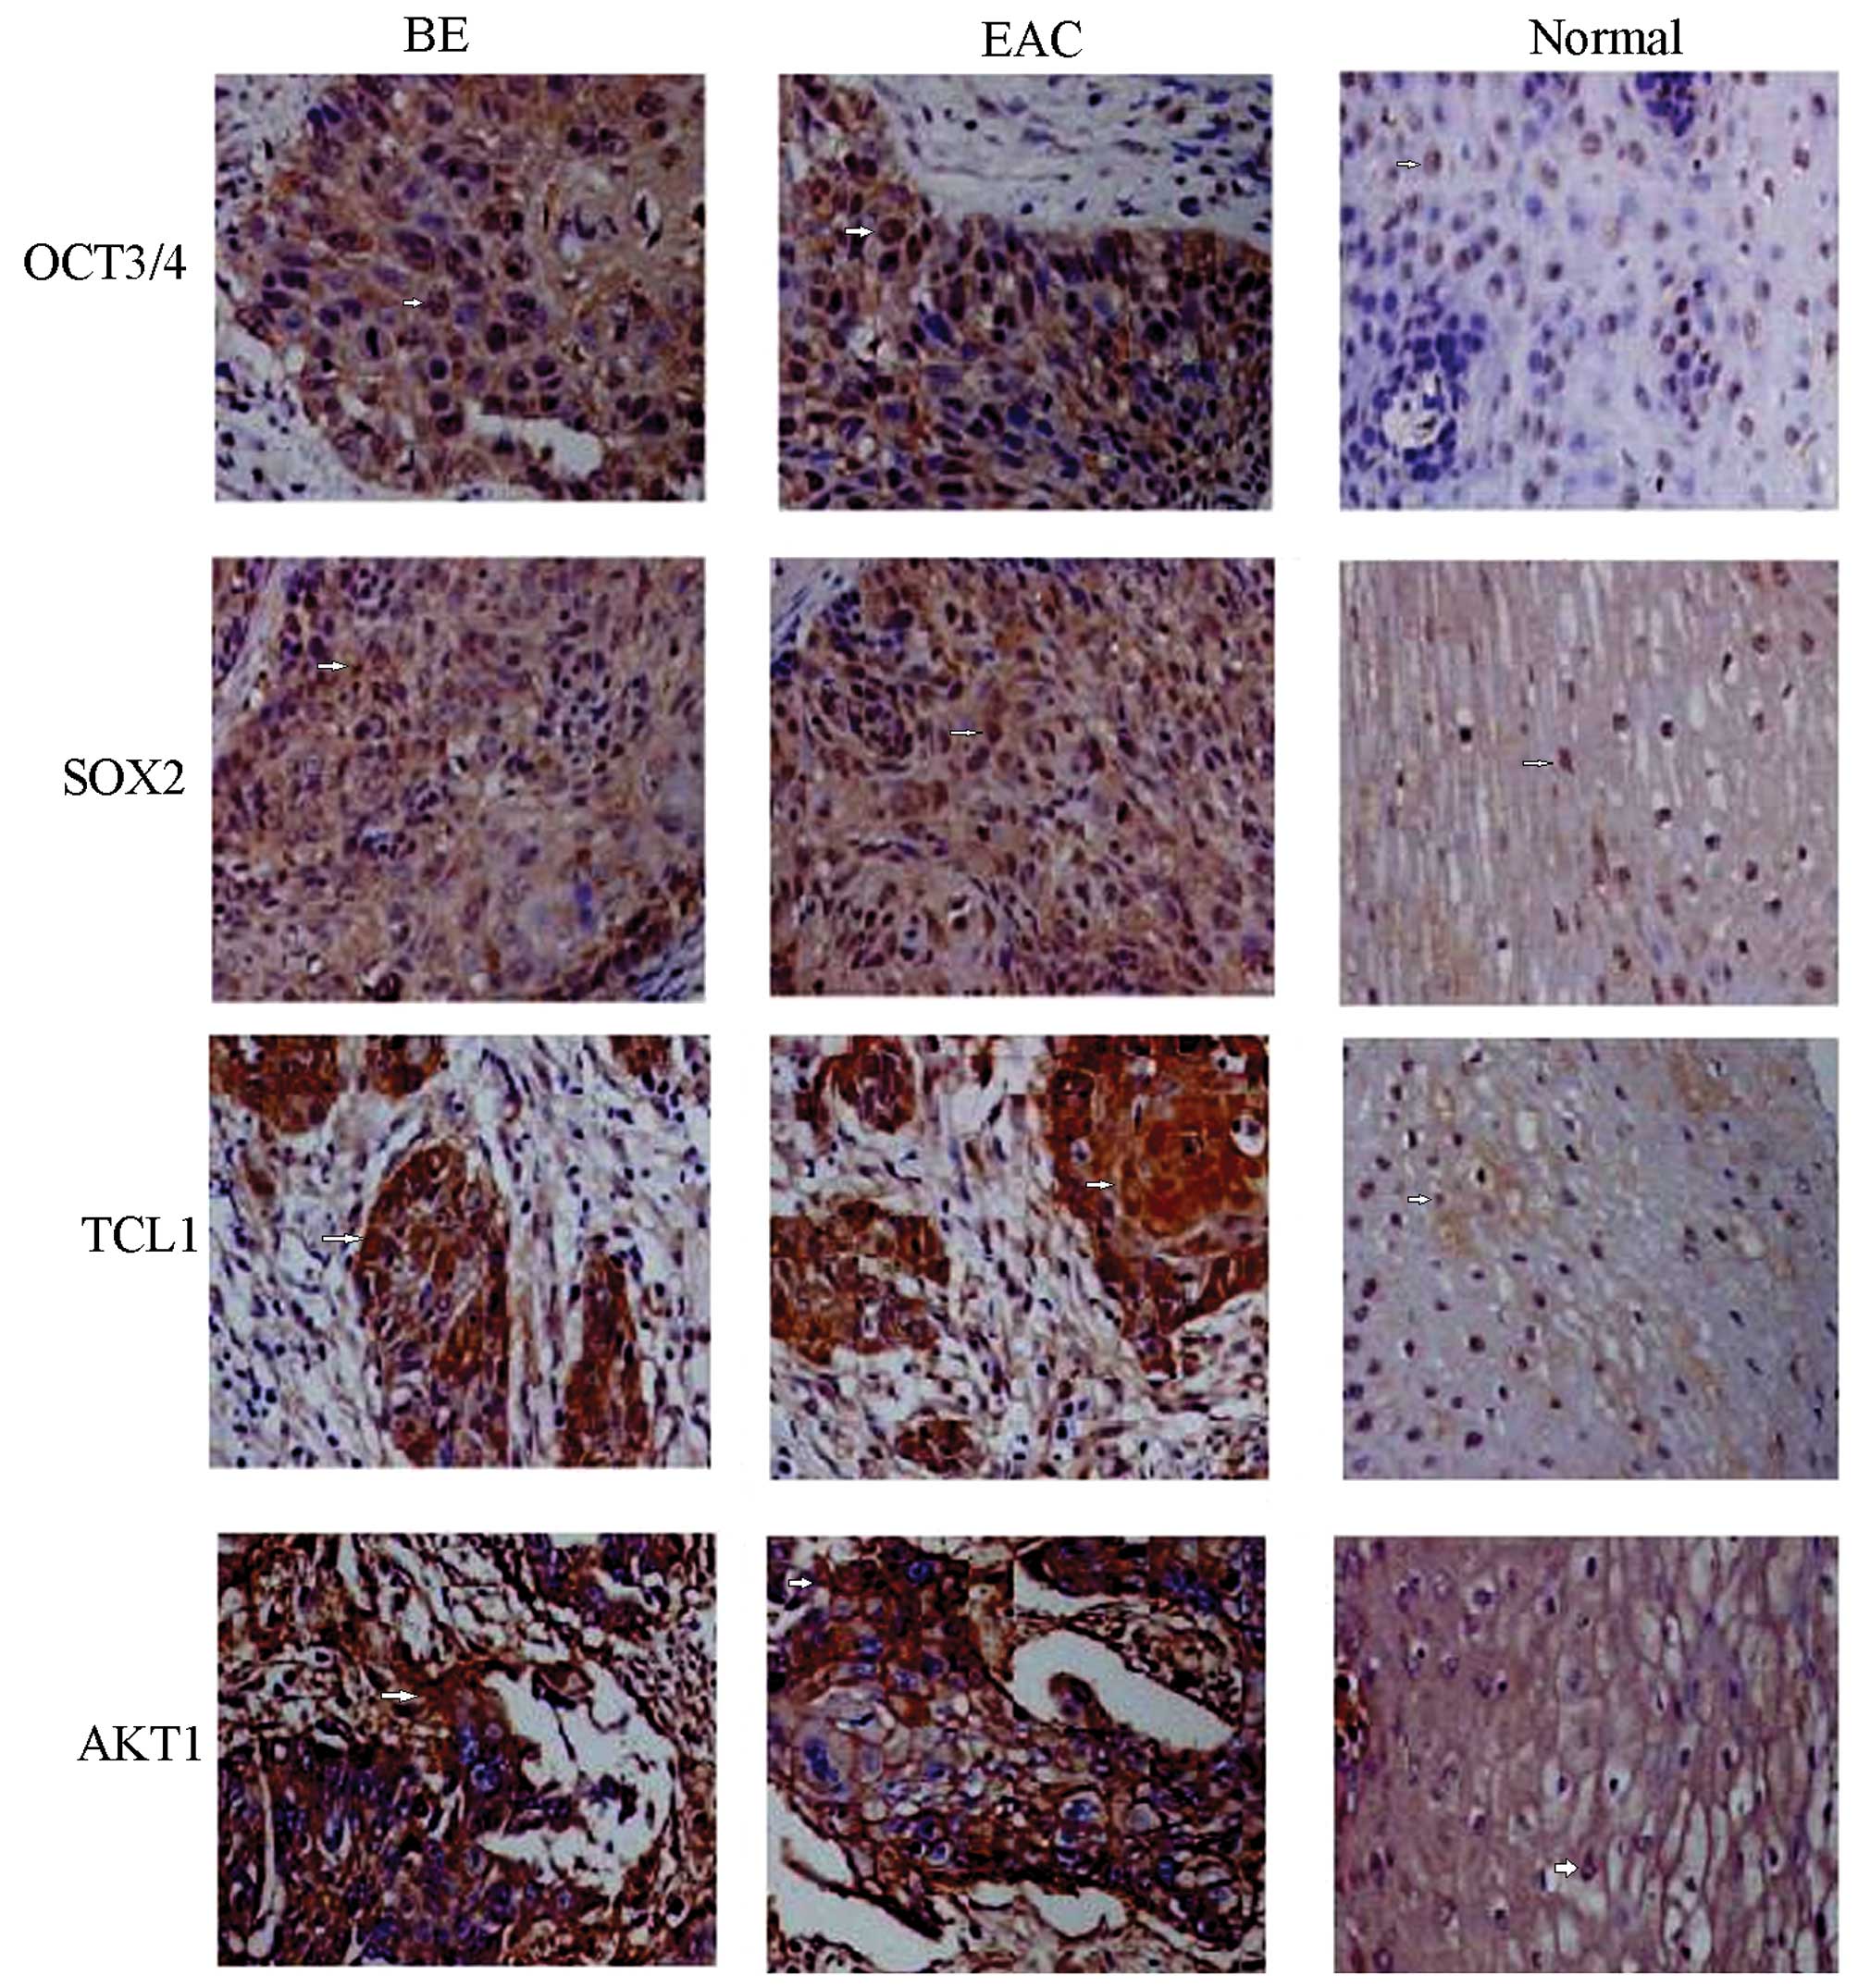
Immunohistochemical detection showed positive
staining of OCT3, SOX2, TCL1 and AKT1 proteins, demonstrated by
yellow or brown color and mainly located in cell nuclei (Fig. 1). Only traces of the expression of
the proteins mentioned above were detected in normal esophagus
tissue, but expression was elevated in BE tissue and EAC tissue.
Analysis of areas of positive expression using the Image-Pro Plus
system indicated that the absorbance values, and total absorbance
values of the four proteins mentioned above were increased in BE
tissue compared to normal tissue (p<0.01) but decreased compared
to EAC tissue (p<0.05), respectively (Table II).
| Table IIThe expression of OCT3, SOX2, TCL1
and AKT1 detected by immunohistochemistry (mean ± SD). |
Table II
The expression of OCT3, SOX2, TCL1
and AKT1 detected by immunohistochemistry (mean ± SD).
| | OCT3/4 | SOX2 |
|---|
| |
|
|
|---|
| Groups | n | Area
(μm2) | Density | Absorbance | Area
(μm2) | Density | Absorbance |
|---|
| EAC | 42 | 4267±446 | 0.33±0.06a | 1515±417a | 5386±568 | 0.42±0.07a | 2268±526a |
| BE | 58 | 4063±434 | 0.20±0.03b | 809±129b | 5568±464 | 0.22±0.03b | 1085±146b |
| Normal | 30 | 4139±188 | 0.08±0.03 | 326±48 | 5033±126 | 0.06±0.02 | 332±38 |
|
| | TCL1 | AKT1 |
| |
|
|
| Groups | n | Area
(μm2) | Density | Absorbance | Area
(μm2) | Density | Absorbance |
|
| EAC | 42 | 4487±446 | 0.37±0.05a | 1678±438a | 4267±446 | 0.33±0.06a | 1515±417a |
| BE | 58 | 4218±334 | 0.21±0.03ab | 842±136ab | 4063±334 | 0.20±0.03ab | 829±129ab |
| Normal | 30 | 4213±188 | 0.06±0.03 | 232±36 | 3987±198 | 0.04±0.03 | 152±16 |
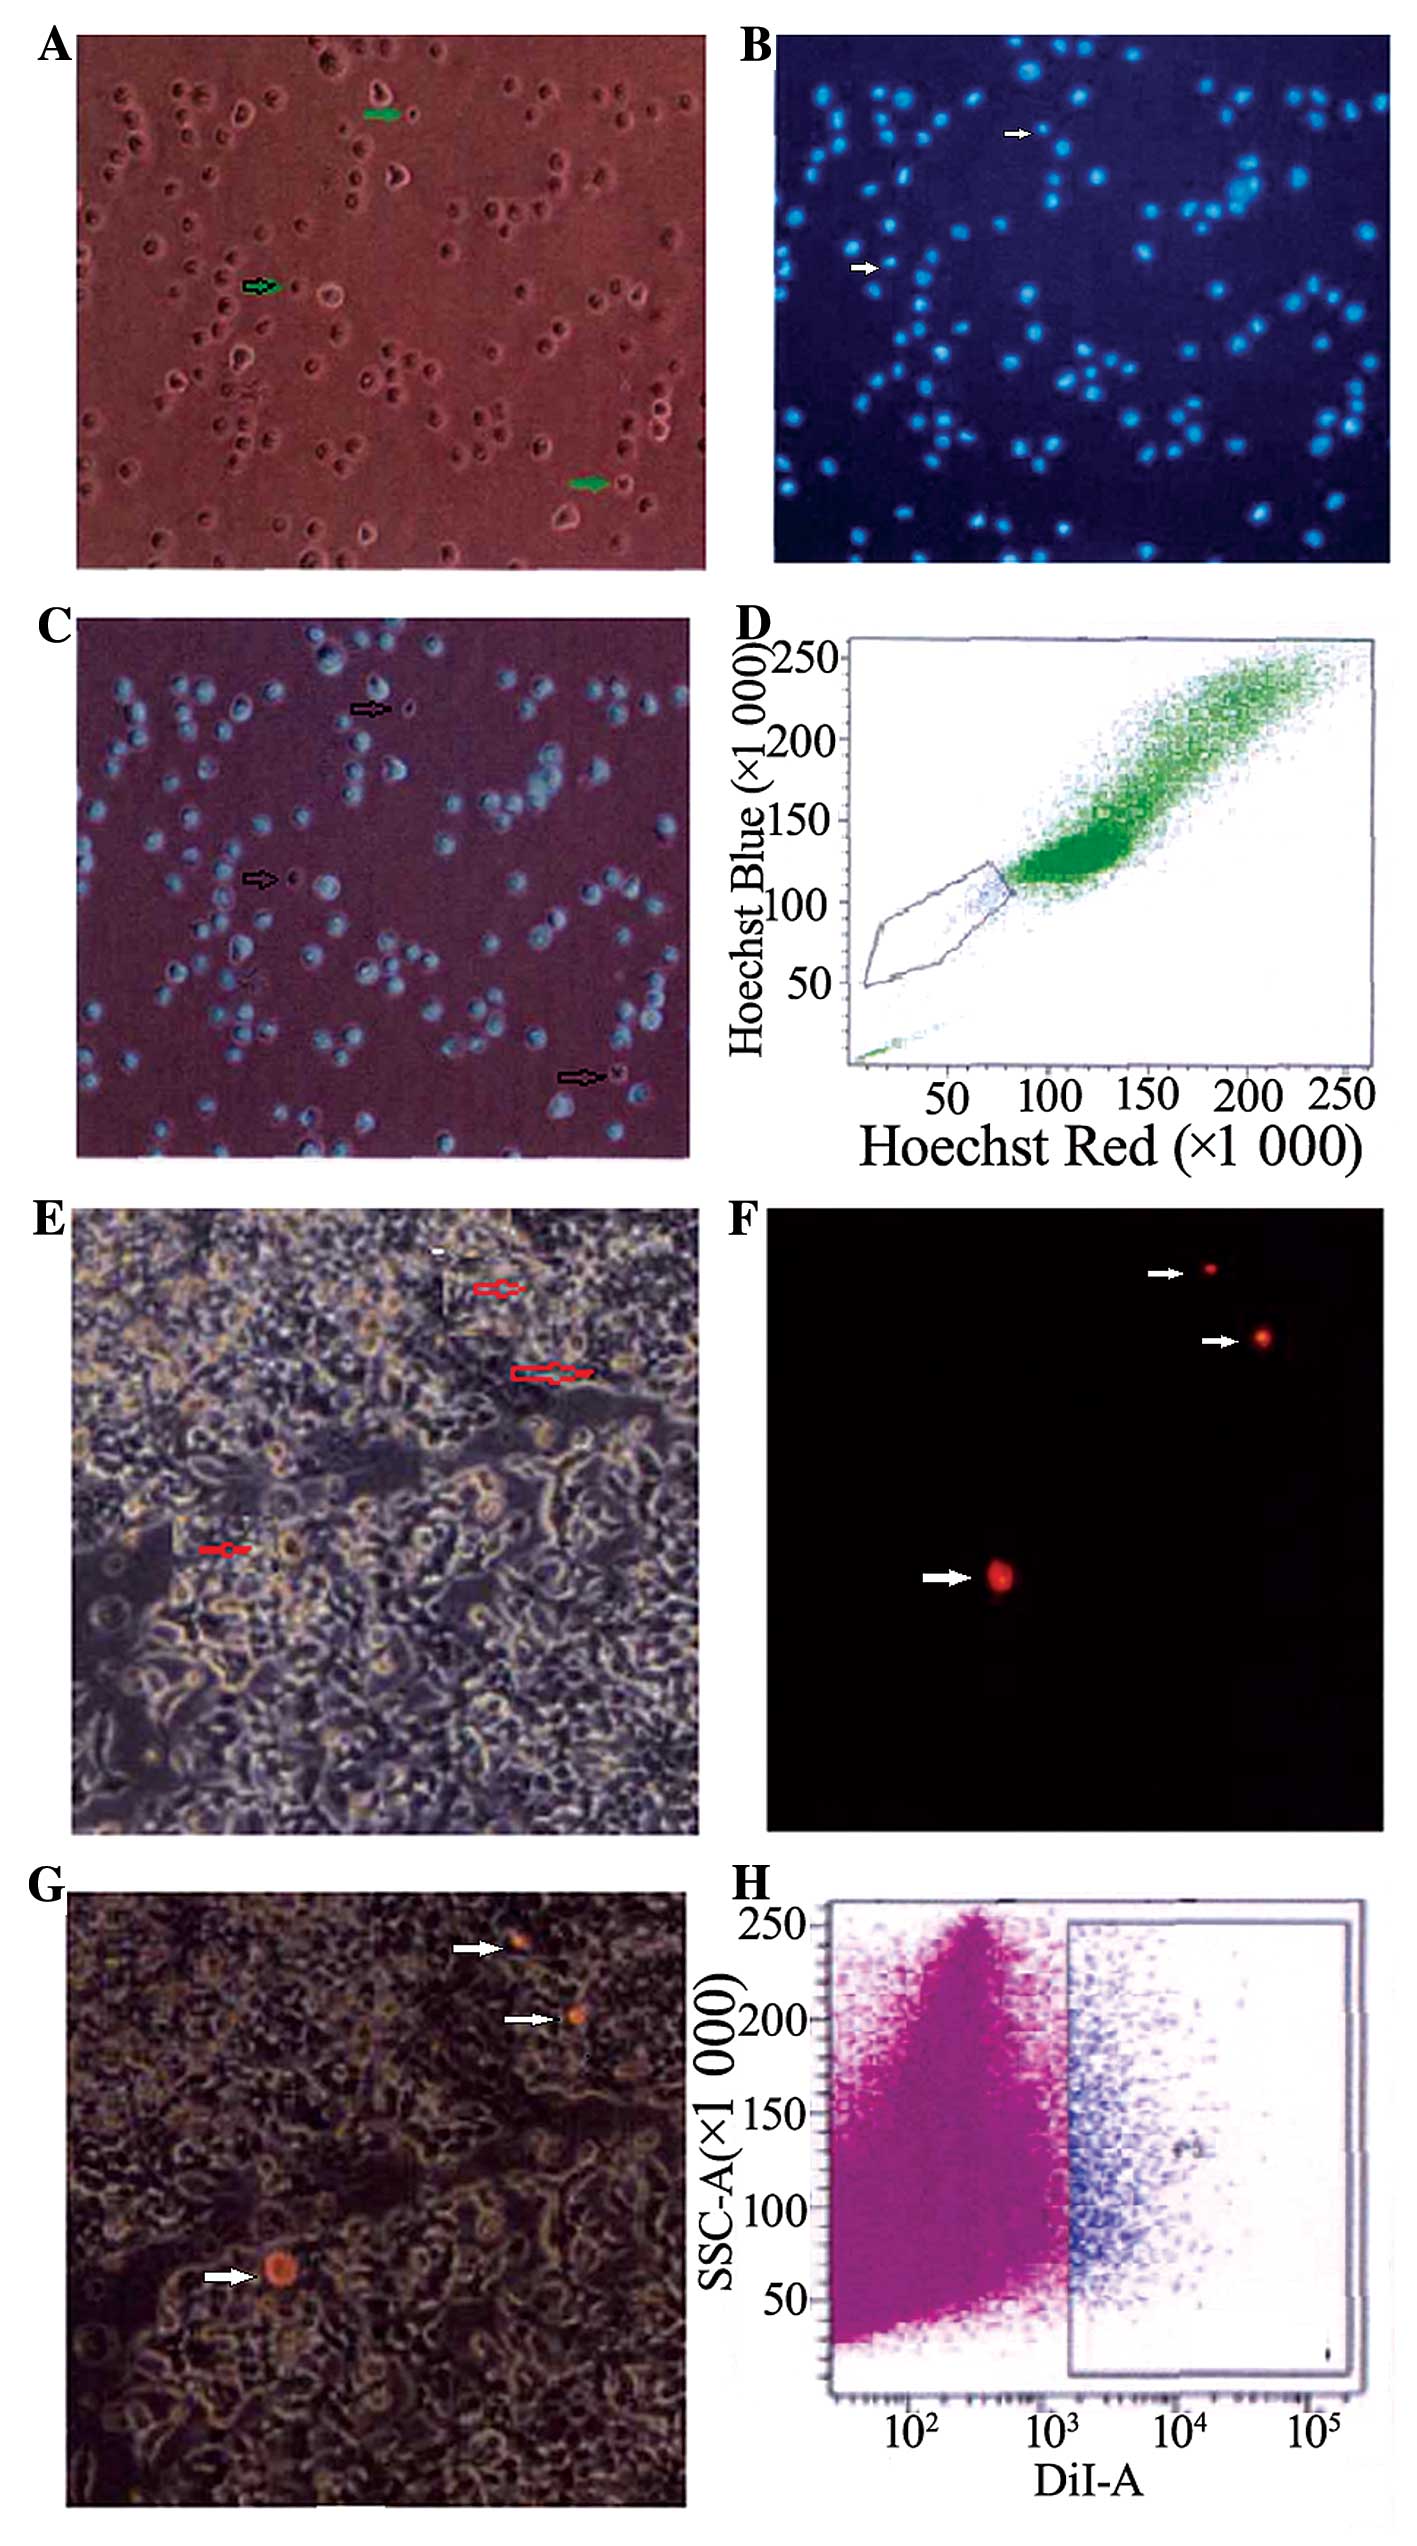
SP cells and slow cycle cells are
isolated from the EC33 cell line
Most of the EC33 cells exhibited fluorescence after
dyeing with Hoechst 33342, but there were still a few cells that
did not show any fluorescence, and these were SP cells, and the
others were MP cells. SP cells were smaller than MP cells observed
under fluorescence microscope. As analyzed by FCM, the proportion
of SP cells among all EC33 cells was ~1.2±0.18% located in the
bottom left quadrant. After dyeing with Dil and culturing for 5–6
weeks, most EC33 cells did not exhibit any red fluorescence. Only a
few cells exhibited red fluorescence, and these were slow cycle
cells, and others were quick cycle cells. Slow cycle cells were
smaller than quick cycle cells. The proportion of slow cycle cells
among all cells was ~1.4±0.26%, analyzed by FCM (Fig. 2).
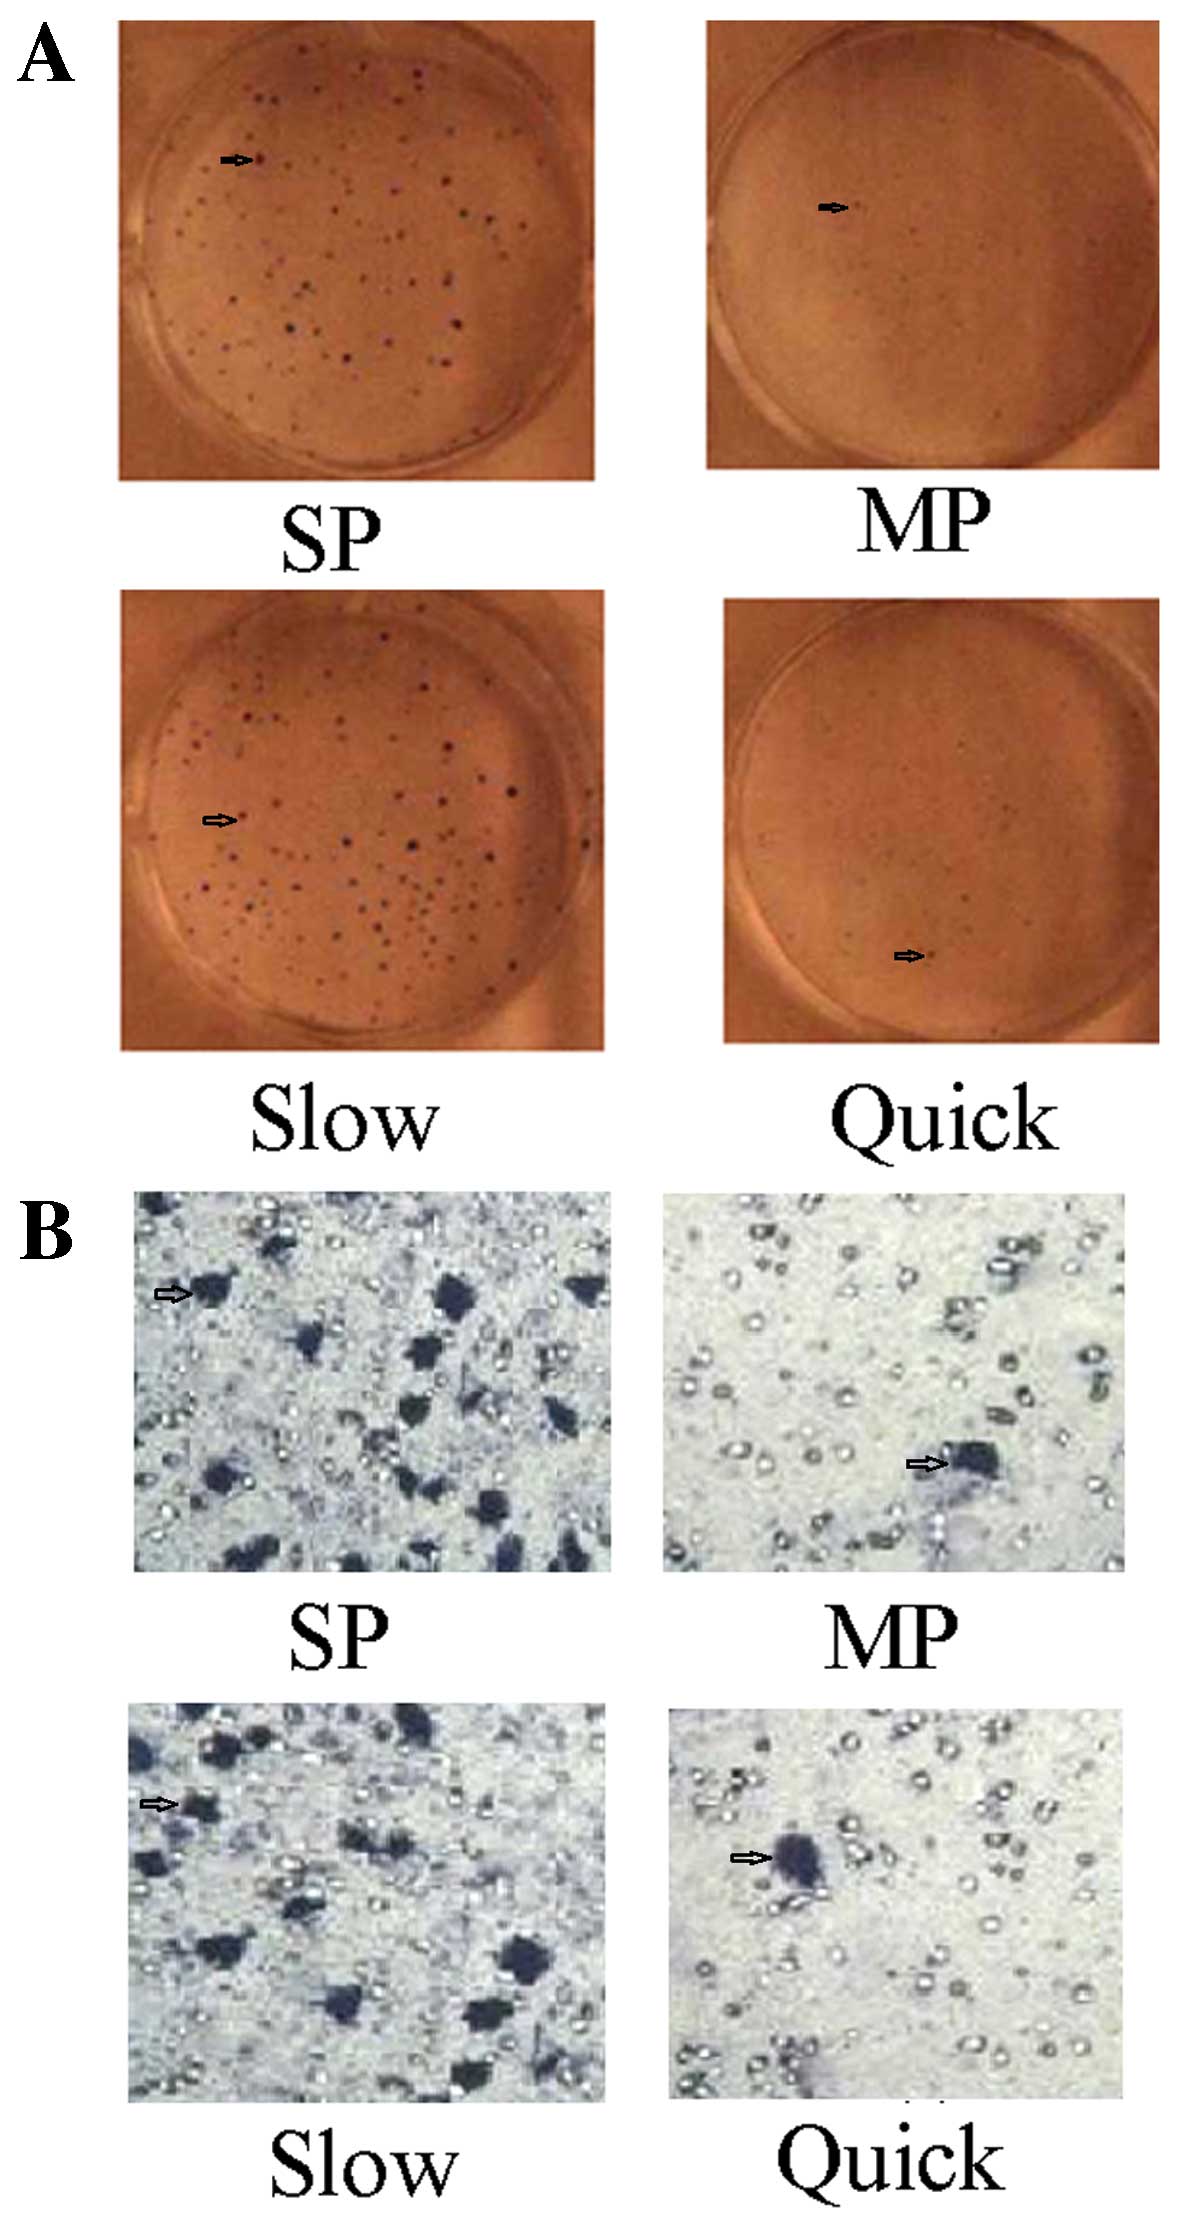
The ability of clone formation and the
invasion of SP cells and slow cycle cells are strengthened
The plate clone formation test showed the number of
clones formed by SP cells was 186±24, and the rate of clone
formation was 58.65±6.32%. The number of clones formed by MP cells
was 68±18, and the rate of clone formation was 22.6±2.44%. There
was a statistically significant difference between SP and MP cells
(t=3.486, p<0.01). The number of clones formed by slow cycle
cells (192±46) and the rate of clone formation (61.82±7.63%) were
statistically significantly higher compared to the quick cycle
cells (58±11, 17.2±1.2%) (t=5.326, p<0.01) (Fig. 3A). The Transwell chamber assay
showed the Transwell rate of SP cells was 38.25±5.68%, compared to
a Transwell rate of MP cells of 2.36±0.23%. There was a
statistically significant difference between SP and MP cells
(t=3.586, p<0.01). The Transwell rate of slow cycle cells
(42.34±6.86%) was statistically significantly increased compared to
quick cycle cells (1.86±1.12%) (t=5.462, p<0.01) (Fig. 3B).
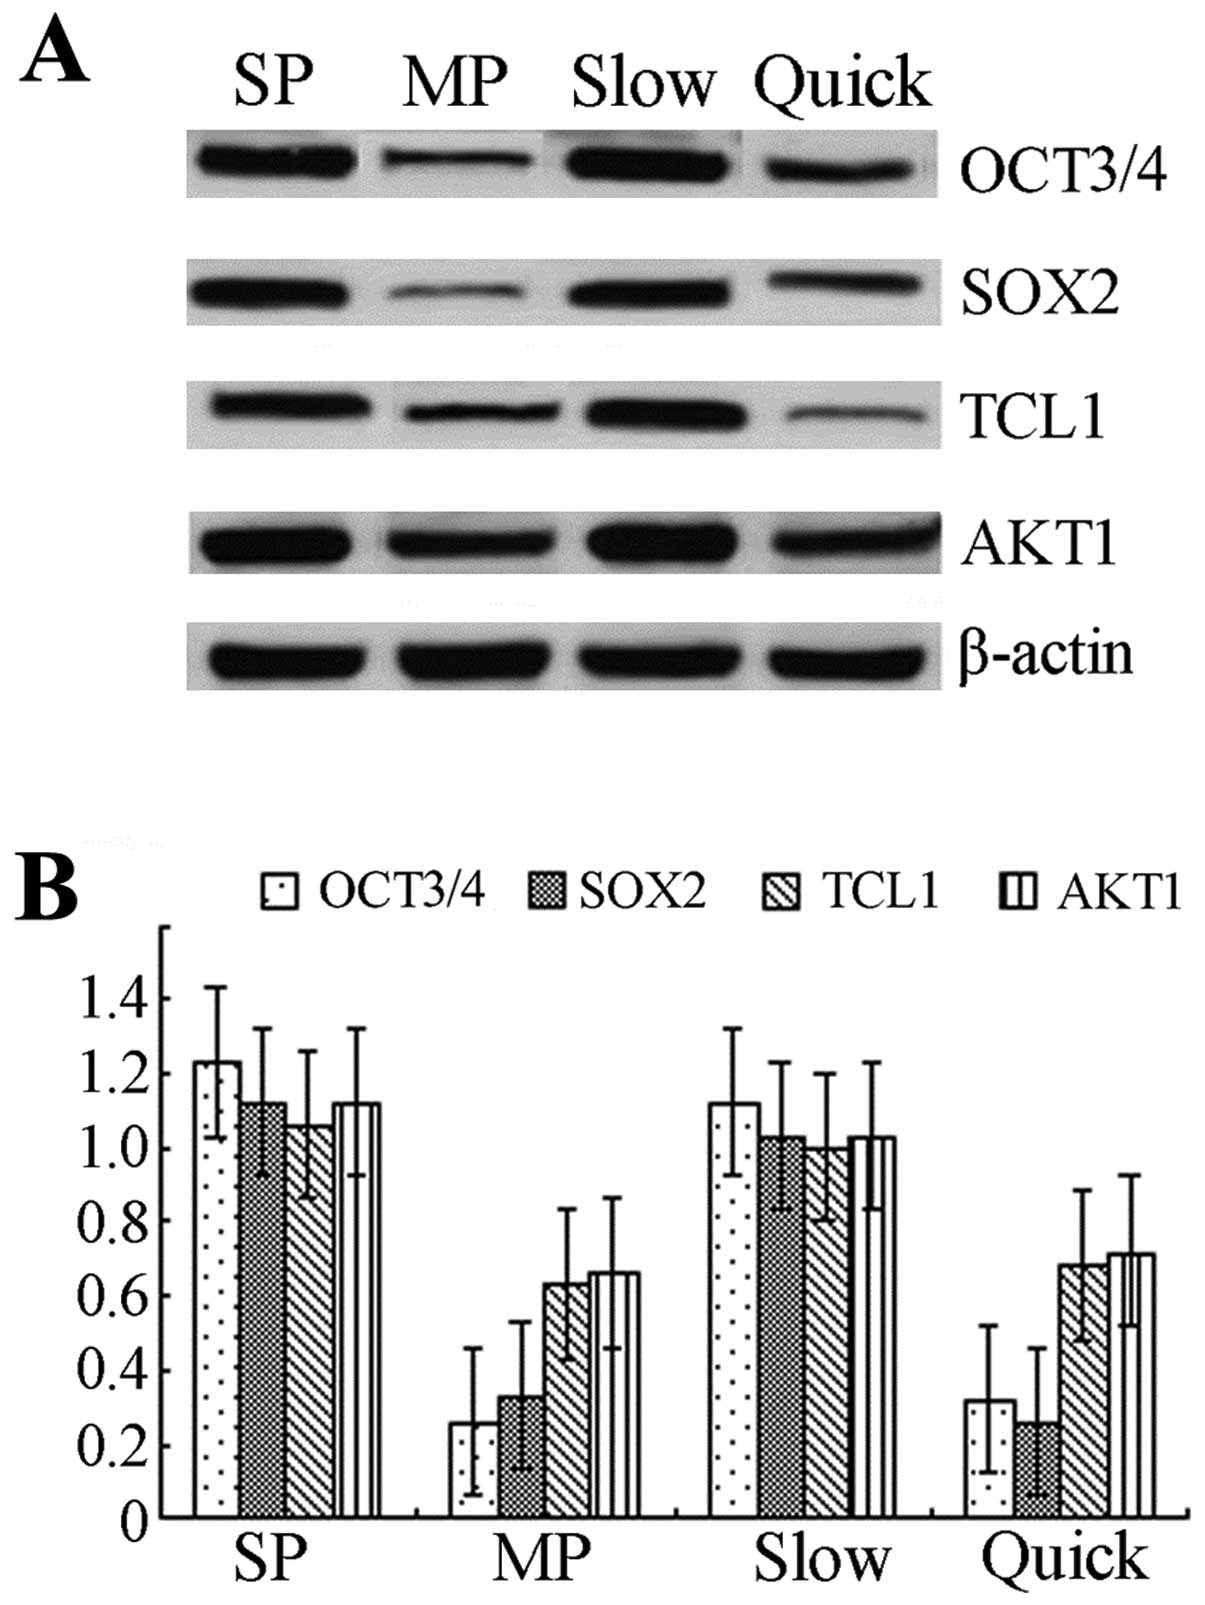
The expressions of OCT3, SOX2, TCL1, AKT1
protein/mRNA are elevated in SP or slow cycle cells
Western blotting showed that the expressions of OCT3
and SOX2 protein were increased >2-fold in SP cells compared to
MP cells, and the expressions of TCL1 and AKT1 in SP cells were
also elevated. The expression of OCT3 protein in slow cycle cells
was >2-fold the expression observed in quick cycle cells. The
expressions of SOX2, TCL1 and AKT1 were statistically significantly
elevated in slow cycle cells compared to quick cycle cells
(p<0.05) (Fig. 4A). mRNA levels
were determined by real-time RT-PCR and the results showed that
mRNA levels of OCT3, SOX2, TCL1, AKT1 in SP/slow cycle cells were
statistically significantly elevated compared to MP/quick cycle
cells (p<0.05) (Fig. 4B).
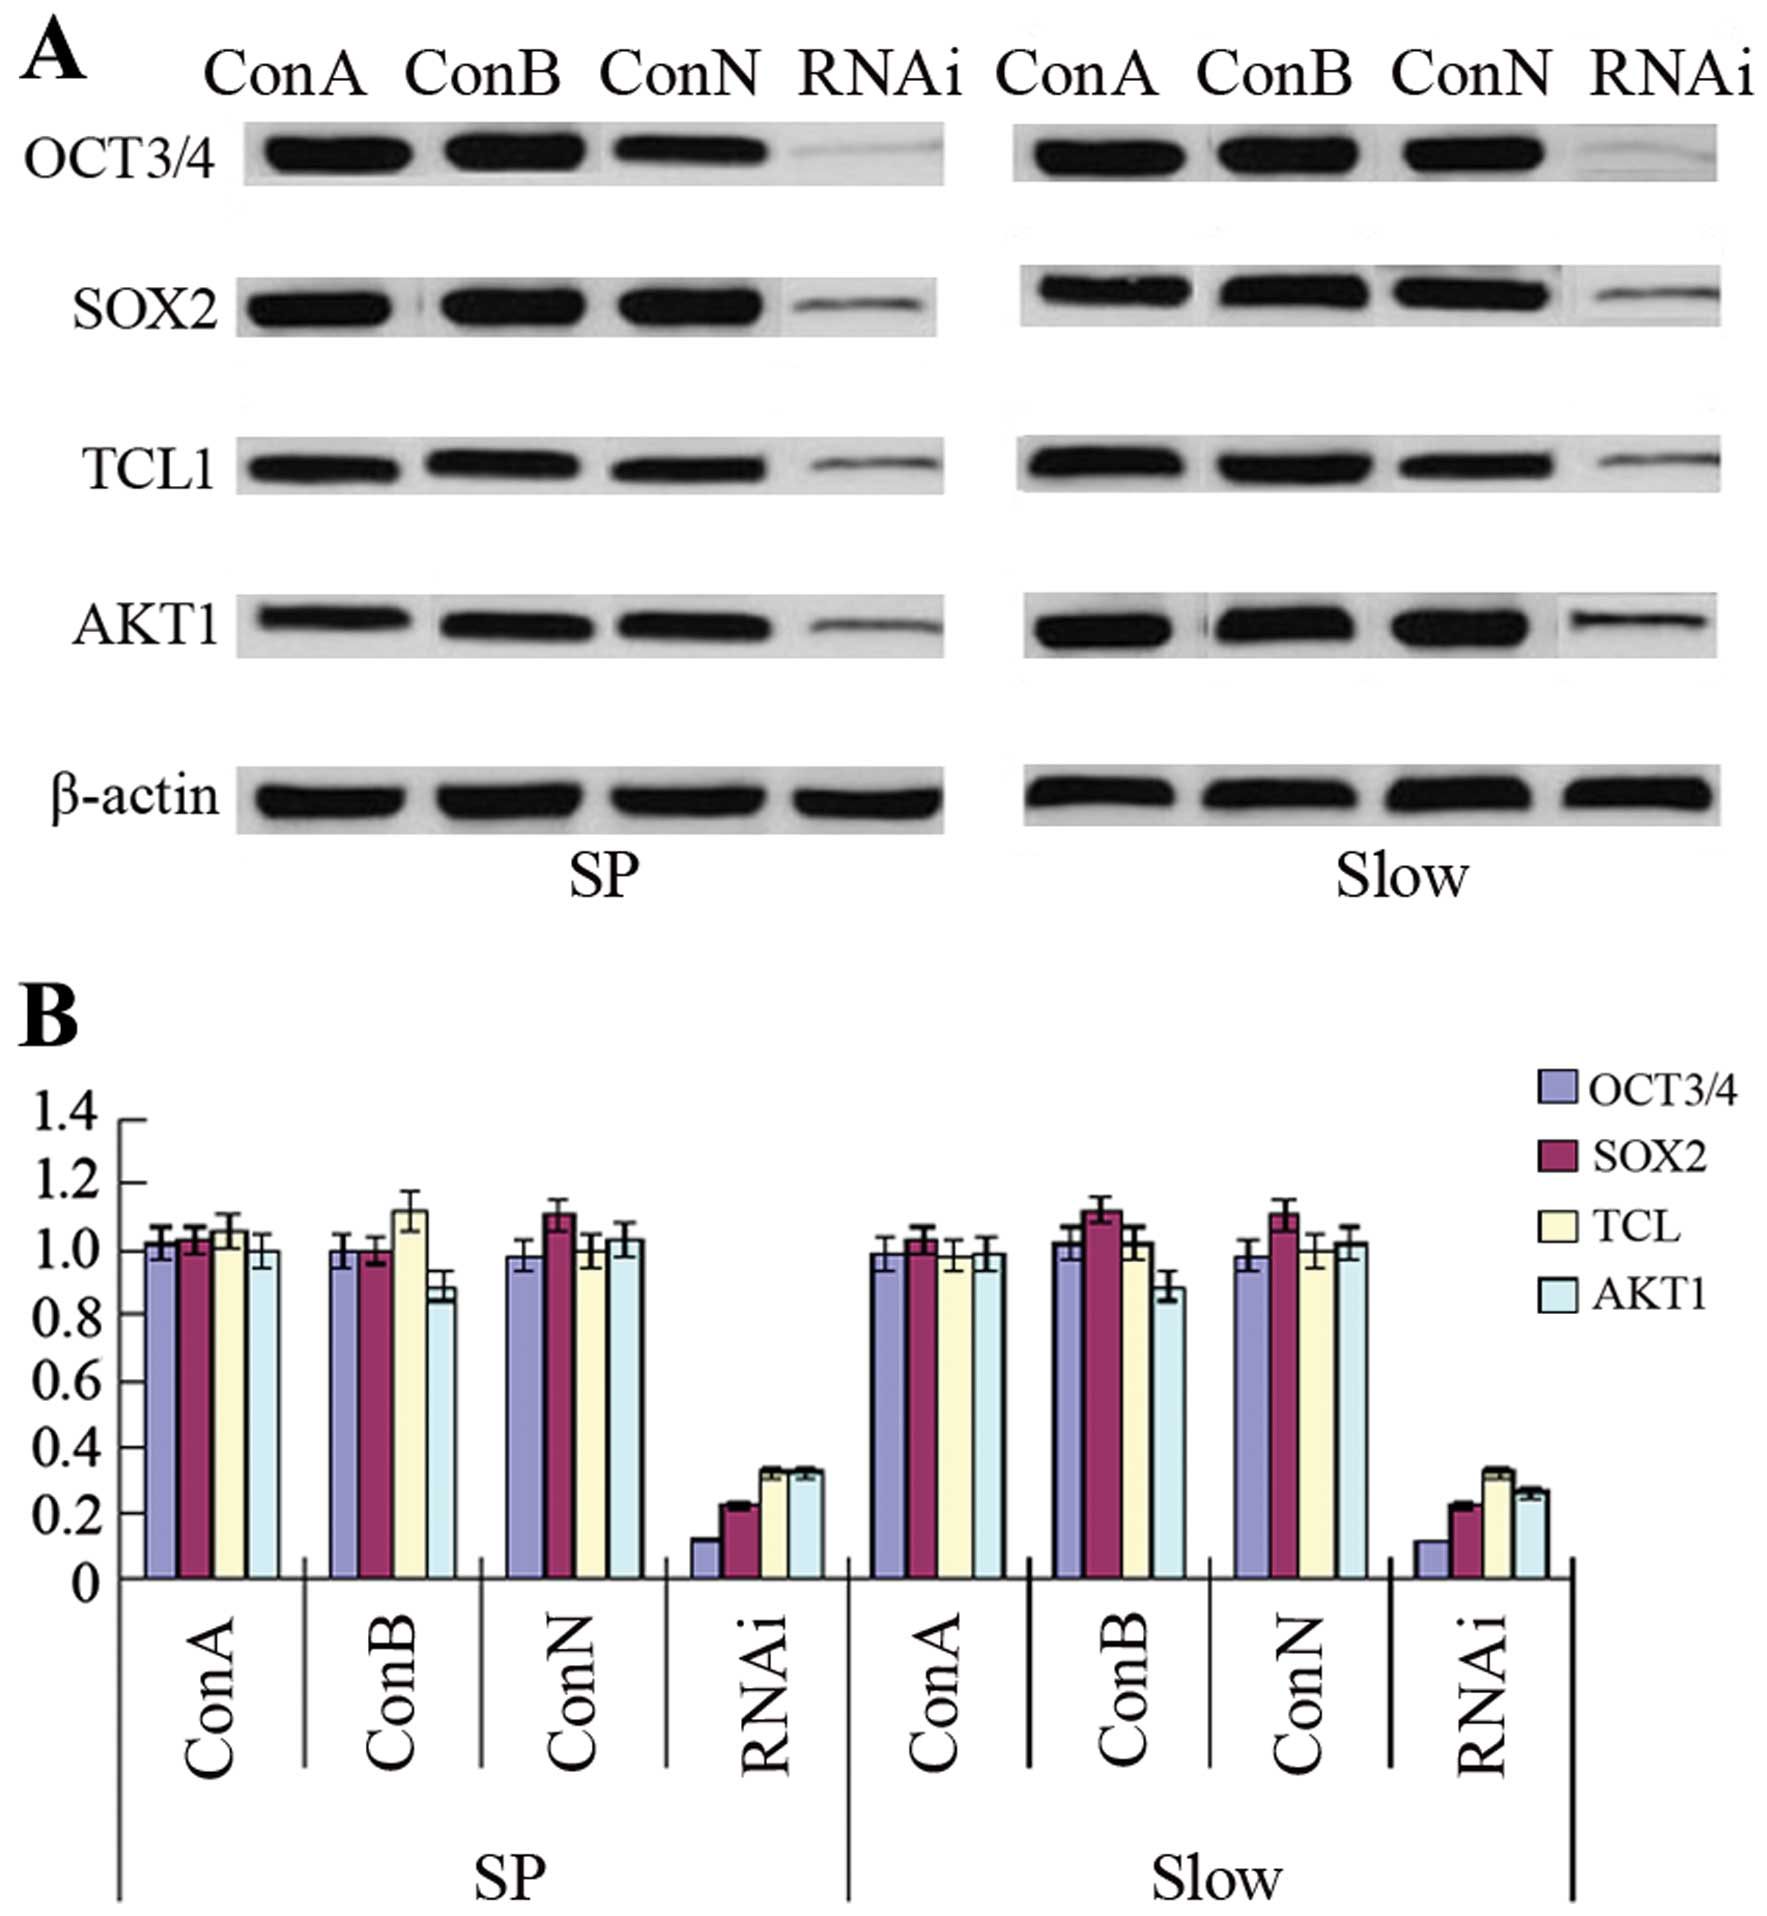
OCT3-siRNA downregulates the expression
of SOX2, TCL1 and AKT1
After transfection of OE33 SP cells or slow cycle
cells with OCT3-siRNA, the expression of OCT3 was statistically
significantly decreased compared to control groups, including ConA,
ConB or ConN (p<0.01). Furthermore, downregulation of OCT3
expression by siRNA reduced the expression of SOX2, TCL1 and AKT1
protein or mRNA statistically significantly compared to control
groups (p<0.01) (Fig. 5).
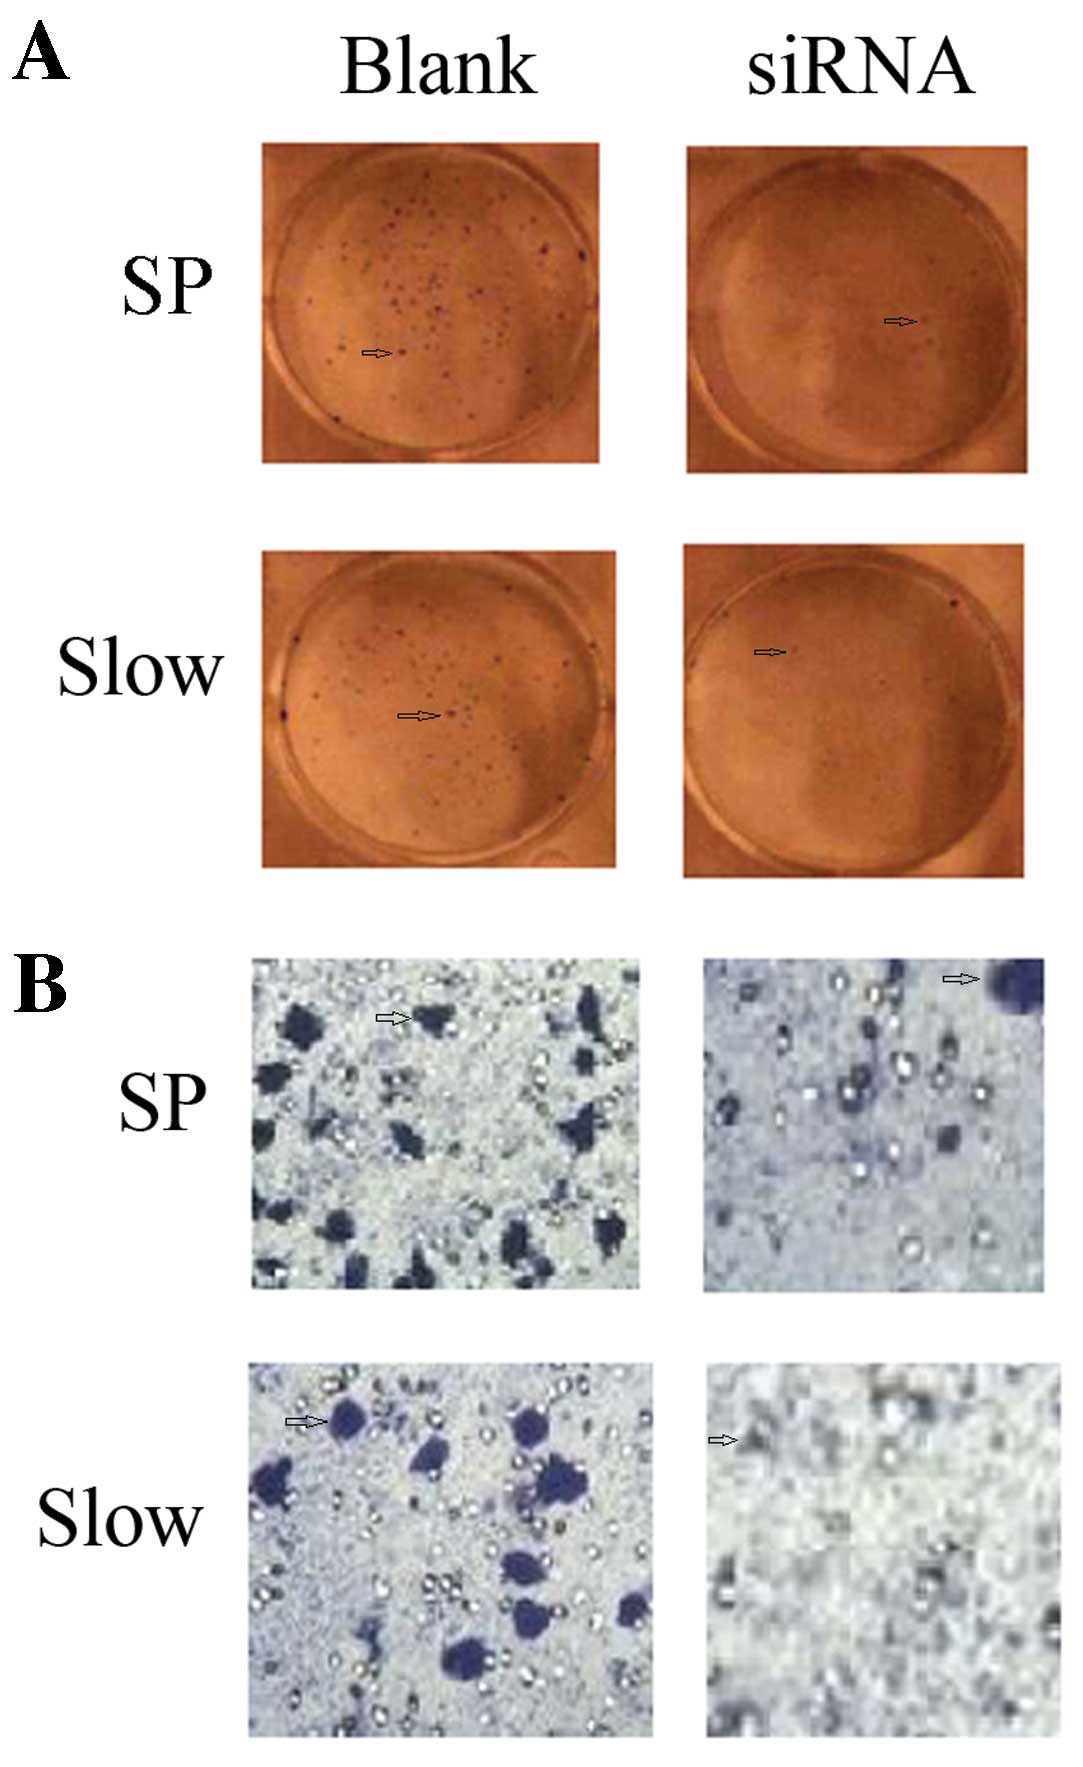
Downregulation of OCT3 expression by
siRNA inhibits the ability of clone formation and invasion
The plate clone formation test showed that the
number of clones formed by SP or slow cycle cells is reduced by
OCT3-siRNA. The invasion ability determined by Transwell chamber
assay indicated a reduced number of Transwelled cells for SP or
slow cycle cells after inhibition of OCT3 by siRNA (Fig. 6).
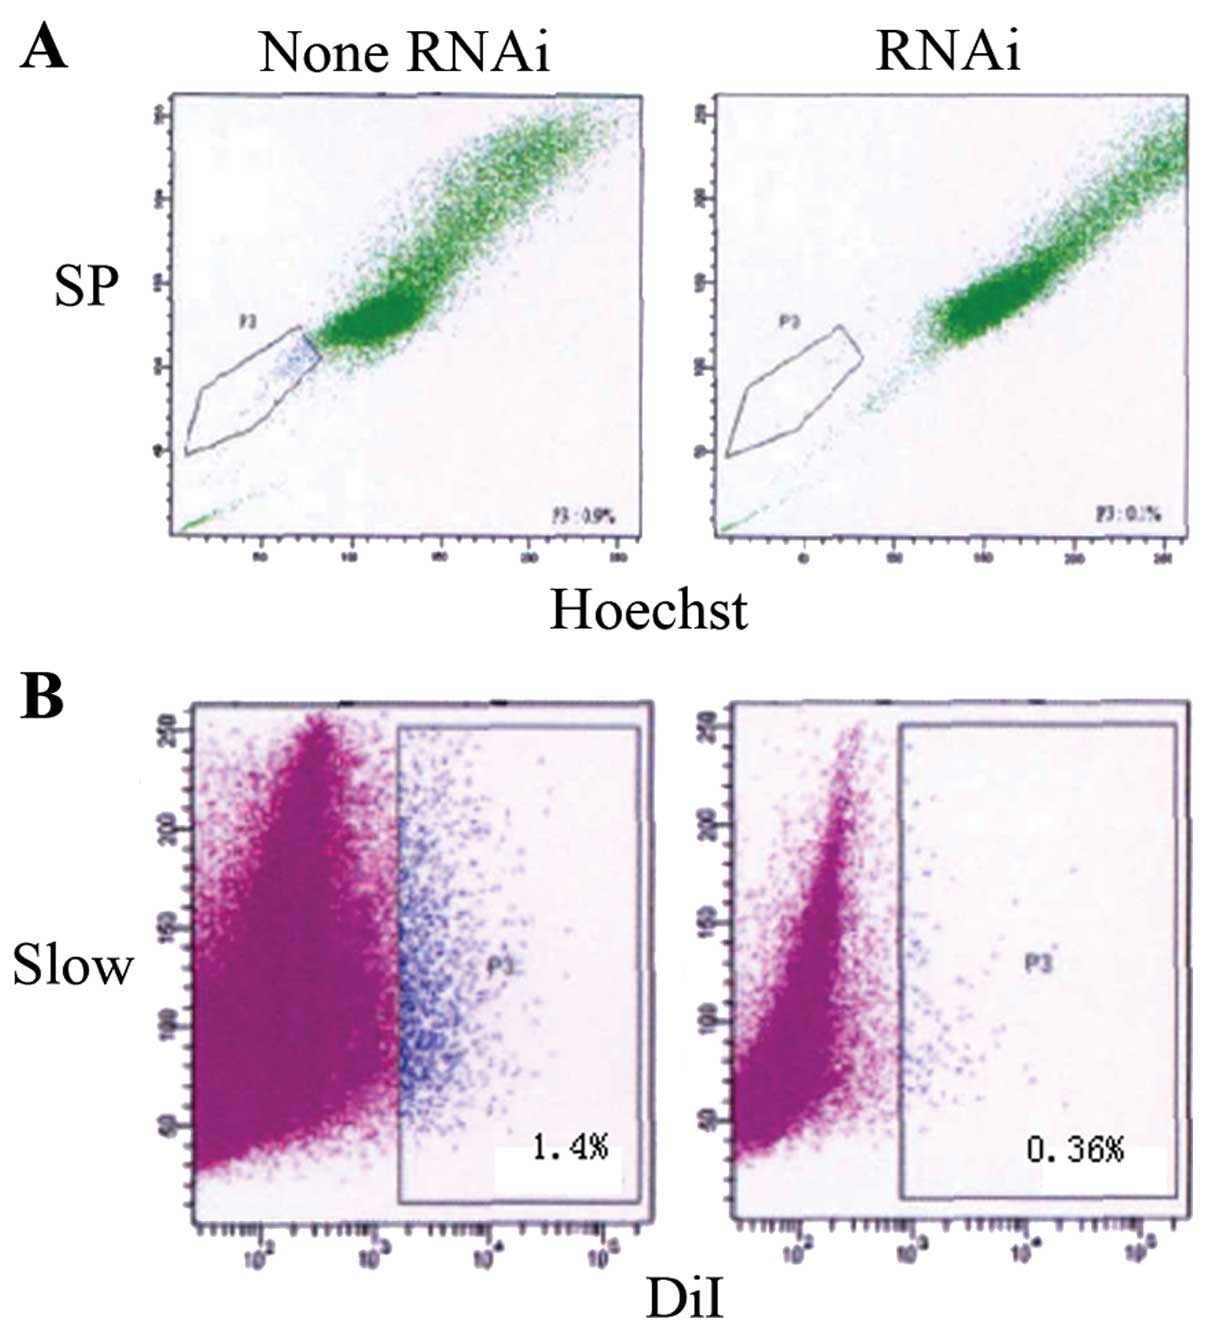
OE33 cell transfection with OCT3-siRNA
reduces the number of SP cells and slow cycle cells
In order to explore the effects of OCT3-siRNA on
tumor stem-like cells in OE33 cells, OE33 cells were transfected
with siRNA. After inhibition of OCT3, Hoechst 33342 dyeing showed
statistically significantly fewer SP cells being isolated compared
to the control with no addition of OCT3-siRNA (0.34±0.08 vs.
1.2±0.56%, p<0.05). Moreover, statistically significantly fewer
slow cycle cells were detected by Dil dyeing (0.36±0.06 vs.
1.4±0.68%, p<0.05) (Fig. 7).
Discussion
As a member of the POU transcription factor family,
OCT3 is involved in the self-renewal of embryonic stem cells and
primordial germ cells and is considered a marker for the
pluripotency of stem cells (9). The
expression of OCT3 in differentiated or mature tissue is very low,
or even non-existent (10,11). SOX2, as a member of the SOX
(SRY-related HMG box) family (12)
plays a critical role in the regulation of the development of
embryonic stem cells, maintaining pluripotency of stem cells and
deciding cell fate (13,14). OCT3 and SOX2 combine together
forming a complex (OCT3/SOX2). OCT3 and SOX2 are not only expressed
in embryonic stem cells and germ cells but also in some tumor cells
as, for example, in breast cancer (15,16),
germinoma (17,18), pancreatic (19,20),
liver (21), bladder (22), lung cancer (23) and renal medullary carcinoma
(24). Furthermore, OCT3 expression
is observed in human breast stem cells, pancreatic stem cells,
liver stem cells. It is believed that OCT3-positive tumor cells may
be derived from OCT3-positive somatic stem cells (21). The expression of OCT3 in BE tissue
was found to be elevated compared to normal esophagus tissue, but
decreased compared to EAC tissue. We hypothesized that there were a
few stem-like cells in BE tissue that were stimulated by some risk
factors and then transformed into EAC.
The TCL1 oncogene located at 14q32.1 is involved in
the development of human mature T-cell leukemia. It was found as
one of the downstream candidate genes of OCT3 and played an
important role in early mouse embryos and ES cells (25). It has been shown that TCL1 enhances
the kinase activity of AKT1 (26).
AKT1 is one of the key kinases enhancing cell proliferation and
inhibiting apoptosis. It has also been shown that the activation of
AKT1 is sufficient to maintain the undifferentiated state of mouse
ES cells (27) and that the
OCT3-TCL1-AKT1 pathway plays an important role in early mouse
embryos and ES cells (28). In the
present study, we also measured the expression of TCL1 and AKT1 in
BE or EAC tissue. Notably, we found that TAL1 or AKT1 were also
elevated in BE or EAC tissue compared to normal esophagus tissue.
Based on this observation, we hypothesized that the
OCT3/SOX2-TCL1-AKT1 pathway plays an important role in the
transformation of BE to EAC.
To date, tumor stem cells have been isolated from
several different types of cancer, including leukemia (29,30),
brain neoplasms (31,32), breast (33), prostate cancer (34), hepatocellular carcinoma (35), colon cancer (36), head and neck squamous cell carcinoma
(37). We isolated SP and slow
cycle cells having stem cell characteristics using Hoechst 33342
and Dil dye, respectively. Hoechst 33342 is a nuclei fluorescent
dye which is pumped by stem cells. Therefore, the stem cells may
not be dyed by Hoechst 33342 but are inhibited by a blocking agent
(verapamil). Due to this property, SP cells may be isolated using
flow cytometry (38,39). SP cells were isolated from
neuroblastoma, breast, lung cancer, spongioblastoma (40) and ovarian cancer cell lines
(41). SP cells have the same
characteristics as stem cells including self-renewal and
multi-direction differentiation. The clone formation test was an
effective method to detect proliferation of single cells, and the
Transwell test was used to check cell metastasis. In the present
study, ~1.2% of cells isolated were SP cells and the ability of
clone formation and metastasis of SP cells were increased compared
to MP cells.
Another way to separate stem cells involves the mark
detaining test which is based on the long cell cycle of stem cells
(42). Since stem cells are
normally in stationary phase, the marker is detained after a long
time in culture and can be detected. However, the marker is
diminished with fast dividing and cannot be detected. The cells
detected this way are called slow cycle cells and exhibit the
characteristics of stem cells. In the past, bromodeoxyuridine
(BrdU) was used. A new cell membrane marker, Dil, has recently
found widespread application. DiI is a type of lipophilic membrane
marker that sends out fluorescence when integrated in the membrane.
Its beneficial properties include a higher labeling efficiency,
shorter labeling time and less cytotoxicity (43). To date, slow cycle cells have been
detected in tumors of, for example, intestine (44), breast (45), skin (46) and cornea (47). In the present study, ~1.4±0.26% of
cells separated from OE33 cells were considered to be slow cycle
cells. Slow cycle cells are smaller than quick cycle cells and have
a strengthened ability of clone formation and invasion.
In the present study, the regulatory role of
downregulation of OCT3 by siRNA was elucidated. RNAi is an
effective way to silence post transcriptional genes and is
extensively used to inhibit specific gene expression (48,49).
OE33 cells were transfected with OCT3-siRNA to silence OCT3
expression. Downregulation of OCT3 expression by siRNA inhibited
the clone formation and invasion ability of OE33 cells. It has been
shown that inhibition of OCT3 reduces tumor malignancy. Recent
studies showed that somatic stem cells with high expression levels
of OCT3 are the origin of tumorigenesis (21,50,51),
and knocking out the OCT4 gene in mice causes embryo death during
the prophase of embryo development (52) and causes embryo stem cell
differentiation to the endoblast directly (53). This study demonstrated that the
downregulation of OCT3 in OE33 cells decreased the formation of SP
and slow cycle cells. Western blotting and real-time PCR detection
showed that inhibition of OCT3 reduced the expression of SOX2, TCL1
and AKT1. Therefore, it is our hypothesis that downregulation of
OCT3 may inhibit the carcinogenesis of EAC by reducing the activity
of SOX2 and blocking the TCL1/AKT1 pathway.
In conclusion, OCT3 and SOX2 are markers of tumor
stem cells which are highly expressed in BE tissue compared to
normal esophagus tissue but their expression is decreased compared
to EAC tissue. There are a few stem-like cells in OE33 cells which
exhibit similar biological behavior to tumor stem cells.
Downregulation of OCT3 expression by siRNA inhibited the ability of
clone formation and invasion of OE33 cells, and decreased the
formation of SP and slow cycle cells. OCT3 and SOX2 play a critical
role in the transformation of BE to EAC by regulating the formation
of tumor stem cells by switching on the TCL1/AKT1 pathway.
Acknowledgements
The study was supported by the China Postdoctoral
Science Foundation (grant no: 201150M1518).
References
|
1
|
Brown LM, Devesa SS and Chow WH: Incidence
of adenocarcinoma of the esophagus among white Americans by sex,
stage, and age. J Natl Cancer Inst. 100:1184–1187. 2008. View Article : Google Scholar : PubMed/NCBI
|
|
2
|
Sharma P: Clinical practice. Barrett’s
esophagus. New Engl J Med. 361:2548–2556. 2009.
|
|
3
|
Tsai RY: A molecular view of stem cell and
cancer cell self-renewal. Int J Biochem Cell Biol. 36:684–694.
2004. View Article : Google Scholar : PubMed/NCBI
|
|
4
|
Kopper L and Hajdú M: Tumor stem cells.
Pathol Oncol Res. 10:69–73. 2004. View Article : Google Scholar
|
|
5
|
Chew JL, Loh YH, Zhang W, et al:
Reciprocal transcriptional regulation of Pou5f1 and
Sox2 via the Oct4/Sox2 complex in embryonic stem cells. Mol
Cell Biol. 25:6031–6046. 2005.PubMed/NCBI
|
|
6
|
Okumura-Nakanishi S, Saito M, Niwa H and
Ishikawa F: Oct-3/4 and Sox2 regulate Oct-3/4 gene in
embryonic stem cells. J Biol Chem. 280:5307–5317. 2005. View Article : Google Scholar : PubMed/NCBI
|
|
7
|
Wang X, Sun Y, Xu M, Fang DC, Gao HJ and
Xu JT: Oligomicroarray-based primary study of gene expression
profile changes in Barrett’s esophagus. Journal of Medical Colleges
of PLA. 23:251–257. 2008.
|
|
8
|
Rockett JC, Larkin K, Darnton SJ, Morris
AG and Matthews HR: Five newly established oesophageal carcinoma
cell lines: phenotypic and immunological characterization. Br J
Cancer. 75:258–263. 1997. View Article : Google Scholar
|
|
9
|
Okamoto K, Okazawa H, Okuda A, Sakai M,
Muramatsu M and Hamada H: A novel octamer binding transcription
factor is differentially expressed in mouse embryonic cells. Cell.
60:461–472. 1990. View Article : Google Scholar : PubMed/NCBI
|
|
10
|
Pesce M and Schöler HR: Oct-4:
gatekeeper in the beginnings of mammalian development. Stem Cells.
19:271–278. 2001. View Article : Google Scholar
|
|
11
|
Schöler HR: the POU factors in murine
development. Trends Genet. 7:323–329. 1991.
|
|
12
|
Weiss MA: Floppy SOX: mutual induced fit
in hmg (high-mobility group) box-DNA recognition. Mol Endocrinol.
15:353–362. 2001. View Article : Google Scholar : PubMed/NCBI
|
|
13
|
Wegner M: From head to toes: the multiple
facets of Sox proteins. Nucleic Acids Res. 27:1409–1420. 1999.
View Article : Google Scholar : PubMed/NCBI
|
|
14
|
Boiani M and Schöler HR: Regulatory
networks in embryo-derived pluripotent stem cells. Nat Rev Mol Cell
Biol. 6:872–884. 2005. View
Article : Google Scholar : PubMed/NCBI
|
|
15
|
Jin T, Branch DR, Zhang X, et al:
Examination of POU homeobox gene expression in human breast
cancer cells. Int J Cancer. 81:104–112. 1999.
|
|
16
|
Rodriguez-Pinilla SM, Sarrio D,
Moreno-Bueno G, et al: Sox2: a possible driver of the basal-like
phenotype in sporadic breast cancer. Mod Pathol. 20:474–481. 2007.
View Article : Google Scholar : PubMed/NCBI
|
|
17
|
Jones TD, Ulbright TM, Eble JN and Cheng
L: OCT4: a sensitive and specific biomarker for intratubular germ
cell neoplasia of the testis. Clin Cancer Res. 10:8544–8547. 2004.
View Article : Google Scholar : PubMed/NCBI
|
|
18
|
Rijlaarsdam MA, van Herk HA, Gillis AJ, et
al: Specific detection of OCT3/4 isoform A/B/B1 expression in solid
(germ cell) tumours and cell lines: confirmation of OCT3/4
specificity for germ cell tumours. Br J Cancer. 105:854–863. 2011.
View Article : Google Scholar : PubMed/NCBI
|
|
19
|
Iki K and Pour PM: Expression of Oct4, a
stem cell marker, in the hamster pancreatic cancer model.
Pancreatology. 6:406–413. 2006. View Article : Google Scholar : PubMed/NCBI
|
|
20
|
Sanada Y, Yoshida K, Ohara M, Oeda M,
Konishi K and Tsutani Y: Histopathologic evaluation of stepwise
progression of pancreatic carcinoma with immunohistochemical
analysis of gastric epithelial transcription factor SOX2:
comparison of expression patterns between invasive components and
cancerous or nonneoplastic intraductal components. Pancreas.
32:164–170. 2006.
|
|
21
|
Tai MH, Chang CC, Kiupel M, Webster JD,
Olson LK and Trosko JE: Oct4 expression in adult human stem cells:
evidence in support of the stem cell theory of carcinogenesis.
Carcinogenesis. 26:495–502. 2005.PubMed/NCBI
|
|
22
|
Ben-Porath I, Thomson MW, Carey VJ, et al:
An embryonic stem cell-like gene expression signature in poorly
differentiated aggressive human tumors. Nat Genet. 40:499–507.
2008. View
Article : Google Scholar : PubMed/NCBI
|
|
23
|
Karoubi G, Gugger M, Schmid R and Dutly A:
OCT4 expression in human non-small cell lung cancer: implications
for therapeutic intervention. Interact Cardiovasc Thorac Surg.
8:393–397. 2009. View Article : Google Scholar : PubMed/NCBI
|
|
24
|
Rao P, Tannir NM and Tamboli P: Expression
of OCT3/4 in renal medullary carcinoma represents a potential
diagnostic pitfall. Am J Surg Pathol. 36:583–588. 2012. View Article : Google Scholar : PubMed/NCBI
|
|
25
|
Ivanova N, Dobrin R, Lu R, et al:
Dissecting self-renewal in stem cells with RNA interference.
Nature. 442:533–538. 2006. View Article : Google Scholar : PubMed/NCBI
|
|
26
|
Pekarsky Y, Koval A, Hallas C, et al: Tcl1
enhances Akt kinase activity and mediates its nuclear
translocation. Proc Natl Acad Sci USA. 97:3028–3033. 2000.
View Article : Google Scholar : PubMed/NCBI
|
|
27
|
Watanabe S, Umehara H, Murayama K, Okabe
M, Kimura T and Nakano T: Activation of Akt signaling is sufficient
to maintain pluripotency in mouse and primate embryonic stem cells.
Oncogene. 25:2697–2707. 2006. View Article : Google Scholar : PubMed/NCBI
|
|
28
|
Matoba R, Niwa H, Masui S, et al:
Dissecting Oct3/4-regulated gene networks in embryonic stem cells
by expression profiling. PLoS One. 1:e262006. View Article : Google Scholar : PubMed/NCBI
|
|
29
|
Lapidot T, Sirard C, Vormoor J, et al: A
cell initiating human acute myeloid leukaemia after transplantation
into SCID mice. Nature. 367:645–648. 1994. View Article : Google Scholar : PubMed/NCBI
|
|
30
|
Bonnet D and Dick JE: Human acute myeloid
leukemia is organized as a hierarchy that originates from a
primitive hematopoietic cell. Nat Med. 3:730–737. 1997. View Article : Google Scholar : PubMed/NCBI
|
|
31
|
Singh SK, Hawkins C, Clarke ID, et al:
Identification of human brain tumour initiating cells. Nature.
432:396–401. 2004. View Article : Google Scholar : PubMed/NCBI
|
|
32
|
Singh SK, Clarke ID, Hide T and Dirks PB:
Cancer stem cells in nervous system tumors. Oncogene. 23:7267–7273.
2004. View Article : Google Scholar : PubMed/NCBI
|
|
33
|
Al-Hajj M, Wicha MS, Benito-Hernandez A,
Morrison SJ and Clarke MF: Prospective identification of
tumorigenic breast cancer cells. Proc Natl Acad Sci USA.
100:3983–3988. 2003. View Article : Google Scholar : PubMed/NCBI
|
|
34
|
Collins AT, Berry PA, Hyde C, Stower MJ
and Maitland NJ: Prospective identification of tumorigenic prostate
cancer stem cells. Cancer Res. 65:10946–10951. 2005. View Article : Google Scholar : PubMed/NCBI
|
|
35
|
Suetsugu A, Nagaki M, Aoki H, Motohashi T,
Kunisada T and Moriwaki H: Characterization of CD133+
hepatocellular carcinoma cells as cancer stem/progenitor cells.
Biochem Biophys Res Commun. 351:820–824. 2006.
|
|
36
|
O’Brien CA, Pollett A, Gallinger S and
Dick JE: A human colon cancer cell capable of initiating tumour
growth in immunodeficient mice. Nature. 445:106–110.
2007.PubMed/NCBI
|
|
37
|
Prince ME, Sivanandan R, Kaczorowski A, et
al: Identification of a subpopulation of cells with cancer stem
cell properties in head and neck squamous cell carcinoma. Proc Natl
Acad Sci USA. 104:973–978. 2007. View Article : Google Scholar : PubMed/NCBI
|
|
38
|
Zhou S, Sehuetz JD, Bunting KD, et al: The
ABC transporter Bcrp1/ABCG2 is expressed in a wide variety of stem
cells and is a molecular determinant of the side-population
phenotype. Nat Med. 7:1028–1034. 2001. View Article : Google Scholar : PubMed/NCBI
|
|
39
|
Bunting KD: ABC transporters as phenotypic
markers and functional regulators of stem cells. Stem Cells.
20:11–20. 2002. View Article : Google Scholar : PubMed/NCBI
|
|
40
|
Hirschmann-Jax C, Foster AE, Wulf GG, et
al: A distinct ‘side population’ of cells with high drug efflux
capacity in human tumor cells. Proc Natl Acad Sci USA.
101:14228–14233. 2004.
|
|
41
|
Szotek PP, Pieretti-Vanmarcke R, Masiakos
PT, et al: Ovarian cancer side population defines cells with stem
cell-like characteristics and mullerian inhibiting substance
responsiveness. Proc Natl Acad Sci USA. 103:11154–11159. 2006.
View Article : Google Scholar : PubMed/NCBI
|
|
42
|
Zhang J, Niu C, Ye L, et al:
Identification of the haematopoietic stem cells niche and control
of the niche size. Nature. 425:836–841. 2003. View Article : Google Scholar : PubMed/NCBI
|
|
43
|
Li N, Yang H, Lu L, Duan C, Zhao C and
Zhao H: Comparison of the labeling efficiency of BrdU, DiI and FISH
labeling techniques in bone marrow stromal cells. Brain Res.
1215:11–19. 2008. View Article : Google Scholar : PubMed/NCBI
|
|
44
|
Potten CS, Owen G and Booth D: Intestinal
stem cells protect their genome by selective segregation of
template DNA strands. J Cell Sci. 115:2381–2388. 2002.PubMed/NCBI
|
|
45
|
Smith GH: Label-retaining epithelial cells
in mouse mammary gland divide asymmetrically and retain their
template DNA strands. Development. 132:681–687. 2005. View Article : Google Scholar : PubMed/NCBI
|
|
46
|
Taylor G, Lehrer MS, Jensen PJ, Sun TT and
Lavker RM: Involvement of follicular stem cells in forming not only
the follicle but also the epidermis. Cell. 102:451–461. 2000.
View Article : Google Scholar : PubMed/NCBI
|
|
47
|
Sun TT and Lavker RM: Corneal epithelial
stem cells: past, present, and future. J Investig Dermatol Symp
Proc. 9:202–207. 2004. View Article : Google Scholar : PubMed/NCBI
|
|
48
|
McManus MT and Sharp PA: Gene silencing in
mammals by small interfering RNAs. Nat Rev Genet. 3:737–747. 2002.
View Article : Google Scholar : PubMed/NCBI
|
|
49
|
Zhang J and Hua ZC: Targeted gene
silencing by small interfering RNA-based knock-down technology.
Curr Pharm Biotechnol. 5:1–7. 2004. View Article : Google Scholar : PubMed/NCBI
|
|
50
|
Monk M and Holding C: Human embryonic
genes re-expressed in cancer cells. Oncogene. 20:8085–8091. 2001.
View Article : Google Scholar : PubMed/NCBI
|
|
51
|
Atlasi Y, Mowla SJ, Ziaee SA and Bahrami
AR: OCT-4, an embryonic stem cell marker, is highly
expressed in bladder cancer. Int J Cancer. 120:1598–1602. 2007.
View Article : Google Scholar : PubMed/NCBI
|
|
52
|
Nichols J, Zevnik B, Anastassiadis K, et
al: Formation of pluripotent stem cells in the mammalian embryo
depends on the POU transcription factor Oct4. Cell. 95:379–391.
1998. View Article : Google Scholar : PubMed/NCBI
|
|
53
|
Niwa H, Miyazaki J and Smith AG:
Quantitative expression of Oct-3/4 defines differentiation,
dedifferentiation or self-renewal of ES cells. Nat Genet.
24:372–376. 2000. View
Article : Google Scholar : PubMed/NCBI
|