Introduction
A quarter of adults worldwide are classified as
obese [(body mass index (BMI), ≥30 kg/m2)] (1), with projections that this will
increase to a third of all adults by 2020. Traditionally, obesity
has been associated with a plethora of pathologies including type 2
diabetes and cardiovascular disease. Currently, numerous studies
have reported evidence of an association between obesity and cancer
risk and mortality in some cancers including breast (2), endometrial (3) and colorectal. Meta-analyses have
described the risk of colorectal cancer, the third most common
cancer in the UK, to be increased by an estimated 25% in the
overweight (BMI, 25–30 kg/m2) and 50% in obese men
(4,5).
The underlying molecular and cellular mechanisms in
obesity-mediated colorectal carcinogenesis are yet to be
elucidated, however, accumulating evidence reveals the involvement
of hormone-mediated mechanisms in this process. Leptin is a major
hormone produced by adipose tissue and circulating serum leptin
levels correlate directly with body fat mass. Leptin levels are up
to 5-fold higher in obese compared to normal individuals (6). Several studies revealed that elevated
leptin levels are associated with increased adenoma and colorectal
cancer risk (7,8) and have been reported to induce
cellular proliferation, motility and invasiveness in colorectal
cell models (9). Furthermore,
Fenton et al (10) suggested
that leptin drives tumourigenesis through the autocrine production
of interleukin-6 (IL-6) a cytokine which is similarly strongly
implicated in colorectal tumourigenesis. Studies revealed increased
human serum levels of IL-6 in colorectal cancer patients (11) whilst a murine study revealed that
IL-6 signalling is involved in tumour formation and administration
of antibodies against IL-6R has been shown to inhibit tumour growth
(12). This is further supported by
Becker et al (13) who
demonstrated that suppression of tumour progression in colon cancer
can be achieved by inhibiting IL-6 trans-signalling.
In addition to leptin inducing an increased
expression of IL-6, leptin is also able to induce the expression of
hepcidin (the master regulator of iron metabolism), as demonstrated
using an in vitro hepatic model (14). Notably, human studies revealed that
direct IL-6 infusion also increases circulating hepcidin levels
(15). This is particularly
interesting for two reasons. Firstly, dysregulated cellular iron
metabolism has been linked with colorectal cancer and studies
reveal that cellular iron excess amplifies Wnt signalling (16–21)
which is the major oncogenic signalling pathway in the colon.
Secondly, obesity is commonly associated with low serum iron
concentrations (22–24), with hepcidin likely mediating this
obesity-associated anaemia. Hepcidin facilitates its effects by
binding to the cellular iron efflux protein, ferroportin and, in
the context of normal human physiology, this acts to cause
sequestration of iron within the reticuloendothelial system and
blocking of duodenal iron transport (25). As well as high body iron levels,
inflammation and infection can also induce hepcidin expression
through the action of the cytokine IL-6 (25). In addition, systemic levels of IL-6
are also associated with the low-grade inflammation reported in
obese patients (26) and therefore,
obesity and adipokines are potentially contributing to, through
hepcidin and cellular iron, oncogenic progression in
colonocytes.
To date, the mechanism through which these different
factors influence colonocyte behaviour and interact in colonic
model systems has not been studied. Consequently, to dissect out
the role of these factors in obesity-driven carcinogenesis we have
recreated an in vitro model whereby we can analyse what
omental adipocytes secrete and how the specific analytes, leptin,
IL-6 and hepcidin, function and influence colonocyte behaviour.
Materials and methods
Patient samples
Human adipose tissue
Ethical approval for the use of human adipose tissue
was provided by the University of Birmingham Human BioRepository
Centre (11–068) and all patients provided informed written consents
to providing adipose tissue for the present study.
Human serum samples
Patients (n=163) attending Wolverhampton Hospital
between 2006–2008 for colonoscopy as part of the National
Colorectal Screening Programme had blood collected and stored prior
to their examination for colorectal cancer. Of these 163 patients,
73 (45%) were subsequently identified with neoplasia comprising 51
patients (70%) with high risk adenomas and 22 (30%) with cancers.
The remaining 90 patients (55%) included 39 patients (43%) with low
risk polyps and 51 (57%) without abnormalities. Detailed
socio-demographics (BMI, smoking, alcohol intake, gender, age,
ethnicity), use of non-steroidal anti-inflammatory drugs,
comorbidity, symptoms and outcome data were available for all
participants. Ethical approval for this aspect of the study was
attained by the Black Country Research Ethics Committee 07/H1202/72
Warwickshire Local REC and Birmingham, East, North and Solihull
REC. All patients provided informed written consents.
Human adipocyte cultures
Human adipose tissue from the greater omentum of
patients undergoing colorectal surgery was collected and following
the removal of blood vessels and connective tissue, samples were
minced and incubated at 37°C for 1 h in 2 mg/ml Collagenase II
(Sigma-Aldrich, Irvine, UK) in Dulbecco's modified Eagle's medium
(DMEM/F-12; Thermo Fisher Scientific, Ashford, UK) with gentle
agitation. Following digestion, filtration and centrifugation (5
min at 1,500 rpm) the cell pellets were washed twice in serum-free
medium. The preadipocyte cell pellet was then resuspended in growth
medium DMEM/F-12 supplemented with 10% foetal calf serum (FCS; PAA
Laboratories, Somerset, UK) supplemented with 100 U/ml penicillin
and 0.1 mg/ml streptomycin (Thermo Fisher Scientific) and plated
into 12-well tissue culture plates (CellBIND; Corning, Cambridge,
UK) and incubated at 37°C with 5% CO2 as standard. Upon
reaching 70% confluency the growth medium was removed and 1 ml of
serum-free DMEM/F-12 was added overnight. The serum-free medium was
collected the following day, centrifuged to remove cellular debris
and filtered (0.22 µm) and used as the control (PAS) in our
subsequent experiments. The cells were then cultured with 1 ml
differentiation medium (DMEM/F12 with L-glutamine; PAA
Laboratories) containing 10% FCS, 100 U/ml penicillin, 0.1 mg/ml
streptomycin, 33 mM biotin (Sigma-Aldrich), 17 µM pantothenate
(Sigma-Aldrich) and 0.2 nM T3 (Sigma-Aldrich) which had 167 nM
insulin (Sigma-Aldrich), 1 µM hydrocortisol (Sigma-Aldrich, UK) and
0.5 µM 1-methyl-isobutylxanthine (IBMX; Sigma-Aldrich) added prior
to use. After four days, the medium was removed and fresh
differentiation medium (without IBMX) was applied to the cells
until the adipocytes had fully differentiated (~14 days). Once
differentiated, the cells were washed and placed in serum-free
DMEM/F-12 medium overnight and then the medium was collected
[differentiated adipocyte secretome (DAS)] and subsequently used in
the experiments.
Culture of colorectal cell lines
Authenticated SW480 colorectal cancer cells
(American Type Culture Collection, Manassas, VA, USA) were
routinely cultured with growth medium (DMEM; Thermo Fisher
Scientific) containing 10% FCS supplemented with 100 U/ml
penicillin and 0.1 mg/ml streptomycin. Only cells of low passage
(>p25) were used in all experiments. For experiments involving
the use of adipocyte conditioned medium upon the SW480 cells
reaching 70% confluency, the cells were challenged with either the
DAS or with the control (PAS) in the presence or absence of
inhibitors of leptin (anti-human leptin/OB antibody MAB398; R&D
Systems, Abingdon, UK) used at a final concentration of 3.2 ng/ml;
IL-6 (anti-human IL-6 antibody 500-P26G; Peprotech, London, UK)
used at a final concentration of 0.1 ng/ml; or hepcidin (hepcidin
antagonist peptide) as previously described by Kaplan et al
(27) (RR-FDCITTGYAYTQGLSGSILS-RR;
Alta Biosciences, Birmingham, UK) used at a concentration of 1 µM
and the effect on cellular viability (MTT assay) and proliferation
(BrdU assay) was determined, as detailed below. When assessing the
effects of the individual proteins (IL-6, leptin and hepcidin) upon
the SW480 cells reaching 70% confluency, the cells were challenged
either with leptin (Peprotech) used at a final concentration of 60
ng/ml, IL-6 (Peprotech) used at a final concentration of 10 ng/ml
or human hepcidin (Alta Biosciences) used at a final concentration
of 1 µM in the presence or absence of the respective inhibitors
described above. The controls for these experiments included growth
medium alone, with and without inhibitors.
Viability and proliferation
assays
MTT
[3-(4,5-dimethylthiazol-2-yl)-2,5-diphenyltetrazolium bromide]
assay
At the end of the culture period 10 µl of MTT
(Sigma-Aldrich) (5 mg/ml in PBS) solution was added to each 100 µl
of culture medium/well of the 96-well plate. The plates were
incubated for 3 h, after which the medium was aspirated and
replaced with 100 µl of DMSO (Sigma-Aldrich) to dissolve the
accumulated formazan crystals and then the absorbance was read at
490 nm. Optical densities were used to calculate the percentage of
viability with respect to the control.
BrdU proliferation assay
BrdU assays were performed according to the
manufacturer's instructions (Roche Applied Science, Burgess Hill,
UK). Briefly, the cells were labelled with BrdU, fixed and
DNA-denatured with FixDenat solution. The cells were then incubated
with anti-BrdU and the immune complexes were detected using a TMB
substrate reaction with the reaction product assessed at 490 nm as
described above.
Antibody-array
PAS and DAS were compared using the Human Adipokine
Antibody Array 1 (RayBiotech; Insight Biotechnology Ltd., Wembley,
UK), which was carried out according to the manufacturer's
instructions. The film was then scanned to create an electronic
version using Bio-Rad GS-800 densitometry scanner and analysed
using Quantity One analysis software version 4.6.7 (basic)
(Bio-Rad, UK).
Leptin, hepcidin and IL-6 ELISAs
The secretomes from the SW480 cells, the PAS
(control) and the DASs, were all assessed for leptin, hepcidin and
IL-6 using ELISA. Human IL-6 Quantikine ELISA and human leptin
Quantikine ELISA (D6050 and DLP00, respectively; R&D Systems)
were carried out according to the manufacturer's instructions. For
the hepcidin ELISA, the secretomes were extracted using the S-500
extraction kit (Peninsula Laboratories, Belmont, CA, USA) and then,
the hepcidin levels were quantified using peptide enzyme
immunoassay (S-1328.0001; Peninsula Laboratories, Belmont, CA, USA)
using protocol IV from the manufacturers instructions. The leptin
and IL-6 ELISAs were similarly used to assess the levels in the
human serum samples according to the manufacturer's instructions.
However, the hepcidin levels in the human serum samples were
assessed using a mass spectrometry-based Hepcidin assay described
below. The levels of transferrin and haemoglobin in the human
samples were assessed by the Biochemistry Department (University
Hospitals Birmingham NHS Foundation Trust).
Serum hepcidin assay
The sera were diluted 1 to 5 in 8 M urea
(Sigma-Aldrich), 1% CHAPS (Sigma-Aldrich), 25 mM ammonium
bicarbonate (Sigma-Aldrich) and 50 ng/ml stable isotope labelled
synthetic HEP25 (Alta Bioscience, Birmingham, UK) was added. The
samples were then diluted 10-fold in 25 mM ammonium bicarbonate and
100 µl applied to Cu2+ loaded IMAC ProteinChip arrays
(Bio-Rad, Dalkeith, UK). Following washing with 25 mM ammonium
bicarbonate sample spots were coated with saturated sinapinic acid
(Sigma-Aldrich) and analysed using an ultraflextreme MALDI (Bruker,
Germany) instrument in linear mode. Hepcidin concentrations were
calculated from the peak intensity ratio of endogenous/exogenous
hepcidin (at m/z 2790.4 and 2800.4, respectively).
Ferrozine assay for iron quantification
The SW480 cells were co-cultured with IL-6 or leptin
as above-mentioned. At the end of the culture period, the cells
were lysed in HEPES-saline lysis buffer [150 µl, 10 mM, pH 7.4,
NaCl 0.9% (w/v)]. A ferrozine stock solution was prepared by mixing
sodium acetate (17 mM, 13.8 g), L-sodium ascorbate (4.6 mM, 0.91 g)
and 3-(2-pyridyl)-5,6-diphenyl-1,2,4-triazine-p,p'-disulfonic acid
monosodium salt hydrate (0.18 mM, 0.09 g) (all Sigma-Aldrich) into
DI H2O (122 ml). The cell lysate was thoroughly mixed
and 90 µl was aspirated and mixed with a trichloroacetic solution
[200 µl, 20% (w/v)], which was then heated at 100°C for 10 min and
then centrifuged at 12,000 rpm for 5 min to pellet the protein
precipitate. The supernatant was aspirated and 200 µl was added to
600 µl ferrozine stock solution and mixed thoroughly and the
absorbance was read on a plate reader at λ=550 nm. All results were
standardised to protein content using a protein assay kit (Thermo
Fisher Scientific).
Statistical analysis
In vitro analyses
For the majority of analyses it is necessary to
perform Mann-Whitney U tests to determine the equality of medians
on the unmatched data as this test requires no assumptions
regarding the data distributions or variances. Unpaired 2 sample
t-tests were performed, following normality and equal variance
testing and in instances where variances were not determined, the
unequal option in Stata was invoked.
Serum analyses
Three subcategories of patient data were used for
subsequent analysis: patients with no abnormality (n=51), patients
with polyps (n=90) and adenocarcinoma patients (n=22). In order to
measure the strength and direction of association that exists
between the parameters of interest [haemoglobin (Hb), BMI, leptin,
IL-6 and hepcidin] Kendall's Tau-b correlation coefficients were
calculated. This nonparametric method was selected as, although the
parameter data is continuous in structure, the data are not
normally distributed and sample sizes are relatively small for some
patient subcategories (e.g. adenocarcinoma, n=22). Scatter plots
and linear prediction plots were produced to allow visualisation of
the relationships between parameters.
To determine significant differences in mean
measurements between the patient subcategories, regression analyses
were performed as the underlying assumptions of normality,
homogeneity of variance and equal sample sizes were unmet in the
data tested and to avoid multiplicity in testing. Dummy variables
were employed for each subcategory within the regression. Wald
tests were subsequently performed after each regression to complete
the comparison analysis. A significance level of 5% was used
throughout. Statistical analyses were performed using Stata
software version 12.1 (StataCorp, College Station, TX, USA).
Results
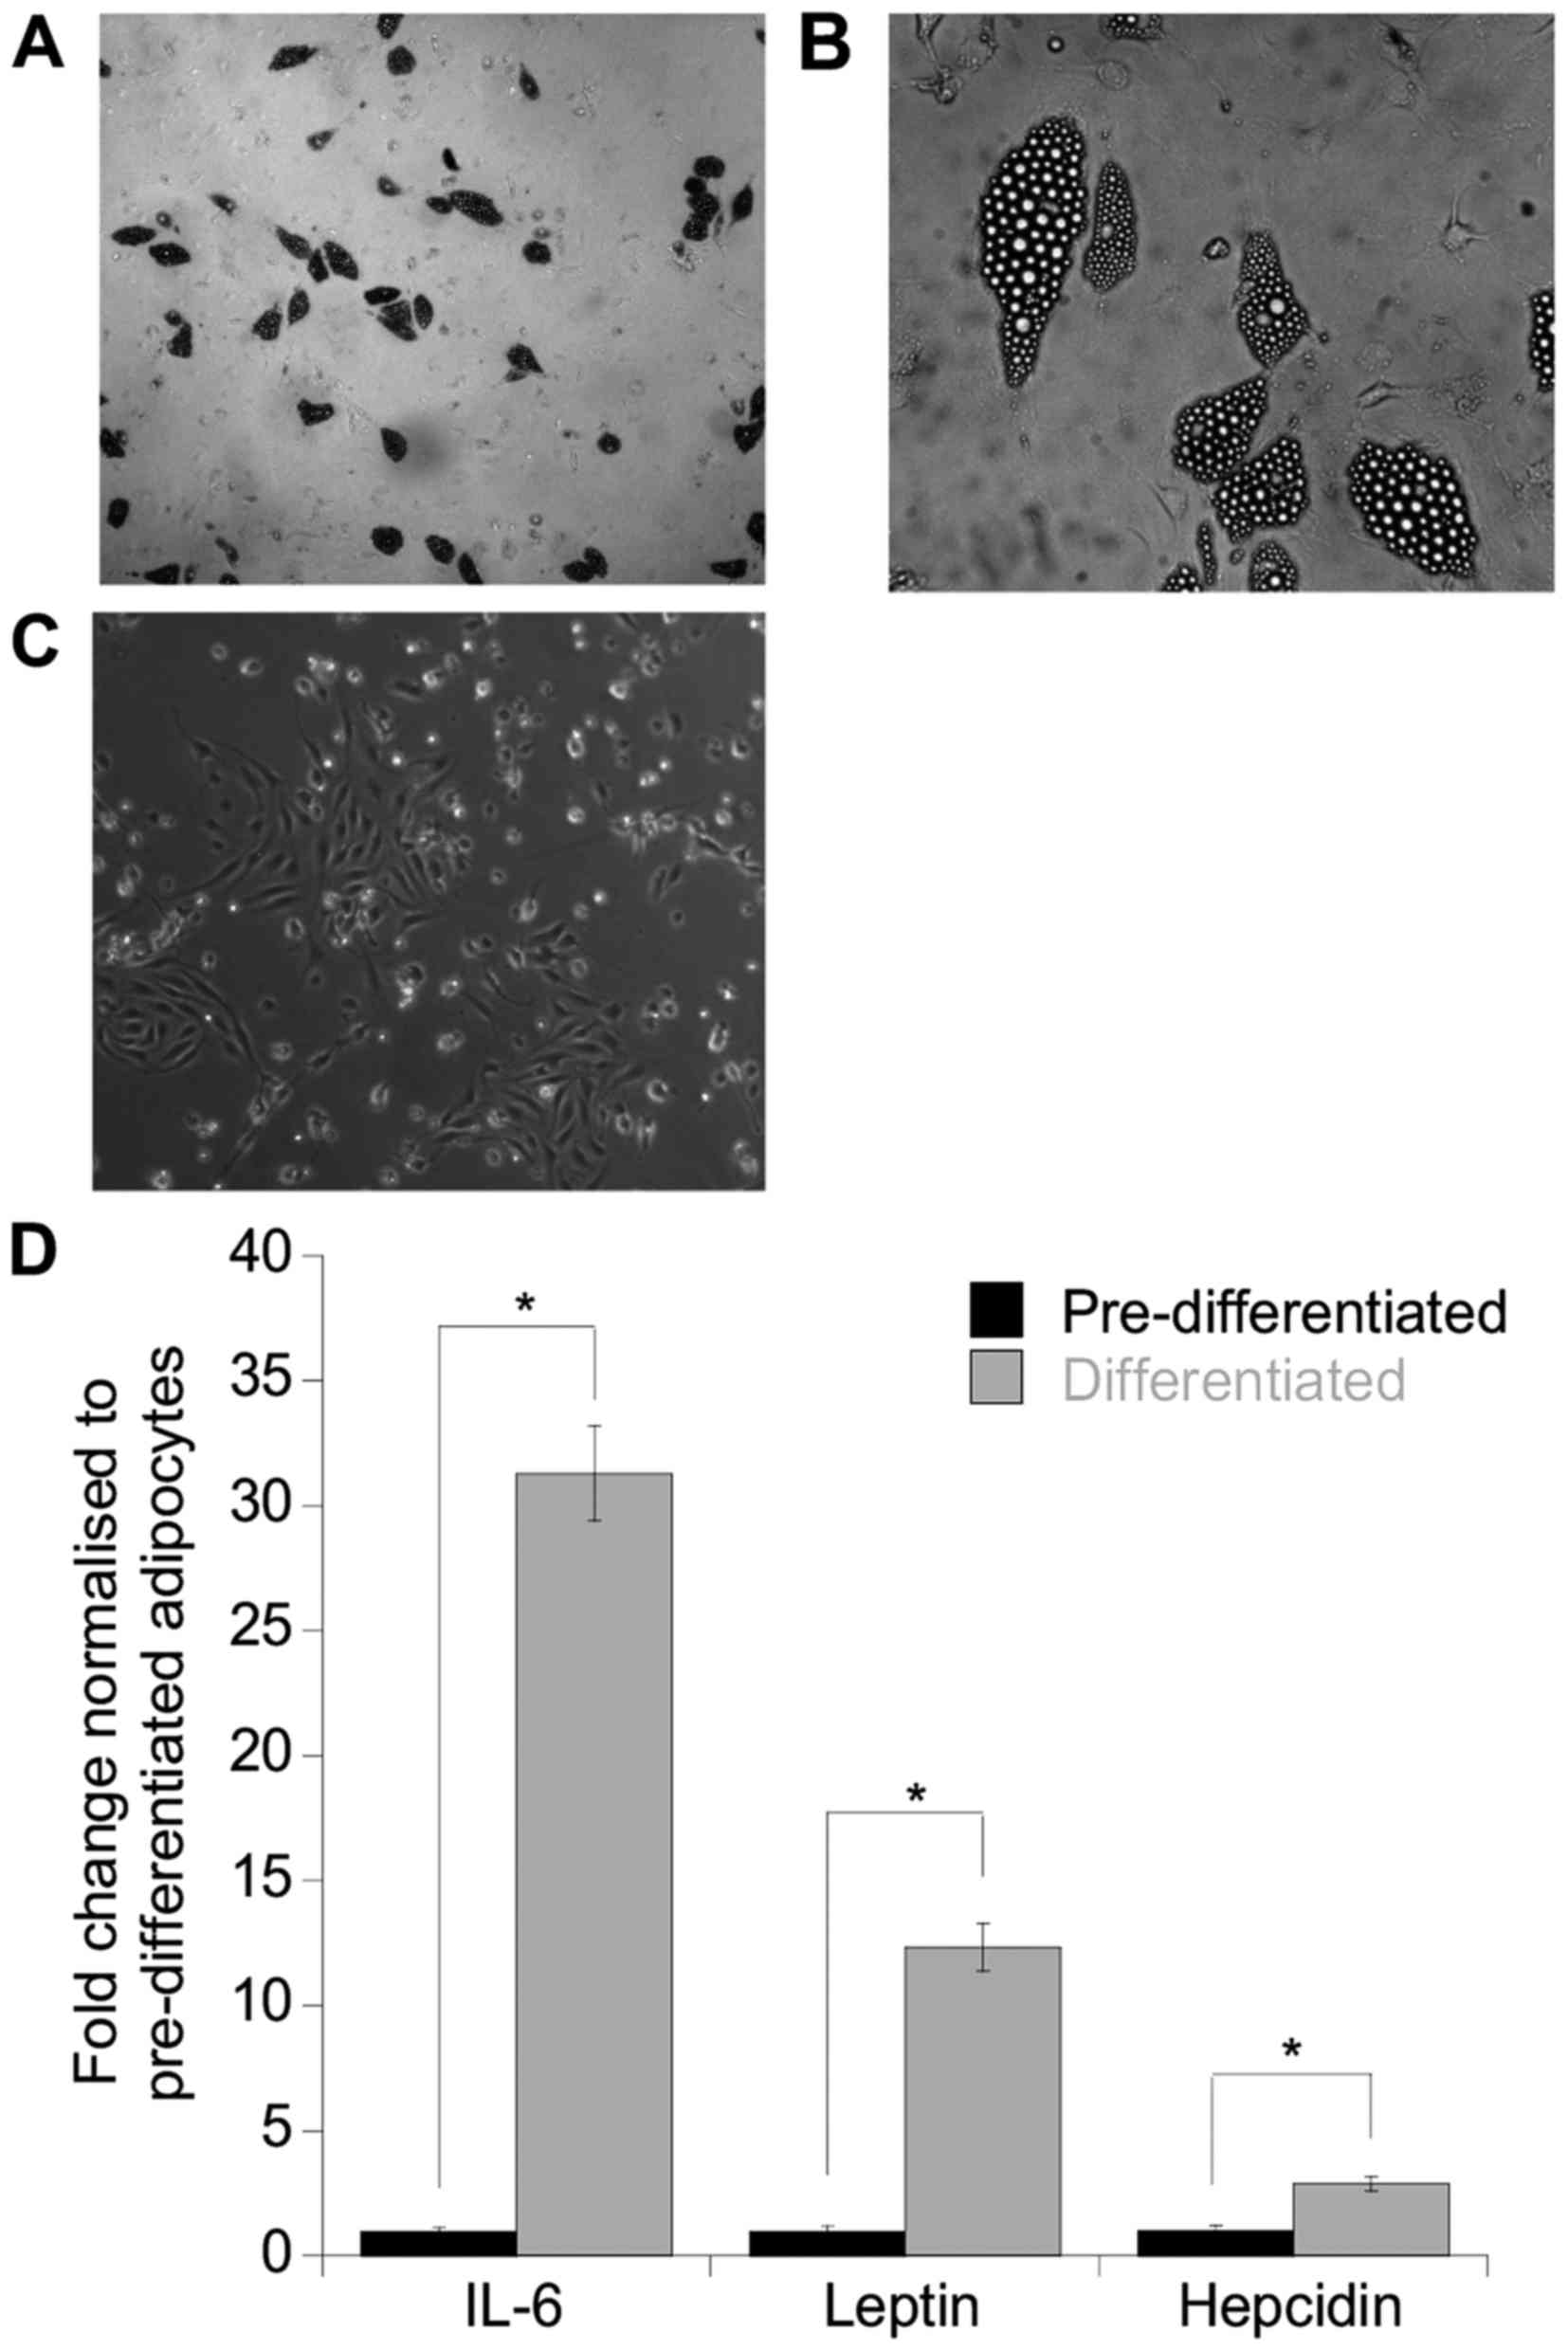
Validation of an in vitro adipocyte
culture model
Initially an in vitro model of human
adipocytes was established and analysis performed to determine
whether these mature adipocytes were functional. The cultured human
adipocytes were characteristic of mature differentiated adipocytes
as indicated by the abundance of lipid filled vesicles (Fig. 1A and B) compared to the
preadipocytes (control) (Fig. 1C).
To assess whether these adipocytes were able to secrete adipokines,
an antibody array was performed on the DAS and initial screening
indicated that an array of adipokines/cytokines was expressed
including IL-6, leptin, ENA-78, IL-8, PAI-1 and Ang-2 (data not
shown). To further accurately quantitate the levels of IL-6, leptin
and hepcidin, separate ELISAs were performed on the secretomes and
as anticipated, both leptin and IL-6 were increased by 29- and
12-fold, respectively compared to the undifferentiated control
secretomes (leptin, p=0.05; IL-6, p=0.04). Furthermore, hepcidin
was also increased 3-fold compared to the control (p=0.05)
(Fig. 1D).
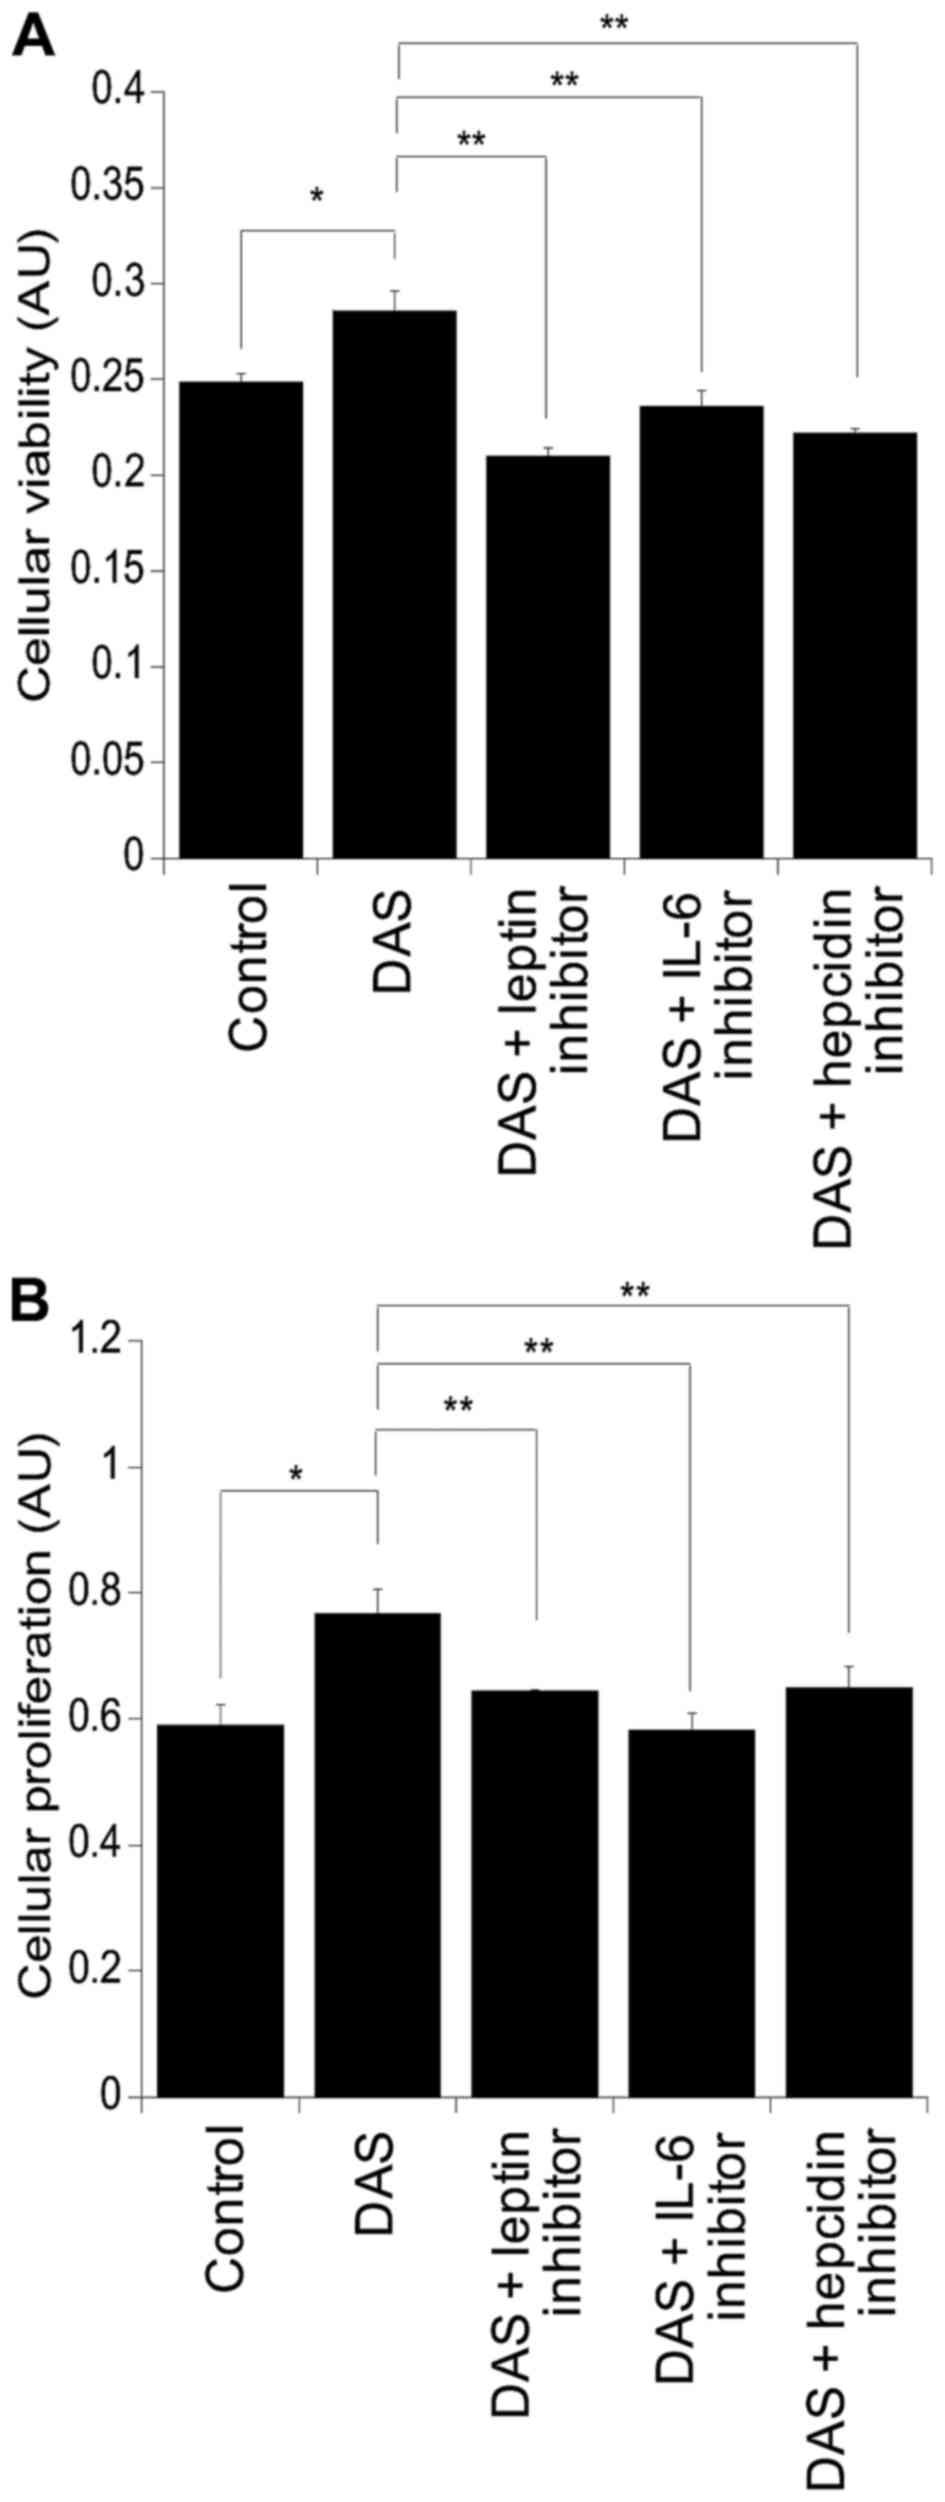
Effect of the adipocyte secretome on
colonocyte cell viability and proliferation
Assessment of the viability and of the proliferation
of the colorectal cancer cell line SW480 was performed using MTT
and BrdU assays, respectively (Fig.
2). Following culture with DAS there was a significant increase
in cellular viability compared to cells challenged with the control
alone (p=0.02) (Fig. 2A). This was
also mirrored at the level of cellular proliferation (p=0.03)
(Fig. 2B). Supplementation of DAS
with leptin, IL-6 and hepcidin inhibitors resulted in suppression
of cellular viability compared to DAS alone: DAS with leptin
inhibitor, p=0.002; DAS with IL-6 inhibitor, p=0.002; and DAS with
hepcidin inhibitor, p=0.0008. Similar findings were observed in the
levels of cellular proliferation, resulting in suppression in
cultures supplemented with the inhibitors compared to those with
DAS alone: DAS with leptin inhibitor, p=0.007; DAS with IL-6
inhibitor, p=0.0005; and DAS with hepcidin inhibitor, p=0.009
(Fig. 2B).
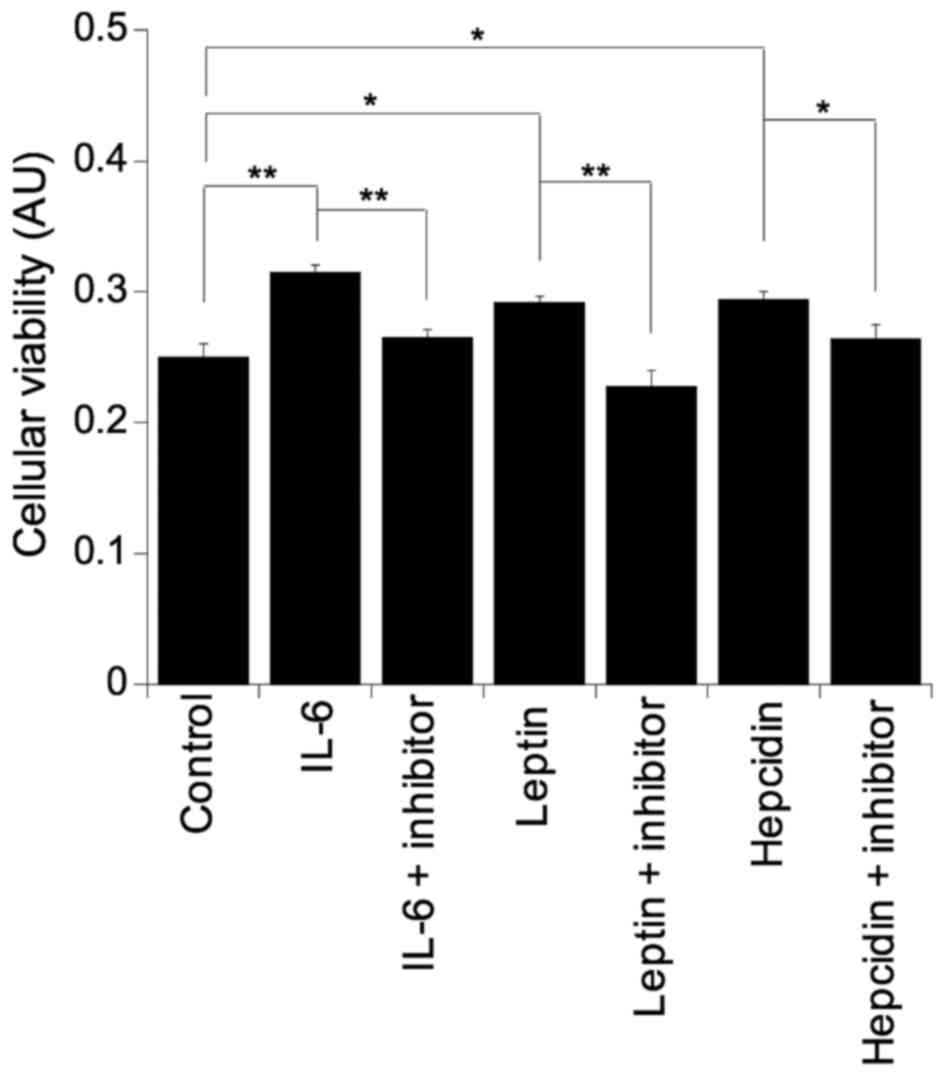
To further clarify the role of IL-6, leptin and
hepcidin in colonocyte viability, all three factors were
supplemented into basal growth medium. Challenging the SW480 cells
with either IL-6 (p=0.003), leptin (p=0.01) or hepcidin (p=0.01)
resulted in significant increases in colonocyte viability and as
expected, incubation with the respective inhibitor reversed the
pro-viability effect back to basal levels in all cases: IL-6 with
IL-6 inhibitor, p=0.005; leptin with leptin inhibitor, p=0.003; and
hepcidin with hepcidin inhibitor, p=0.05 (Fig. 3).
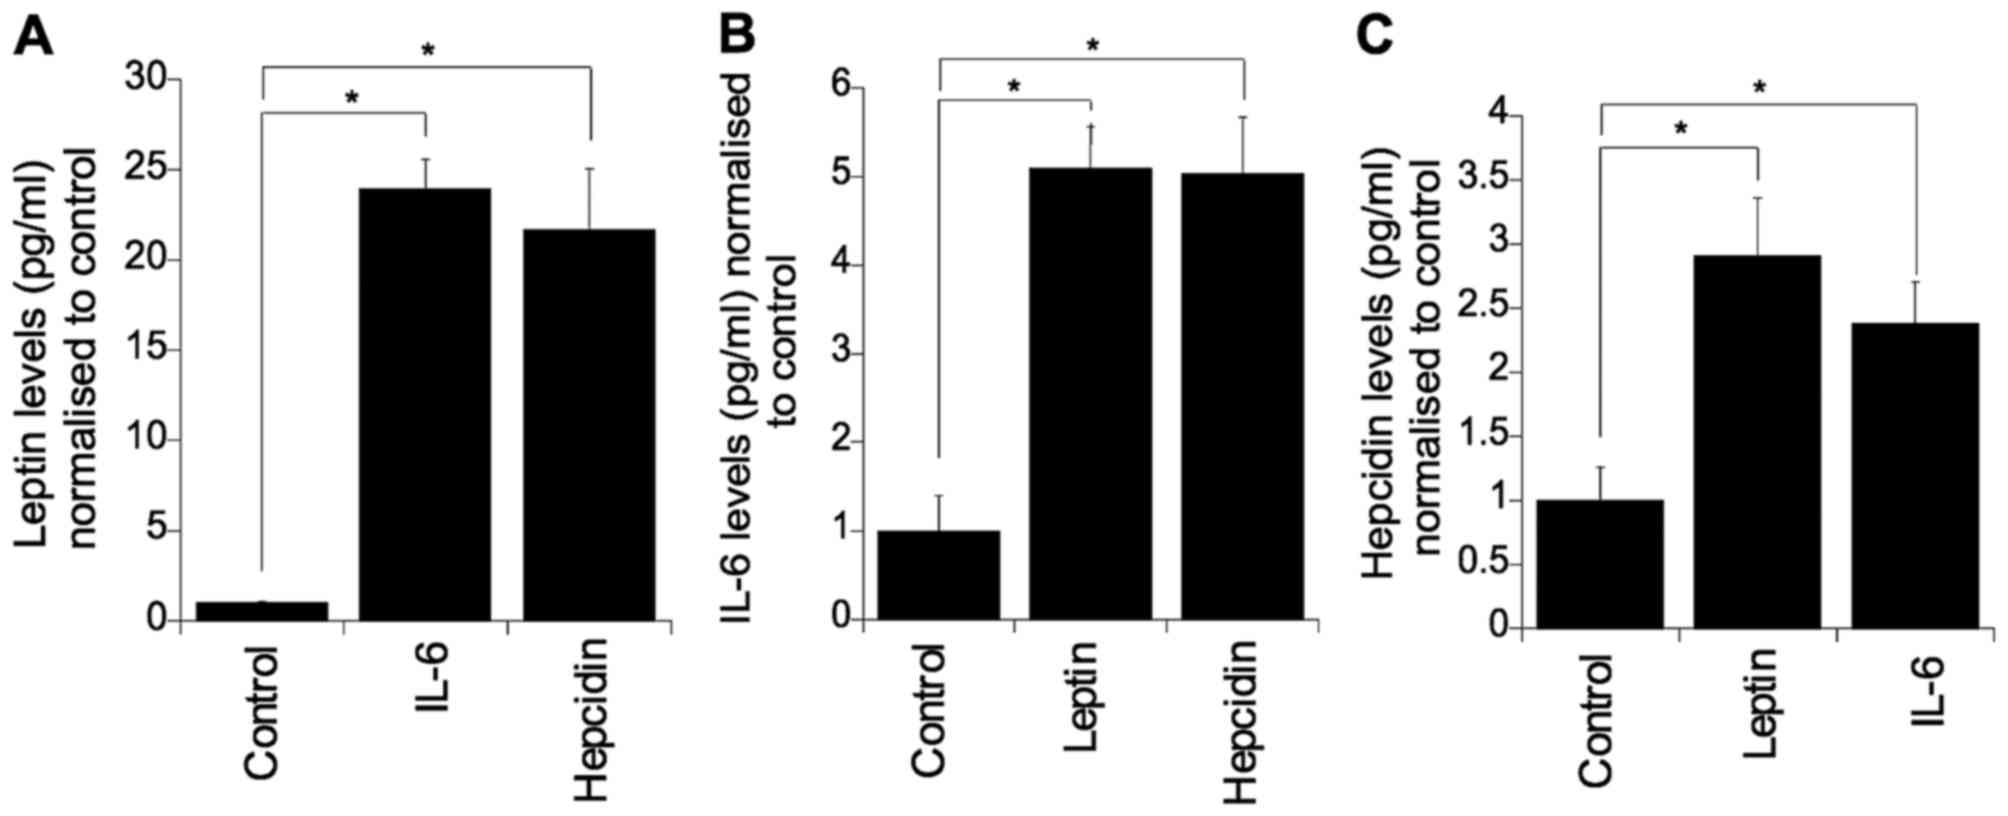
Complex interplay between IL-6, leptin
and hepcidin
To determine whether these three factors regulate
the expression of each other, each individual factor was
supplemented into culture medium and the levels of the other two
factors were evaluated (Fig. 4).
Challenging with IL-6 or hepcidin significantly elevated colonocyte
secreted leptin (p=0.05). Similarly, challenging with leptin or
hepcidin resulted in elevated levels of colonocyte secreted IL-6
(p=0.05) (Fig. 4B). Furthermore, it
was found that IL-6 and leptin markedly elevated the level of
secreted hepcidin (p=0.05) (Fig.
4C).
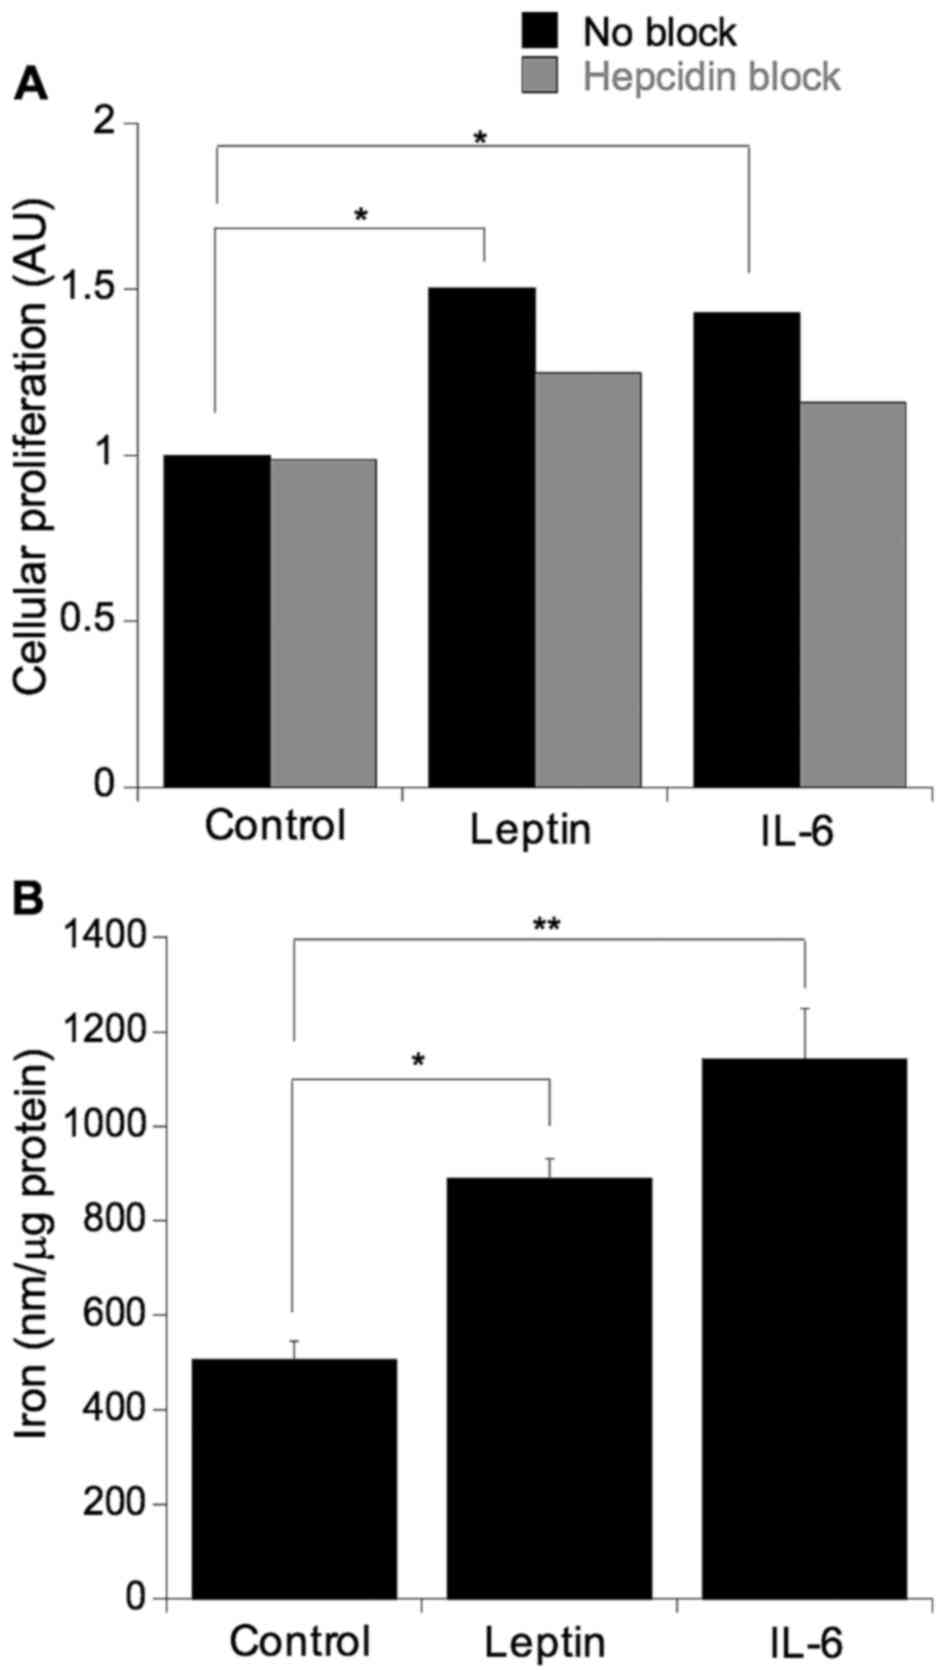
Leptin and IL-6-induced cellular viability and
proliferation were blocked by hepcidin inhibition. To ascertain
whether the previously observed leptin and IL-6-mediated increases
in cellular proliferation were, in part, a function of hepcidin
action, the SW480 cells were challenged with leptin or IL-6 in the
presence or absence of the hepcidin antagonist (Fig. 5A). As expected, leptin and IL-6 both
significantly increased cellular proliferation (leptin, p=0.05;
IL-6, p=0.03) and this induction was ablated with the addition of
the hepcidin antagonist, indicated by a non-statistically
significant difference in mean values (p=0.81) (Fig. 5A). To further assess whether the
proliferative effect of leptin and IL-6 impact on cellular iron
metabolism, the cells were cultured in the presence of either IL-6
or leptin and the levels of cellular iron were determined (Fig. 5B). Culturing with either IL-6 or
leptin resulted in an induction in cellular iron levels (IL-6,
p=0.0007; leptin, p=0.01).
Relationship between BMI, IL-6, leptin
and hepcidin in human serum samples
To investigate the relationship between human
clinical obesity (BMI ≥30 kg/m2), IL-6, leptin and
hepcidin, 163 well-characterised human serum samples were collected
from patients undergoing colonoscopy for suspected colonic disease.
Table I reports the means and
standard deviations of the combined patient data for BMI, leptin,
IL-6, hepcidin and haemoglobin.
 | Table I.Human serum sample analysis. |
Table I.
Human serum sample analysis.
|
| Age (years) | BMI
(kg/m2) | Hb (g/dl) | Hepcidin
(ng/ml) | IL-6 (ng/ml) | Leptin (ng/ml) |
|---|
| Mean | 63 | 29.76 | 14.51 | 36 | 26.3 | 2.01 |
| SD | 60–73 | 5.5 | 1.4 | 14 | 18.3 | 1.6 |
Investigating the combined data of the 163 patients,
there were correlations between BMI and IL-6 (Kendall's Tau-b=0.14,
p=0.01), BMI and leptin (Kendall's Tau-b=0.42, p<0.001) and BMI
and hepcidin (Kendall's Tau-b=−0.10, p=0.05). Serum hepcidin did
not correlate with IL-6 or leptin, but did positively correlate
with haemoglobin levels (Kendall's Tau-b=0.15, p<0.001). In
addition, there was a positive correlation between leptin and IL-6
(Kendall's Tau-b=0.10, p=0.05) (Table
II). Subanalyses were also performed on patient samples with:
no disease, presence of polyps and presence of adenocarcinoma. In
the group with no disease the only positive correlation was between
hepcidin and haemoglobin (Kendall's Tau-b=0.34, p=0.03). In the
group with polyps, positive correlations were observed for BMI and
leptin (Kendall's Tau-b=0.4, p<0.001) and hepcidin with
haemoglobin (Kendall's Tau-b=0.17, p=0.03). Finally, in the
adenocarcinoma group, hepcidin correlated with haemoglobin
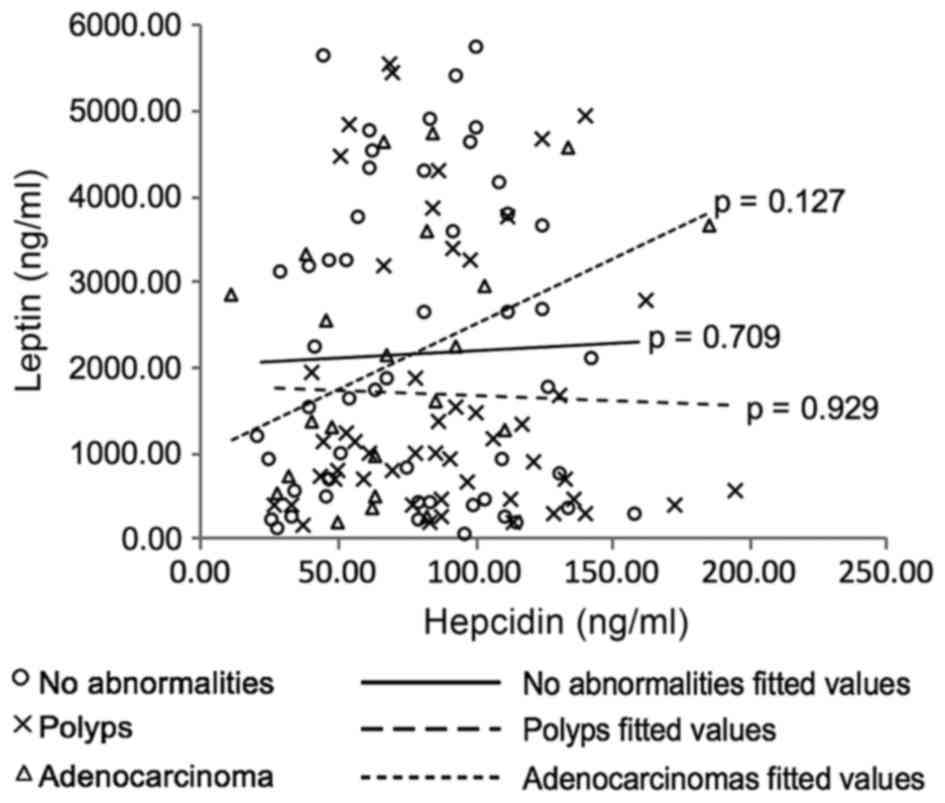
(Kendall's Tau-b=0.34, p=0.03). Scatter plots were produced to
visualise the data (not included) with one interesting relationship
observed between leptin and hepcidin in the adenocarcinoma patient
subcategory (Fig. 6). Although no
statistically significant correlation was determined (Kendall's
Tau-b=0.24, p=0.127), the plot reveals a possible different trend
(positive) in this group of patients in comparison with the data
from the polyp- and no abnormality-patient data. However, due to
the small sample size (n=22) further investigation is necessary to
determine if this observation is a real trend in this patient group
or artefactual.
| Table II.Correlations in human serum
samples. |
Table II.
Correlations in human serum
samples.
|
| Hb | BMI | Leptin | IL-6 | Hepcidin |
|---|
| All patients
(n=163) |
|
|
|
|
|
| Hb | 1.00 | – | – | – | – |
|
BMI | −0.07 | 1.00 |
|
|
|
|
| (0.15) | – | – | – |
|
|
Leptin | −0.11a | 0.42a | 1.00 | – | – |
|
| (0.03) | (< 0.001) |
|
|
|
|
IL-6 | −0.05 | 0.14a | 0.10 | 1.00 | – |
|
| (0.36) | (0.01) | (0.05) |
|
|
|
Hepcidin | 0.15a | −0.10a | −0.01 | −0.07 | 1.00 |
|
| (<0.001) | (0.05) | (0.78) | (0.14) |
|
| No abnormality
(n=51) |
|
|
|
|
|
| Hb | 1.0 | – | – | – | – |
|
BMI | −0.21 | 1.0 | – | – |
|
|
| (0.19) |
|
|
|
|
|
Leptin | 0.05 | 0.06 | 1.0 | – | – |
|
| (0.76) | (0.72) |
|
|
|
|
IL-6 | 0.1 | 0.07 | −0.15 | 1.0 | – |
|
| (0.55) | (0.67) | (0.34) |
|
|
|
Hepcidin | 0.34a | −0.08 | 0.24 | 0.16 | 1.0 |
|
| (0.03) | (0.63) | (0.13) | (0.31) |
|
| Polyps (n=39) |
|
|
|
|
|
| Hb | 1.0 | – | – | – | – |
|
BMI | 0.02 | 1.0 | – | – | – |
|
| (0.77) |
|
| – | – |
|
Leptin | −0.08 | 0.40a | 1.0 | – | – |
|
| (0.31) | (<0.001) |
|
|
|
|
IL-6 | −0.05 | 0.10 | −0.03 | 1.0 | – |
|
| (0.51) | (0.20) | (0.70) |
|
|
|
Hepcidin | 0.17a | −0.12a | 0.008 | −0.11 | 1.0 |
|
| (0.03) | (0.12) | (0.92) | (0.16) | 1.0 |
| Adenocarcinoma
(n=73) |
|
|
|
|
|
| Hb | 1.0 | – | – | – | – |
|
BMI | 0.21 | 1.0 | – | – | – |
|
| (0.19) |
|
|
|
|
|
Leptin | 0.05 | 0.06 | 1.0 | – | – |
|
| (0.76) | (0.72) |
|
|
|
|
IL-6 | 0.1 | 0.07 | −0.15 | 1.0 | – |
|
| (0.55) | (0.67) | (0.34) |
|
|
|
Hepcidin | 0.34 | −0.08 | 0.24 | 0.16 | 1.0 |
|
| (0.3) | (0.63) | (0.13) | (0.31) |
|
Finally, regression analysis was used to compare the
mean levels of BMI, Hb, hepcidin, IL-6 and leptin in the various
groups. Results indicated that the BMI was significantly lower in
the adenocarcinoma group compared to the normal and polyp groups
(p=0.03 and p=0.01, respectively) (Table III). Haemoglobin in the polyp
group was higher than that in the normal group (p=0.001) and the
adenocarcinoma group (p<0.001). The latter likely explains why
there is also a concomitant decrease in hepcidin levels in the
adenocarcinoma group compared to the polyp group (p=0.04).
Consistent with previous data, IL-6 was significantly elevated in
the adenocarcinoma group compared to the polyp and normal groups
(p=0.0001 and p=0.003, respectively).
| Table III.Mean levels of BMI, Hb, IL-6 and
leptin in the subdivided groups. |
Table III.
Mean levels of BMI, Hb, IL-6 and
leptin in the subdivided groups.
| Groups | BMI
(kg/m2) | Hb (g/dl) | Hepcidin
(ng/ml) | IL-6 (ng/ml) | Leptin (ng/ml) |
|---|
| Normal | 29.4 | 14.24 | 79.37 | 24.74 | 2167 |
| Polyps | 29.47 | 14.96a | 91.64 | 21.94 | 1752 |
|
Adeno-carcinoma | 27.41a,b | 13.95b | 72.0b | 34.73a,b | 2091 |
Discussion
Obesity is increasingly associated with risk and
progression of colorectal tumourigenesis; however, the underlying
mechanism remains to be elucidated. Previous studies have revealed
that obesity is linked with increased circulating levels of IL-6
(11–13) and leptin (7–9) and
indeed, this was also observed in our entire cohort of patients
where BMI is highly correlated with circulating IL-6 and leptin. In
the present study we revealed, as previous studies have, that human
adipose tissue is a highly metabolically active organ secreting a
plethora of adipokines/cytokines.
Notably, we demonstrated that in vitro
primary mature human adipocytes, isolated from the greater omentum,
secrete hepcidin along with the expected molecules IL-6 and leptin.
This is consistent with the studies of Bekri et al (22) which demonstrated that human adipose
tissue expresses hepcidin mRNA. The trigger for hepcidin expression
in adipose tissue is unclear, although previous studies have
implicated IL-6 and hypoxia (22,28).
The net effect of hepcidin expression in adipose tissue is likely
to be multifaceted and may explain the associated poor iron status
and low grade anaemia of chronic disease observed in obese
individuals (22–24). This is illustrated in a study of
patients undergoing bariatric surgery, where weight loss was
associated with decreased serum hepcidin and improved functional
iron profile (29). This
association of systemic hepcidin with body iron status is further
supported by our own patient data which reveal that hepcidin levels
are related to haemoglobin levels.
However, our study indicated that adipocytes can
secrete a complex cocktail of factors which may also impact
systemically on colorectal epithelial cells. Notably, we indicated
that leptin, IL-6 and hepcidin can all increase colonocyte cell
viability. Previous studies revealed that leptin may induce tumour
angiogenesis, reduce apoptosis, promote cell growth and migration
of colon cancer cells in vitro (8,30,31),
although, an in vivo murine study failed to show that leptin
alone can drive intestinal tumourigenesis (8). This is consistent with a prospective
nested case-control study within the European Prospective
Investigation into Cancer and Nutrition (EPIC) cohort (32). Conversely, other human
epidemiological studies have indicated a role for leptin in
colorectal tumourigenesis (7,33–34).
Thus, the role of leptin in colorectal carcinogenesis remains
unclear.
Several studies reported an association between
elevated levels of circulating IL-6 with the presence and stage of
colorectal cancer; this is consistent with our observation that
IL-6 is increased in the serum of cancer patients (11,35,36).
The increased levels of IL-6 may be a consequence of
adipose-derived secretion of IL-6, low-grade chronic inflammation
or perhaps due to the elevated IL-6 secretion by the tumour.
Furthermore, in vitro studies demonstrated that challenging
colorectal cell lines with IL-6 does induce a more aggressive
phenotype, including features such as anchorage-independent growth
and increased invasiveness (12,36).
Additionally, in the present study we demonstrated
that hepcidin can promote colonocyte cellular viability. The
importance of hepcidin in modulating colonocyte cell fate is
further supported by our data, which demonstrated that leptin and
IL-6 mediated increases in colonocyte proliferation appear to be
hepcidin dependent. This is exemplified by a complete abolishment
in leptin/IL-6 effects in the presence of a previously described
hepcidin antagonist (27). It is
clear from our data that challenging the SW480 cells with IL-6 or
leptin results in increased hepcidin expression. Whilst this may be
expected in adipocytes and hepatocytes (14,15),
this is the first time that such an observation has been made in
the context of a tissue which does not express hepcidin
endogenously. These observations may well shed light on previous
studies which reveal de novo cancer tissue expression of
hepcidin (18,37–39).
We predicted that local tumoural hepcidin expression
in the colon, as previously reported (18), is likely to be a consequence of
either local or systemic IL-6 and/or leptin, the latter being
directly influenced by the extent of adiposity. Whether this pool
of hepcidin contributes to systemic hepcidin is unclear, though
from the serum analyses in the cancer group, hepcidin was actually
suppressed compared to the polyp group. As such, it is likely that
this reflects the significant suppression in haemoglobin in the
cancer group in comparison to the polyp group.
Irrespective of the mechanism by which colorectal
cancer cells express hepcidin, the net effect is likely to be a
rise in intracellular iron; a consequence of a hepcidin mediated
loss of ferroportin (25) and this
is likely to impact in a plethora of ways including increasing the
rate of DNA synthesis (as a consequence of iron being a rate
limiting factor in the function of ribonucleotide function), ATP
generation and cell cycle (40). In
addition, in vitro and in vivo studies revealed that
excess cellular iron amplifies the Wnt signalling and intestinal
tumourigenesis (21,22).
In conclusion, our study confirmed that adipose
tissue is a metabolically active organ which secretes leptin, IL-6
and hepcidin. Notably the expression of colonocyte IL-6, leptin and
hepcidin are all interlinked. However, it is likely that hepcidin
is central to the process of tumourigenesis allowing excess
cellular iron to amplify Wnt signalling. A mechanism of ablating
de novo tissue hepcidin expression may prove to be a novel
platform for therapeutic intervention in obesity driven colorectal
tumourigenesis in this patient group.
Acknowledgements
We gratefully acknowledge the contribution to this
study made by the University of Birmingham's Human Biomaterials
Resource Centre which has been supported by the Birmingham Science
City and the Experimental Medicine Network of Excellence project.
We wish to acknowledge the grant support from the World Cancer
Research Fund (2009/SD04) for funding this study.
References
|
1
|
Arnold M, Pandeya N, Byrnes G, Renehan
PAG, Stevens GA, Ezzati PM, Ferlay J, Miranda JJ, Romieu I, Dikshit
R, et al: Global burden of cancer attributable to high body-mass
index in 2012: A population-based study. Lancet Oncol. 16:36–46.
2015. View Article : Google Scholar : PubMed/NCBI
|
|
2
|
Protani M, Coory M and Martin JH: Effect
of obesity on survival of women with breast cancer: Systematic
review and meta-analysis. Breast Cancer Res Treat. 123:627–635.
2010. View Article : Google Scholar : PubMed/NCBI
|
|
3
|
Onstad MA, Schmandt RE and Lu KH:
Addressing the role of obesity in endometrial cancer risk,
prevention, and treatment. J Clin Oncol. 34:4225–4230. 2016.
View Article : Google Scholar : PubMed/NCBI
|
|
4
|
Larsson SC and Wolk A: Obesity and colon
and rectal cancer risk: A meta-analysis of prospective studies. Am
J Clin Nutr. 86:556–565. 2007.PubMed/NCBI
|
|
5
|
Moghaddam AA, Woodward M and Huxley R:
Obesity and risk of colorectal cancer: A meta-analysis of 31
studies with 70,000 events. Cancer Epidemiol Biomarkers Prev.
16:2533–2547. 2007. View Article : Google Scholar : PubMed/NCBI
|
|
6
|
Considine RV, Sinha MK, Heiman ML,
Kriauciunas A, Stephens TW, Nyce MR, Ohannesian JP, Marco CC, McKee
LJ, Bauer TL, et al: Serum immunoreactive-leptin concentrations in
normal-weight and obese humans. N Engl J Med. 334:292–295. 1996.
View Article : Google Scholar : PubMed/NCBI
|
|
7
|
Stattin P, Lukanova A, Biessy C, Söderberg
S, Palmqvist R, Kaaks R, Olsson T and Jellum E: Obesity and colon
cancer: Does leptin provide a link? Int J Cancer. 109:149–152.
2004. View Article : Google Scholar : PubMed/NCBI
|
|
8
|
Chia VM, Newcomb PA, Lampe JW, White E,
Mandelson MT, McTiernan A and Potter JD: Leptin concentrations,
leptin receptor polymorphisms, and colorectal adenoma risk. Cancer
Epidemiol Biomarkers Prev. 16:2697–2703. 2007. View Article : Google Scholar : PubMed/NCBI
|
|
9
|
Jaffe T and Schwartz B: Leptin promotes
motility and invasiveness in human colon cancer cells by activating
multiple signal-transduction pathways. Int J Cancer. 123:2543–2556.
2008. View Article : Google Scholar : PubMed/NCBI
|
|
10
|
Fenton JI, Hord NG, Lavigne JA, Perkins SN
and Hursting SD: Leptin, insulin-like growth factor-1, and
insulin-like growth factor-2 are mitogens in ApcMin/+ but not
Apc+/+ colonic epithelial cell lines. Cancer Epidemiol Biomarkers
Prev. 14:1646–1652. 2005. View Article : Google Scholar : PubMed/NCBI
|
|
11
|
Knüpfer H and Preiss R: Serum
interleukin-6 levels in colorectal cancer patients - a summary of
published results. Int J Colorectal Dis. 25:135–140. 2010.
View Article : Google Scholar : PubMed/NCBI
|
|
12
|
Fenton JI, Hursting SD, Perkins SN and
Hord NG: Interleukin-6 production induced by leptin treatment
promotes cell proliferation in an ApcMin/+ colon epithelial cell
line. Carcinogenesis. 27:1507–1515. 2006. View Article : Google Scholar : PubMed/NCBI
|
|
13
|
Becker C, Fantini MC, Schramm C, Lehr HA,
Wirtz S, Nikolaev A, Burg J, Strand S, Kiesslich R, Huber S, et al:
TGF-beta suppresses tumor progression in colon cancer by inhibition
of IL-6 trans-signaling. Immunity. 21:491–501. 2004. View Article : Google Scholar : PubMed/NCBI
|
|
14
|
Chung B, Matak P, McKie AT and Sharp P:
Leptin increases the expression of the iron regulatory hormone
hepcidin in HuH7 human hepatoma cells. J Nutr. 137:2366–2370.
2007.PubMed/NCBI
|
|
15
|
Nemeth E, Rivera S, Gabayan V, Keller C,
Taudorf S, Pedersen BK and Ganz T: IL-6 mediates hypoferremia of
inflammation by inducing the synthesis of the iron regulatory
hormone hepcidin. J Clin Invest. 113:1271–1276. 2004. View Article : Google Scholar : PubMed/NCBI
|
|
16
|
Nelson RL: Iron and colorectal cancer
risk: Human studies. Nutr Rev. 59:140–148. 2001. View Article : Google Scholar : PubMed/NCBI
|
|
17
|
Mainous AG III, Gill JM and Everett CJ:
Transferrin saturation, dietary iron intake, and risk of cancer.
Ann Fam Med. 3:131–137. 2005. View
Article : Google Scholar : PubMed/NCBI
|
|
18
|
Ward DG, Roberts K, Brookes MJ, Joy H,
Martin A, Ismail T, Spychal R, Iqbal T and Tselepis C: Increased
hepcidin expression in colorectal carcinogenesis. World J
Gastroenterol. 14:1339–1345. 2008. View Article : Google Scholar : PubMed/NCBI
|
|
19
|
Brookes MJ, Hughes S, Turner FE, Reynolds
G, Sharma N, Ismail T, Berx G, McKie AT, Hotchin N, Anderson GJ, et
al: Modulation of iron transport proteins in human colorectal
carcinogenesis. Gut. 55:1449–1460. 2006. View Article : Google Scholar : PubMed/NCBI
|
|
20
|
Radulescu S, Brookes MJ, Salgueiro P,
Ridgway RA, McGhee E, Anderson K, Ford SJ, Stones DH, Iqbal TH,
Tselepis C and Sansom OJ: Luminal iron levels govern intestinal
tumorigenesis after Apc loss in vivo. Cell Reports. 2:270–282.
2012. View Article : Google Scholar : PubMed/NCBI
|
|
21
|
Brookes MJ, Boult J, Roberts K, Cooper BT,
Hotchin NA, Matthews G, Iqbal T and Tselepis C: A role for iron in
Wnt signalling. Oncogene. 27:966–975. 2008. View Article : Google Scholar : PubMed/NCBI
|
|
22
|
Bekri S, Gual P, Anty R, Luciani N, Dahman
M, Ramesh B, Iannelli A, Staccini-Myx A, Casanova D, Ben Amor I, et
al: Increased adipose tissue expression of hepcidin in severe
obesity is independent from diabetes and NASH. Gastroenterology.
131:788–796. 2006. View Article : Google Scholar : PubMed/NCBI
|
|
23
|
McClung JP and Karl JP: Iron deficiency
and obesity: The contribution of inflammation and diminished iron
absorption. Nutr Rev. 67:100–104. 2009. View Article : Google Scholar : PubMed/NCBI
|
|
24
|
Tussing-Humphreys LM, Liang H, Nemeth E,
Freels S and Braunschweig CA: Excess adiposity, inflammation, and
iron-deficiency in female adolescents. J Am Diet Assoc.
109:297–302. 2009. View Article : Google Scholar : PubMed/NCBI
|
|
25
|
Nemeth E, Tuttle MS, Powelson J, Vaughn
MB, Donovan A, Ward D McVey, Ganz T and Kaplan J: Hepcidin
regulates cellular iron efflux by binding to ferroportin and
inducing its internalization. Science. 306:2090–2093. 2004.
View Article : Google Scholar : PubMed/NCBI
|
|
26
|
Maachi M, Piéroni L, Bruckert E, Jardel C,
Fellahi S, Hainque B, Capeau J and Bastard JP: Systemic low-grade
inflammation is related to both circulating and adipose tissue
TNFalpha, leptin and IL-6 levels in obese women. Int J Obes Relat
Metab Disord. 28:993–997. 2004. View Article : Google Scholar : PubMed/NCBI
|
|
27
|
Kaplan J, Ward DM and De Domenico I:
Identification of the hepcidin binding site on ferroportin US
Patent 8530619 B2. October 26–2007, issued September 10, 2013.
|
|
28
|
Andrews M and Arredondo M: Hepatic and
adipocyte cells respond differentially to iron overload, hypoxic
and inflammatory challenge. Biometals. 25:749–759. 2012. View Article : Google Scholar : PubMed/NCBI
|
|
29
|
Tussing-Humphreys LM, Nemeth E, Fantuzzi
G, Freels S, Holterman AX, Galvani C, Ayloo S, Vitello J and
Braunschweig C: Decreased serum hepcidin and improved functional
iron status 6 months after restrictive bariatric surgery. Obesity
(Silver Spring). 18:2010–2016. 2010. View Article : Google Scholar : PubMed/NCBI
|
|
30
|
Aparicio T, Kotelevets L, Tsocas A,
Laigneau JP, Sobhani I, Chastre E and Lehy T: Leptin stimulates the
proliferation of human colon cancer cells in vitro but does not
promote the growth of colon cancer xenografts in nude mice or
intestinal tumorigenesis in ApcMin/+ mice. Gut. 54:1136–1145. 2005.
View Article : Google Scholar : PubMed/NCBI
|
|
31
|
Aleksandrova K, Nimptsch K and Pischon T:
Obesity and colorectal cancer. Front Biosci (Elite Ed). 5:61–77.
2013. View Article : Google Scholar : PubMed/NCBI
|
|
32
|
Aleksandrova K, Boeing H, Jenab M,
Bueno-de-Mesquita HB, Jansen E, van Duijnhoven FJ, Rinaldi S,
Fedirko V, Romieu I, Riboli E, et al: Leptin and soluble leptin
receptor in risk of colorectal cancer in the European Prospective
Investigation into Cancer and Nutrition cohort. Cancer Res.
72:5328–5337. 2012. View Article : Google Scholar : PubMed/NCBI
|
|
33
|
Stattin P, Palmqvist R, Söderberg S,
Biessy C, Ardnor B, Hallmans G, Kaaks R and Olsson T: Plasma leptin
and colorectal cancer risk: A prospective study in Northern Sweden.
Oncol Rep. 10:2015–2021. 2003.PubMed/NCBI
|
|
34
|
Tamakoshi K, Toyoshima H, Wakai K, Kojima
M, Suzuki K, Watanabe Y, Hayakawa N, Yatsuya H, Kondo T, Tokudome
S, et al: Leptin is associated with an increased female colorectal
cancer risk: A nested case-control study in Japan. Oncology.
68:454–461. 2005. View Article : Google Scholar : PubMed/NCBI
|
|
35
|
Ueda T, Shimada E and Urakawa T: Serum
levels of cytokines in patients with colorectal cancer: Possible
involvement of interleukin-6 and interleukin-8 in hematogenous
metastasis. J Gastroenterol. 29:423–429. 1994. View Article : Google Scholar : PubMed/NCBI
|
|
36
|
Komoda H, Tanaka Y, Honda M, Matsuo Y,
Hazama K and Takao T: Interleukin-6 levels in colorectal cancer
tissues. World J Surg. 22:895–898. 1998. View Article : Google Scholar : PubMed/NCBI
|
|
37
|
Hsu CP, Chen YL, Huang CC, Chou CC, Liu
CL, Hung CH, Kao TY and Chung YC: Anti-interleukin-6 receptor
antibody inhibits the progression in human colon carcinoma cells.
Eur J Clin Invest. 41:277–284. 2011. View Article : Google Scholar : PubMed/NCBI
|
|
38
|
Kamai T, Tomosugi N, Abe H, Arai K and
Yoshida K: Increased serum hepcidin-25 level and increased tumor
expression of hepcidin mRNA are associated with metastasis of renal
cell carcinoma. BMC Cancer. 9:2702009. View Article : Google Scholar : PubMed/NCBI
|
|
39
|
Pinnix ZK, Miller LD, Wang W, D'Agostino R
Jr, Kute T, Willingham MC, Hatcher H, Tesfay L, Sui G, Di X, et al:
Ferroportin and iron regulation in breast cancer progression and
prognosis. Sci Transl Med. 2:43ra562010. View Article : Google Scholar : PubMed/NCBI
|
|
40
|
Le NTV and Richardson DR: The role of iron
in cell cycle progression and the proliferation of neoplastic
cells. Biochim Biophys Acta. 1603:31–46. 2002.PubMed/NCBI
|