Introduction
Head and neck cancer (HNC) has a mortality rate of
40–50% and is detected in 600,000 cases annually worldwide,
accounting for ~3.8% of global cancer cases and ~3.6% of all
cancer-associated mortality (1,2). The
American Joint Committee on Cancer staging system for HNC demands
an integrated assessment of the patient, primarily including the
primary tumor (T), lymph node metastasis (N) and distant metastasis
(3). Traditionally, prognosis has
been associated with tumor stage (4,5).
Pereira et al (6) emphasized
that lymph node metastases (N stage) in patients with cancer are
associated with tumor aggressiveness, recommendation for systemic
therapy and poor prognosis. Different etiologies and a large
variety of molecular alterations drive HNC to be a markedly
heterogeneous disease. Recognizing the prognostic power of lymph
node metastases, the identification of potential novel biomarkers
associated with the lymph node stage of HNC is thus meaningful.
The understanding of human diseases ultimately
depends on the understanding of the genome and its functions
(7). The recent application of
microarray and sequencing technologies to transcriptomics has
altered the view of cancer diagnosis, treatment and prognostic
speculation. Over the past few years, subgroups of HNC
characterized by gene expression patterns have been identified
using expression arrays and RNA sequencing (8–10).
Tartour et al (11) revealed
that serum sIL-2Rα may be considered as an independent serum
biomarker in patients with HNC. Lin et al (12) reported that C1GALT1 serves a
critical role in HNC progression and highlighted the therapeutic
potential of targeting this gene during HNC treatment. Rettig et
al (13) identified that HEY1
is expressed independently of NOTCH1 and is associated with a poor
prognosis in HNC. Nevertheless, the majority of existing studies
are limited to screening for genes with differential expression,
and ignore the close connections between them.
Weighted gene co-expression network analysis (WGCNA)
is systematic bioinformatics approach used to describe the
associations among genes across microarray samples (14). This method may be used to find
modules of tightly correlated genes, summarize these modules using
an intramodular hub gene or the module eigengene and calculate
module membership measures. At present, it has been generally
acknowledged and used to identify hub genes in various cancer
types, including breast cancer (15), pancreatic carcinoma (16) and osteosarcoma (17). By constructing co-expression
networks, 10 hub genes in oral squamous cell carcinoma were
identified and validated (18). Li
(19) reported that TPX2,
microtubule nucleation factor (TPX2), minichromosome maintenance
complex component 2, ubiquitin like with PHD and ring finger
domains 1, cyclin dependent kinase 2 and protein regulator of
cytokinesis 1 were associated with the tumorigenesis of laryngeal
squamous cell carcinoma. However, previous studies have primarily
identified hub genes associated with the pathogenesis of cancer,
and studies associated with prognosis have not been reported. In
the present study, a co-expression network of interconnection
between the genes of HNC was constructed using WGCNA analysis, and
network-centric genes associated with tumor prognosis were
identified.
Materials and methods
Study design
To clarify the data collection, preprocessing,
analysis and validation, a schematic of the research process is
presented in Fig. 1.
Data collection
Raw mRNA expression profiles of HNC were downloaded
from the Gene Expression Omnibus (GEO) database (http://www.ncbi.nlm.nih.gov/geo/), a public data
repository of functional genomics data. Using the search terms
‘head and cancer [MeSH Terms] AND Expression profiling by array
[DataSet Type] AND Homo sapiens [Organism]’ in the GEO datasets,
datasets GSE65858 and GSE39366 were further screened. Dataset
GSE65858 performed on Illumina HumanHT-12 V4.0 Expression Beadchips
(Illumina Inc., San Diego, CA, USA), including 270 head and neck
squamous cell carcinoma (HNSC) tumor samples with clinical and
prognostic variables (20), was
used for constructing a weighted gene co-expression network and
subsequently for identifying hub genes. As a validation set,
dataset GSE39366 performed on Agilent-UNC-custom-4X44K (Agilent
Technologies, Inc., Santa Clara, CA, USA), consisting of 138 HNSC
samples, was used to verify the results (9). Moreover, RNA sequencing data for HNC
were downloaded from the Cancer Genome Atlas (TCGA) database
(https://portal.gdc.cancer.gov/repository), consisting
of 500 tumor samples with complete expression profiles and clinical
information and 44 normal tissues, to further validate the
results.
Data preprocessing and screening
With regard to dataset GSE65858, robust multiarray
averaging background correction was performed with the raw
expression data, and the processed signals were subjected to log2
transformation and quantile normalization. The ‘affy’ R package
(21) was used to summarize the
median polished probe sets. According to the distances between
different samples in average linkage, microarray quality was
assessed via sample clustering, and no samples from GSE65858 were
removed from the subsequent analysis. The standard deviation values
for gene expression were obtained from the expression matrices.
Subsequently, the genes were ranked and the top 25% were screened
for the following analysis.
Weighted gene co-expression network
construction
Given that gene co-expression analysis is extremely
sensitive to the existence of abnormal samples, strict quality
control procedures were implemented to ensure the highest quality
level, followed by step-by-step network construction and module
detection. To construct a scale-free gene co-expression network,
the WGCNA package in R (14,22,23)
was used. First, Pearson's correlation matrices were performed on
all gene pairs. Next, using the power function amn=|cmn|β (where
amn is the adjacency between genes m and n, and cmn is the
Pearson's correlation between genes m and n), a weighted adjacency
matrix was constructed. As a soft-thresholding parameter, parameter
β may penalize weak correlations between genes while emphasizing
strong correlations. To ensure a scale-free network in the present
study, the power of β=4 (scale free R2=0.91) was
selected (24). Then, the adjacency
was transformed into a topological overlap matrix (TOM); TOM is
defined as the contiguous sum with all the other genes used for
network generation and for measurement of the network connectivity
of genes (25). Then, we calculated
the corresponding dissimilarity (1-TOM). To classify genes with
similar expression profiles into different modules, average linkage
hierarchical clustering was performed, according to TOM-based
dissimilarity measures; the minimum size (genome) of the gene
dendrogram was 50 (26). To
investigate the module further, the dissimilarity of module
eigengene (MEs) was calculated, a cut line for the module
dendrogram was selected, and certain modules were merged (16).
Clinically significant modules and hub
gene identification
When the initial set of modules had been created,
the correlations among MEs were used to merge close modules. MEs,
the first major component of gene expression within a module,
summarize the feature expression patterns of modules, and modules
with extremely similar expression profiles display highly
correlated eigengenes (27). Gene
significance (GS) refers to the log10 conversion of the P-value in
a linear regression (GS=lgP) between clinical traits and gene
expression, and module significance (MS) refers to the average GS
of all genes in the module.
Typically, modules with an absolute MS ranking first
or second in all modules are considered candidates relevant to
clinical traits (16).
It has been demonstrated that hub genes, defined as
genes that are strongly connected with others in a module, have a
significant function (16). In this
study, upon selecting modules of interest, the hub genes by the
conditions of module connectivity (cor.geneModuleMembership
>0.8) and clinical trait relationship (cor.geneTraitSignificance
>0.2), which were measured by the absolute Pearson's correlation
value (15). To identify key hub
genes among the candidates, a linear regression analysis was
performed to assess the link between the clinical features of
interest and the expression of hub genes, and R2 was
defined as the association between them.
Real hub gene validation. The training set
(GSE65858), test set TCGA HNSC and public database Gene Expression
Profiling Interactive Analysis (GEPIA) were used to identify the
real hub genes. First, a Pearson correlation analysis of the
N-stage gene expression was performed using the GSE65858 and TCGA
HNSC datasets. Pearson correlation analysis of clinical staging
gene expression and one-way analysis of variance (ANOVA) were
conducted using the GSE65858 and TCGA HNSC datasets. Subsequently,
survival analysis for these genes was performed using the GSE65858
and TCGA HNSC datasets. Genes in all tests with significant
P-values were identified as true hub genes. To verify the results
further, the GEPIA database (http://www.gepia.cancer-pku.cn) was used to validate
the expression levels of the real hub genes.
Gene set enrichment analysis
(GSEA)
The samples in the GSE65858 and GSE39366 datasets
were respectively divided into two groups based on the median
expression levels of the real hub genes. To further analyze the
potential function of the hub genes further, GSEA analysis
(http://software.broadinstitute.org/gsea/index.jsp) was
performed to detect whether genes in the two groups were enriched
with meaningful biological processes (28). The annotated gene set collection
sh.all.v6.1.symbols.gmt [Hallmarks] in the molecular signatures
database (MSigDB; http://software.broadinstitute.org/gsea/msigdb/index.jsp)
was selected as the reference. Furthermore, P<0.05 was set as
the cut-off criterion. In addition, a Venn plot was generated based
on the results for the GSE65858 and GSE39366 datasets.
Results
Training set quality assessment and
gene screening
As indicated in the workflow in Fig. 1, the gene expression matrices from
the 270 samples in training set GSE65858 were first downloaded
following data preprocessing. The standard deviation values of gene
expression were obtained from the expression matrices. The genes
were ranked and the top 25% (4,295 genes) were screened for
subsequent analysis.
WGCNA identifies key modules
Following the initial quality assessment performed
using the WGCNA R package via the average linkage method, no
samples were removed from the GSE65858 dataset for the subsequent
analysis (Fig. 2). As presented in
Fig. 2, a total of 11 clinical
traits had been identified, including gender, age, smoking, smoking
pack years, alcohol, UICC stage, T stage, N stage, distant
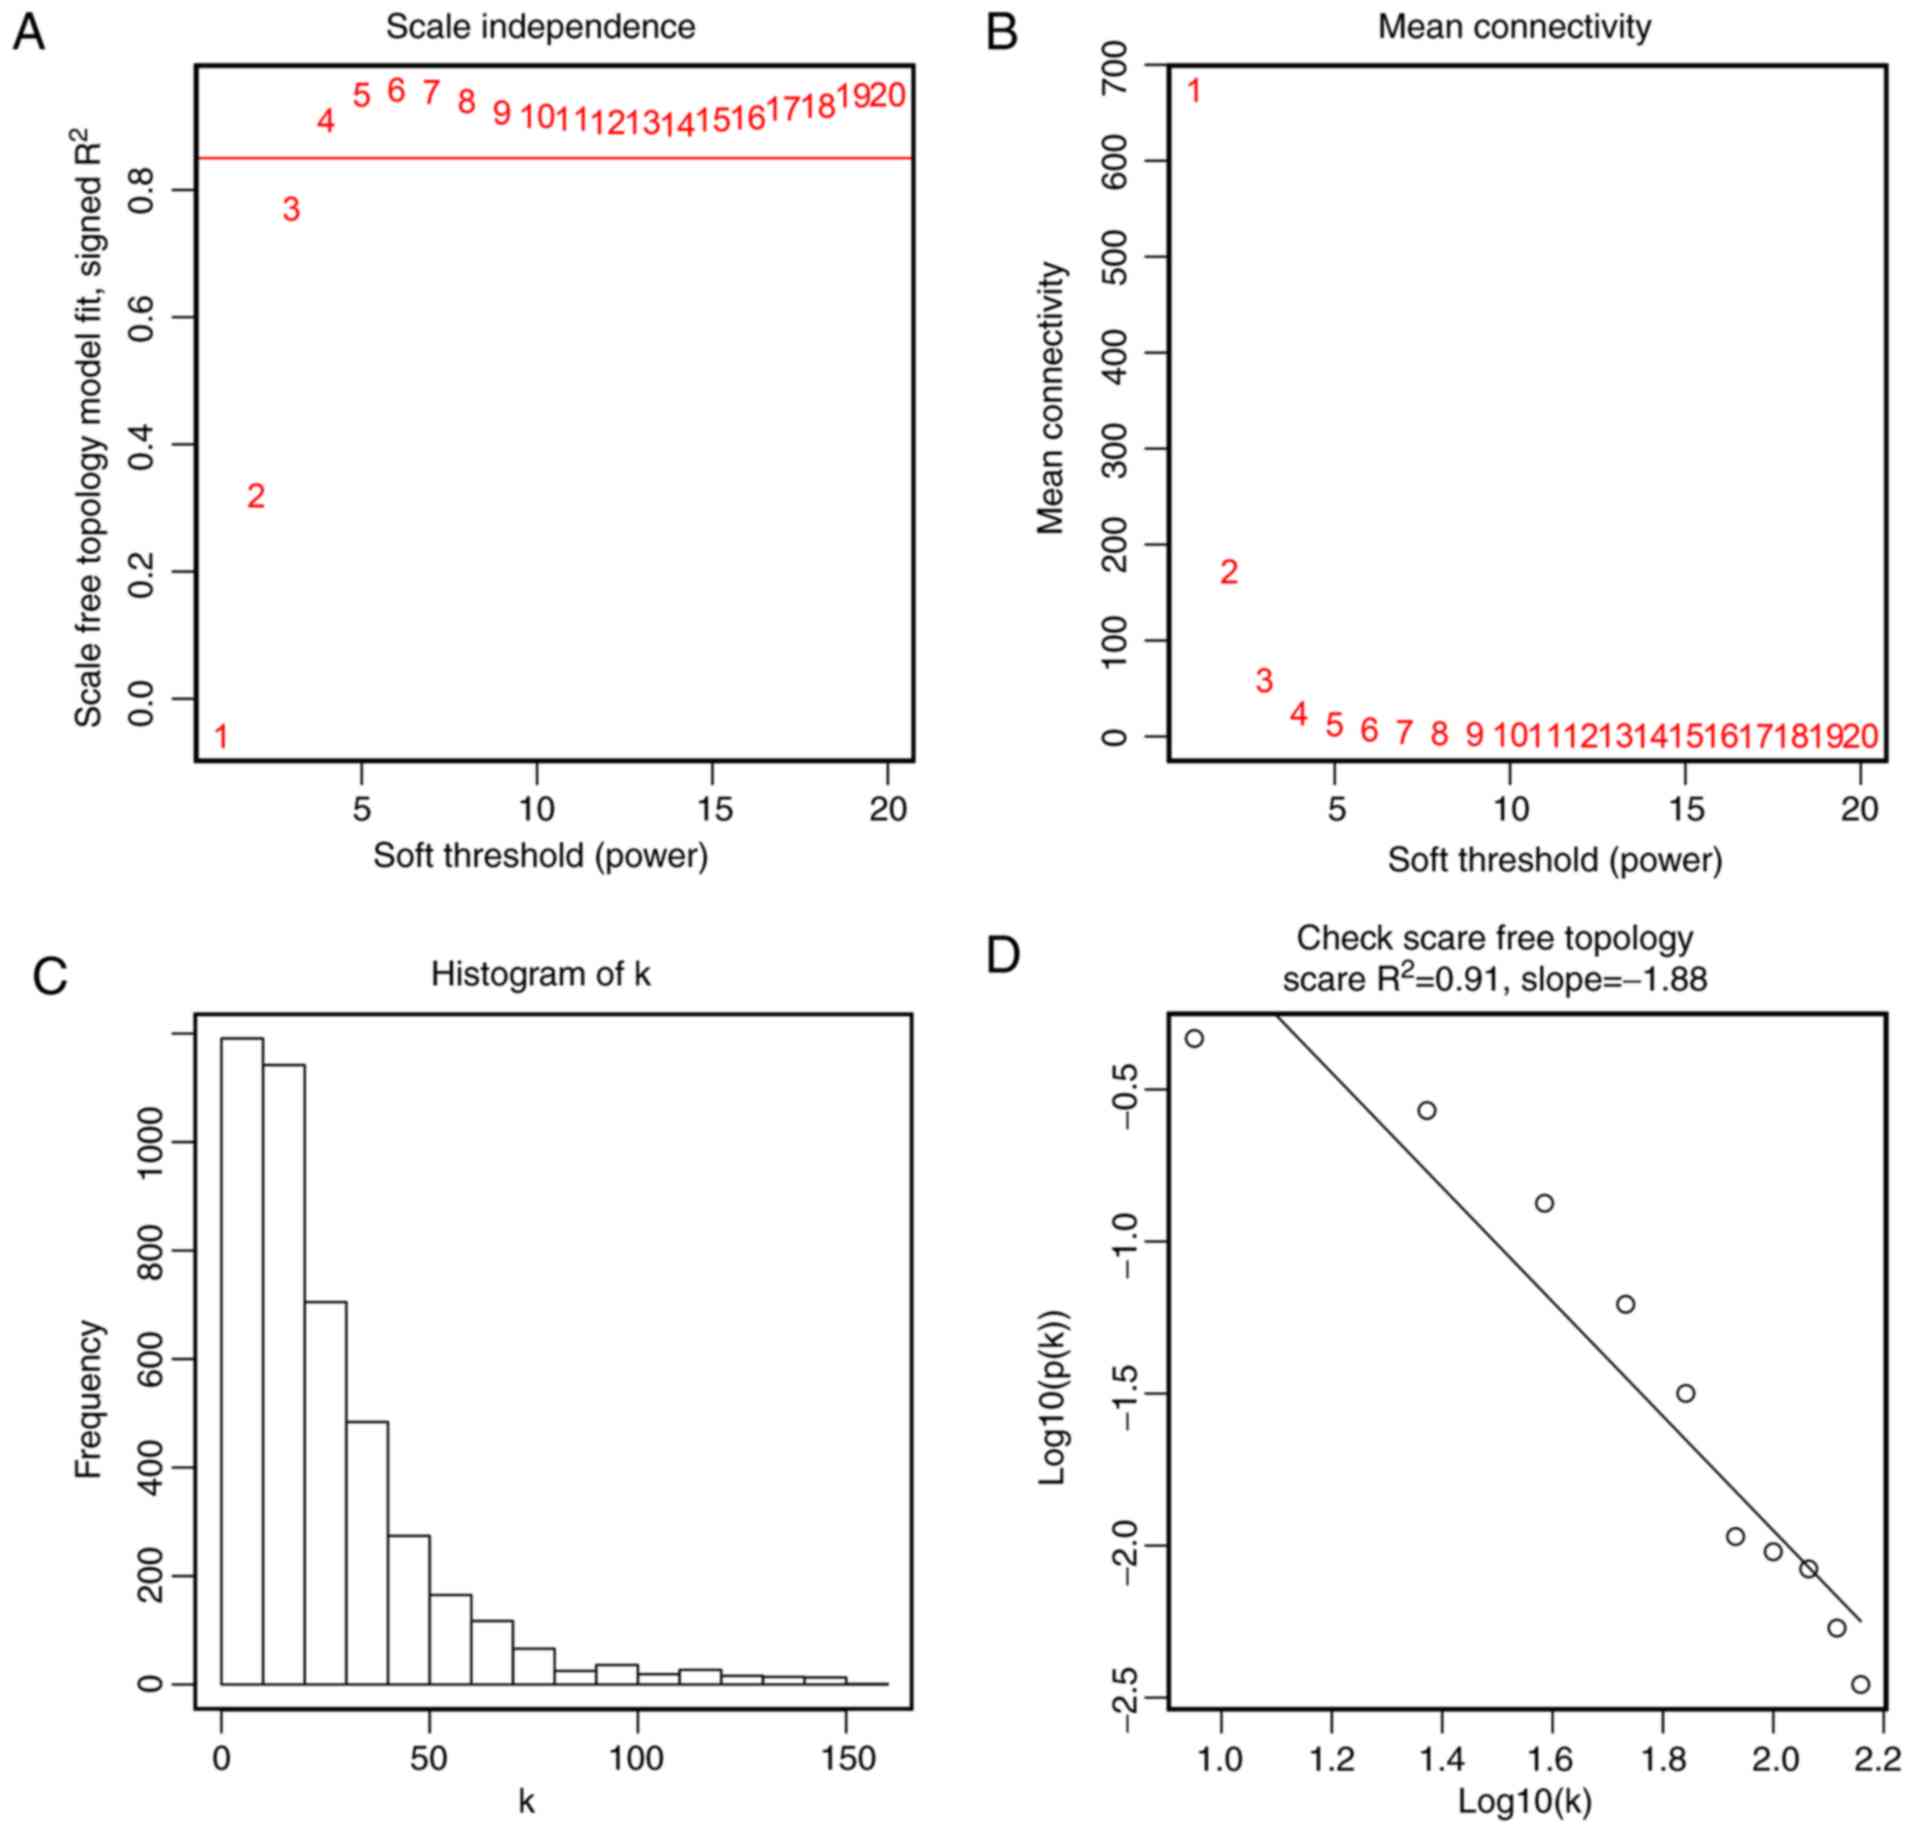
metastasis, treatment and HPV DNA status. To ensure a scale-free
network, the scale-free fit index and mean connectivity were
calculated and the power of β=4 (scale free R2=0.91) was
selected to perform further analysis (Fig. 3). Moreover, genes with similar
expression patterns could be placed into different modules via
average linkage clustering. Finally, 12 modules were identified
(Fig. 4). Two methods, namely
module-trait relationship and MS analysis, were used to examine the
associations between the clinical traits and each module (Fig. 5A and B). First, modules with a
better MS were considered to have a closer association with
meaningful clinical traits of interest. It was identified that two
modules, namely the blue and black modules, had higher MS values
compared with the other modules. They were identified as the
modules most relevant to the N stage of HNC.
 | Figure 5.Identification of modules associated
with clinical information. (A) Heatmap of the correlation between
ME and different clinical information of HNSC (gender, age,
smoking, smoking pack years, alcohol, UICC Stage, T stage, N stage,
distant metastasis, treatment and HPV DNA). (B) Distribution of
average gene significance and errors in the modules associated with
the N stage of HNSC. Scatter plot of module eigengenes in the (C)
blue and (D) black modules. T, primary tumor; N, lymph node; UICC,
Union for International Cancer Control; HPV, human papillomavirus;
ME, module eigengene; HNSC, head and neck squamous cell
carcinoma. |
Candidate hub gene identification
Based on module connectivity, clinical trait
relationship, and absolute value of Pearson's correlation
(cor.geneModuleMembership >0.8, cor.geneTraitSignificance
>0.2), we selected 18 genes with tight connectivity as candidate
hub genes in the two modules (Fig. 5C
and D). A total of 16 genes, keratinocyte differentiation
associated protein, suprabasin, cornifelin (CNFN), small proline
rich protein 1B (SPRR1B), desmoglein 1 (DSG1), chromosome 10 open
reading frame 99 (C10orf99), keratin 16 pseudogene 3, gap junction
protein β2 (GJB2), dermokine, LY6/PLAUR domain containing 3
(LYPD3), transmembrane protein 79, phospholipase A2 group IVE
(PLA2G4E), transglutaminase 5 (TGM5), potassium two pore domain
channel subfamily K member 6, involucrin (IVL) and kallikrein
related peptidase 8 (KLK8), which were negatively correlated with
the N-stage, were identified as candidates in the blue module.
Meanwhile, structural maintenance of chromosomes 4 and mutS homolog
6 (MSH6) were identified as candidates in the black module with a
positive association.
Real hub gene identification and
validation
To further validate the hub genes in TCGA, the
candidate hub gene expression N stage mRNA sequencing data of 500
patients with HNC were subjected to Pearson's correlation analysis
(Table I). Genes with significant
differences in the two networks (C10orf99, CNFN, DSG1, GJB2, IVL,
KLK8, LYPD3, MSH6, PLA2G4E, SPRR1B and TGM5) were selected as the
hub genes for further analysis and validation (Fig. 6). N stage is associated with
clinical stage; to validate this correlation further, the GSE65858
dataset containing 270 HNC tumors and mRNA sequencing data with
clinical and prognostic variables of patients with HNC in TCGA were
separately subjected to Pearson's correlation analysis and one-way
ANOVA (Table I). Among all genes
selected as candidate hub genes, only CNFN and DSG1 were found in
the two networks (Fig. 7).
Considering that the progression of a tumor affects patient
prognosis, a survival analysis of CNFN and DSG1 was performed.
Furthermore, it was observed that patients with increased CNFN
expression had an improved survival probability in the GSE65858 and
TCGA datasets (Fig. 8A and B),
compared with DSG1, which only exhibited its prognostic role in the
TCGA HNSC dataset. Therefore, CNFN was identified as the real hub
gene for further validation. In addition, it was identified that in
the GEPIA database, the specific expression of CNFN in normal
samples of HNSC was significantly higher than other tumors and
other normal tissues. More convincingly, the expression of CNFN
exhibited a significant downregulation in HNSC tissues compared
with normal samples (Fig. 8C and
D).
 | Table I.Summary of the results of N stage
validation and clinical stage validation. |
Table I.
Summary of the results of N stage
validation and clinical stage validation.
|
| N stage Pearson's
correlation | Stage Pearson's
correlation | Stage One-way
ANOVA |
|---|
|
|
|
|
|
|---|
|
| GSE65858 | TCGA HNSC | GSE65858 | TCGA HNSC | GSE65858 | TCGA HNSC |
|---|
|
|
|
|
|
|
|
|
|---|
| Gene | Correlation | P-value | Correlation | P-value | Correlation | P-value | Correlation | P-value | F | P-value | F | P-value |
|---|
| C10orf99 | −0.205 |
6.80×10⁻⁴ | −0.218 |
9.08×10⁻⁶ | −0.175 |
3.94×10⁻³ | −0.113 |
1.91×10⁻² | 2.799 |
4.05×10⁻² | 2.119 |
9.71×10⁻² |
| CNFN | −0.144 |
1.77×10⁻² | −0.148 |
2.79×10⁻³ | −0.144 |
1.82×10⁻² | −0.128 |
7.61×10⁻³ | 2.672 |
4.79×10⁻² | 3.642 |
1.29×10⁻² |
| DMKN | −0.208 |
5.94×10⁻⁴ | −0.089 |
7.20×10⁻² | −0.132 |
2.98×10⁻² | −0.019 |
6.87×10⁻¹ | 1.724 |
1.63×10⁻¹ | 0.298 |
8.27×10⁻¹ |
| DSG1 | −0.287 |
1.56×10⁻⁶ | −0.172 |
5.03×10⁻⁴ | −0.279 |
3.22×10⁻⁶ | −0.125 |
9.19×10⁻³ | 8.185 |
3.13×10⁻⁵ | 2.982 |
3.11×10⁻² |
| GJB2 | −0.19 |
1.72×10⁻³ | −0.166 |
7.85×10⁻⁴ | −0.153 |
1.18×10⁻² | −0.09 |
6.18×10⁻² | 2.242 |
8.38×10⁻² | 1.322 |
2.67×10⁻¹ |
| IVL | −0.222 |
2.31×10⁻⁴ | −0.23 |
2.87×10⁻⁶ | −0.134 |
2.78×10⁻² | −0.116 |
1.58×10⁻² | 1.695 |
1.68×10⁻¹ | 3.098 |
2.67×10⁻² |
| KCNK6 | −0.187 |
2.07×10⁻³ | −0.12 |
1.56×10⁻² | −0.111 |
6.84×10⁻² | −0.037 |
4.49×10⁻¹ | 1.829 |
1.42×10⁻¹ | 0.423 |
7.37×10⁻¹ |
| KLK8 | −0.224 |
2.13×10⁻⁴ | −0.141 |
4.51×10⁻³ | −0.166 |
6.33×10⁻³ | −0.084 |
8.21×10⁻² | 2.782 |
4.14×10⁻² | 1.165 |
3.23×10⁻¹ |
| KRT16P3 | −0.215 |
3.72×10⁻⁴ | −0.074 |
1.36×10⁻¹ | −0.177 |
3.46×10⁻³ | −0.019 |
6.87×10⁻¹ | 3.073 |
2.83×10⁻² | 0.19 |
9.03×10⁻¹ |
| KRTDAP | −0.183 |
2.49×10⁻³ | −0.129 |
9.30×10⁻³ | −0.175 |
3.90×10⁻³ | −0.052 |
2.82×10⁻¹ | 2.9 |
3.55×10⁻² | 0.417 |
7.41×10⁻¹ |
| LYPD3 | −0.177 |
3.56×10⁻³ | −0.176 |
3.73×10⁻⁴ | −0.127 |
3.75×10⁻² | −0.121 |
1.15×10⁻² | 1.929 |
1.25×10⁻¹ | 2.563 |
5.43×10⁻² |
| MSH6 | 0.2 |
9.52×10⁻⁴ | 0.13 |
8.90×10⁻³ | 0.121 |
4.69×10⁻² | 0.022 |
6.44×10⁻¹ | 2.432 |
6.55×10⁻² | 0.422 |
7.37×10⁻¹ |
| PLA2G4E | −0.209 |
5.39×10⁻⁴ | −0.219 |
8.40×10⁻⁶ | −0.095 |
1.19×10⁻¹ | −0.124 |
1.01×10⁻² | 1.125 |
3.40×10⁻¹ | 2.767 |
4.15×10⁻² |
| SBSN | −0.191 |
1.62×10⁻³ | −0.125 |
1.15×10⁻² | −0.167 |
6.01×10⁻³ | −0.084 |
8.05×10⁻² | 2.66 |
4.86×10⁻² | 1.746 |
1.57×10⁻¹ |
| SMC4 | 0.193 |
1.42×10⁻³ | 0.043 |
3.89×10⁻¹ | 0.101 |
9.73×10⁻² | 0 |
9.99×10⁻¹ | 1.073 |
3.61×10⁻¹ | 0.528 |
6.63×10⁻¹ |
| SPRR1B | −0.176 |
3.72×10⁻³ | −0.185 |
1.80×10⁻⁴ | −0.146 |
1.60×10⁻² | −0.115 |
1.71×10⁻² | 2.02 |
1.11×10⁻¹ | 3.132 |
2.55×10⁻² |
| TGM5 | −0.22 |
2.76×10⁻⁴ | −0.178 |
3.07×10⁻⁴ | −0.165 |
6.48×10⁻³ | −0.086 |
7.53×10⁻² | 2.727 |
4.46×10⁻² | 2.314 |
7.54×10⁻² |
| TMEM79 | −0.186 |
2.19×10⁻³ | −0.128 |
9.84×10⁻³ | −0.139 |
2.20×10⁻² | −0.095 |
4.79×10⁻² | 2.128 |
9.70×10⁻² | 1.57 |
1.96×10⁻¹ |
Gene set enrichment analysis
Kyoto Encyclopedia of Genes and Genomes pathway
enrichment analysis is only used for the analysis of differentially
expressed genes (DEGs), whereas GSEA analysis uses all probes or
genes in the microarray, regardless of whether the gene is a DEG or
not (15). GSEA analysis was
performed in the present study using the GSE65858 and GSE39366
datasets. A total of 10 gene sets were enriched in GSE65858, while
three were enriched in GSE39366. A total of three gene sets, ‘P53
pathway’, ‘estrogen response early’ and ‘estrogen response late’,
were enriched in both datasets (Fig.
9).
Discussion
Head and neck oncology encompasses a group of
malignancies that arise in the mucosal surfaces of the upper
aerodigestive tract, including the oral cavity, pharynx, larynx and
paranasal sinuses, in addition to cancer of the major and minor
salivary glands (29). In addition,
squamous cell carcinomas are the most common head and neck
malignancies. Assigning the proper clinical stage, estimating
prognosis and planning treatment are key for clinicians treating
patients with cancer (29). Solid
tumor progression is characterized by regional lymph nodes
metastasis and distant organ dissemination. A number of studies
have demonstrated that the presence of lymph node metastasis in
cancer patients is correlated with a poor prognosis and determines
the course of treatment to a certain extent (30–32).
Further studies are required with respect to lymph node metastasis
for HNC prognosis estimation and treatment planning.
The identification of disease-associated modules via
co-expression analysis has emerged as a powerful method of
obtaining novel insights into cancer biology (33). A number of studies have identified
that gene signatures may predict the early detection, clinical
stage, survival outcome or treatment of cancer (34–36).
Based on WGCNA, Yuan et al (15) reported that COL3A1 was associated
with the aggressiveness and poor prognosis of breast cancer with
the possible mechanism of regulating the MAPK pathway. Zhou et
al (16) reported that ten hub
genes (cyclin B1, centromere protein F, DLG associated protein 5,
cyclin A2, kinesin family member 14, NIMA related kinase 2, kinesin
family member 23, TPX2, ubiquitin conjugating enzyme E2C and Rac
GTPase activating protein 1), which were associated with tumor
progression and prognosis, were identified in pancreatic carcinoma.
Liu et al (17) identified
essential genes involved in the pathogenesis of osteosarcoma by
constructing a gene co-expression network. Using the WGCNA
approach, the blue and black modules associated with the N stage of
HNC were screened in the present study. A total of 18 genes with
high connectivity in the two modules were distinguished as
candidate hub genes. These genes were enriched in the ‘P53,’
‘estrogen response early,’ and ‘estrogen response late’ pathways
via pathway enrichment analysis of GSEA. Following verification,
CNFN and DSG1 were obtained as real hub genes closely associated
with the N stage of HNC and vital biological processes. Following
further validation via survival analysis, CNFN was demonstrated to
be more tightly correlated with survival compared with DSG1.
CNFN (cornifelin, also termed PLAC8L2) is highly
expressed in the esophagus and skin, and is located on chromosome
19q13.2. There are few reports on CNFN, and no reports verifying
its function, to the best of our knowledge. Huang et al
(37) revealed that CNFN was one of
the core genes in the placental tissue involved in the development
of gestational diabetes mellitus. Michibata et al (38) demonstrated that CNFN had increased
expression in psoriatic skin. As one of the novel UVB signature
genes, CNFN may be utilized to predict UVB photobiological effects
on the skin and skin carcinogenesis (39). Zhang et al (40) reported that CNFN was potentially
important for breast cancer due to its differential expression in
tumors compared with normal breast tissues. Excluding these
reports, no research on CNFN and other diseases was identified. In
the present study, CNFN was regarded as the key hub gene associated
with the clinical stage of HNC with survival differences, and
exhibited differential expression between normal and tumor samples
of HNSC, suggesting that CNFN may be used as a biomarker for
assigning the correct clinical stage and for estimating the
prognosis of patients with HNC.
The functional and pathway enrichment analysis
indicated that three gene sets, ‘P53 pathway’, ‘estrogen response
early’ and ‘estrogen response late’, were significantly enriched.
The P53 pathway, one of the canonical pathways controlling
cell-cycle progression, cell growth and apoptosis, has been
reported to serve important roles in natural malignancy
carcinogenesis (41–43). TP53, also known as Tp53 or p53, is
frequently altered in human cancer. The reactivation of p53
activity in tumors results in tumor suppression in vivo
(44). Oncogenes are overexpressed
in numerous cancer types, thereby inhibiting the expression of
tumor suppressor p53 (45). Wade
et al (46) reported that as
an oncogene, MDMX is overexpressed in a number of tumors, including
breast and colorectal cancer, melanoma and osteosarcoma, leading to
the suppression of tumor suppressor p53. The amplification of MDMX
may inhibit the anticancer effects of the p53 protein and lead to
tumor resistance (45).
Venkatanarayan et al (44)
reported that pramlintide, a synthetic analog of amylin, was
extremely effective for p53-deficient thymic lymphomas, indicating
a novel therapeutic strategy to target p53-deficient tumors.
Therefore, personalized cancer therapy that is based on targeting
the P53 pathway is an appealing therapeutic strategy for treating
cancer with P53 pathway dysfunction. The P53 pathway is frequently
co-altered with other pathways. One alteration of this canonical
pathway is sufficient to alter others functionally, and pathways
frequently have multiple alterations in one tumor sample (43). For example, in the small intestine
and colon, the suppression of APC produces adenomas; with mutations
of Kras and p53, this may progress to invasive carcinoma (47). To maintain homeostasis and proper
cellular function, large tumor suppressor kinases 1 and 2, the
Dbf2-related kinases, have emerged as central regulators of cell
fate by modulating the p53 and estrogen pathways (48). Kundu et al (49) indicated that in certain ER+ breast
cancers the estrogen-MDM2-Rb-E2F1 axis is a central hub for
estrogen-mediated p53-independent signal transduction. Zwijsen
et al (50) demonstrated
that estrogen, which acts via binding to a specific estrogen
receptor (ER), played an important role in regulating the cell
proliferation of the female breast. In breast cancer, the estrogen
response and ERBB2/HER-2 pathways have long been implicated in
etiology and drug response (51).
Hsu et al (52) reported
that aberrantly amplified estrogen response elements may
potentially deregulate target gene expression associated with
breast cancer development. CNFN, the gene identified in the present
study to be closely associated with N stage and survival, may be
involved in the P53 pathway and estrogen response. Therefore,
further exploration of the P53 pathway and estrogen response, in
addition to the associated genes, is warranted.
Although the present study identified hub genes
associated with lymph node metastasis and survival via
bioinformatics methods, no experimental study of these real hub
genes was conducted, which is a limitation of the study. A clinical
study and a functional analysis in vivo and in vitro
are required to investigate the functions of these genes further.
In conclusion, CNFN was involved in the progression of lymph node
metastasis in HNC. This correlation provided a hypothesis that
genes associated with N stage may have an essential role in
deciding HNC metastatic progression. To elucidate additional
carcinogenesis and metastasis targets, more basic functional
studies are required to investigate these selected genes
further.
Acknowledgements
This study is a partial fulfillment of the
requirements for the doctoral degrees of Dr Xingya Gao and Dr Xia
He. The authors would like to thank the Jiangsu Cancer Hospital and
No. 2 People's Hospital of Lianyungang for their assistance.
Funding
This study was supported by the Young and
Middle-aged Medical Talent Growth Fund of No. 2 People's Hospital
of Lianyungang (grant no. TQ201701), the National Natural Science
Foundation of China (grant no. 81672989), the National Natural
Science Foundation of China (grant no. 81702685), and the fifth
phase of the ‘333 Project’ medium of Jiangsu Province (grant no.
BRA2016523).
Availability of data and materials
All data generated or analyzed during this study are
included in this published article.
Authors' contributions
BL, LY, XG and XH are guarantors of the integrity of
the entire study. BL, LY, XG and XH conceived the study. BL, XG and
XH designed the study. GH, XT and HZ performed data acquisition.
BL, ZM and GH analyzed and interpreted the data. BL performed the
statistical analysis and wrote the manuscript. XT and LY were
responsible for manuscript revision/review. All authors read and
approved the manuscript and agree to be accountable for all aspects
of the research in ensuring that the accuracy or integrity of any
part of the work are appropriately investigated and resolved.
Ethics approval and consent to
participate
Not applicable.
Patient consent for publication
Not applicable.
Competing interests
The authors declare that they have no competing
interests.
Glossary
Abbreviations
Abbreviations:
|
HNC
|
head and neck cancer
|
|
T
|
primary tumor
|
|
N
|
lymph node
|
|
WGCNA
|
weighted gene co-expression network
analysis
|
|
TCGA
|
The Cancer Genome Atlas
|
|
GEO
|
Gene Expression Omnibus
|
|
GEPIA
|
Gene Expression Profiling Interactive
Analysis
|
|
GSEA
|
gene set enrichment analysis
|
|
TOM
|
topological overlap matrix
|
|
MEs
|
module eigengenes
|
|
GS
|
Gene significance
|
|
MS
|
module significance
|
References
|
1
|
Leemans CR, Snijders PJF and Brakenhoff
RH: The molecular landscape of head and neck cancer. Nat Rev
Cancer. 18:269–282. 2018. View Article : Google Scholar : PubMed/NCBI
|
|
2
|
Shield KD, Ferlay J, Jemal A,
Sankaranarayanan R, Chaturvedi AK, Bray F and Soerjomataram I: The
global incidence of lip, oral cavity, and pharyngeal cancers by
subsite in 2012. CA Cancer J Clin. 67:51–64. 2017. View Article : Google Scholar : PubMed/NCBI
|
|
3
|
Denaro N, Russi EG and Merlano MC: Pros
and cons of the new edition of TNM classification of head and neck
squamous cell carcinoma. Oncology. 95:202–210. 2018. View Article : Google Scholar : PubMed/NCBI
|
|
4
|
Chi AC, Day TA and Neville BW: Oral cavity
and oropharyngeal squamous cell carcinoma-An update. CA Cancer J
Clin. 65:401–421. 2015. View Article : Google Scholar : PubMed/NCBI
|
|
5
|
Steuer CE, El-Deiry M, Parks JR, Higgins
KA and Saba NF: An update on larynx cancer. CA Cancer J Clin.
67:31–50. 2017. View Article : Google Scholar : PubMed/NCBI
|
|
6
|
Pereira ER, Kedrin D, Seano G, Gautier O,
Meijer EFJ, Jones D, Chin SM, Kitahara S, Bouta EM, Chang J, et al:
Lymph node metastases can invade local blood vessels, exit the
node, and colonize distant organs in mice. Science. 359:1403–1407.
2018. View Article : Google Scholar : PubMed/NCBI
|
|
7
|
Ozsolak F, Platt AR, Jones DR,
Reifenberger JG, Sass LE, McInerney P, Thompson JF, Bowers J,
Jarosz M and Milos PM: Direct RNA sequencing. Nature. 461:814–818.
2009. View Article : Google Scholar : PubMed/NCBI
|
|
8
|
Keck MK, Zuo Z, Khattri A, Stricker TP,
Brown CD, Imanguli M, Rieke D, Endhardt K, Fang P, Brägelmann J, et
al: Integrative analysis of head and neck cancer identifies two
biologically distinct HPV and three non-HPV subtypes. Clin Cancer
Res. 21:870–881. 2015. View Article : Google Scholar : PubMed/NCBI
|
|
9
|
Walter V, Yin X, Wilkerson MD, Cabanski
CR, Zhao N, Du Y, Ang MK, Hayward MC, Salazar AH, Hoadley KA, et
al: Molecular subtypes in head and neck cancer exhibit distinct
patterns of chromosomal gain and loss of canonical cancer genes.
PLoS One. 8:e568232013. View Article : Google Scholar : PubMed/NCBI
|
|
10
|
Peri S, Izumchenko E, Schubert AD, Slifker
MJ, Ruth K, Serebriiskii IG, Guo T, Burtness BA, Mehra R, Ross EA,
et al: NSD1- and NSD2-damaging mutations define a subset of
laryngeal tumors with favorable prognosis. Nat Commun. 8:17722017.
View Article : Google Scholar : PubMed/NCBI
|
|
11
|
Tartour E, Mosseri V, Jouffroy T, Deneux
L, Jaulerry C, Brunin F, Fridman WH and Rodriguez J: Serum soluble
interleukin-2 receptor concentrations as an independent prognostic
marker in head and neck cancer. Lancet. 357:1263–1264. 2001.
View Article : Google Scholar : PubMed/NCBI
|
|
12
|
Lin MC, Chien PH, Wu HY, Chen ST, Juan HF,
Lou PJ and Huang MC: C1GALT1 predicts poor prognosis and is a
potential therapeutic target in head and neck cancer. Oncogene.
37:5780–5793. 2018. View Article : Google Scholar :
|
|
13
|
Rettig EM, Bishop JA, Agrawal N, Chung CH,
Sharma R, Zamuner F, Li RJ, Koch WM, Califano JA, Guo T, et al:
HEY1 is expressed independent of NOTCH1 and is associated with poor
prognosis in head and neck squamous cell carcinoma. Oral Oncol.
82:168–175. 2018. View Article : Google Scholar : PubMed/NCBI
|
|
14
|
Langfelder P and Horvath S: WGCNA: An R
package for weighted correlation network analysis. BMC
Bioinformatics. 9:5592008. View Article : Google Scholar : PubMed/NCBI
|
|
15
|
Yuan L, Shu B, Chen L, Qian K, Wang Y,
Qian G, Zhu Y, Cao X, Xie C, Xiao Y and Wang X: Overexpression of
COL3A1 confers a poor prognosis in human bladder cancer identified
by co-expression analysis. Oncotarget. 8:70508–70520. 2017.
View Article : Google Scholar : PubMed/NCBI
|
|
16
|
Zhou Z, Cheng Y, Jiang Y, Liu S, Zhang M,
Liu J and Zhao Q: Ten hub genes associated with progression and
prognosis of pancreatic carcinoma identified by co-expression
analysis. Int J Biol Sci. 14:124–136. 2018. View Article : Google Scholar : PubMed/NCBI
|
|
17
|
Liu X, Hu AX, Zhao JL and Chen FL:
Identification of key gene modules in human osteosarcoma by
co-expression analysis weighted gene co-expression network analysis
(WGCNA). J Cell Biochem. 118:3953–3959. 2017. View Article : Google Scholar : PubMed/NCBI
|
|
18
|
Zhang X, Feng H, Li Z, Li D, Liu S, Huang
H and Li M: Application of weighted gene co-expression network
analysis to identify key modules and hub genes in oral squamous
cell carcinoma tumorigenesis. Onco Targets Ther. 11:6001–6021.
2018. View Article : Google Scholar : PubMed/NCBI
|
|
19
|
Li XT: Identification of key genes for
laryngeal squamous cell carcinoma using weighted co-expression
network analysis. Oncol Lett. 11:3327–3331. 2016. View Article : Google Scholar : PubMed/NCBI
|
|
20
|
Wichmann G, Rosolowski M, Krohn K, Kreuz
M, Boehm A, Reiche A, Scharrer U, Halama D, Bertolini J, Bauer U,
et al: The role of HPV RNA transcription, immune response-related
gene expression and disruptive TP53 mutations in diagnostic and
prognostic profiling of head and neck cancer. Int J Cancer.
137:2846–2857. 2015. View Article : Google Scholar : PubMed/NCBI
|
|
21
|
Gautier L, Cope L, Bolstad BM and Irizarry
RA: Affy-analysis of affymetrix genechip data at the probe level.
Bioinformatics. 20:307–315. 2004. View Article : Google Scholar : PubMed/NCBI
|
|
22
|
Zhou Z, Liu S, Zhang M, Zhou R, Liu J,
Chang Y and Zhao Q: Overexpression of topoisomerase 2-alpha confers
a poor prognosis in pancreatic adenocarcinoma identified by
co-expression analysis. Dig Dis Sci. 62:2790–2800. 2017. View Article : Google Scholar : PubMed/NCBI
|
|
23
|
Mason MJ, Fan G, Plath K, Zhou Q and
Horvath S: Signed weighted gene co-expression network analysis of
transcriptional regulation in murine embryonic stem cells. BMC
Genomics. 10:3272009. View Article : Google Scholar : PubMed/NCBI
|
|
24
|
Yuan L, Chen L, Qian K, Wang G, Lu M, Qian
G, Cao X, Jiang W, Xiao Y and Wang X: A novel correlation between
ATP5A1 gene expression and progression of human clear cell renal
cell carcinoma identified by co-expression analysis. Oncol Rep.
39:525–536. 2018.PubMed/NCBI
|
|
25
|
Botia JA, Vandrovcova J, Forabosco P,
Guelfi S, D'Sa K; United Kingdom Brain Expression Consortium, ;
Hardy J, Lewis CM, Ryten M and Weale ME: An additional k-means
clustering step improves the biological features of WGCNA gene
co-expression networks. BMC Syst Biol. 11:472017. View Article : Google Scholar : PubMed/NCBI
|
|
26
|
Foroushani A, Agrahari R, Docking R, Chang
L, Duns G, Hudoba M, Karsan A and Zare H: Large-scale gene network
analysis reveals the significance of extracellular matrix pathway
and homeobox genes in acute myeloid leukemia: An introduction to
the Pigengene package and its applications. BMC Med Genomics.
10:162017. View Article : Google Scholar : PubMed/NCBI
|
|
27
|
Forabosco P, Ramasamy A, Trabzuni D,
Walker R, Smith C, Bras J, Levine AP, Hardy J, Pocock JM, Guerreiro
R, et al: Insights into TREM2 biology by network analysis of human
brain gene expression data. Neurobiol Aging. 34:2699–2714. 2013.
View Article : Google Scholar : PubMed/NCBI
|
|
28
|
Subramanian A, Kuehn H, Gould J, Tamayo P
and Mesirov JP: GSEA-P: A desktop application for gene set
enrichment analysis. Bioinformatics. 23:3251–3253. 2007. View Article : Google Scholar : PubMed/NCBI
|
|
29
|
Lydiatt WM, Patel SG, O'Sullivan B,
Brandwein MS, Ridge JA, Migliacci JC, Loomis AM and Shah JP: Head
and neck cancers-major changes in the American joint committee on
cancer eighth edition cancer staging manual. CA Cancer J Clin.
67:122–137. 2017. View Article : Google Scholar : PubMed/NCBI
|
|
30
|
Ferris RL, Lotze MT, Leong SP, Hoon DS and
Morton DL: Lymphatics, lymph nodes and the immune system: Barriers
and gateways for cancer spread. Clin Exp Metastasis. 29:729–736.
2012. View Article : Google Scholar : PubMed/NCBI
|
|
31
|
Kawada K and Taketo MM: Significance and
mechanism of lymph node metastasis in cancer progression. Cancer
Res. 71:1214–1218. 2011. View Article : Google Scholar : PubMed/NCBI
|
|
32
|
Saksena MA, Saokar A and Harisinghani MG:
Lymphotropic nanoparticle enhanced MR imaging (LNMRI) technique for
lymph node imaging. Eur J Radiol. 58:367–374. 2006. View Article : Google Scholar : PubMed/NCBI
|
|
33
|
Grobner SN, Worst BC, Weischenfeldt J,
Buchhalter I, Kleinheinz K, Rudneva VA, Johann PD, Balasubramanian
GP, Segura-Wang M, Brabetz S, et al: The landscape of genomic
alterations across childhood cancers. Nature. 555:321–327. 2018.
View Article : Google Scholar : PubMed/NCBI
|
|
34
|
Wang QL, Chen X, Zhang MH, Shen QH and Qin
ZM: Identification of hub genes and pathways associated with
retinoblastoma based on co-expression network analysis. Genet Mol
Res. 14:16151–16161. 2015. View Article : Google Scholar : PubMed/NCBI
|
|
35
|
Zhou R and Man Y: Integrated analysis of
DNA methylation profiles and gene expression profiles to identify
genes associated with pilocytic astrocytomas. Mol Med Rep.
13:3491–3497. 2016. View Article : Google Scholar : PubMed/NCBI
|
|
36
|
Liu J, Jing L and Tu X: Weighted gene
co-expression network analysis identifies specific modules and hub
genes related to coronary artery disease. BMC Cardiovasc Disord.
16:542016. View Article : Google Scholar : PubMed/NCBI
|
|
37
|
Huang C, Huang BB, Niu JM, Yu Y, Qin XY,
Yang YL, Xiao TX, Chen J, Ren LR and Zhang JV: Global mRNA and long
non-coding RNA expression in the placenta and white adipose tissue
of mice fed a high-fat diet during pregnancy. Cell Physiol Biochem.
50:2260–2271. 2018. View Article : Google Scholar : PubMed/NCBI
|
|
38
|
Michibata H, Chiba H, Wakimoto K, Seishima
M, Kawasaki S, Okubo K, Mitsui H, Torii H and Imai Y:
Identification and characterization of a novel component of the
cornified envelope, cornifelin. Biochem Biophys Res Commun.
318:803–813. 2004. View Article : Google Scholar : PubMed/NCBI
|
|
39
|
Sun X, Kim A, Nakatani M, Shen Y and Liu
L: Distinctive molecular responses to ultraviolet radiation between
keratinocytes and melanocytes. Exp Dermatol. 25:708–713. 2016.
View Article : Google Scholar : PubMed/NCBI
|
|
40
|
Zhang B, Chen MY, Shen YJ, Zhuo XB, Gao P,
Zhou FS, Liang B, Zu J, Zhang Q and Suleman S: A large-scale,
exome-wide association study of han chinese women identifies three
novel loci predisposing to breast cancer. Cancer Res. 78:3087–3097.
2018. View Article : Google Scholar : PubMed/NCBI
|
|
41
|
Till JE, Yoon C, Kim BJ, Roby K, Addai P,
Jonokuchi E, Tang LH, Yoon SS and Ryeom S: Oncogenic KRAS and p53
loss drive gastric tumorigenesis in mice that can be attenuated by
E-Cadherin expression. Cancer Res. 77:5349–5359. 2017. View Article : Google Scholar : PubMed/NCBI
|
|
42
|
Turrell FK, Kerr EM, Gao M, Thorpe H,
Doherty GJ, Cridge J, Shorthouse D, Speed A, Samarajiwa S, Hall BA,
et al: Lung tumors with distinct p53 mutations respond similarly to
p53 targeted therapy but exhibit genotype-specific statin
sensitivity. Genes Dev. 31:1339–1353. 2017. View Article : Google Scholar : PubMed/NCBI
|
|
43
|
Sanchez-Vega F, Mina M, Armenia J, Chatila
WK, Luna A, La KC, Dimitriadoy S, Liu DL, Kantheti HS, Saghafinia
S, et al: Oncogenic signaling pathways in the cancer genome atlas.
Cell. 173:321–337. 2018. View Article : Google Scholar : PubMed/NCBI
|
|
44
|
Venkatanarayan A, Raulji P, Norton W,
Chakravarti D, Coarfa C, Su X, Sandur SK, Ramirez MS, Lee J,
Kingsley CV, et al: IAPP-driven metabolic reprogramming induces
regression of p53-deficient tumours in vivo. Nature. 517:626–630.
2015. View Article : Google Scholar : PubMed/NCBI
|
|
45
|
Chen SH, Forrester W and Lahav G:
Schedule-dependent interaction between anticancer treatments.
Science. 351:1204–1208. 2016. View Article : Google Scholar : PubMed/NCBI
|
|
46
|
Wade M, Li YC and Wahl GM: MDM2, MDMX and
p53 in oncogenesis and cancer therapy. Nat Rev Cancer. 13:83–96.
2013. View Article : Google Scholar : PubMed/NCBI
|
|
47
|
Dow LE, O'Rourke KP, Simon J,
Tschaharganeh DF, van Es JH, Clevers H and Lowe SW: Apc restoration
promotes cellular differentiation and reestablishes crypt
homeostasis in colorectal cancer. Cell. 161:1539–1552. 2015.
View Article : Google Scholar : PubMed/NCBI
|
|
48
|
Furth N and Aylon Y: The LATS1 and LATS2
tumor suppressors: Beyond the Hippo pathway. Cell Death Differ.
24:1488–1501. 2017. View Article : Google Scholar : PubMed/NCBI
|
|
49
|
Kundu N, Brekman A, Kim JY, Xiao G, Gao C
and Bargonetti J: Estrogen-activated MDM2 disrupts mammary tissue
architecture through a p53-independent pathway. Oncotarget.
8:47916–47930. 2017. View Article : Google Scholar : PubMed/NCBI
|
|
50
|
Zwijsen RM, Wientjens E, Klompmaker R, van
der Sman J, Bernards R and Michalides RJ: CDK-independent
activation of estrogen receptor by cyclin D1. Cell. 88:405–415.
1997. View Article : Google Scholar : PubMed/NCBI
|
|
51
|
Hurtado A, Holmes KA, Geistlinger TR,
Hutcheson IR, Nicholson RI, Brown M, Jiang J, Howat WJ, Ali S and
Carroll JS: Regulation of ERBB2 by oestrogen receptor-PAX2
determines response to tamoxifen. Nature. 456:663–666. 2008.
View Article : Google Scholar : PubMed/NCBI
|
|
52
|
Hsu PY, Hsu HK, Lan X, Juan L, Yan PS,
Labanowska J, Heerema N, Hsiao TH, Chiu YC, Chen Y, et al:
Amplification of distant estrogen response elements deregulates
target genes associated with tamoxifen resistance in breast cancer.
Cancer Cell. 24:197–212. 2013. View Article : Google Scholar : PubMed/NCBI
|