Introduction
The retina is one of the most metabolically active
tissues (1,2). The oxygen consumption rate in the
dark-adapted retina is considerably higher compared to the
light-adapted condition (3,4). Empirical evidence indicates that in
part, oxygen tension in the retina can fall close to 0 mm Hg making
these sections hypoxic (3,4). Unlike the muscles in which a high
concentration of myoglobin secures an oxygen reservoir, the retina
was believed to depend solely on oxygen diffusion from the choroid.
In 2000, a third member of the hemoglobin family was discovered and
shown to be expressed in the mouse brain (5). Due to the neuronal expression, the
globin was named neuroglobin (Ngb). Ngb is a monomeric hemoglobin
capable of reversibly binding oxygen in vitro (5,6). Ngb
was highly expressed in the majority of layers in the mouse retina,
including the photoreceptors (7).
The high concentration of Ngb was thought to indicate a role in the
retinal oxygen supply. Another study showed an overlap between Ngb
expression and areas with the highest number of mitochondria
supporting a respiratory function of Ngb (8). Previously, several studies have
implicated a neuroprotective function of Ngb in retinal diseases
(9–12). Furthermore, transgenic mice
overexpressing Ngb were found to be resistant to retinal ischemia
(13) and in vivo knockdown
of Ngb using small interfering RNA (siRNA) induced the degradation
of retina ganglion cells and behavioral effects associated with
compromised visual performance (14). In contrast to these studies, we
recently showed limited Ngb immunoreactivity in the retina and no
effect of Ngb deficiency on neuronal survival using genetically
Ngb-deficient (Ngb-null) mice (15). This is in line with studies showing
no adverse effect of Ngb deficiency on neuronal survival in the
brain of mice exposed to hypoxia or ischemia (16,17).
Therefore, the function of Ngb in the retina and brain remains
unresolved. In the present study, microarrays were used to
investigate the effect of Ngb deficiency on retinal gene
expression. The affect of Ngb deficiency on retinal gene expression
response to light was investigated, as well as whether there was
differential expression of marker genes associated with oxygen
availability, oxidative stress and endoplasmic reticulum
(ER)-stress in Ngb-deficient retina.
Materials and methods
Ngb-null mice
The Ngb-null mouse model was created by GenOway
(Lyon, France) as described previously (17,18).
Animals
A total of 15 wild-type (wt) c57BL6 and 15 Ngb-null
female mice (12–16 weeks old) were used in the experiment. The
animals were maintained in a 12/12-h light/dark cycle with ad
libitum access to food and water. Five mice of each genotype
were euthanized by decapitation either in darkness (t0) or after
exposure to 1.5 or 5 h of light. The retinas were rapidly dissected
out on ice, snap-frozen on dry-ice and stored at −80°C until RNA
extraction. Animal care and all experimental procedures were
conducted in accordance to the principles of Laboratory Animal Care
(Law on Animal Experiments in Denmark, publication 1306, November
23, 2007) and approved by the Faculty of Health, University of
Copenhagen (Copenhagen, Denmark).
Microarray analysis
RNA was extracted using the InviTrap Spin Universal
RNA mini kit (STRATEC Molecular GmbH, Berlin, Germany) according to
the manufacturer’s instructions. In brief, homogenized retinas were
transferred to the lysis buffer for inactivation of RNases. After 2
min centrifugation at 12,851 × g the supernatant was transferred to
a new tube containing 96% pure ethanol and mixed. The mixture was
subsequently applied to a spin filter tube and centrifuged for 2
min at 12,851 × g and the flow through was discarded. The filter
tube was washed with wash buffer solution followed by
centrifugation and RNA was eluted with elution buffer. Eluted RNA
was stored at −80°C until use. The gene expression profiling was
performed with GeneChip® Mouse Exon 1.0 ST arrays
(Affymetrix, Santa Clara, CA, USA) according to manufacturer’s
instructions. Briefly, 50 ng total RNA from each sample was
amplified using the Ovation Pico WTA system V2 (NuGEN Technologies,
Inc., San Carlos, CA, USA). Fragmentation and biotin labeling was
performed using the Encore-Ovation cDNA Biotin Module (NuGEN
Technologies). The labeled samples were hybridized to the
GeneChip® Mouse Exon 1.0 ST array (Affymetrix). The
arrays were washed and stained with phycoerytrin-conjugated
streptavidin using the Affymetrix Fluidics Station 450 and the
arrays were scanned in the Affymetrix GeneArray® 3000
scanner to generate fluorescent images, as described in the
Affymetrix GeneChip® instructions. The cell-intensity
files were generated in the GeneChip® Command Console
software (Affymetrix).
Differential expression analysis
Differential gene expression analysis was performed
with DEMI (in-house designed software) (19) as implemented in the R package
(www.r-project.org; http://cran.r-project.org/web/packages/demi. Accessed
September 5, 2014). Gene expression data from Bedolla and Torre
(20) (GEO: GSE29299) and
Porterfield et al (21)
(GEO: GSE6904) was downloaded from Gene Expression Omnibus. A gene
was termed differentially expressed when the corresponding false
discovery rate (FDR) was <0.01 and the ratio of differentially
expressed on-target probes was >0.5 (i.e. >50% of the
gene-specific probes were differentially expressed in the same
direction). Gene set enrichment analysis was performed separately
for differentially up and downregulated genes using g:Profiler
(http://biit.cs.ut.ee/gprofiler/.
Accessed September 5, 2014) (22).
Estimating overlap between the different
microarray experiments
The overlap of the differentially expressed genes
between the different experiments was estimated with Fisher’s exact
test in R. P-values were corrected using the FDR procedure
(23) and enrichments with
FDR<0.05 were considered to indicate a statistically significant
difference. In order to compare differentially expressed genes
between mouse and rat datasets, an annotation table was retrieved
that linked rat gene identifiers to mouse orthologs from Ensembl
(release 75) using R (package biomaRt).
Reverse transcription quantitative
polymerase chain reaction (RT-qPCR)
First strand cDNA was synthesized with random
hexamers (Invitrogen Life Technologies, Grand Island, NY, USA) and
SuperScript® III Reverse Transcriptase (Invitrogen Life
Technologies) from 500 ng total RNA. RT-qPCR was performed using
TaqMan® (Applied Biosystems, Foster City, CA, USA) gene
expression assays (Table I). The
expression of hypoxanthine phosphoribosyltransferase 1 (Table I) was used as internal reference.
PCR was performed in 4 parallel reactions for each sample. RT-qPCR
reactions were run on the ABI PRISM 7900HT Fast Real-Time PCR
system machine (Applied Biosystems) and quantified with the ABI
PRISM 7900 SDS 2.2.2 software. For each assay, an average of 4
technical replicates was used as the endpoint. Expression levels
were calculated using the ΔCt method (24), where the Ct of the gene of interest
is normalized to a reference gene.
 | Table ITaqMan® assays used for
reverse transcription quantitative polymerase chain reaction gene
expression validation. |
Table I
TaqMan® assays used for
reverse transcription quantitative polymerase chain reaction gene
expression validation.
| Gene symbol | Gene name | Assay identity or
sequence |
|---|
| Hif1α | Hypoxia inducible
factor 1α | Mm00468879_g |
| Bnip3 | BCL2/adenovirus E1B
19 kDa interacting protein 3 | Mm01275601_g |
| Gstz1 | Glutatione
S-transferase | Mm01296880_m1 |
| Gsr | Glutatione
reductase | Mm00439154_m1 |
| Xbp1 | X-box binding
protein 1 | Mm00457357_m1 |
| Nfe2l2
(Nrf2) | Nuclear factor
(erythroid-derived 2)-like 2 | Mm00477784_m1 |
| Egr1 | Early growth
response protein 1 | Mm00656724_m1 |
| Fos | FBJ osteosarcoma
oncogene | Mm00487425_m1 |
| Akap6 | A kinase (PRKA)
anchor protein 6 | Mm01292745_m1 |
| Atp8a2 | ATPase,
aminophospholipid transporter, class I, type 8A, member 2 | Mm00443740_m1 |
| Entpd4 | Ectonucleoside
triphosphate diphosphohydrolase 4 | Mm00491888_m1 |
| Hprt1 | Hypoxanthine
phosphoribosyltransferase 1 | F
5′-GCAGTACAGCCCCAAAATGG-3′, R 5′-AACAAA GTCTGGCCTGTATCCAA-3′, probe
(VIC) 5′-VIC-AAGCTTGCTGGTGAAAAGGACCTCTCG-3′ |
Results
Gene expression analysis in dark- and
light-adapted mouse retinas
Transcriptome-wide gene expression analysis was
performed using retinas of dark- and light-adapted (1.5 and 5 h)
Ngb-null mice and their wt littermates. The differences in
expression were studied using DEMI, a recently published
non-parametric methodology, which estimates differential expression
from probe-level data (19). The
effect of light on gene expression was more substantial than the
effect of genotype, as reflected in the numbers of differentially
expressed genes (Table II).
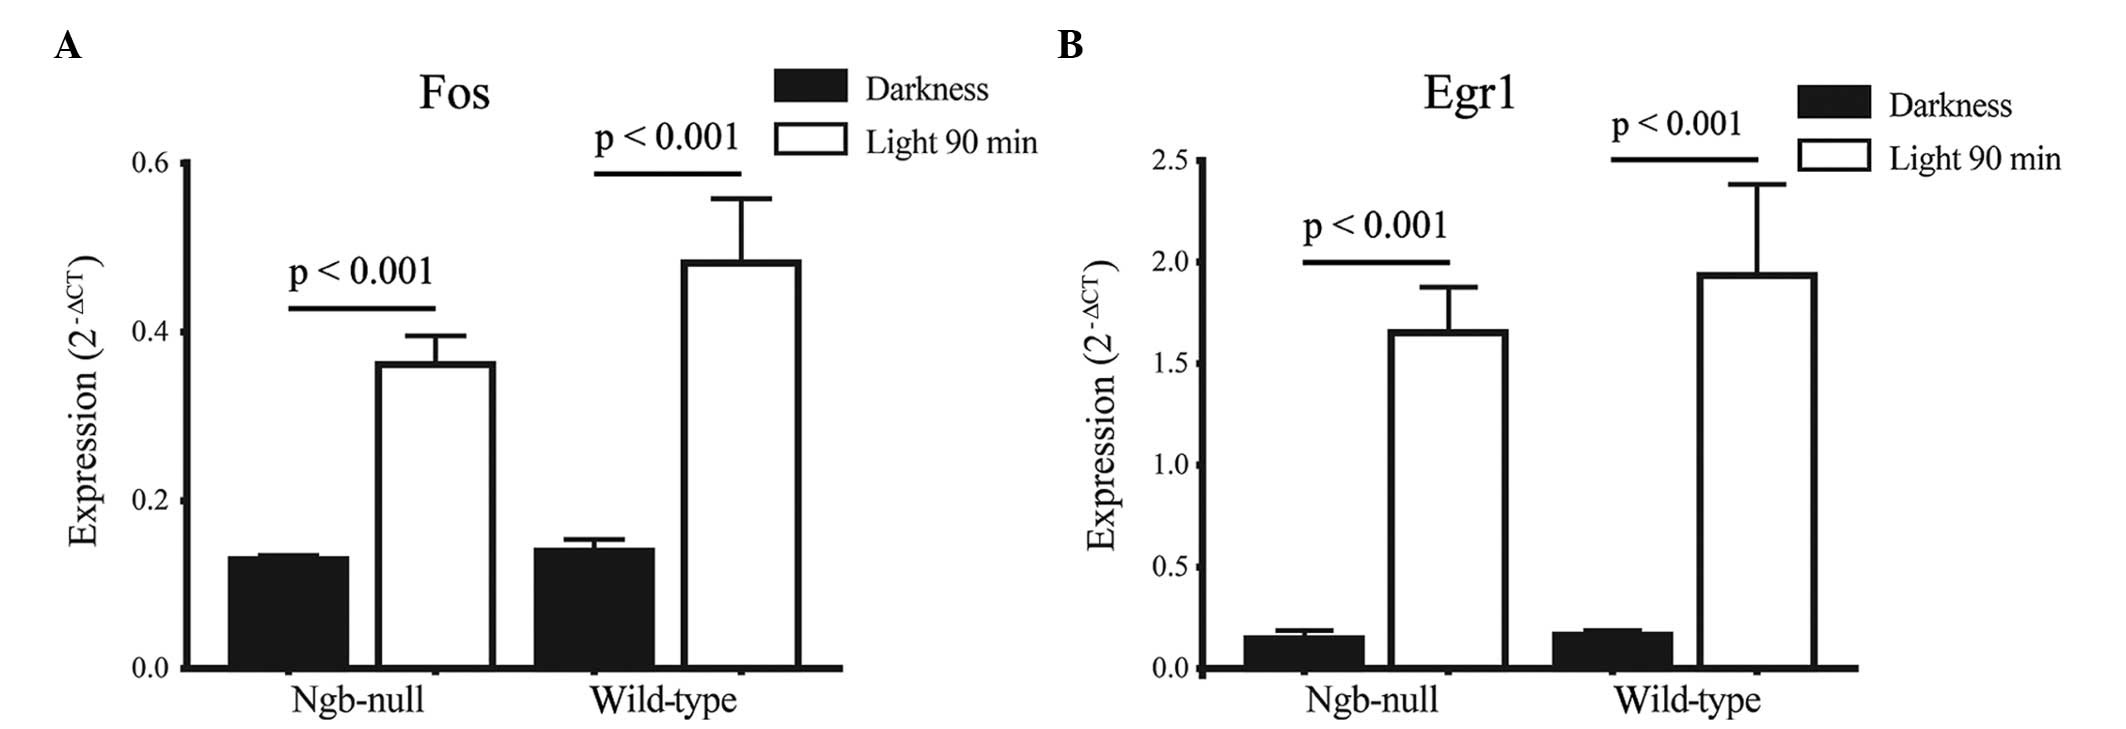
Differential expression of Fos and Egr1, which are
established light-responsive genes (25), was confirmed by RT-qPCR in the
genotypes after 1.5 h light pulse (Fig.
1). To further confirm that the effect of light was similar to
the expected effect, the data from two previously published studies
were reanalyzed, which made raw expression data publicly available.
In the first study, ex vivo retinas collected from adult
Long Evans rats, were exposed to light (1000 lux for 3 or 6 h) or
remained in the dark as a control (20). The second study collected expression
data from mouse suprachiasmatic nucleus (SCN), the main target of
retinohypothalamic tract, after 0.5-h light pulse and a sham-light
pulse (21). A statistically
significant overlap of differentially expressed genes between the
studies was believed to cross-validate results obtained under the
distinct experimental setups. As expected, there was a significant
overlap of differentially expressed genes between the corresponding
treatments in the present study and the two independent datasets
(Table III). Specifically, there
was a significant overlap between the upregulated genes in the
mouse retina after 1.5-h light pulse and in the mouse SCN after
0.5-h light pulse. In addition, there was a significant overlap
between the upregulated genes in the mouse retina after 5-h light
pulse and rat retina exposed to 6-h light pulse ex vivo. A
significant overlap between the downregulated genes was not
observed in the corresponding treatments from the different
experiments, indicating that the light-specific response is mostly
associated with upregulation of gene expression. No significant
overlap was found between the corresponding treatments when the
gene sets of opposite differential expression direction were
compared, serving as a negative control. As the pattern of gene set
enrichment FDR values was similar, irrespective of the genotype, it
was concluded that the gene expression response to light is largely
intact in Ngb-deficient retina.
| Table IICounts of differentially expressed
genes in the retina (false discovery rate <0.01). |
Table II
Counts of differentially expressed
genes in the retina (false discovery rate <0.01).
| Differential
expressiona | Ngb-deficient
arraysb | Wild-type
arraysb |
|---|
|
|
|
|
|---|
| Variables | Up | Down | Up | Down | Up | Down |
|---|
| Light pulse, h |
| 0 | 7 | 6 | - | - | - | - |
| 1.5 | 23 | 27 | 5 | 36 | 28 | 11 |
| 5 | 9 | 11 | 21 | 29 | 323 | 283 |
| Table IIISimilarity of the gene expression
responses in the present study and associated datasets. |
Table III
Similarity of the gene expression
responses in the present study and associated datasets.
| | | Present Ngb-null
and wild-type pooled | Present
Ngb-null | Present
wild-type |
|---|
| | |
|
|
|
|---|
| | | 1.5 h | 5 h | 1.5 h | 5 h | 1.5 h | 5 h |
|---|
| | |
|
|
|
|
|
|
|---|
| Light pulse, h | Diff.
expression | Up | Down | Up | Down | Up | Down | Up | Down | Up | Down | Up | Down |
|---|
| Mouse SCN |
| (Bedolla et
al 2011) | 0.5 | Up | 1.84e-04a | 1 | 0.7 | 1 | 1.14e-04a | 1 | 1 | 1 | 2.02e-05a | 1 | 1 | 1 |
| | Down | 1 | 1 | 0.49 | 1 | 1 | 1 | 1 | 1 | 1 | 1 | 0.85 | 1 |
| Rat retina |
| (Porterfield et
al 2007) | 3 | Up | 1 | 1 | 0.49 | 1 | 1 | 1 | 0.18 | 1 | 1 | 1 | 0.17 | 1 |
| | Down | 1 | 0.77 | 1 | 0.49 | 1 | 1 | 1 | 1 | 1 | 1 | 1 | 0.85 |
| 6 | Up | 0.83 | 1 | 7.42e-07a | 1 | 0.18 | 1 | 1.14e-04a | 1 | 0.85 | 1 | 2.02e-05a | 1 |
| | Down | 1 | 1 | 1 | 0.82 | 1 | 1 | 1 | 0.68 | 1 | 1 | 1 | 1 |
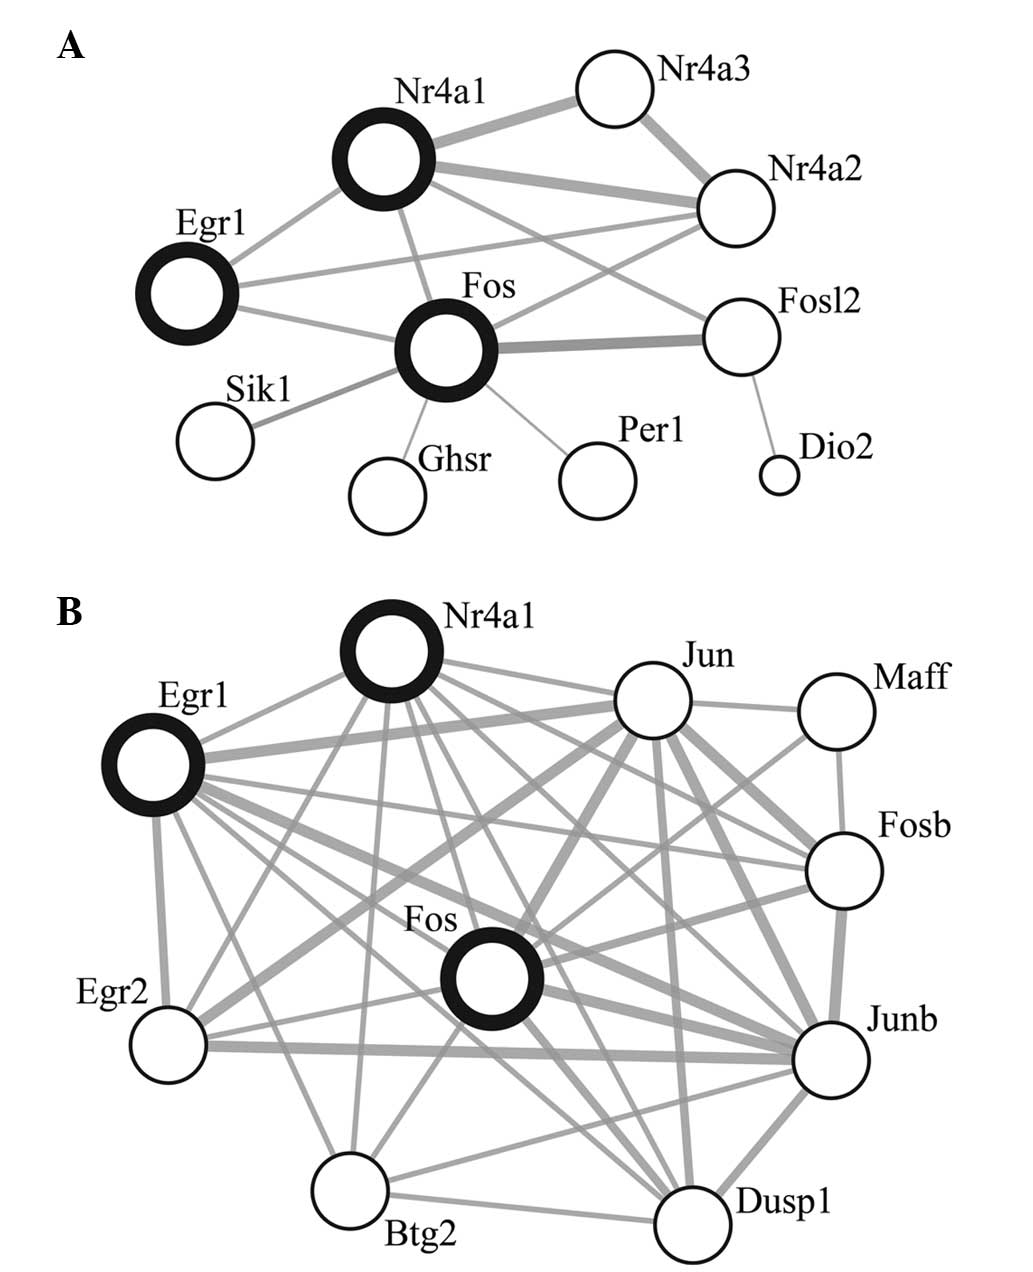
Exposure to 1.5-h light pulse revealed three gene
ontology categories with weakly significant enrichment. The set of
upregulated genes included several early response genes, such as
Egr1, Fos, Fosl2, Per1 and
Nr4a1-3, indicating effectiveness of the light pulse
(Fig. 2). Of these, Nr41a,
Per1, Fos, Fosl2 and Nr4a2 have also
been confirmed in the study by Araki et al (25), as light inducible transcripts in the
SCN, which is a light responsive brain area directly innervated by
the eye. Similarly, the reanalysis of data from the study by
Porterfield et al (21)
indicated the upregulation of Nr4a1, Egr1 and
Fos in SCN after 0.5-h light pulse. Functional annotation
analysis of genes upregulated in response to 5-h light pulse
revealed numerous significantly enriched categories associated with
translation, RNA-splicing and visual perception. Gene ontology
categories enriched among downregulated genes were mostly
correlated with the term ‘G-protein coupled receptor activity’.
Closer inspection of the downregulated gene set revealed a high
proportion of olfactory and vomeronasal receptor genes, which were
dismissed as uninformative and therefore, not deserving further
investigation. In our previous studies, we have observed similar,
and most likely nonspecific, induction of the olfactory and
vomeronasal receptor genes in the brain in response to various
stimuli (data not shown).
Despite the overall similarity of light-induced gene
expression responses between Ngb-null mice and wt, the present
study aimed to investigate whether there are systemic
genotype-related differences in the retina. Specifically, the aim
was to identify the genes that are differentially expressed when
the effect of light is ignored. Samples with identical genotypes
(n=15) were pooled and it was found that there were several
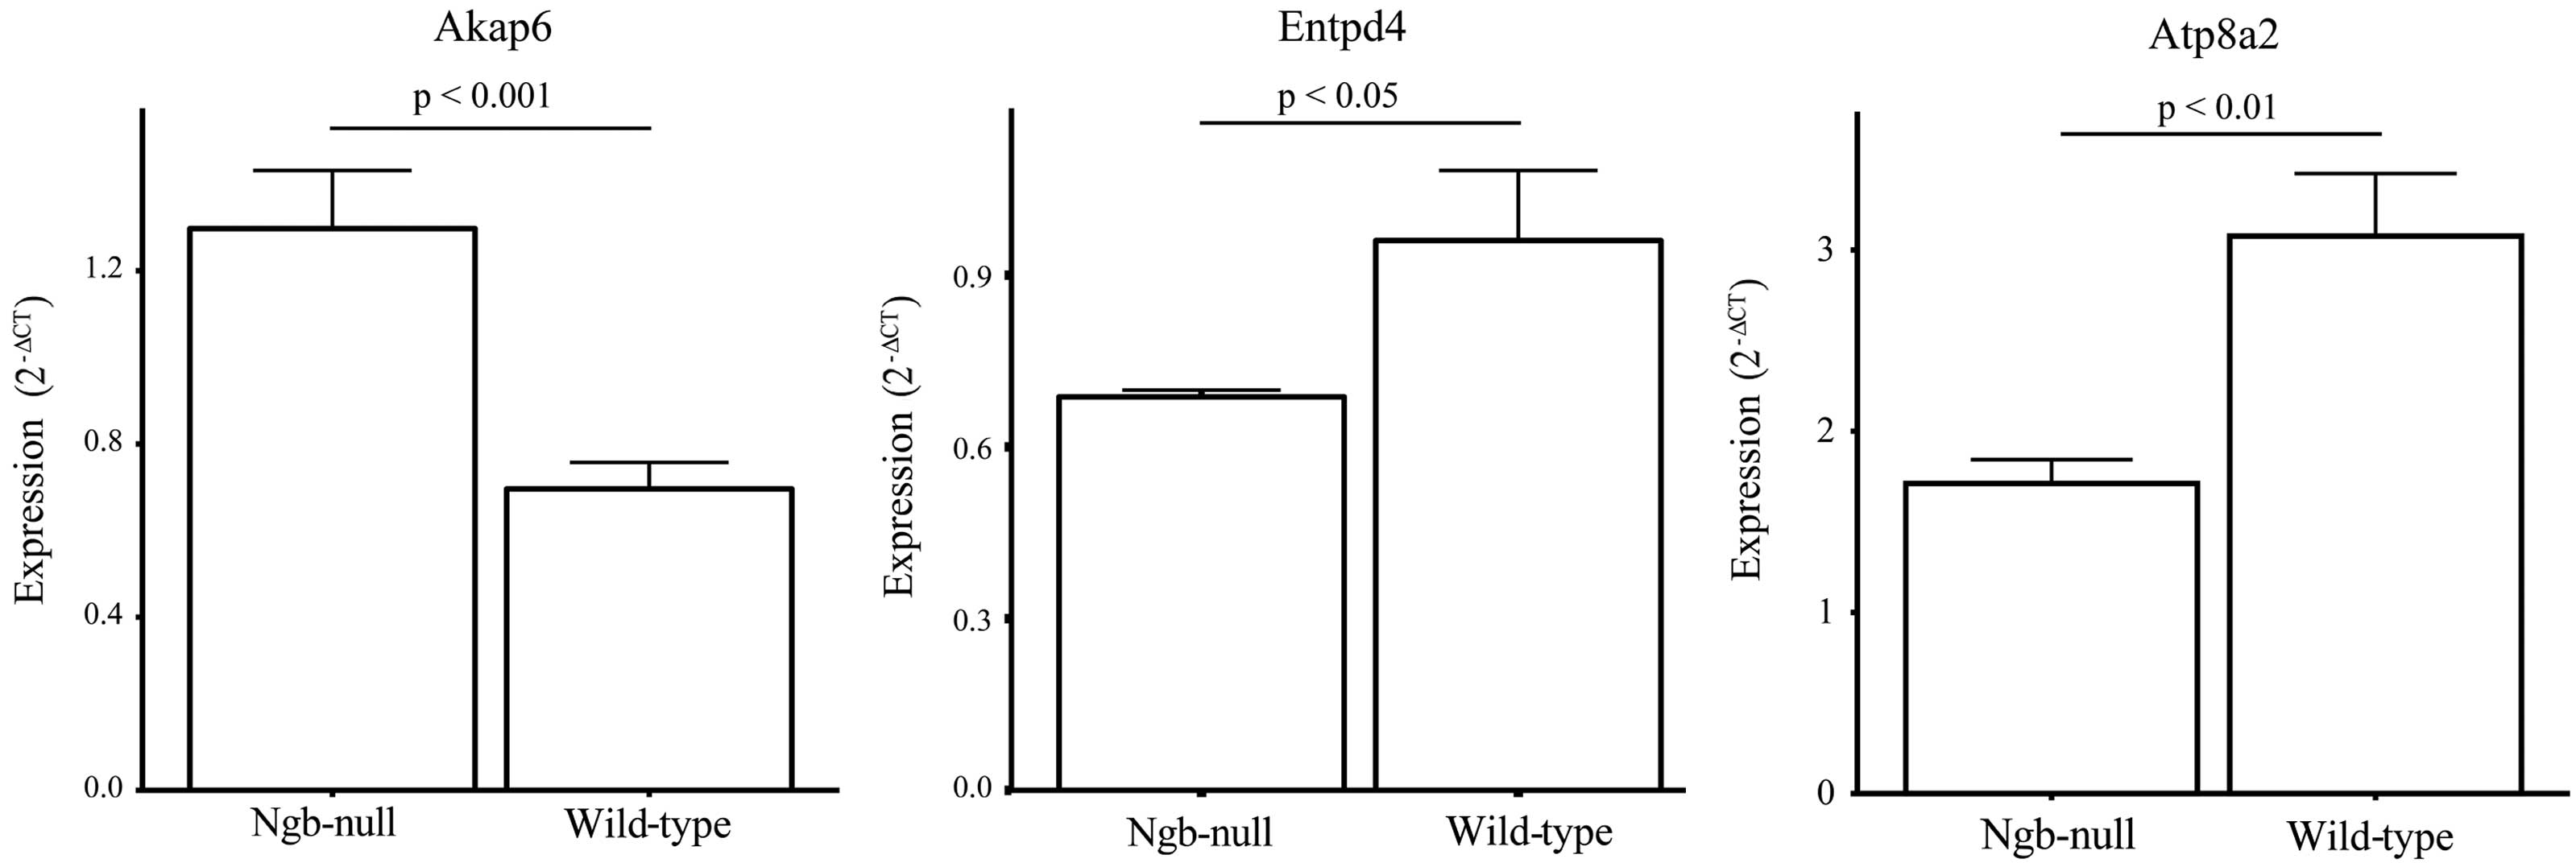
differentially expressed genes between the pools (Table IV). The three main differential
expression estimates from the array study were confirmed by RT-qPCR
(Fig. 3).
| Table IVDifferences in the retinal gene
expression between neuroglobin (Ngb)-deficient and wild-type mice
when light exposure is ignored. |
Table IV
Differences in the retinal gene
expression between neuroglobin (Ngb)-deficient and wild-type mice
when light exposure is ignored.
| Direction | FDR | Gene symbol | Description |
|---|
| Up | 1.10e-23 | Akap6 | A kinase (PRKA)
anchor protein 6 |
| Up | 6.76e-22 |
Tmem229b | Transmembrane
protein 229B |
| Up | 2.60e-22 |
Serpina3n | Serine (or
cysteine) peptidase inhibitor, clade A, member 3N |
| Up | 1.28e-13 | Gdpd3 |
Glycerophosphodiester phosphodiesterase
domain containing 3 |
| Up | 1.28e-13 | Ccdc115 | Coiled-coil domain
containing 115 |
| Down | 7.56e-36 | Entpd4 | Ectonucleoside
triphosphate diphosphohydrolase 4 |
| Down | 2.39e-31 | Atp8a2 | ATPase,
aminophospholipid transporter-like, class I, type 8A, member 2 |
| Down | 5.10e-18 | Snapc1 | Small nuclear RNA
activating complex, polypeptide 1 |
| Down | 2.20e-16 | Heatr5a | HEAT repeat
containing 5A |
| Down | 2.37e-13 | Lcmt2 | Leucine carboxyl
methyltransferase 2 |
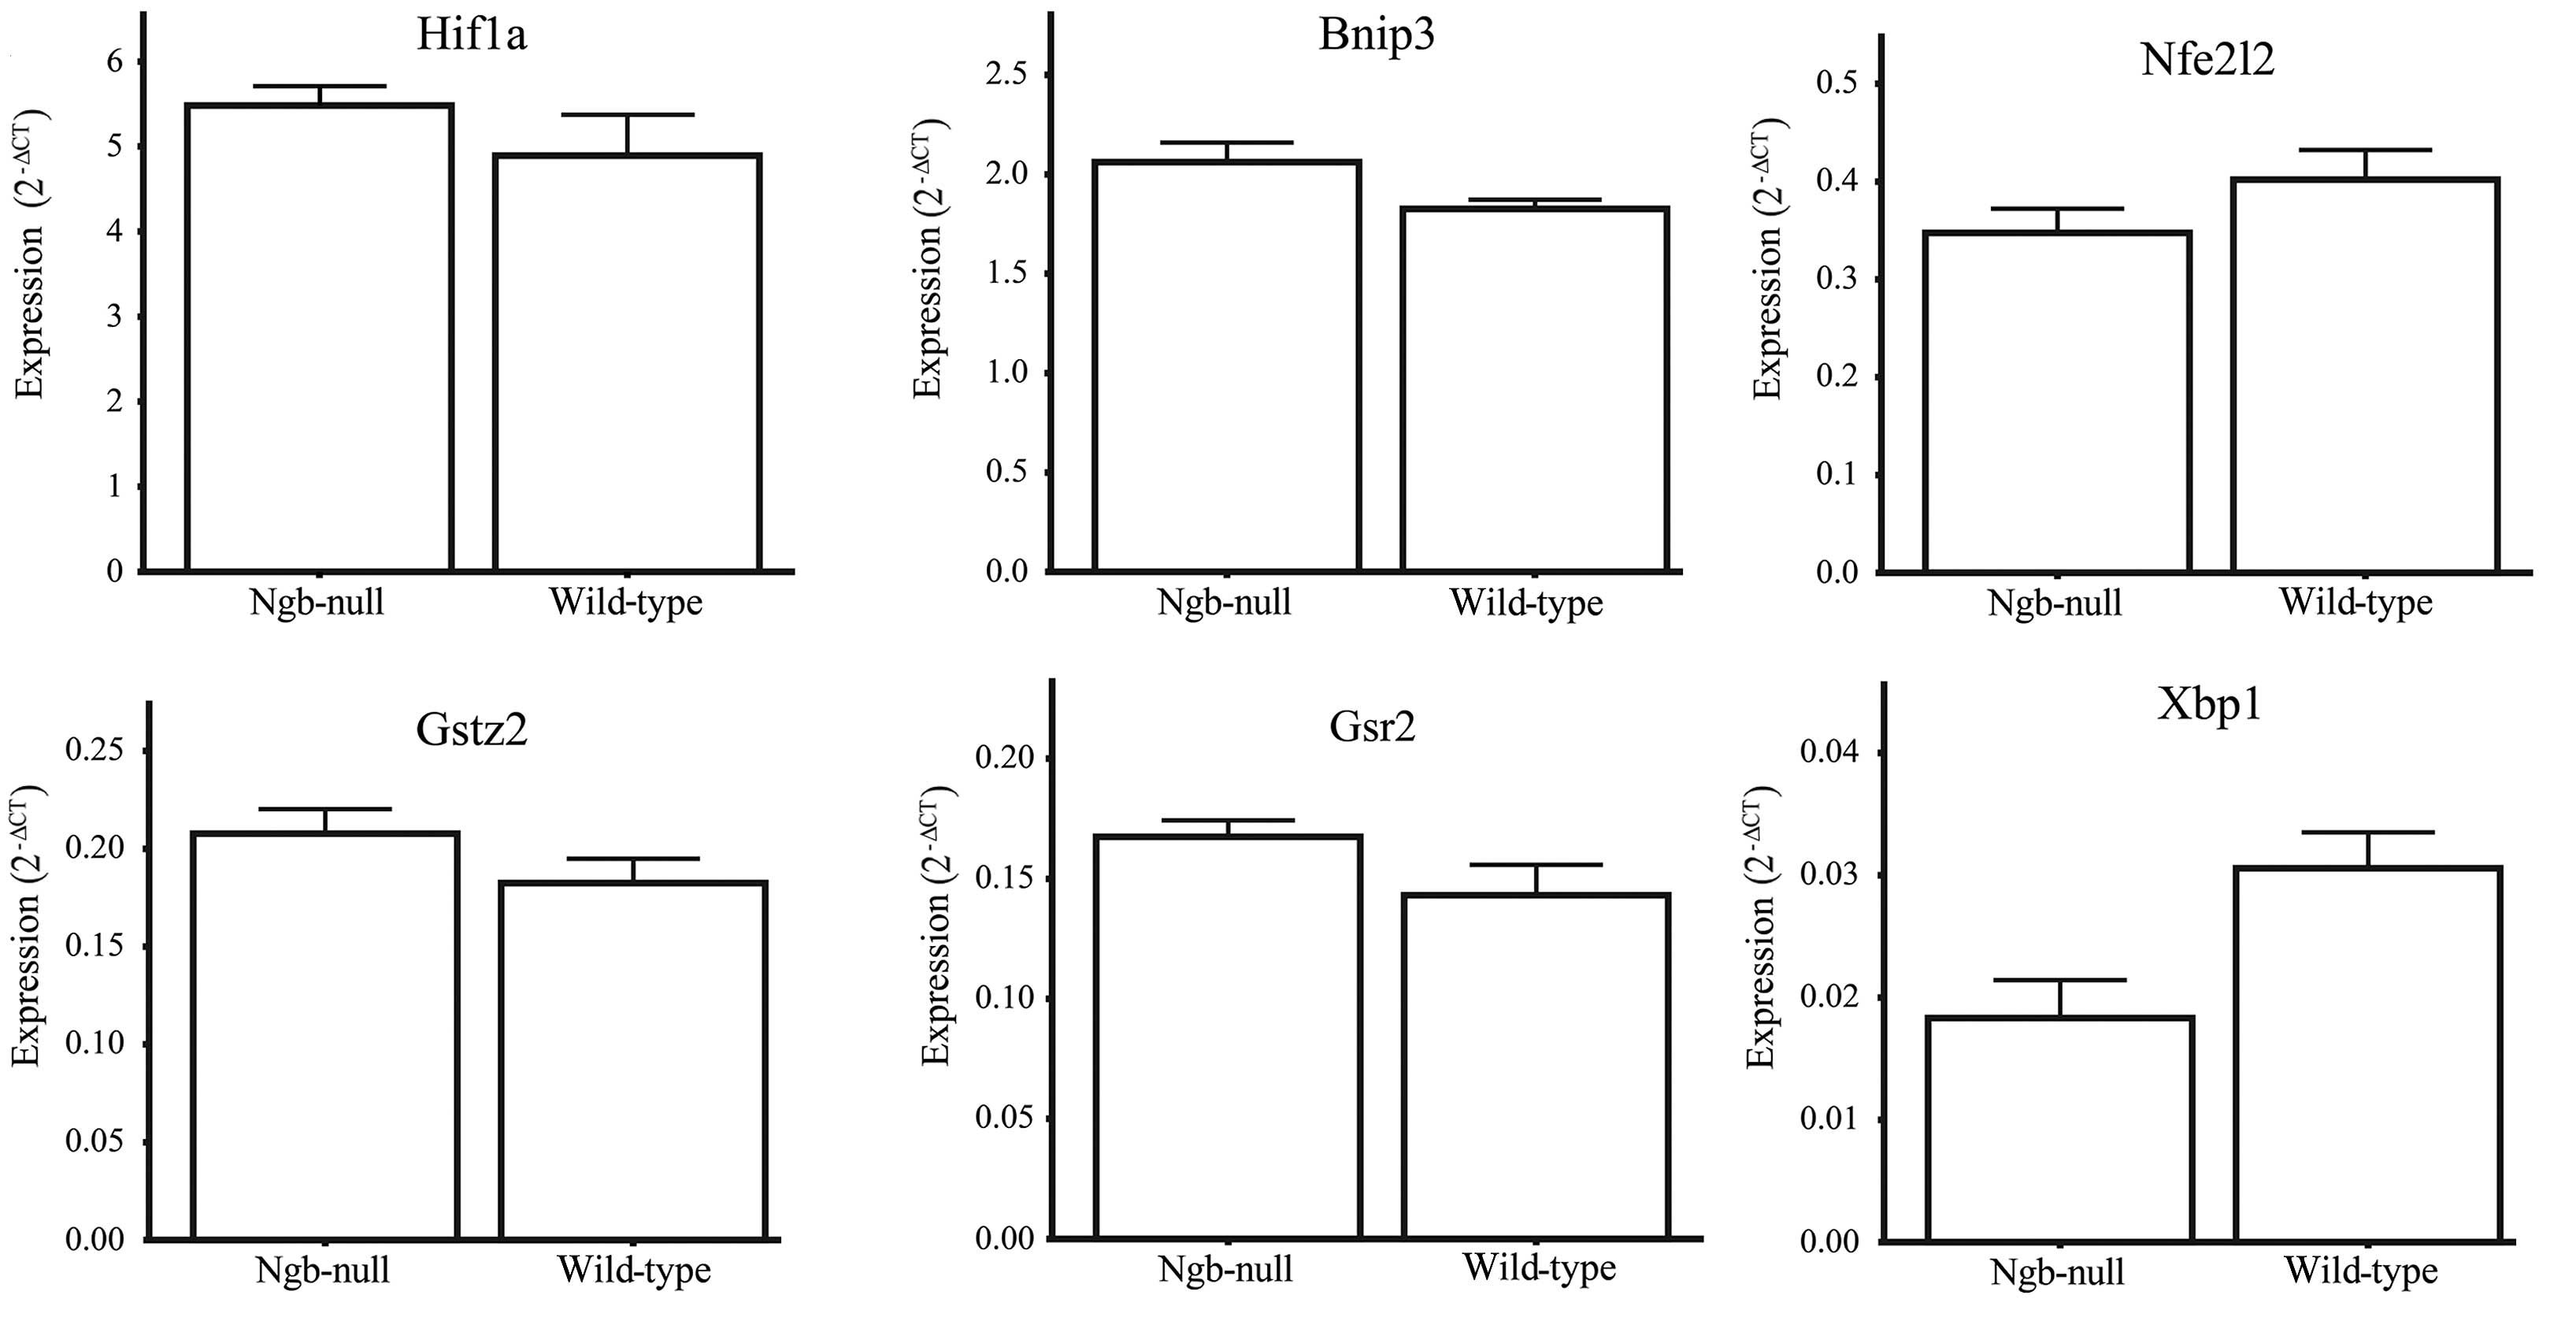
Several studies have indicating a role of Ngb in
scavenging reactive oxygen species. A recent study showed that Ngb
regulates Hif1α and Nrf2 (Nfe2l2) expression
and antioxidant levels in cells exposed to hypoxia (26). Therefore, the following genes were
chosen for differential expression analysis using RT-qPCR in the
dark-adapted retina: Hif1α, the Hif1α target gene
Bnip3 (27), the glutathione
system genes Gsr and Gstz1, the master regulator of
oxidative stress responsive genes Nfe2l2 (28) and the unfolded protein response
regulator Xbp1 (29). None
of the genes exhibited evidence of differential expression between
the genotypes, indicating that there was no apparent elevation of
ER-stress, oxidative stress or hypoxia response in the Ngb-null
retina (Fig. 4).
Discussion
A number of studies have reported high levels of Ngb
in the retina and adverse effects of Ngb knockdown on neuronal
survival, leading the hypothesis that Ngb is important for retinal
oxygen homeostasis and neuronal survival (7–14,30–32).
Recently, Chan et al (13)
found that transgenic overexpression of Ngb conferred protection
against retinal ischemia via a decrease in oxidative stress levels.
Similarly, Lechauve et al (14) showed that siRNA knockdown of Ngb
reduced mitochondrial activity, induced cell death and had an
adverse effect on visual performance. In the present study,
genome-wide transcriptional profiling was used to study the effect
of Ngb deficiency on gene expression in the eye under various light
conditions. Based on a number of studies indicating an involvement
of Ngb in retinal respiration, it was thought that Ngb-null retina
would exhibit an altered expression of genes associated with
hypoxic and oxidative stress response. Furthermore, an effect for
whether Ngb deficiency on gene expression response to light is
required for normal retinal function was expected.
In the present study, functional annotation of
differentially expressed genes in the dark-adapted retina showed no
evidence for the enrichment of the gene sets associated with
oxidative metabolism or cellular stress. Similarly, RT-qPCR
analysis of the marker genes for hypoxia, oxidative stress and
ER-stress did not indicate differential expression between the
genotypes. These results suggest that Ngb deficiency does not lead
to an altered light response or expressional changes indicative of
cellular stress. In addition, these results are in line with our
previous study, suggesting low and limited expression of Ngb in the
retina (15), as well as with the
study by Fago et al (33)
that suggested the low O2 affinity of Ngb appears to be
incompatible with a physiological role in mitochondrial
O2 supply at the low O2 tensions. The current
results are also supported by the apparently normal circadian
rhythm and the induction of light-responsive genes in the SCN of
Ngb-null mice (18).
The study of systemic gene expression differences
when the effect of light was ignored revealed several
differentially expressed genes between Ngb-null mice and wt. The
three genes showing the most significant differential expression
were Akap6, Entpd4 and Atp8a2. The only gene
of the three that was upregulated, Akap6, lies within 35 Mbp
from the Ngb locus and its differential expression may be due to
the congenic footprint (34).
Entpd4 is responsible for cleaving nucleotide tri- and
diphosphates and is believed to be involved in the rescue of
nucleotides from the lysosomal/autophagic vacuole lumen (35). To the best of our knowledge, we are
not aware of any previous studies indicating a functional coupling
between Ngb and Entpd4. Atp8a2 is highly expressed in
testes, spinal cord, brain and retina (36–38)
and is an adenosine triphosphate (ATP)-dependent lipid flippase
that translocates aminophospholipids from the exoplasmic to
cytoplasmic leaflets of membranes (39). A straightforward functional
association between Atp8a2 and Ngb is unclear as the former
is essential for the correct functioning of photoreceptor cells
(39), which do not appear to
express Ngb (15). As Atp8a2
consumes a notable amount of cellular ATP in the photoreceptor
cells (37), it could be
hypothesized that if Ngb is involved in oxygen delivery in the
retina then a lack of Ngb may lead to a reduced capacity for
oxidative phosphorylation resulting in a lower rate for
Atp8a2 expression. Of note, Atp8a2 deficiency leads
to the decline in visual perception and auditory failure (39).
In conclusion, the present study indicates that Ngb
deficiency does not lead to major alternations in light-dependent
gene expression response, but leads to subtle systemic differences
of currently unknown functional significance. Further studies are
required to ascertain whether Atp8a2 and Entpd4 are
functionally coupled to Ngb.
Acknowledgements
Financial support was provided by the Lundbeck
Foundation (grant no. R44-A4267), the NOVO-Nordisk Foundation, the
Foundation for Providing Medical Research, the Hartmann Foundation,
the Estonian Ministry of Science and Education (grant nos.
SF0180125s08 and GARFS0120P), the Estonian Science Foundation
(grant no. PUT120) and the European Regional Development Fund. H.L.
was supported by the Estonian Science Foundation (grant no.
ETF9099). S.I. was supported by the European Social Fund’s Doctoral
Studies Internationalization Program DoRa, carried out by
Archimedes. The authors are most grateful to Professors Eero Vasar
and Jan Fahrenkrug for providing excellent working facilities.
References
|
1
|
Anderson B Jr and Saltzman HA: Retinal
oxygen utilization measured by hyperbaric blackout. Arch
Ophthalmol. 72:792–795. 1964. View Article : Google Scholar : PubMed/NCBI
|
|
2
|
Ames A III: Energy requirements of CNS
cells as related to their function and to their vulnerability to
ischemia: a commentary based on studies on retina. Can J Physiol
Pharmacol. 70(Suppl): S158–S164. 1992. View
Article : Google Scholar : PubMed/NCBI
|
|
3
|
Ahmed J, Braun RD, Dunn R Jr and
Linsenmeier RA: Oxygen distribution in the macaque retina. Invest
Ophthalmol Vis Sci. 34:516–521. 1993.
|
|
4
|
Linsenmeier RA: Effects of light and
darkness on oxygen distribution and consumption in the cat retina.
J Gen Physiol. 88:521–542. 1986. View Article : Google Scholar : PubMed/NCBI
|
|
5
|
Burmester T, Weich B, Reinhardt S and
Hankeln T: A vertebrate globin expressed in the brain. Nature.
407:520–523. 2000. View
Article : Google Scholar : PubMed/NCBI
|
|
6
|
Dewilde S, Kiger L, Burmester T, et al:
Biochemical characterization and ligand binding properties of
neuroglobin, a novel member of the globin family. J Biol Chem.
276:38949–38955. 2001. View Article : Google Scholar : PubMed/NCBI
|
|
7
|
Schmidt M, Giessl A, Laufs T, Hankeln T,
Wolfrum U and Burmester T: How does the eye breathe? Evidence for
neuroglobin-mediated oxygen supply in the mammalian retina. J Biol
Chem. 278:1932–1935. 2003. View Article : Google Scholar : PubMed/NCBI
|
|
8
|
Bentmann A, Schmidt M, Reuss S, Wolfrum U,
Hankeln T and Burmester T: Divergent distribution in vascular and
avascular mammalian retinae links neuroglobin to cellular
respiration. J Biol Chem. 280:20660–20665. 2005. View Article : Google Scholar : PubMed/NCBI
|
|
9
|
Wei X, Yu Z, Cho KS, et al: Neuroglobin is
an endogenous neuroprotectant for retinal ganglion cells against
glaucomatous damage. Am J Pathol. 179:2788–2797. 2011. View Article : Google Scholar : PubMed/NCBI
|
|
10
|
Shi SY, Feng XM, Li Y, Li X and Chen XL:
Expression of neuroglobin in ocular hypertension induced acute
hypoxic-ischemic retinal injury in rats. Int J Ophthalmol.
4:393–395. 2011.PubMed/NCBI
|
|
11
|
Lechauve C, Rezaei H, Celier C, et al:
Neuroglobin and prion cellular localization: investigation of a
potential interaction. J Mol Biol. 388:968–977. 2009. View Article : Google Scholar : PubMed/NCBI
|
|
12
|
Rajendram R and Rao NA: Neuroglobin in
normal retina and retina from eyes with advanced glaucoma. Br J
Ophthalmol. 91:663–666. 2007. View Article : Google Scholar : PubMed/NCBI
|
|
13
|
Chan AS, Saraswathy S, Rehak M, Ueki M and
Rao NA: Neuroglobin protection in retinal ischemia. Invest
Ophthalmol Vis Sci. 53:704–711. 2012. View Article : Google Scholar : PubMed/NCBI
|
|
14
|
Lechauve C, Augustin S, Cwerman-Thibault
H, et al: Neuroglobin involvement in respiratory chain function and
retinal ganglion cell integrity. Biochim Biophys Acta.
1823.2261–2273. 2012.PubMed/NCBI
|
|
15
|
Hundahl CA, Fahrenkrug J, Luuk H,
Hay-Schmidt A and Hannibal J: Restricted expression of neuroglobin
in the mouse retina and co-localization with melanopsin and
tyrosine hydroxylase. Biochem Biophys Res Commun. 425:100–106.
2012. View Article : Google Scholar : PubMed/NCBI
|
|
16
|
Raida Z, Hundahl CA, Kelsen J, Nyengaard
JR and Hay-Schmidt A: Reduced infarct size in neuroglobin-null mice
after experimental stroke in vivo. Exp Transl Stroke Med. 4:152012.
View Article : Google Scholar : PubMed/NCBI
|
|
17
|
Hundahl CA, Luuk H, Ilmjarv S, et al:
Neuroglobin-deficiency exacerbates Hif1A and c-FOS response, but
does not affect neuronal survival during severe hypoxia in vivo.
PLoS One. 6:e281602011. View Article : Google Scholar : PubMed/NCBI
|
|
18
|
Hundahl CA, Fahrenkrug J, Hay-Schmidt A,
Georg B, Faltoft B and Hannibal J: Circadian behaviour in
neuroglobin deficient mice. PLoS One. 7:e344622012. View Article : Google Scholar : PubMed/NCBI
|
|
19
|
Ilmjarv S, Hundahl CA, Reimets R, et al:
Estimating differential expression from multiple indicators.
Nucleic Acids Res. 42:e722014. View Article : Google Scholar : PubMed/NCBI
|
|
20
|
Bedolla DE and Torre V: A component of
retinal light adaptation mediated by the thyroid hormone cascade.
PLoS One. 6:e263342011. View Article : Google Scholar : PubMed/NCBI
|
|
21
|
Porterfield VM, Piontkivska H and Mintz
EM: Identification of novel light-induced genes in the
suprachiasmatic nucleus. BMC Neurosci. 8:982007. View Article : Google Scholar : PubMed/NCBI
|
|
22
|
Reimand J, Arak T and Vilo J: g:Profiler -
a web server for functional interpretation of gene lists (2011
update). Nucleic Acids Res. 39:W307–W315. 2011. View Article : Google Scholar : PubMed/NCBI
|
|
23
|
Benjamini Y and Hochberg Y: Controlling
the false discovery rate: a practical and powerful approach to
multiple testing. J Roy Stat Soc Ser B. 57:289–300. 1995.
|
|
24
|
Livak KJ and Schmittgen TD: Analysis of
relative gene expression data using real-time quantitative PCR and
the 2(-Delta Delta C(T)) Method. Methods. 25:402–408. 2001.
View Article : Google Scholar : PubMed/NCBI
|
|
25
|
Araki R, Nakahara M, Fukumura R, et al:
Identification of genes that express in response to light exposure
and express rhythmically in a circadian manner in the mouse
suprachiasmatic nucleus. Brain Res. 1098:9–18. 2006. View Article : Google Scholar : PubMed/NCBI
|
|
26
|
Hota KB, Hota SK, Srivastava RB and Singh
SB: Neuroglobin regulates hypoxic response of neuronal cells
through Hif-1α- and Nrf2-mediated mechanism. J Cereb Blood Flow
Metab. 32:1046–1060. 2012.PubMed/NCBI
|
|
27
|
Mendez O, Zavadil J, Esencay M, et al:
Knock down of HIF-1alpha in glioma cells reduces migration in vitro
and invasion in vivo and impairs their ability to form tumor
spheres. Mol Cancer. 9:1332010. View Article : Google Scholar : PubMed/NCBI
|
|
28
|
Linker RA, Lee DH, Ryan S, et al: Fumaric
acid esters exert neuroprotective effects in neuroinflammation via
activation of the Nrf2 antioxidant pathway. Brain. 134:678–692.
2011. View Article : Google Scholar : PubMed/NCBI
|
|
29
|
Iwakoshi NN, Lee AH, Vallabhajosyula P,
Otipoby KL, Rajewsky K and Glimcher LH: Plasma cell differentiation
and the unfolded protein response intersect at the transcription
factor XBP-1. Nat Immunol. 4:321–329. 2003. View Article : Google Scholar : PubMed/NCBI
|
|
30
|
Ostojic J, Grozdanic SD, Syed NA, et al:
Patterns of distribution of oxygen-binding globins, neuroglobin and
cytoglobin in human retina. Arch Ophthalmol. 126:1530–1536. 2008.
View Article : Google Scholar : PubMed/NCBI
|
|
31
|
Ostojic J, Sakaguchi DS, de Lathouder Y,
et al: Neuroglobin and cytoglobin: oxygen-binding proteins in
retinal neurons. Invest Ophthalmol Vis Sci. 47:1016–1023. 2006.
View Article : Google Scholar : PubMed/NCBI
|
|
32
|
Schmidt M, Laufs T, Reuss S, Hankeln T and
Burmester T: Divergent distribution of cytoglobin and neuroglobin
in the murine eye. Neurosci Lett. 374:207–211. 2005. View Article : Google Scholar : PubMed/NCBI
|
|
33
|
Fago A, Hundahl C, Malte H and Weber RE:
Functional properties of neuroglobin and cytoglobin. Insights into
the ancestral physiological roles of globins. IUBMB Life.
56:689–696. 2004. View Article : Google Scholar : PubMed/NCBI
|
|
34
|
Schalkwyk LC, Fernandes C, Nash MW,
Kurrikoff K, Vasar E and Koks S: Interpretation of knockout
experiments: the congenic footprint. Genes Brain Behav. 6:299–303.
2007. View Article : Google Scholar : PubMed/NCBI
|
|
35
|
Biederbick A, Rose S and Elsasser HP: A
human intracellular apyrase-like protein, LALP70, localizes to
lysosomal/autophagic vacuoles. J Cell Sci. 112:2473–2484.
1999.PubMed/NCBI
|
|
36
|
Cacciagli P, Haddad MR, Mignon-Ravix C, et
al: Disruption of the ATP8A2 gene in a patient with a t(10;13) de
novo balanced translocation and a severe neurological phenotype.
Eur J Hum Genet. 18:1360–1363. 2010. View Article : Google Scholar : PubMed/NCBI
|
|
37
|
Coleman JA, Kwok MC and Molday RS:
Localization, purification, and functional reconstitution of the
P4-ATPase Atp8a2, a phosphatidylserine flippase in photoreceptor
disc membranes. J Biol Chem. 284:32670–32679. 2009. View Article : Google Scholar : PubMed/NCBI
|
|
38
|
Zhu X, Libby RT, de Vries WN, et al:
Mutations in a P-type ATPase gene cause axonal degeneration. PLoS
Genet. 8:e10028532012. View Article : Google Scholar : PubMed/NCBI
|
|
39
|
Coleman JA, Zhu X, Djajadi HR, et al:
Phospholipid flippase ATP8A2 is required for normal visual and
auditory function and photoreceptor and spiral ganglion cell
survival. J Cell Sci. 127:1138–1149. 2014. View Article : Google Scholar : PubMed/NCBI
|
|
40
|
Franceschini A, Szklarczyk D, Frankild S,
et al: STRING v9.1: protein-protein interaction networks, with
increased coverage and integration. Nucleic Acids Res.
41:D808–D815. 2013. View Article : Google Scholar : PubMed/NCBI
|