Introduction
Multiple sclerosis (MS) is an immune-mediated
inflammatory demyelinating disease of the central nervous system,
which is frequently initiated in early adult life and continues a
variable course that may progress in numerous patients, eventually
resulting in significant morbidity. Various genetic, immunological
and environmental factors have been associated with inducing the
onset and progression of the disease (1–3).
Genetics may play a role in the disease pathogenesis as MS is more
common in the Caucasian population and the frequency of MS appears
to increase with the distance from the Equator in the two
hemispheres (4). MS mainly affects
young adults and is more prevalent in females. The frequency in the
USA and Northern Europe is 100 per 100,000 people (5). There is a universal increase in the
prevalence and incidence of MS over time. In the Middle East, and
particularly the Gulf region, an increased prevalence has been
recently reported (6–8) due to genetic and environmental
factors, particularly following the most recent wars in the region
(9), with a similar increase in
Bahrain (Alsharoqi et al, 2014, unpublished data).
Pathologically, MS is identified by perivascular
infiltration of monocytes and lymphocytes, mainly cluster of
differentiation 4 (CD4) cells, within the brain and spinal cord
that cause myelin destruction (10). Peripheral blood mononuclear cells
(PBMCs) are involved in MS pathogenesis and induce active nerve
demyelination. Autoreactive activated T-cells invade the blood
brain barrier and initiate an inflammatory response that results in
myelin destruction and significant neurological disability
(11). Adhesion molecules,
chemokines, cytokines, T-cell and macrophage infiltration are the
main immune mediators that are involved in active MS lesions.
Additionally, it is considered that the proinflammatory and
anti-inflammatory responses have clear effects over the time of MS
progression (12).
To improve the understanding of MS pathogenesis in a
certain population and to mark novel treatment approaches to
identify patients with poor prognosis, new broad approaches are
required, such as gene expression. Microarray technology is
efficient at comprehensive detection and quantification of large
numbers of gene transcripts simultaneously (13). It provides detailed insight into
cellular mechanisms that are involved in gene expression regulation
and permits novel understanding of signaling networks that function
within cells or tissues and of the molecular processes involved
(14). Microarray was used to
evaluate the overall gene expression patterns and to understand the
composition of the genetic regulatory networks and the mechanisms
involved in MS (11,15).
In order to examine such gene expression in Bahraini
MS patients, that may be associated with the pathogenesis of the
disease in response to the emerged environmental factors (9) and via epigenetic mechanisms (2) for the initiation of molecular-targeted
approaches to personalized therapy, microarray technology was
utilized in the present study to analyze differential gene
upregulation in PBMCs isolated from Bahraini MS patients in
comparison to healthy subjects. The differential novel gene
expression was shown in the Bahraini MS patients, the gene was
cloned and protein showed potential immunological activity.
Materials and methods
Subjects
The study was approved by the Ethics Committee of
the Arabian Gulf University, Manama, Bahrain, and included 25
randomly-selected Bahraini MS patients who were newly diagnosed at
the Salmaniya Medical Complex (Manama, Bahrain) as relapse
remission MS (male and female, 20–40 years) and were not treated
with disease-modifying drugs. The patients were all Arab with the
same ethnic background. All the MS patients recruited for the study
were assessed independently by a neurologist and were diagnosed
clinically and radiologically according to the Modified McDonald
criteria 2010 (Dublin 2010) (16).
A similar number of healthy Bahraini individuals were used as
controls with matched age and gender, and without nervous system
pathology. All the participants had peripheral blood counts within
the reference range. All the subjects were required to sign an
informed consent form prior to entering the study.
RNA isolation and microarray
expression profiling using microarray
PBMCs were separated on a Ficol-Histopaque-1077
(Sigma, St. Louis, MO, USA) by density-gradient centrifugation. The
cells were lysed and total RNA was purified by TRIzol reagent
(Ambion, Austin, TX, USA). The quantity and purity of RNA samples
were confirmed by spectrophotometer and agarose gel
electrophoresis. Microarray experiments were carried out as
described previously (17).
Briefly, the GeneChip® 3′ IVT Express kit (Affymetrix,
Santa Clara, CA, USA) was used for target RNA preparation for
microarray expression analysis. In total, 100 ng input RNA was used
to first synthesize the cDNA strand. This cDNA was subsequently
converted into a double-stranded DNA, in vitro transcripted
to synthesize amplified RNA (aRNA), which incorporated a
biotin-conjugated nucleotide (aRNA), and was purified, fragmented,
labeled and hybridized to a GeneChip array (HG-U133_Plus_2;
Affymetrix). Gene chips were scanned using the GeneChip Scanner
3000 7G and Command Console Software (AGCC) version 1.0 according
to the manufacturer's instructions (Affymetrix).
cDNA synthesis and Roche quantitative
polymerase chain reaction (qPCR)
cDNA samples were synthesized using an anchored
oligo(dT)18 primer (Transcriptor First Strand cDNA synthesis kit;
Roche Diagnostics, Milan, Italy). For the LightCycler reaction, a
dual color assay was performed using a Roche Universal Probe
Library (UPL) probe specific for the hypothetical transmembrane
protein-66 gene (TMEM66) and a reference gene, the
hypoxanthine phosphorybosyl transferase (HPRT) probe, was
used as the internal control. TMEM66 UPL probe was labeled
with FAM, whereas the HPRT reference probe was labeled with
Yellow 555. A relative standard curve was created using a serial
dilution of positive sample (1,400, 700, 350, 175 and 87.5 ng), in
which the concentration is expressed in relative units (1, 0.5,
0.25, 0.125 and 0.0625). A Master mix of the following reaction
components was prepared to the indicated end-concentration: 9 µl
water, 0.4 µl TMEM66 forward primer (0.4 µM), 0.4 µl
TMEM66 reverse primer (0.4 µM), 0.4 µl TMEM66 UPL
probe (0.2 µM), 0.4 µl HPRT forward and reverse primer mix
(0.4 µM), 0.4 µl HPRT UPL probe (0.2 µM) and 4.0 µl of
LightCycler TaqMan DNA Master (Roche Diagnostics). A total of 15 µl
LightCycler Master mix was added to 5 µl cDNA samples of the
control and MS samples, where it was used as a PCR template into
the LightCycler capillaries. The following LightCycler experimental
run protocol was used: Denaturation program at 95°C for 10 min,
amplification and quantification program repeated 45 times at 95°C
for 10 sec, 60°C for 30 sec and 72°C for 1 sec with a dual
fluorescence measurement at 530 and 560 nm and finally a cooling
step at 40°C for 30 sec. For the mathematical model, it is
necessary to determine the crossing points (CP) for each
transcript. CP is defined as the point at which the fluorescence
rises significantly above the background fluorescence. ‘Fit point
method’ must be performed in the LightCycler software 4.1 (Roche
Diagnostics), at which CP will be measured at constant fluorescence
level (18).
TMEM66 gene cloning, protein
expression and purification
To express the TMEM66 protein, the plasmid
pT7CFE1-CHis vector (Thermo Scientific, Rockford, IL, USA) was
constructed with the cDNA clone (GenBank: DQ895663), which
expresses the full-length TMEM66 protein in the
NdeI/XhoI cloning site. The pT7CFE1-CHis vector was
subsequently used to transform competent Escherichia coli
(E. coli) DH5α. The transformed bacteria were grown on an
ampecillin-Luria-Bertani (LB) agar plate and incubated at 37°C
overnight. A single large colony was selected and grown further in
5 ml LB broth containing 5 µl of 100 mg/µl ampecillin overnight at
37°C with agitation at 350 rpm. The pre-culture of E. coli
(5 ml) containing pT7CFE1-CHis was added to 100 ml fresh LB medium
and grown at 37°C to a cell density of 0.6–0.8 (A650). The culture
was further grown at 35°C for 3–4 h after induction with isopropyl
β-D-1-thiogalactopyranoside (Sigma-Aldrich) to a final
concentration of 1 mM (19). The
cells were centrifuged for 10 min at 15,000 g and the cell pellets
were suspended in lysis buffer [50 mM Tris (pH 8.0), 10% glycerol,
0.1% Triton X-100, 100 µg/ml lysozyme, 1 mM phenylmethanesulfonyl
fluoride (PMSF), 3 units of DNase and 2 mM MgCl2].
Lysosomes and PMSF (P7626; Sigma-Aldrich) were immediately added
prior to the experiment. DNase was added following sonication. The
pellet was incubated at 30°C for 15 min, sonicated and centrifuged
at 17,418 x g for 20 min at 4°C. The supernatant was collected in
new tubes and the pellets were resuspended in lysis buffer. Cell
lysate was frozen at −20°C subsequent to obtaining 20 µl from the
supernatant and pellet portions for SDS-PAGE analysis. The
supernatant containing the TMEM66-His protein was purified by
HisPur Cobalt Purification kit (Thermo Scientific). The presence of
the purified product was confirmed by SDS-PAGE and western blot
using anti-TMEM66 antibody (ab80890; Abcam, Cambridge, MA, USA). A
rabbit polyclonal antibody to TMEM66 was used as the primary
antibody, whereas biotinylated goat anti-rabbit as secondary
antibody. The detection was performed using the colorimetric
western blot kit: MaxTag TMB/DAB substrate (Rockland
Immunochemicals, Inc., Gilbertsville, PA, USA) (19).
WST cell proliferation assay
Fast, sensitive quantification of cell proliferation
and viability was monitored using the Quick Cell Proliferation
assay kit (catalog no. BV-K301-10; BioVision, Inc., Milpitas, CA,
USA). The assay is based on the cleavage of the tetrazolium salt,
WST-1, to formazan by cellular mitochondrial dehydrogenases.
Expansion in the number of viable cells resulted in an increase in
the overall activity of the mitochondrial dehydrogenases in the
sample. The augmentation in enzyme activity leads to an increase in
the amount of formazan dye formed. The reagent was prepared by
dissolving the lyophilized WST-1 reagent with 5 ml of the electro
coupling solution (ECS). The Cell Proliferation assay procedures
were followed as the manufacturer instructed. Briefly, blood
samples were collected from apparently healthy volunteers into EDTA
tubes. Human peripheral blood mononuclear cells (hPBMCs) were
separated by the Ficol-Hypaque gradient (Sigma), counted and
cultured in triplicate in a 96-well microtiter plate in a final
volume of 100 µl/well culture medium [RPMI-1640 (Sigma),
supplemented with 10% fetal bovine serum, 2% glutamine and 1%
penicillin-streptomycin] at 1×10⁵ cells/well.
Subsequently, the cells were stimulated with TMEM66 protein at
different serial concentrations (340, 170, 85, 42.5, 21.25, 10.6,
5.3, 2.66 and 1.33 ng). The negative (unstimulated cells) and
positive controls (stimulated cells with 5 µg/ml PHA-M) were
included. The cells were incubated at 37°C in a 5% CO2
incubator for 24–72 h. Subsequently, 10 µl/well of WST-1/ECS
solution was added and incubated for 4 h in standard culture
conditions. Following thorough agitation for 1 min on a shaker, the
absorbance of the treated and untreated samples was measured using
a microtiter plate reader at 450 nm and the reference wavelength at
>600 nm (20,21).
Reverse-transcription (RT)-PCR
To investigate the effect of TMEM66 protein in terms
of cytokines, chemokines and adhesion molecules expression on
healthy PBMCs samples, RT-PCR was performed. PBMCs were purified by
the Histopaque method, washed, counted and cultured in complete
growth medium at a concentration of 100,000 cells per 100 µl/well.
The cells were treated with 340 ng TMEM66 protein and cultured at
37°C, 5% CO2 for 60 min and 24 h. RNA was extracted from
each TMEM66-treated and untreated samples at 60 min and after 24 h
by TRIzol® reagent (Invitrogen Life Technologies,
Carlsbad, CA, USA) (22–24).
Activity of TMEM66 protein on cytokine
and chemokine gene expression
cDNA was synthesized using 1 µg total RNA and the
cDNA synthesis kit (Roche Diagnostics) at the following
temperatures: 10 min at 25°C, 60 min at 42°C and 5 min at 99°C.
RT-PCR reactions contained 250 ng cDNA, 1.2 unit of
Taq DNA polymerase (Eppendorf, Hamburg, Germany), 1X PCR buffer
(Eppendorf), 0.2 µM of each primer, 0.2 mM of each dNTP and 2 mM
MgCl2, in a final volume of 50 µl. The expression of
different cytokines, chemokines and adhesion molecules were
measured by RT-PCR technology. These included tumor necrosis factor
(TNF)-α, interferon (IFN)-α, interleukin (IL)-2, IL-4, IL-6,
macrophage inflammatory protein 1α (MIP-1α) MIP1-α, MIP1-β,
chemokine receptor 5 (CCR5) and chemokine ligand 5 (CCL5).
Amplification and expression of the cytokines and chemokines at
different intervals following induction with TMEM66 protein were
determined by 2% gel electrophoresis stained with ethidium bromide
and visualized by UV light.
Statistical analysis
Data analysis was performed by Partek Genomics Suite
software (http://www.partek.com).
All the images of the raw CEL files were
investigated visually and the expression value was computed from
the raw CEL files by applying the Robust Multi-Chip Average (RMA)
background correction algorithm (25), which included value background
correction, quantile normalization, log2 transformation and median
polish summarization. Furthermore, the basic Affymetrix quality
control measurements were assessed using the Affymetrix Expression
Console software (average background, scale factor, percent present
and 3′ to 5′ ratio). The samples that showed deviant values in
these initial quality assessments were also deviant in primitive
clustering and component analysis and were therefore removed from
further analysis. Summarization of probe set intensity, background
correction and normalization was performed using the Partek
implementation of the GeneChip RMA algorithm (26). Prior to statistical analyses, the
genes whose expression levels did not vary in the sample population
(inter quartile range, 0.5) were removed. Analysis of variance
multiple model analysis was applied. The source of variation,
non-relevant batches effects, such as date and working batch, were
analyzed and eliminated. Fold ratio, fold change (FC) and P-value
were calculated for each gene in all the samples.
In the proliferation assay, the Student's t-test was
used to determine the level of significance between two groups.
P<0.05 was considered to indicate a statistically significant
difference.
Results
Identification of the differentially
expressed genes between MS patients and healthy subjects
The extracted RNA samples were selected according to
purity, integrity and quantity. A total of 100 ng RNA samples were
used with a high purity and high ratio of λ260/280 (1.8→1.9). All
the microarrays used in analysis passed all the stringent quality
control criteria. The gene expression measurement that was used in
the study is available and can be downloaded from Gene Expression
Omnibus (http://www.ncbi.nlm.nih.gov/geo/). Quality control
metrics are generated from importing the CEL files of all the
samples. The quality control information from the control and
experimental probes on the Affymetrix chips showed acceptable
results. There were no outliers registered from the distribution of
the intensities of the probes used.
Following the removal of deviated probe sets from
the analysis, 493 out of ~50,000 transcripts were differentially
expressed. Among these, 230 transcripts were upregulated while 263
were downregulated in the MS patients compared to the healthy
subjects as FC was 1.5<FC<-1.5 with P<0.05 (Tables I and II). The majority of the expressed genes
are of known function in the databases and in certain literature,
but one hypothetical protein with unknown function domain was
found. This transcript, which is TMEM66, was differentially
upregulated in the MS patients compared to the healthy individuals
by 3 times (FC, 3.106; P=0.020).
 | Table IUpregulated transcripts of the
multiple sclerosis patients compared to the healthy subjects. |
Table I
Upregulated transcripts of the
multiple sclerosis patients compared to the healthy subjects.
| Gene symbol | Gene title | Fold change | P-value |
|---|
| SMCHD1 | Structural
maintenance of chromosomes flexible hinge domain containing 1 |
8.895 |
0.002 |
| ANXA3 | Annexin A3 |
6.616 |
0.029 |
| RGS1 | Regulator of
G-protein signaling 1 |
4.926 |
0.006 |
| MAFF | v-Maf
musculoaponeurotic fibrosarcoma oncogene homolog F (avian) |
4.897 |
0.012 |
| TNFAIP3 | Tumor necrosis
factor, α-induced protein 3 |
4.471 |
0.015 |
| MALAT1 | Metastasis associated
lung adenocarcinoma transcript 1 (non-protein coding) |
4.371 |
0.022 |
| CD69 | CD69 molecule |
3.906 |
0.006 |
| CXCR4 | Chemokine (C-X-C
motif) receptor 4 |
3.682 |
0.040 |
| C12orf35 | Chromosome 12 open
reading frame 35 |
3.637 |
0.045 |
| CXCR4 | Chemokine (C-X-C
motif) receptor 4 |
3.597 |
0.045 |
| MXD1 | MAX dimerization
protein 1 |
3.585 |
0.008 |
| PAPOLA | Poly(A) polymerase
α |
3.558 |
0.030 |
| KCNJ15 | Potassium
inwardly-rectifying channel, subfamily J, member 15 |
3.515 |
0.041 |
| NAMPT | Nicotinamide
phosphoribosyltransferase |
3.442 |
0.004 |
| HBP1 | HMG-box transcription
factor 1 |
3.269 |
0.030 |
| MGAM |
Maltase-glucoamylase (α-glucosidase) |
3.194 |
0.020 |
| USP15 | Ubiquitin specific
peptidase 15 |
3.151 |
0.028 |
| PROK2 | Prokineticin 2 |
3.120 |
0.027 |
|
LOC100289246 | Hypothetical
protein LOC100289246 |
3.106 |
0.020 |
| Table IIDownregulated transcripts of the
multiple sclerosis patients compared to the healthy subjects. |
Table II
Downregulated transcripts of the
multiple sclerosis patients compared to the healthy subjects.
| Gene symbol | Gene title | Fold change | P-value |
|---|
| DLEU2 | Deleted in
lymphocytic leukemia 2 (non-protein coding) |
−3.720 |
0.013 |
|
APOBEC3B | Apolipoprotein B
mRNA editing enzyme, catalytic polypeptide-like 3B |
−3.648 |
0.032 |
| MCTP1 | Multiple C2
domains, transmembrane 1 |
−2.803 |
0.040 |
| CLIC3 | Chloride
intracellular channel 3 |
−2.744 |
0.018 |
| SMAD1 | SMAD family member
1 |
−2.534 |
0.043 |
| ZNF880 | Zinc finger protein
880 |
−2.478 |
0.014 |
|
TMEM106B | Transmembrane
protein 106B |
−2.421 |
0.049 |
| DLEU2 | Deleted in
lymphocytic leukemia 2 (non-protein coding) |
−2.420 |
0.027 |
| SRD5A3 | Steroid 5
α-reductase 3 |
−2.419 |
0.033 |
| FAM43A | Family with
sequence similarity 43, member A |
−2.330 |
0.004 |
| RAPH1 | Ras association
(RalGDS/AF-6) and pleckstrin homology domains 1 |
−2.312 |
0.034 |
| C7orf36 | Chromosome 7 open
reading frame 36 |
−2.296 |
0.002 |
| NBPF1 | Neuroblastoma
breakpoint family, member 1 |
−2.295 |
0.013 |
| ZEB2 | Zinc finger E-box
binding homeobox 2 |
−2.243 |
0.016 |
| GPR18 | G protein-coupled
receptor 18 |
−2.231 |
0.004 |
| SOS1 | Son of sevenless
homolog 1 (Drosophila) |
−2.220 |
0.012 |
| ADRB2 | Adrenergic, β-2-,
receptor, surface |
−2.176 |
0.002 |
|
C12orf73 | Chromosome 12 open
reading frame 73 |
−2.173 |
0.003 |
| QSER1 | Glutamine and
serine rich 1 |
−2.144 |
0.039 |
| CTAGE5 | CTAGE family,
member 5 |
−2.140 |
0.042 |
| PTGDS | Prostaglandin D2
synthase 21 kDa (brain) |
−2.139 |
0.043 |
| TRIM32 | Tripartite
motif-containing 32 |
−2.128 |
0.001 |
| MRPS14 | Mitochondrial
ribosomal protein S14 |
−2.080 |
0.026 |
|
ARL17A/B | ADP-ribosylation
factor-like 17A/B |
−2.067 |
0.036 |
| ZNF818P | Zinc finger protein
818 (pseudogene) |
−2.032 |
0.047 |
The expression of the upregulated genes was
confirmed by qPCR. The ratio concentration was derived from
relative standard curves using the CP median values. The target to
reference ratios of all the samples are referenced to the target to
reference ratio of the calibrator. The results (target levels
normalized to reference levels) showed that MS patients had a
3-fold greater expression level of the TMEM66 gene compared
to the control group.
Effects of TMEM66 protein on hPBMCs
proliferation
To study the activity of TMEM66 on hPBMCs, the WST
Cell Proliferation assay was used. The cells were incubated for 24,
48 and 72 h after stimulation with different concentrations of
TMEM66 and PHA as the positive control. Certain cells were left
untreated as negative controls. TMEM66 showed higher proliferative
effects with all concentrations used in all three periods compared
to unstimulated cells (negative control). The most significant
proliferative effects were noted at 24 h, followed by 48 h
incubation (P<0.05) (Fig.
1).
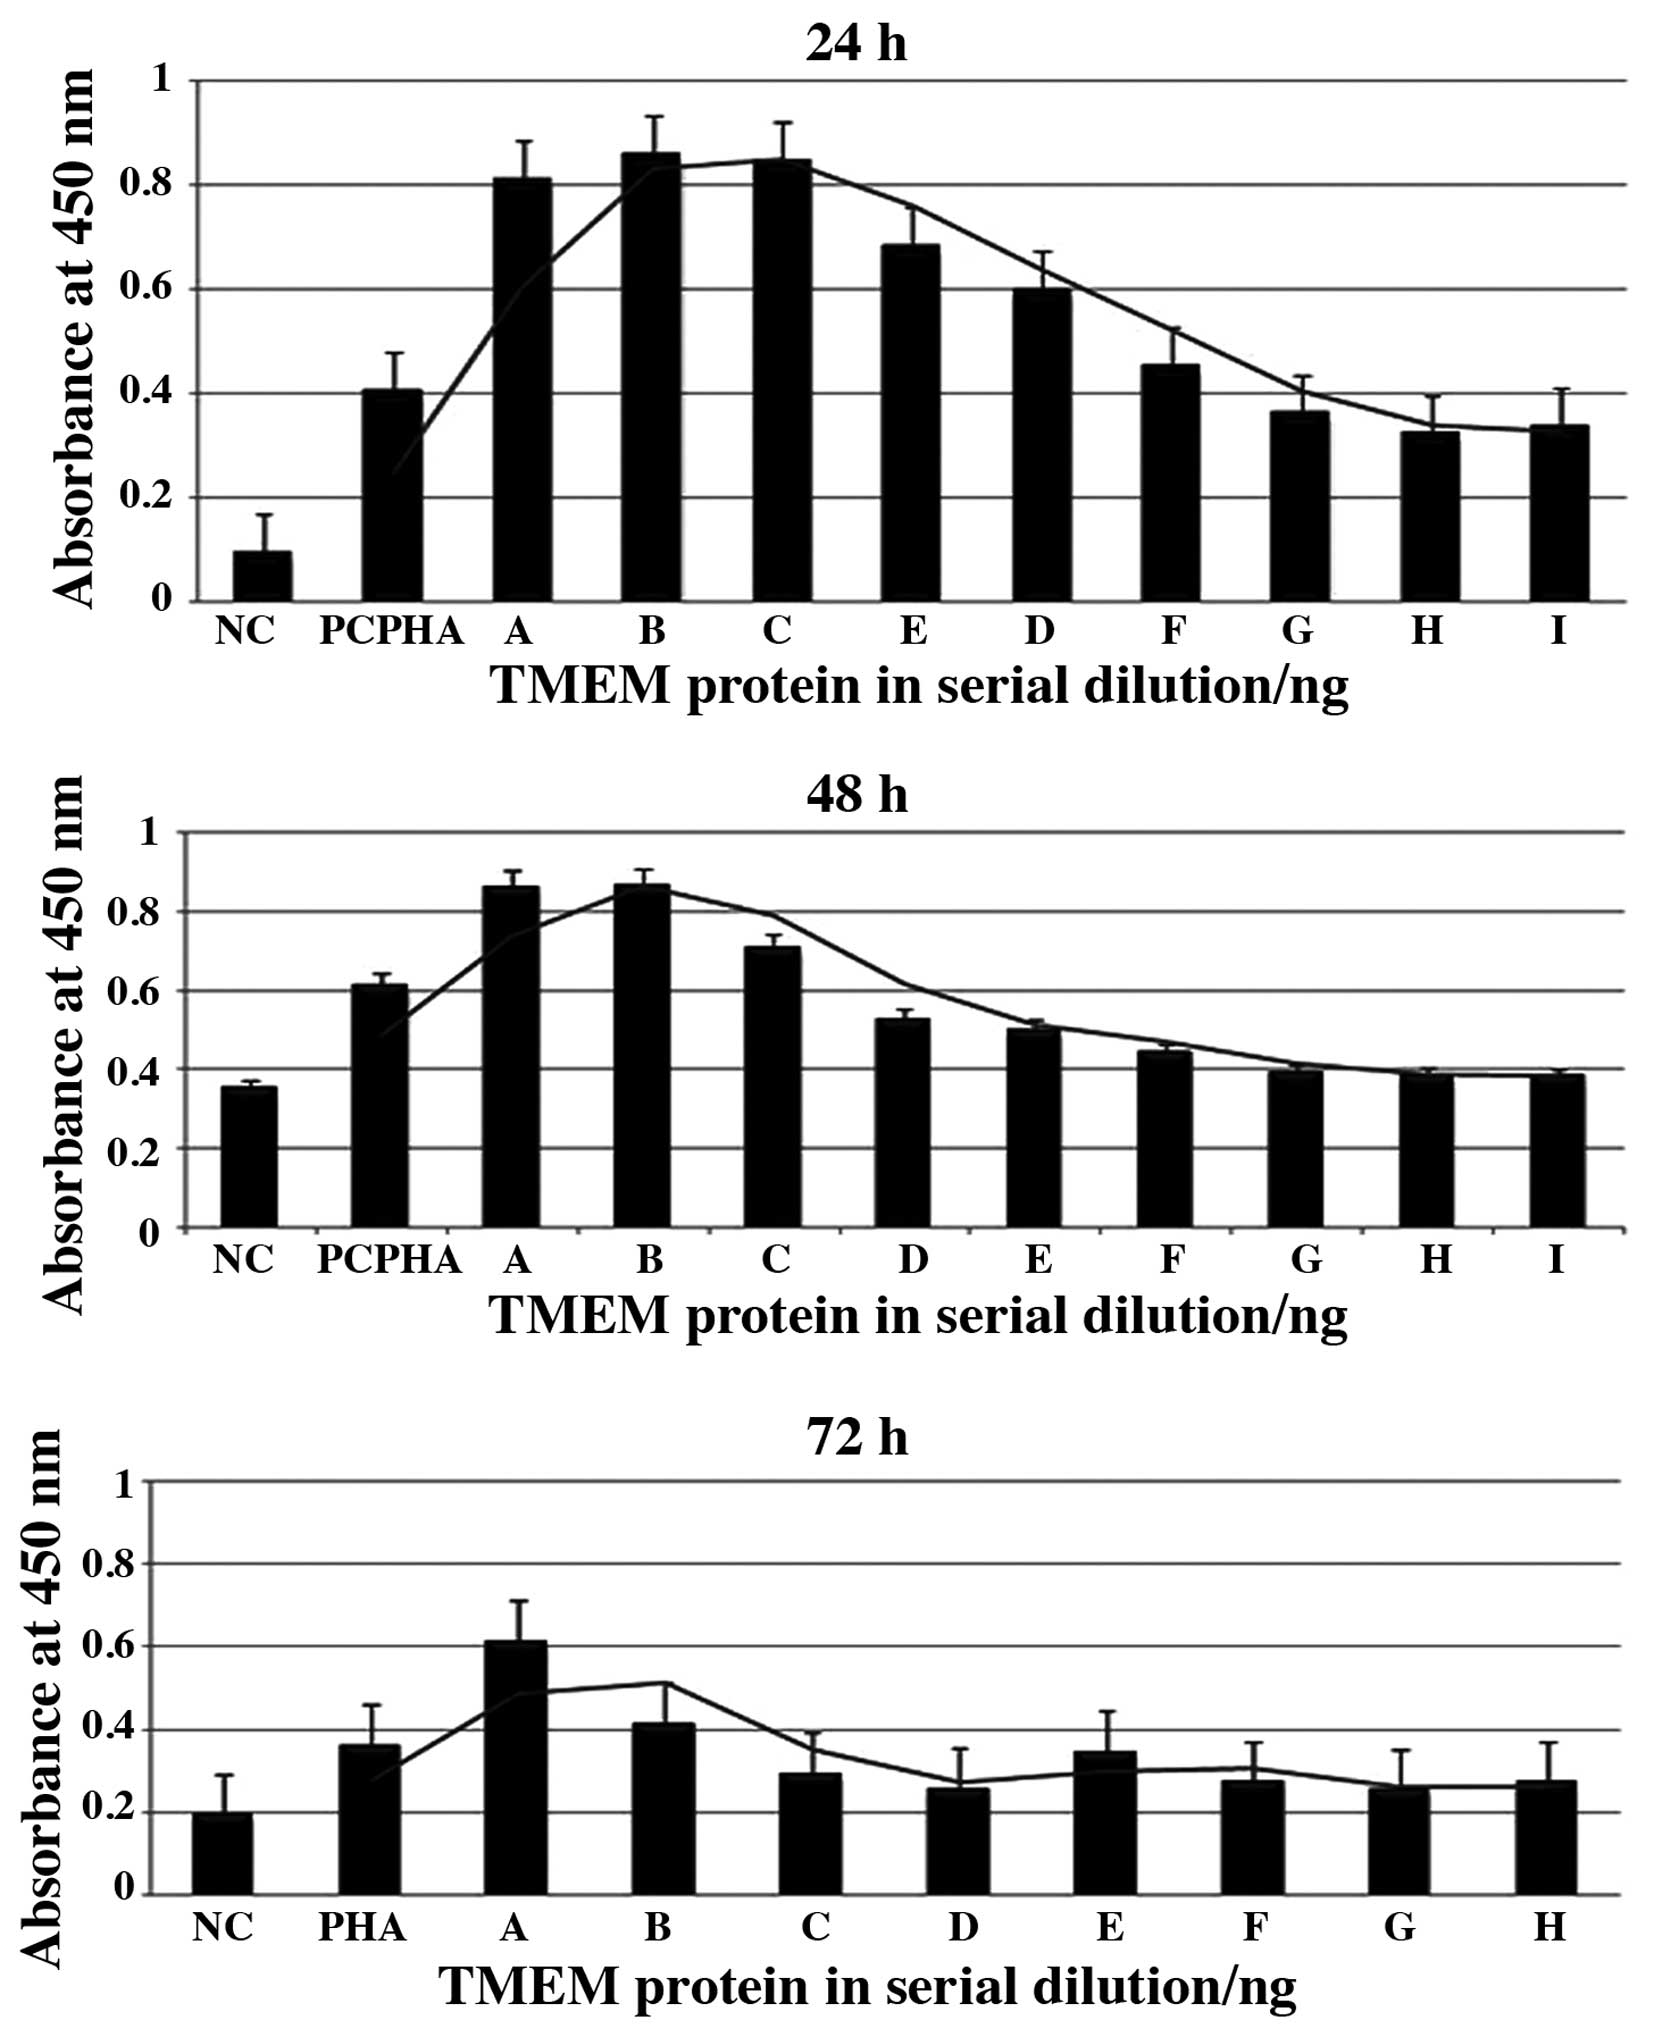 | Figure 1Effects of hypothetical transmembrane
protein-66 (TMEM66) on human peripheral blood mononuclear cells
(hPBMCs) proliferation. The effects after incubation for 24, 48 and
72 h were measured by the WST Cell Proliferation assay. Negative
(unstimulated cells) and positive controls (stimulated cells with 5
µg/ml PHA-M) were included. (A-H) Serial dilution of the TMEM66
protein (A, 340; B, 170; C, 85; D, 42.5; E, 21.25; F, 10.6; G, 5.3;
H, 2.66; and I, 1.33 ng). Bars show the absorbance at 450 nm
following treatment of the cells with the WST-1 reagent. Higher
protein concentration had a significant proliferative effect
compared to the negative control in all three periods
(P<0.05). |
Activity of TMEM66 protein on cytokine
and chemokine gene expression
The induction of potential proinflammatory cytokines
and chemokines was examined by RT-PCR to demonstrate the expression
of these mediators in response to TMEM66 stimulation and in
comparison to the reference gene (β-actin) at 1 and 24 h.
The data showed induction of the proinflammatory cytokines IL-6,
IFN-γ and TNF-α, and the chemokines CCL5, CCR5, MIP-1α and MIP-1β,
but not the anti-inflammatory cytokine IL-4 or the growth factor
cytokine IL-2. CCL5, CCR5 and MIP-1β were expressed at all the time
points, but IL-6, IFN-γ, TNF-α and MIP-1 were mainly expressed
after 1 h exposure to TMEM66 (Fig.
2).
Discussion
The recently reported increased prevalence of MS in
the Middle East (6), the Gulf
region (7,8) and in Bahrain (Alsharoqi et al,
2014, unpublished data, where prevalence was found to be
50/100,1000) has stimulated the study of differential gene
expression in Bahraini MS patients with an insight to detect novel
genes that may correlate with the pathogenesis of MS. The data
showed that a total of 493 genes were differentially expressed in
MS patients and control individuals. A total of 230 genes were
upregulated and 263 were downregulated with an FC range of −1.5 to
+1.5. Certain genes were of unknown function, such as
TMEM66, which was found to be expressed 3 times higher in
Bahraini MS patients compared to the controls.
The TMEM66 protein is a hypothetical protein of
unknown function. It contains 339 amino acids and belongs to the
DUF1183 family. This family consists of several eukaryotic proteins
of ~360 residues in length. Recently, Palty et al (27) identified the character of the
TMEM66 gene product using a functional-based high-throughput
screen [known as SOCE-associated regulatory factor (SARAF)] as a
regulator of cellular Ca2+ homeostasis. SARAF is a
highly conserved protein in vertebrates and has poor functional
annotation. In mammals, SARAF is ubiquitously expressed, but has
significantly high transcript levels in the immune and neuronal
tissues (28). In other studies,
the TMEM66 gene was expressed among different novel
androgen-responsive genes in prostate cancer. Those genes were
indicated to play a role in the molecular mechanisms of
androgen-dependency of the prostate and were also considered as
targets for therapy or biomarkers of prostate cancer (29,30).
As TMEM66 was preferentially expressed in the
present MS patients, the relevance to MS was explored by cloning
the gene, producing the recombinant protein and testing it for
immunological activity that is relevant to the pathogenesis of MS.
The results depicted potential proinflammatory activity of the
TMEM66 protein since it induced significant proliferation and
increased induction of the proinflammatory cytokines IL-6, IFN-γ,
TNF-α and the chemokines CCL5 and CCR5, MIP-1α and MIP-1β, but not
the anti-inflammatory cytokine IL-4 or the growth factor cytokine
IL-2. These data are supportive of the possible involvement of
TMEM66 in the pathological events of MS in the patients, as MS is
considered to be mainly mediated by immune response (31). The proinflammatory and
anti-inflammatory responses were shown to have clear effects over
the time in the progression of the disease (12).
Understanding the mediators of the inflammation
profiles and their roles may help in the characterization of
mechanisms involved in the pathogenesis of the disease and may help
to monitor the disease course and evaluate the responses to
specific therapies that may result in novel therapies directed at
cytokines or their receptors. A multiplexed immunoassay was used to
assess the concentrations of 13 cytokines/inflammatory markers,
including IFN-γ; IL-1β, −2, −4, −5, −6, −8, −10, −12 and −13;
TNF-α; IL-2 receptor; and soluble CD40 ligand. Significant
increases in the patients compared to the control subjects for
IFN-γ, IL-2, IL-1β, TNF-α, IL-4, IL-10 and IL-13 were noted
(12).
In conclusion, determination of new genes that are
relevant to pathogenetic development of MS in a particular
population may help in addressing novel therapeutic approaches in
molecular-targeted personalized medicine that is informed by the
distinctive clinical, genetic, genomic makeup and environmental
information for an individual. Thus, finding a unique gene that is
preferentially expressed in a certain population and demonstrating
a potential immune activity by the protein encoded by this gene is
the first step to develop targeted diagnostics and therapeutic
approaches to achieve more personalized management. TMEM66
may be a possible candidate in this regard. Further analysis are
required to study the expression of this protein in MS patients
from the Middle East and Gulf region during different stages of the
disease, and additionally, in order to identify a link between
TMEM66 and the lesion pathogenesis of MS, it would be
pertinent to study the expression of this molecule in the
demyelinating lesion of MS prior to considering it as a relevant
diagnostic, therapeutic and follow-up biomarker for the
disease.
Acknowledgements
The present study received financial support from
the College of Medicine and Medical Sciences, Arabian Gulf
University, Bahrain.
References
|
1
|
Broux B, Stinissen P and Hellings N: Which
immune cells matter? The immunopathogenesis of multiple sclerosis.
Crit Rev Immunol. 33:283–306. 2013. View Article : Google Scholar : PubMed/NCBI
|
|
2
|
Küçükali CI, Kürtüncü M, Coban A, Cebi M
and Tüzün E: Epigenetics of multiple sclerosis: an updated review.
Neuromolecular Med: Mar. 21:2014.(Epub ahead of print).
|
|
3
|
Ascherio A: Environmental factors in
multiple sclerosis. Expert Rev Neurother. 13 (Suppl 12):3–9. 2013.
View Article : Google Scholar
|
|
4
|
Kenealy SJ, Pericak-Vance MA and Haines
JL: The genetic epidemiology of multiple sclerosis. J Neuroimmunol.
143:7–12. 2003. View Article : Google Scholar
|
|
5
|
Noseworthy JH, Lucchinetti C, Rodriguez M
and Weinshenker BG: Multiple sclerosis. N Engl J Med. 343:938–952.
2000. View Article : Google Scholar
|
|
6
|
Alroughani RA and Al-Jumah MA: The need
for a multiple sclerosis registry in the Gulf Region. Neurosciences
(Riyadh). 19:85–86. 2014.PubMed/NCBI
|
|
7
|
Aljumah M, Alroughani R, Alsharoqi I, et
al: Future of management of multiple sclerosis in the middle East:
a consensus view from specialists in ten countries. Mult Scler Int
2013: 952321. 2013.PubMed/NCBI
|
|
8
|
Bohlega S, Inshasi J, Al Tahan AR, Madani
AB, Qahtani H and Rieckmann P: Multiple sclerosis in the Arabian
Gulf countries: a consensus statement. J Neurol. 260:2959–2963.
2013. View Article : Google Scholar : PubMed/NCBI
|
|
9
|
Al-Afasy HH, Al-Obaidan MA, Al-Ansari YA,
et al: Risk factors for multiple sclerosis in Kuwait: a
population-based case-control study. Neuroepidemiology. 40:30–35.
2013. View Article : Google Scholar : PubMed/NCBI
|
|
10
|
Prat E and Martin R: The
immunopathogenesis of multiple sclerosis. J Rehabil Res Dev.
39:187–199. 2002.
|
|
11
|
Achiron A, Gurevich M, Magalashvili D,
Kishner I, Dolev M and Mandel M: Understanding autoimmune
mechanisms in multiple sclerosis using gene expression microarrays:
treatment effect and cytokine-related pathways. Clin Dev Immunol.
11:299–305. 2004. View Article : Google Scholar
|
|
12
|
Martins TB, Rose JW, Jaskowski TD, et al:
Analysis of proinflammatory and anti-inflammatory cytokine serum
concentrations in patients with multiple sclerosis by using a
multiplexed immunoassay. Am J Clin Pathol. 136:696–704. 2011.
View Article : Google Scholar : PubMed/NCBI
|
|
13
|
Kolbert CP, Taylor WR, Krajnik KL and
O'Kane DJ: Gene expression microarrays. Methods Mol Med.
85:239–255. 2003.
|
|
14
|
Watson A, Mazumder A, Stewart M and
Balasubramanian S: Technology for microarray analysis of gene
expression. Curr Opin Biotechnol. 9:609–614. 1998. View Article : Google Scholar : PubMed/NCBI
|
|
15
|
Baranzini SE and Hauser SL: Large-scale
gene-expression studies and the challenge of multiple sclerosis.
Genome Biol. 3:10272002. View Article : Google Scholar : PubMed/NCBI
|
|
16
|
Polman CH, Reingold SC, Banwell B, et al:
Diagnostic criteria for multiple sclerosis: 2010 revisions to the
McDonald criteria. Ann Neurol. 69:292–302. 2011. View Article : Google Scholar : PubMed/NCBI
|
|
17
|
Zanzinger K, Schellack C, Nausch N and
Cerwenka A: Regulation of triggering receptor expressed on myeloid
cells 1 expression on mouse inflammatory monocytes. Immunology.
128:185–195. 2009. View Article : Google Scholar : PubMed/NCBI
|
|
18
|
Rasmussen R: Quantification on the
LightCyclerRapid Cycle Real-Time PCR, Methods and Applications.
Meuer S, Wittwer C and Nakagawara K: Springer Press; Heidelberg:
pp. 22–34. 2001
|
|
19
|
Ausubel FM, Brent R, Kingston RE, Moore
DD, Seidman JG, Smith JA and Struhl K: Current Protocols in
Molecular Biology. John Wiley & Sons; New York, NY: 1994
|
|
20
|
Decker T and Lohmann-Matthes ML: A quick
and simple method for the quantitation of lactate dehydrogenase
release in measurements of cellular cytotoxicity and tumor necrosis
factor (TNF) activity. J Immunol Methods. 115:61–69. 1988.
View Article : Google Scholar
|
|
21
|
Korzeniewski C and Callewaert DM: An
enzyme-release assay for natural cytotoxicity. J Immunol Methods.
64:313–320. 1983. View Article : Google Scholar : PubMed/NCBI
|
|
22
|
Chomczynski P: A reagent for the
single-step simultaneous isolation of RNA, DNA and proteins from
cell and tissue samples. Biotechniques. 15:532–534, 536–537.
1993.PubMed/NCBI
|
|
23
|
Chomczynski P and Sacchi N: Single-step
method of RNA isolation by acid guanidinium
thiocyanate-phenol-chloroform extraction. Anal Biochem.
162:156–159. 1987. View Article : Google Scholar : PubMed/NCBI
|
|
24
|
Hummon AB, Lim SR, Difilippantonio MJ and
Ried T: Isolation and solubilization of proteins after TRIzol
extraction of RNA and DNA from patient material following prolonged
storage. Biotechniques. 42:467–470, 472. 2007. View Article : Google Scholar : PubMed/NCBI
|
|
25
|
Irizarry RA, Hobbs B, Collin F, et al:
Exploration, normalization, and summaries of high density
oligonucleotide array probe level data. Biostatistics. 4:249–264.
2003. View Article : Google Scholar
|
|
26
|
Wu Z, Irizarry R, Gentlemen R, et al: A
model-based background adjustment for oligonucleotide expression
arrays. J Am Statist Assoc. 99:909–917. 2004. View Article : Google Scholar
|
|
27
|
Palty R, Raveh A, Kaminsky I, Meller R and
Reuveny E: SARAF inactivates the store operated calcium entry
machinery to prevent excess calcium refilling. Cell. 149:425–438.
2012. View Article : Google Scholar : PubMed/NCBI
|
|
28
|
Su AI, Wiltshire T, Batalov S, et al: A
gene atlas of the mouse and human protein-encoding transcriptomes.
Proc Natl Acad Sci USA. 101:6062–6067. 2004. View Article : Google Scholar : PubMed/NCBI
|
|
29
|
Romanuik TL, Wang G, Holt RA, Jones SJ,
Marra MA and Sadar MD: Identification of novel androgen-responsive
genes by sequencing of LongSAGE libraries. BMC Genomics.
10:4762009. View Article : Google Scholar : PubMed/NCBI
|
|
30
|
Romanuik TL, Ueda T, Le N, et al: Novel
biomarkers for prostate cancer including noncoding transcripts. Am
J Pathol. 175:2264–2276. 2009. View Article : Google Scholar : PubMed/NCBI
|
|
31
|
Hartung HP, Aktas O, Menge T and Kieseier
BC: Immune regulation of multiple sclerosis. Handb Clin Neurol.
122:3–14. 2014. View Article : Google Scholar
|


