Introduction
Hepatitis C is a world-wide contagious liver disease
caused by hepatitis C virus (HCV). As estimated by WHO, some
130–170 million people are chronically infected with HCV and are at
the risk of developing liver cirrhosis and cancer. More than
350,000 people die of HCV-related liver diseases each year. HCV is
an enveloped, positive-sense single-stranded RNA virus and is
classified into 6 genotypes and 52 subtypes present all over the
world (1).
Patients infected by different HCV genotypes show
respective clinical and pathogenic data (2). Insulin resistance, steatosis and
progression toward fibrosis cirrhosis, and hepatocellular carcinoma
establish and develop following genotype-specific mechanisms.
Moreover, the genotype influences pharmacological treatment in term
of dose and duration. Genotype 1 is associated with a more
aggressive disease with increased insulin resistance, worst
response to therapy, higher risk of cirrhosis and hepatocellular
carcinoma development, while genotype 3 is associated with
increased fibrosis and steatosis (3). The mechanisms by which HCV infection
promotes the development of liver disease remain unclear. The
direct interaction of viral proteins, particularly core proteins,
and host machinery may play important roles (4).
microRNA (miRNAs) are a class of small non-coding
RNA molecules that regulate gene expression through translational
repression and mRNA degradation (5). miRNAs are involved in crucial
physiologic and pathologic processes (6). miRNA dysfunction has been linked to
the pathophysiology of human diseases, including those resulting
from virus infection (7).
Recently, it has been suggested that host miRNAs play critical
roles in regulating HCV infection (8).
This study was undertaken to characterize the miRNA
profile of Huh-7 cells expressing the HCV core 3a vs. 1b, to
predict targets of verified miRNAs and to explore potential
functions and downstream pathways in order to further elucidate the
role of these molecules in the pathogenesis of HCV infection.
Materials and methods
Plasmid construction
The HCV core region DNA (genotypes 3a and 1b) was
synthesized according to the sequnce published in NCBI (GenBank,
genotype 3a: AM263171.1, genotype 1b: EU155369.2) by Beijing AuGCT
DNA-SYN Biotechnology Co., Ltd. (Beijing, China). The core region
DNA was cloned into the PCMV5 vector. The HA-tagged HCV core region
was cloned into the pcDNA3.1(+) vector using appropriate
restriction sites. Direct sequencing of the expression vectors was
carried out by AuGCT. Sequences were aligned in the NCBI BLAST
server.
Cell culture and stable transfection
Human hepatoma Huh-7 cells were cultured at 37°C in
a 5% CO2 atmosphere in Dulbecco’s modified Eagle’s
medium (DMEM) supplemented with 10% fetal bovine serum (Hangzhou
Sijiqing Biological Engineering Materials Co., Ltd., China).
pcDNA3.1(+) plasmids containing the HA-tagged HCV genotype 3a or 1b
core-encoding regions were transfected into Huh-7 cells with
Lipofectamine 2000 (Invitrogen) as previously described (9). Briefly, cells were incubated with
Opti-MEM medium (Invitrogen) under standard conditions for the
first 6 h after transfection and then the medium was changed to
DMEM containing 10% fetal calf serum without antibiotics.
Twenty-four hours after transfection, the cells were cultured in
the pressure selection medium containing 800 μg/ml G418
(Invitrogen). After 10–12 days, the neomycin-resistant cell
colonies were isolated and maintained in the culture medium
containing 400 μg/ml G418.
miRNA microarray profiling
Total-RNA was purified from Huh-7 cells expressing
the HCV core using the miRNeasy mini kit (Qiagen, Valencia, CA,
USA). The quality of the total-RNA was confirmed by the Agilent
2100 Bioanalyzer and RNA LabChip® kits (Agilent
Technologies Inc., Santa Clara, CA, USA). Total-RNA (100 ng) was
dephosphorylated with calf intestine alkaline phosphatase (GE
Healthcare Europe GmbH), denatured with dimethyl sulfoxide, and
labeled with pCp-Cy3 using T4 RNA ligase (GE Healthcare Europe
GmbH). The labeled RNAs were hybridized to Agilent human miRNA
microarrays for 20 h at 55°C with rotation. After hybridization and
washing, the arrays were scanned with an Agilent micro-array
scanner using high dynamic range settings as specified by the
manufacturer. The Agilent Feature Extraction software was used to
extract the data.
Real-time fluorescent reverse
transcription-polymerase chain reaction for quantification of
miRNAs
Quantitative stem-loop real time PCR (qRT-PCR) was
carried out to detect and quantify miRNAs whose alteration was more
than 3-fold between the HCV core 3a and 1b treatment groups
according to the microarray profiling results. Primers for qRT-PCR
were synthesized by AuGCT. All used primers were listed in Table I. A cDNA synthesis was carried out
with the One Step PrimeScript® miRNA cDNA Synthesis kit
(Takara, Dalian, China) according to the manufacturer’s protocols.
A quantitative PCR was performed using SYBR® Premix Ex
Taq™ II (Takara). The miRNA expression level was quantified using
the Bio-Rad MyiQ™ Detection system (Bio-Rad, Hercules, CA, USA).
The reactions were incubated in 96-well optical plates at 95°C for
10 sec followed by 40 cycles of 5 sec at 95°C and 20 sec at 60°C.
Expression analysis was performed in triplicate for each sample.
The small nuclear RNA U5 was used as the normalization control.
 | Table IPrimer sequences used. |
Table I
Primer sequences used.
| miRNA | Forward primer
(5′→3′) | mirBase accession
no. |
|---|
|
hsa-miR-30a* |
CTTTCAGTCGGATGTTTGCAG | MIMAT0000088 |
| hsa-miR-663 |
ATTAAGGCGGGGCGCCG | MIMAT0003326 |
| hsa-miR-423-3p |
AGCTCGGTCTGAGGCCC | MIMAT0001340 |
| hsa-miR-92b |
TATTGCACTCGTCCCGGC | MIMAT0003218 |
| hsa-miR-3646 |
AAAATGAAATGAGCCCAGCC | MIMAT0018065 |
| hsa-miR-3648 |
ATATAGCCGCGGGGATCG | MIMAT0018068 |
|
hsa-miR-16-2* |
GCCAATATTACTGTGCTGCTTT | MIMAT0004518 |
|
hsa-miR-19b-1* |
AGTTTTGCAGGTTTGCATCCA | MIMAT0004491 |
| hsa-miR-224 |
GCAAGTCACTAGTGGTTCCGTT | MIMAT0000281 |
|
hsa-miR-629* |
GTTCTCCCAACGTAAGCCCAG | MIMAT0003298 |
| hsa-miR-32 |
GCTATTGCACATTACTAAGTTGC | MIMAT0000090 |
|
hsa-miR-181a-2* |
ACCACTGACCGTTGACTGTACC | MIMAT0004558 |
| hsa-miR-500a |
TAATCCTTGCTACCTGGGTGAGA | MIMAT0004773 |
| hsa-miR-542-3p |
CGTGTGACAGATTGATAACTGAAA | MIMAT0003389 |
| hsa-miR-769-5p |
TGAGACCTCTGGGTTCTGAGCT | MIMAT0003886 |
|
hsa-miR-3613-3p |
ACAAAAAAAAAAGCCCAACCC | MIMAT0017991 |
|
hsa-miR-146b-5p |
CTGAGAACTGAATTCCATAGGCT | MIMAT0002809 |
| hsa-let-7c |
GCTGAGGTAGTAGGTTGTATGGT | MIMAT0000064 |
| hsa-miR-132 |
TAACAGTCTACAGCCATGGTCG | MIMAT0000426 |
|
hsa-miR-24-1* |
GTGCCTACTGAGCTGATATCAGT | MIMAT0000079 |
| hsa-miR-455-5p |
TATGTGCCTTTGGACTACATCG | MIMAT0003150 |
|
hsa-miR-192* |
CTGCCAATTCCATAGGTCACA | MIMAT0004543 |
| hsa-miR-551b |
GCGACCCATACTTGGTTTCAG | MIMAT0003233 |
| hsa-miR-664 |
TATTCATTTATCCCCAGCCTACA | MIMAT0005949 |
| hsa-miR-885-5p |
TCCATTACACTACCCTGCCTCT | MIMAT0004947 |
| hsa-miR-95 |
TTCAACGGGTATTTATTGAGCA | MIMAT0000094 |
|
hsa-miR-34b* |
TAGGCAGTGTCATTAGCTGATTG | MIMAT0000685 |
Computational analysis of miRNA
downstream target functions and pathways
We applied different computational methods to
maximally analyze functions and pathways targeted by differentially
expressed miRNAs. Firstly, an open access platform for miRNA
database miRBase (http://www.mirbase.org) was performed to generate the
targets of significantly altered miRNAs. In this webserver, we
obtained the website links for validated and predicted targets
while entering an miRNA accession number. For validated targets,
the results from miRTarBase and TarBase were combined. For
predicted targets, the microRNA.org server, PicTar and TargetScan
was adopted and the predicted targets with mirSVR score ≤-0.1 was
adopted in the microRNA.org server (10). Only the common target gene
predicted by two different servers was listed in the final target
gene table. Thereafter, the databases of GO and PANTHER were
searched for functional annotation and pathway analysis. To exclude
these categories identified by chance alone, the enrichment
analysis was further executed using the free access program DAVID
(11), where its significance was
measured by the Fisher’s exact test.
Immunofluorescence microscopy and
dyes
Cells were fixed with 10% formaldehyde for 1 h,
permeabilized with 0.01% digitonin for 30 min, and treated with 3%
BSA before immuno labeling for HA. Images were obtained with an
Olympus fluorescence microscope. Lipid droplets (LDs) were stained
with BODIPY 493/503 (Invitrogen). Hoechst 33258 (Invitrogen) were
used to stain the cell nucleus. Contrast and brightness of
micrographs were adjusted by Adobe Photoshop CS for data
presentation.
Lipid extraction and TAG measuring
The cell monolayer was washed with ice-cold PBS and
scraped in 1 ml PBS. Lipids were extracted by the Folch method from
1-well of a 6-mutiwell dishes (12). The total lower phase was dried
down, resuspended in isopropanol, and assayed with a triglyceride
kit (InTec Products, Inc., Xiamen, China). Proteins were measured
by a kit (Bio-Rad, Hercules, CA, USA).
Annexin V/PI staining and FCM
analysis
Cells were collected for Annexin V/PI staining
according to the procedures described by BD Biosciences. In brief,
Huh-7 cells were washed twice with cold PBS and then resuspended in
1X binding buffer at a concentration of 1×10⁶ cells/ml.
Subsequently, 100 μl of the solution was transferred into a
5 ml culture tube, and 5 μl Annexin V and 2 μl PI was
added. The cells were gently mixed then incubated for 15 min at
room temperature in the dark. Finally, 400 μl of 1X binding
buffer was added to each tube, followed within 30 min by flow
cytometry (FCM) analysis.
Statistical analysis
The Mann-Whitney U test or the Student’s t-test were
used to determine statistical significance by the SPSS 12.0
software.
Results
Efficient stable expression of HCV core
proteins in Huh-7 cells
First, we obtained the cDNA fragments of encoding
HCV different genotype core proteins and then constructed HCV
genotypes 3a and 1b core recombinants. Both of the recombinants
were transfected into the Huh-7 cells and G418-resistant stable
clones were selected and expanded under G418 selecting for 10–12
days. The total-RNA and protein were extracted from the
G418-resistant clones. Different genotype core mRNA and protein
expressions were identified by real-time PCR and western blot
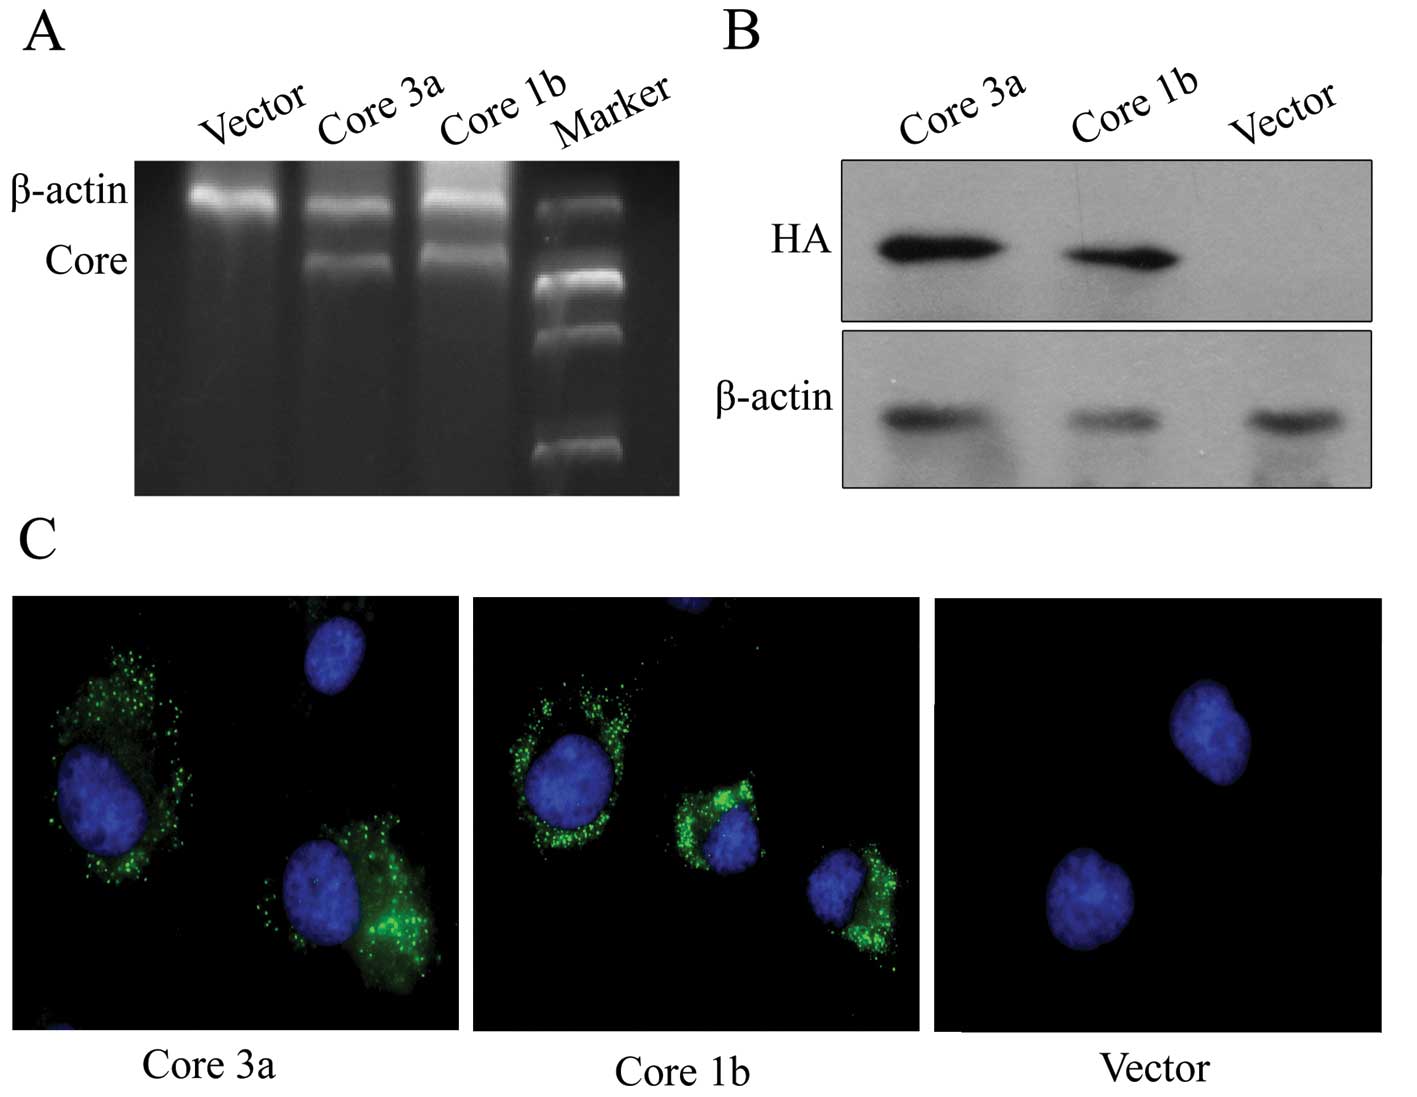
analyses. As shown in Fig. 1A and
B, the core mRNA and protein were detected in the extracts from
the Huh-7 cells transfected with HCV core 3a and 1b recombinants
respectively, but not in the extract from Huh-7 cells transfected
with a blank vector. Furthermore, HA-tagged 3a and 1b core proteins
were also detected by indirect immunofluorescence only in Huh-7
cells stably transfected by HCV core recombinant (Fig. 1C). These results suggest that
these two recombinants could express core protein effectively in
the Huh-7 cells. Thus, we established independent Huh-7 cell lines
that constitutively expressed core proteins of HCV genotypes 3a and
1b.
Identification of differential miRNA
expression between Huh-7 cells transfected with HCV core protein of
genotypes 3a and 1b
For microarray analysis, we used the commercial
Agilent human miRNA (8x60K) v16 array set to examine the miRNA
expression profiles of transfected Huh-7 cells with the HCV
genotypes 3a and 1b core protein. miRNAs showing at least a 3-fold
change in expression were considered for further investigation. In
contrast to genotype 1b, there were 8 miRNAs upregulated and 19
miRNAs downregulated in Huh-7 cells stably expressing the core of
the genotype 3a (Table II). To
confirm the microarray results, qRT-PCR was performed on the above
27 miRNAs. U5 was used as control. The primers for the miRNAs are
listed in Table I. After
statistical analysis, 5 miRNAs (miR-16-2*, miR-423-3p,
miR-30a*, miR-663 and miR-92b) and 11 miRNAs (miR-224,
miR-629*, miR-542-3p, miR-132, miR-455-5p,
hsa-miR-192*, miR-34b*, miR-95, miR-885-5p
and miR-664) were determined to be respectively upregulated and
downregulated (Table III).
| Table IIDysregulated miRNAs between Huh-7
cells transfected by HCV core 3a and 1b detected by microarray. |
Table II
Dysregulated miRNAs between Huh-7
cells transfected by HCV core 3a and 1b detected by microarray.
| miRNAs | Fold
(downregulated) | miRNAs | Fold
(upregulated) |
|---|
| hsa-miR-224 | 0.31 |
hsa-miR-30a* | 10.4 |
|
hsa-miR-629* | 0.14 | hsa-miR-663 | 8.39 |
| hsa-miR-32 | 0.13 | hsa-miR-423-3p | 3.90 |
|
hsa-miR-181a-2* | 0.13 | hsa-miR-92b | 3.82 |
| hsa-miR-500a | 0.12 | hsa-miR-3646 | 3.78 |
| hsa-miR-542-3p | 0.12 | hsa-miR-3648 | 3.74 |
| hsa-miR-769-5p | 0.10 |
hsa-miR-16-2* | 3.66 |
|
hsa-miR-3613-3p | 0.10 |
hsa-miR-19b-1* | 3.56 |
|
hsa-miR-146b-5p | 0.10 | | |
| hsa-let-7c | 0.10 | | |
| hsa-miR-132 | 0.09 | | |
|
hsa-miR-24-1* | 0.09 | | |
| hsa-miR-455-5p | 0.03 | | |
|
hsa-miR-192* | 0.02 | | |
| hsa-miR-551b | 0.02 | | |
| hsa-miR-664 | 0.02 | | |
| hsa-miR-885-5p | 0.01 | | |
| hsa-miR-95 | 0.01 | | |
|
hsa-miR-34b* | 0.01 | | |
| Table IIIDysregulated miRNAs confirmed by
real-time PCR. |
Table III
Dysregulated miRNAs confirmed by
real-time PCR.
| miRNAs | Core 3a median
(IQR) | Core 1b median
(IQR) | Fold-change | P-value |
|---|
| Upregulated | | | | |
|
hsa-miR-30a* | 0.90 (0.79,
1.01) | 0.39 (0.32,
0.44) | 2.34 | 0.004 |
|
hsa-miR-423-3p | 1.57 (1.37,
1.77) | 0.84 (0.72,
1.11) | 1.88 | 0.004 |
| hsa-miR-663 | 0.98 (0.94,
1.09) | 0.53 (0.37,
0.60) | 1.86 | 0.004 |
|
hsa-miR-16-2* | 1.53 (1.30,
1.70) | 0.84 (0.77,
0.96) | 1.83 | 0.004 |
| hsa-miR-92b | 1.04 (0.90,
1.10) | 0.61 (0.35,
0.74) | 1.72 | 0.004 |
| Downregulated | | | | |
| hsa-miR-132 | 0.94 (0.85,
1.02) | 1.46 (1.41,
1.63) | 0.65 | 0.004 |
| hsa-miR-664 | 1.00 (0.97,
1.04) | 1.59 (1.50,
1.81) | 0.63 | 0.004 |
|
hsa-miR-455-5p | 1.07 (0.71,
1.36) | 1.76 (1.63,
2.24) | 0.61 | 0.004 |
| hsa-miR-224 | 1.02 (0.96,
1.04) | 2.05 (1.59,
2.59) | 0.50 | 0.004 |
|
hsa-miR-629* | 1.13 (0.58,
1.50) | 2.26 (1.32,
3.90) | 0.50 | 0.045 |
|
hsa-miR-542-3p | 0.99 (0.93,
1.07) | 1.96 (1.52,
2.56) | 0.50 | 0.004 |
|
hsa-miR-34b* | 0.93 (0.87,
1.21) | 2.17 (1.88,
2.78) | 0.43 | 0.004 |
| hsa-miR-95 | 0.99 (0.92,
1.11) | 2.34 (2.13,
2.57) | 0.42 | 0.004 |
|
hsa-miR-192* | 0.97 (0.89,
1.15) | 2.62 (1.34,
4.57) | 0.37 | 0.006 |
|
hsa-miR-885-5p | 1.13 (0.98,
1.18) | 3.12 (2.38,
4.08) | 0.36 | 0.004 |
| hsa-miR-551b | 1.03 (0.86,
1.15) | 3.57 (3.00,
3.93) | 0.29 | 0.004 |
miRNA target genes and their pathways
predicted by computer-aided algorithms
The analysis of miRNA target genes and pathways were
based on the data from the qRT-PCR result. We first generated a
list of all validated target genes to those dysregulated miRNAs (5
miRNAs upregulated and 11 miRNAs downregulated) from an open access
platform for the miRNA database miRBase. The result showed a total
of 29 and 188 target genes, respectively. Then, a list of all
predicted target genes to those dysregulated miRNAs, including 714
and 1160 genes respectively, was also generated by analyzing the
targets from three miRNA target prediction web servers TargetScan,
PicTar and the microRNA.org server. Thereafter, a functional
annotation and over-representation analysis of the GO biological
process (GO BP) terms for those genes were performed using the
DAVID program. In this study, a complete list of GO BP terms
contained 451 and 495 categories for upregulated and downregulated
miRNAs. Table IV lists the top 15
categories of those upregulated and downregulated miRNAs. They
mainly include regulation of cellular metabolic processes,
regulation of cellular biosynthetic processes, and regulation of
gene expression. A similar approach was applied to the enrichment
analysis of PANTHER pathway for those genes. A total of 4 and 13
pathways (Table V) were enriched
for upregulated and down-regulated miRNAs with 3 overlaps,
including TGF-β signaling pathway, p53 pathway and integrin
signaling pathway.
| Table IVTop 15 categories of upregulated and
downregulated miRNAs. |
Table IV
Top 15 categories of upregulated and
downregulated miRNAs.
| Term | Count (%) | P-value |
|---|
| Upregulated | | |
| Regulation of
macromolecule metabolic process | 218 (31.0) | 5.9E-17 |
| Regulation of
metabolic process | 234 (33.2) | 2.3E-16 |
| Regulation of
primary metabolic process | 218 (31.0) | 4.1E-16 |
| Regulation of
cellular metabolic process | 224 (31.8) | 1.7E-15 |
| Regulation of
biosynthetic process | 198 (28.1) | 1.0E-14 |
| Regulation of
cellular biosynthetic process | 197 (28.0) | 1.1E-14 |
| Regulation of
gene expression | 192 (27.3) | 1.7E-14 |
| Regulation of
macromolecule biosynthetic process | 189 (26.8) | 6.0E-14 |
| Regulation of
nitrogen compound metabolic process | 187 (26.6) | 3.4E-13 |
| Regulation of
nucleobase, nucleoside, nucleotide and nucleic acid metabolic
process | 185 (26.3) | 5.9E-13 |
| Regulation of
transcription | 172 (16.9) | 3.9E-12 |
| Biological
regulation | 378 (53.7) | 3.1E-11 |
| Regulation of
cellular process | 351 (49.9) | 5.4E-11 |
| Regulation of
biological process | 362 (51.4) | 6.5E-11 |
|
Transcription | 143 (20.3) | 8.1E-11 |
| Downregulated | | |
| Regulation of
metabolic process | 386 (29.8) | 4.0E-18 |
| Regulation of
cellular metabolic process | 373 (28.8) | 4.1E-18 |
| Regulation of
primary metabolic process | 352 (27.2) | 4.2E-16 |
| Regulation of
cellular biosynthetic process | 323 (24.9) | 4.5E-16 |
| Regulation of
macromolecule metabolic process | 349 (26.9) | 5.8E-16 |
| Regulation of
biosynthetic process | 323 (24.9) | 1.4E-15 |
| Regulation of
macromolecule biosynthetic process | 311 (24.0) | 1.8E-15 |
| Regulation of
gene expression | 312 (24.1) | 3.5E-15 |
| Regulation of
nitrogen compound metabolic process | 307 (23.7) | 2.7E-14 |
| Cellular
process | 870 (67.2) | 3.5E-14 |
| Regulation of
nucleobase, nucleoside, nucleotide and nucleic acid metabolic
process | 304 (23.5) | 4.4E-14 |
| Multicellular
organismal development | 306 (23.6) | 1.6E-13 |
| Anatomical
structure development | 276 (21.3) | 3.3E-13 |
| Development
process | 327 (25.3) | 6.5E-13 |
| Nervous system
development | 143 (11.0) | 3.1E-12 |
| Table VPANTHER pathways of upregulated and
downregulated miRNAs. |
Table V
PANTHER pathways of upregulated and
downregulated miRNAs.
| Term | Count (%) | P-value |
|---|
| Upregulated | | |
| P00052: TGF-β signaling
pathway | 17 (2.4) | 5.8E-3 |
| P00059: p53 pathway | 14 (2.0) | 9.5E-3 |
| P00034: integrin signaling
pathway | 20 (2.8) | 2.0E-2 |
| P00037:
ionotropic glutamate receptor pathway | 8 (1.1) | 2.6E-2 |
| Downregulated | | |
| P00005:
angiogenesis | 37 (2.9) | 5.2E-4 |
| P00052: TGF-β signaling
pathway | 25 (1.9) | 7.1E-3 |
| P00048: PI3
kinase pathway | 19 (1.5) | 1.9E-2 |
| P04398: p53
pathway feedback loops 2 | 12 (0.9) | 2.7E-2 |
| P00059: p53 pathway | 19 (1.5) | 2.8E-2 |
| P05916: opioid
prodynorphin pathway | 8 (0.6) | 3.0E-2 |
| P00033:
insulin/IGF pathway-protein kinase B signaling cascade | 15 (1.2) | 3.2E-2 |
| P00036:
interleukin signaling pathway | 29 (0.7) | 3.5E-2 |
| P00016:
cytoskeletal regulation by Rho GTPase | 17 (1.3) | 4.5E-2 |
| P00040:
metabotropic glutamate receptor group II pathway | 10 (0.8) | 5.0E-2 |
| P00032:
insulin/IGF pathway-mitogen activated protein kinase kinase/MAP
kinase cascade | 9 (0.7) | 6.8E-2 |
| P00034: integrin signaling
pathway | 28 (2.2) | 7.9E-2 |
| P05917: opioid
proopiomelanocortin pathway | 7 (0.5) | 9.3E-2 |
Confirmation of the functions regulated
by HCV core protein and related miRNAs
By GO and PANTHER analyses, dysregulated miRNAs
between cells expressing HCV genotype 3a and 1b core are mainly
cellular metabolism and apoptosis associated. Several trials were
carried out to confirm the functions regulated by HCV core proteins
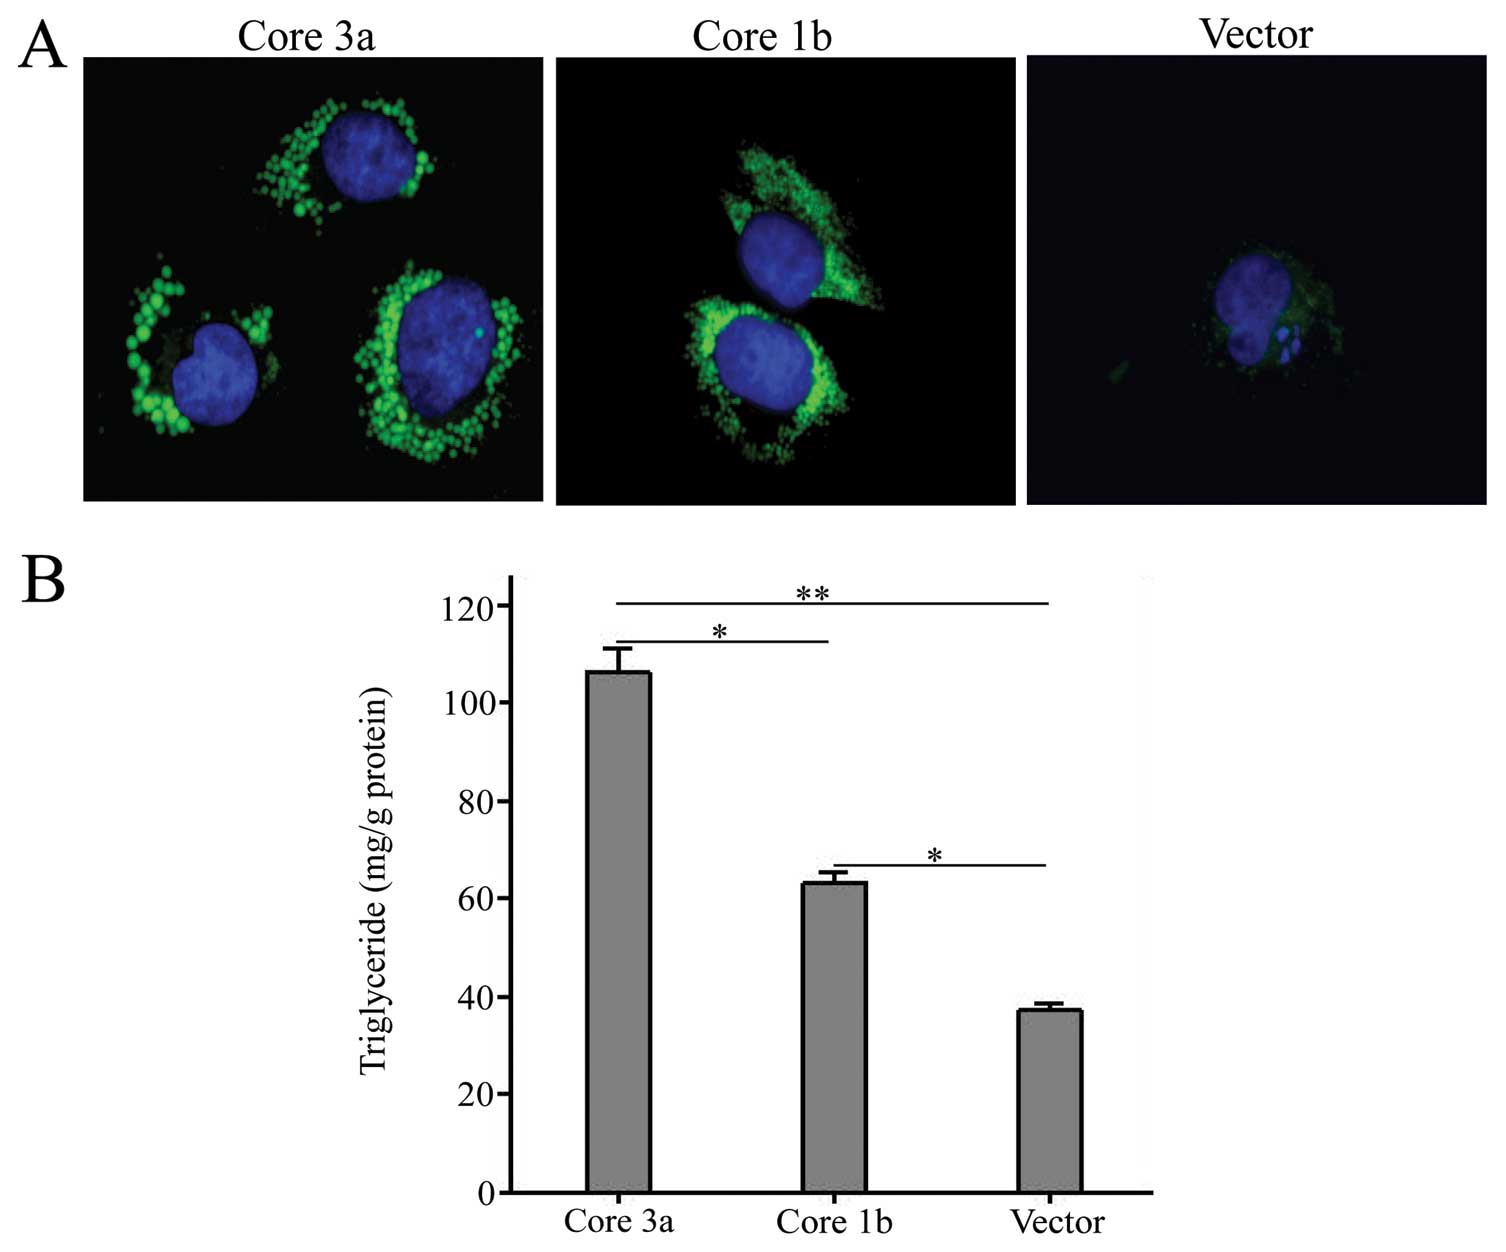
and related miRNAs. Firstly, cellular lipid storage was detected by
LDs staining and TAG measuring. As shown in Fig. 2A, the number and size of lipid
droplets were increased in cells transfected with HCV core
recombinants and cells transfected with genotype 3a had more and
larger lipid droplets than those transfected with genotype 1b.
Furthermore, TAG measurement was performed. As shown in Fig. 2B, TAG was gradually increased from
blank vector to HCV genotype 1b and 3a groups (TAG content, vector,
55.9±1.7; HCV 1b, 94.5±3.6; HCV 3a, 159.5±7.3 μg/mg
protein).
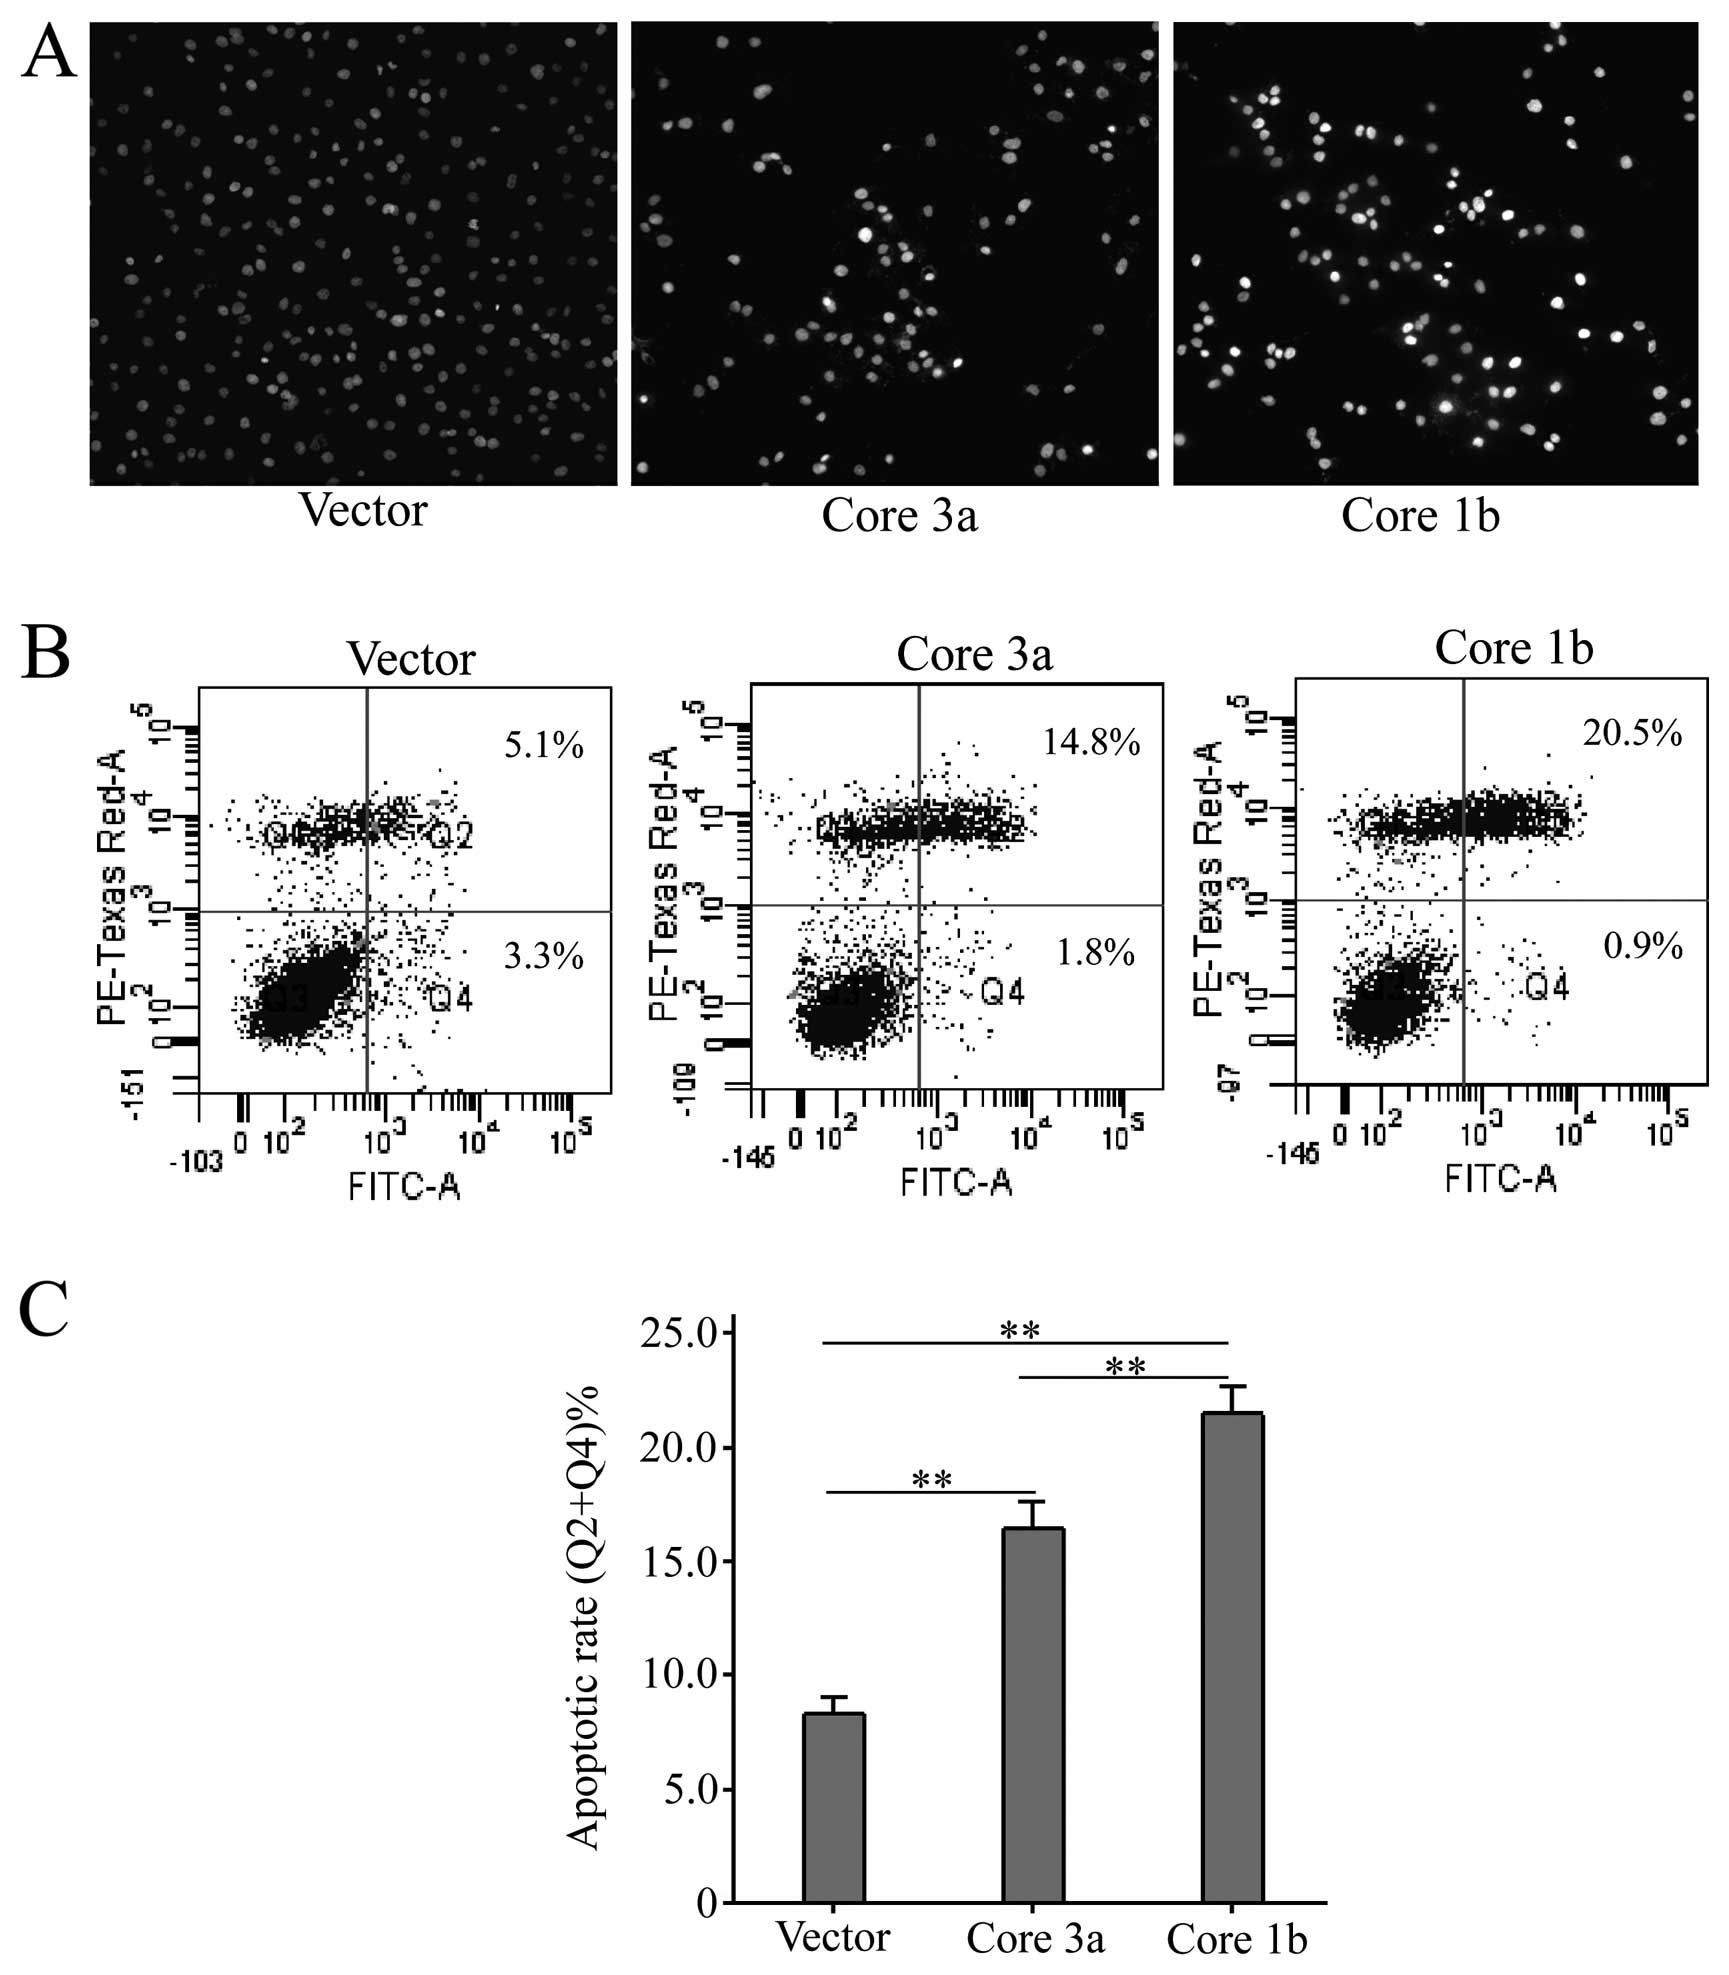
Afterwards, cellular apoptosis was assessed by
Hoechst 33258 staining and FCM assays. According to the Hoechst
33258 staining of cell nuclei, the percentage of apoptotic cells of
the core 1b group was greater than that in the core 3a group, and
the lowest in the blank vector group (Fig. 3A). To determine the apoptotic rate
of cells accurately, quantitative analysis of apoptosis by FCM of
AV/PI dual staining was performed. As shown in Fig. 3B and C, among the blank vector and
HCV 3a and 1b groups, the apoptotic rate of cells was gradually
increased (apoptotic rate, vector, 8.30±0.36%; HCV 3a, 16.43±0.57%;
HCV 1b, 21.47±0.60%). So, HCV core 3a and 1b could affect cellular
lipid metabolism and apoptosis differently in Huh-7 cells.
Discussion
Hepatitis C is a world wide contagious liver disease
caused by HCV. HCV infection sometimes results in an acute
symptomatic illness. However, more than 80% of patients develop a
lifelong chronic condition that can lead to steatosis, cirrhosis of
the liver and liver cancer (13).
In addition, standard anti-virus therapy with interferon and
ribavirin has resulted in suboptimal responses (14). Thus, it is necessary to study the
molecular mechanism of the action of HCV in liver diseases for
finding new drug targets. Recently, miRNAs have been demonstrated
to play important roles in many physiopathological processes,
including HCV infection and hepatitis C. For instance, miR-122 is
highly expressed in the liver and plays important roles in
cholesterol metabolism, hepatocellular carcinoma and HCV
replication (15). IFN-induced
miRNAs miR-196 and miR-448 directly target HCV genomic RNA for
inhibition of viral replication (16). Thus, it is promising to find
additional miRNAs related to HCV infection.
This study was undertaken in order to investigate
the effect of HCV core proteins of the two different genotypes 3a
and 1b on the miRNA expression profile of Huh-7 cells. Only 7
articles about the relationship between the miRNA expressing
profile and HCV infection were retrieved from PubMed and most of
the studies have been carried out with genotype 1. HCV is divided
into 6 genotypes according to the gene diversity of structure
proteins and the clinical and pathogenic data vary among different
genotypes. Genotype 1 and 3 are characterized by distinct levels of
response to therapy (17,18), severity of liver steatosis
(3), insulin resistance (19) and risk of developing cirrhosis and
hepatocellular carcinoma (20).
Therefore, we were interested in investigating the miRNA expression
profiles between genotypes 3a and 1b.
By microarray and real-time PCR assays, a total of
16 miRNAs were determined to be dysregulated (5 miRNAs upregulated
and 11 miRNAs downregulated) in Huh-7 cells expressing genotype 3a
vs. 1b. Some of these dysregulated miRNAs have been reported to be
functional in several pivotal biological processes. miR-423-3p,
miR-92b and miR-663 promote cell growth by regulating the G1/S
transition (21–23). miR-542-3p, miR-885-5p and
miR-192* inhibit cell proliferation and induce cell
apoptosis (24–26). miR-224, miR-34b* and
miR-95 are associated with the genesis and development of diverse
tumors (27–29). miR-192 mediates TGF-β/Smad3 driven
renal fibrosis. miR-30 is a key regulator of human adipogenesis
(30). The literature indicates
that the dysregulated miRNAs have potential functions in steatosis,
cirrhosis and liver cancer which are represent the differences in
the pathobiology of genotype 3a and 1b. Meanwhile, this simple
model of overexpression of core proteins in cell lines is effective
in studying the biological function of HCV core protein.
It is known that a miRNA can reduce the levels of
many of its target transcripts and function in multiple processes
(31). In order to explore the
novel functions of the dysregulated miRNAs, their target genes were
generated from the miRNA database platform miRBase and then
functional categories and biological pathways were analyzed using
the free access program DAVID. 704 target genes of 5 upregulated
miRNAs and 1298 target genes of 11 downregulated miRNAs were
finally determined. By GO analysis, the function categories of both
the upregulated and downregulated miRNAs mainly include regulation
of cellular metabolic process, biosynthetic process, gene
expression and cellular process. Among them, we were interested in
the regulation of the cellular metabolic process. As reported, HCV
core could play a role in virus-induced steatosis and genotype 3a
has stronger effect of lipid droplets induction and FAS activation
than genotype 1b (32,33). In this study, we also found some
target genes participating in the processes of neutral lipid
metabolism and lipid transport. For instance, ACSL1 (target of
miR-16-2*), ACSL4 (target of miR-224), and ACSL6 (target
of miR-664) are essential for de novo lipid synthesis and
fatty acid catabolism (34).
HMGCR (target of miR-224) catalyzes a rate-limiting step in sterol
and isoprenoid biosynthesis (35). FBXW7 (target of miR-92b), INSIG1
(target of miR-92b), and CAV1 (target of miR-34b* and
miR-30a*) also play key roles in regulating lipid
metabolism and lipid homeostasis in the liver (36–38). ABCA1 (target of miR-885-5p), ABCC1
(target of miR-34b*), and FABP2 (target of miR-132) are
tightly associated with the transport of neutral lipid or fatty
acids (39,40). CREBBP (target of
miR-30a*), RXRA (target of miR-664) and SIRT1 (target of
miR-132) are important transcription factors associated with liver
lipid metabolism (41,42). Furthermore, we confirmed the
difference of core and consequent miRNAs on the effect of lipid
storage by carrying out lipid droplets staining and TAG measuring
experiments. As shown in Fig. 2,
cores of genotype 3a and 1b could induce lipid storage in Huh-7
cells and genotype 3a had a stronger effect, which are consistent
with previous studies (9).
As shown in Table
V, a total of 13 pathways were identified by PANTHER pathway
analysis. In the 3 overlapped pathways, both TGF-β and the p53
pathways are cell growth and apoptosis-associated (43). Additionally, the p53 pathway
feedback loops 2, the PI3 kinase pathway (44) and insulin/IGF pathway (45) regulated by downregulated miRNAs,
are also related to cell growth, malignant transformation and
apoptosis. Therefore, we performed Hoechst 33258 staining and FCM
assays to evaluate the cellular apoptosis. Our results showed that
core genotypes 3a and 1b could induce apopotosis in Huh-7 cells and
genotype 1b had a stronger effect. Until now, the data regarding
the role of the HCV core is controversial and has pro- and
anti-apoptotic dual effects in death ligand-mediated hepatocyte
(46). Admittedly, our
experiments about core and apoptosis are short of depth. In any
case, HCV core could play important roles in cell growth and
apoptosis and some meaningful miRNAs discovered in this study could
have some effects.
In conclusion, this study has identified several
miRNAs dysregulated by the core proteins of two different HCV
geno-types 3a and 1b, generated possible targets of these miRNAs
and explored potential downstream GO categories and PANTHER
pathways. The results suggest that these miRNAs could function in
cellular metabolism and apoptosis, which has been confirmed by some
preliminarily assays. However, the pathophysiologic function of an
individual miRNA is unclear and more experiments need to be
performed in the future. Finally, these miRNAs will contribute to
the understanding of the molecular mechanism of liver diseases
caused by HCV infection and the search of possible drug
targets.
Acknowledgements
We thank members in Qing Li’s
Laboratory in the Fourth Military Medical University for technical
assistance. This study was supported by grants (81000171 and
81170798) from the National Natural Science Foundation of
China.
References
|
1.
|
S KhaliqS JahanA PervaizSequence
variability of HCV core region: important predictors of HCV induced
pathogenesis and viral productionInfect Genet
Evol11543556201110.1016/j.meegid.2011.01.01721292033
|
|
2.
|
M ArreseA RiquelmeA SozaInsulin
resistance, hepatic steatosis and hepatitis C: a complex
relationship with relevant clinical implicationsAnn HepatolSuppl
9S112S118201020714007
|
|
3.
|
M RipoliV PazienzaImpact of HCV genetic
differences on pathobiology of diseaseExpert Rev Anti Infect
Ther9747759201110.1586/eri.11.9421905784
|
|
4.
|
V PazienzaS ClementP PugnaleGene
expression profile of Huh-7 cells expressing hepatitis C virus
genotype 1b or 3a core proteinsLiver
Int29661669200910.1111/j.1478-3231.2008.01866.x18803589
|
|
5.
|
L WuJG BelascoLet me count the ways:
mechanisms of gene regulation by miRNAs and siRNAsMol
Cell2917200810.1016/j.molcel.2007.12.01018206964
|
|
6.
|
X PengY LiKA WaltersComputational
identification of hepatitis C virus associated microRNA-mRNA
regulatory modules in human liversBMC
Genomics10373200910.1186/1471-2164-10-37319671175
|
|
7.
|
NM SteuerwaldJC ParsonsK BennettTC BatesHL
BonkovskyParallel microRNA and mRNA expression profiling of
(genotype 1b) human hepatoma cells expressing hepatitis C
virusLiver Int3014901504201010.1111/j.1478-3231.2010.02321.x
|
|
8.
|
CL JoplingM YiAM LancasterSM LemonP
SarnowModulation of hepatitis C virus RNA abundance by a
liver-specific
microRNAScience30915771581200510.1126/science.111332916141076
|
|
9.
|
K AbidV PazienzaA de GottardiAn in vitro
model of hepatitis C virus genotype 3a-associated triglycerides
accumulationJ
Hepatol42744751200510.1016/j.jhep.2004.12.03415826725
|
|
10.
|
X JinYP ChenM KongL ZhengYD YangYM
LiTransition from hepatic steatosis to steatohepatitis: unique
microRNA patterns and potential downstream functions and pathwaysJ
Gastroenterol
Hepatol27331340201110.1111/j.1440-1746.2011.06864.x21793903
|
|
11.
|
W Huang daBT ShermanQ TanDAVID
Bioinformatics Resources: expanded annotation database and novel
algorithms to better extract biology from large gene listsNucleic
Acids Res35W169W175200717576678
|
|
12.
|
J FolchM LeesGH Sloane StanleyA simple
method for the isolation and purification of total lipides from
animal tissuesJ Biol Chem226497509195713428781
|
|
13.
|
JH HoofnagleHepatitis C: the clinical
spectrum of diseaseHepatology26Suppl
1S15S20199710.1002/hep.510260703
|
|
14.
|
OM KlibanovSH WilliamsLS SmithJL OlinSB
VickeryTelaprevir: a novel NS3/4 protease inhibitor for the
treatment of hepatitis
CPharmacotherapy31951974201110.1592/phco.31.10.95121950642
|
|
15.
|
C JoplingLiver-specific microRNA-122:
Biogenesis and functionRNA
Biol9137142201210.4161/rna.1882722258222
|
|
16.
|
IM PedersenG ChengS WielandInterferon
modulation of cellular microRNAs as an antiviral
mechanismNature449919922200710.1038/nature0620517943132
|
|
17.
|
MW FriedM ShiffmanRK SterlingA
multicenter, randomized trial of daily high-dose interferon-alfa 2b
for the treatment of chronic hepatitis c: pretreatment
stratification by viral burden and genotypeAm J
Gastroenterol9532253229200010.1111/j.1572-0241.2000.03433.x11095346
|
|
18.
|
S ChevaliezT AsselahMechanisms of
non-response to antiviral treatment in chronic hepatitis CClin Res
Hepatol Gastroenterol35Suppl
1S31S41201110.1016/S2210-7401(11)70005-521742299
|
|
19.
|
C CammaS BrunoV Di MarcoInsulin resistance
is associated with steatosis in nondiabetic patients with genotype
1 chronic hepatitis
CHepatology436471200610.1002/hep.2098316374856
|
|
20.
|
S BrunoA CrosignaniP MaisonneuveS RossiE
SiliniMU MondelliHepatitis C virus genotype 1b as a major risk
factor associated with hepatocellular carcinoma in patients with
cirrhosis: a seventeen-year prospective cohort
studyHepatology4613501356200717680653
|
|
21.
|
J LinS HuangS WuMicroRNA-423 promotes cell
growth and regulates G(1)/S transition by targeting p21Cip1/Waf1 in
hepatocellular
carcinomaCarcinogenesis3216411647201110.1093/carcin/bgr19921890460
|
|
22.
|
S SenguptaJ NieRJ WagnerC YangR StewartJA
ThomsonMicroRNA 92b controls the G1/S checkpoint gene p57 in human
embryonic stem cellsStem
Cells2715241528200910.1002/stem.8419544458
|
|
23.
|
C YiQ WangL WangmiR-663, a microRNA
targeting p21(WAF1/CIP1), promotes the proliferation and
tumorigenesis of nasopharyngeal carcinomaOncogeneJan162012(Epub
ahead of print)
|
|
24.
|
S YoonYC ChoiS LeeY JeongJ YoonK
BaekInduction of growth arrest by miR-542-3p that targets
survivinFEBS
Lett58440484052201010.1016/j.febslet.2010.08.02520728447
|
|
25.
|
EA AfanasyevaP MestdaghC KumpsMicroRNA
miR-885-5p targets CDK2 and MCM5, activates p53 and inhibits
proliferation and survivalCell Death
Differ18974984201110.1038/cdd.2010.16421233845
|
|
26.
|
S FengS CongX ZhangMicroRNA-192 targeting
retinoblastoma 1 inhibits cell proliferation and induces cell
apoptosis in lung cancer cellsNucleic Acids
Res3966696678201110.1093/nar/gkr23221511813
|
|
27.
|
Y WangCG LeeRole of miR-224 in
hepatocellular carcinoma: a tool for possible therapeutic
intervention?Epigenomics3235243201110.2217/epi.11.522122284
|
|
28.
|
YM LeeJY LeeCC HoMicroRNA 34b as a tumor
suppressor in estrogen-dependent growth of breast cancer
cellsBreast Cancer Res13R116201110.1186/bcr305922113133
|
|
29.
|
Z HuangS HuangQ WangMicroRNA-95 promotes
cell proliferation and targets sorting Nexin 1 in human colorectal
carcinomaCancer
Res7125822589201110.1158/0008-5472.CAN-10-303221427358
|
|
30.
|
LE ZaragosiB WdziekonskiKL BrigandSmall
RNA sequencing reveals miR-642a-3p as a novel adipocyte-specific
microRNA and miR-30 as a key regulator of human adipogenesisGenome
Biol12R64201110.1186/gb-2011-12-7-r6421767385
|
|
31.
|
LP LimNC LauP Garrett-EngeleMicroarray
analysis shows that some microRNAs downregulate large numbers of
target mRNAsNature433769773200510.1038/nature0331515685193
|
|
32.
|
A PiodiP ChouteauH LeratC HezodeJM
PawlotskyMorphological changes in intracellular lipid droplets
induced by different hepatitis C virus genotype core sequences and
relationship with
steatosisHepatology481627200810.1002/hep.22288
|
|
33.
|
C Jackel-CramLA BabiukQ LiuUp-regulation
of fatty acid synthase promoter by hepatitis C virus core protein:
genotype-3a core has a stronger effect than genotype-1b coreJ
Hepatol469991008200710.1016/j.jhep.2006.10.01917188392
|
|
34.
|
E SoupeneFA KuypersMammalian long-chain
acyl-CoA synthetasesExp Biol Med
(Maywood)233507521200810.3181/0710-MR-28718375835
|
|
35.
|
JS BurgPJ EspenshadeRegulation of HMG-CoA
reductase in mammals and yeastProg Lipid
Res50403410201110.1016/j.plipres.2011.07.00221801748
|
|
36.
|
I OnoyamaA SuzukiA MatsumotoFbxw7
regulates lipid metabolism and cell fate decisions in the mouse
liverJ Clin Invest121342354201010.1172/JCI4072521123947
|
|
37.
|
CJ LoewenTP LevineCholesterol homeostasis:
not until the SCAP lady INSIGsCurr
Biol12R779R781200210.1016/S0960-9822(02)01292-712445404
|
|
38.
|
S MartinRG PartonCaveolin, cholesterol,
and lipid bodiesSemin Cell Dev
Biol16163174200510.1016/j.semcdb.2005.01.00715797827
|
|
39.
|
K KlappeI HummelD HoekstraJW KokLipid
dependence of ABC transporter localization and functionChem Phys
Lipids1615764200910.1016/j.chemphyslip.2009.07.00419651114
|
|
40.
|
LB AgellonL DrozdowskiL LiLoss of
intestinal fatty acid binding protein increases the susceptibility
of male mice to high fat diet-induced fatty liverBiochim Biophys
Acta177112831288200710.1016/j.bbalip.2007.08.00417905650
|
|
41.
|
E SchmittMA BallouMN CorreaEJ DePetersJK
DrackleyJJ LoorDietary lipid during the transition period to
manipulate subcutaneous adipose tissue peroxisome
proliferator-activated receptor-gamma co-regulator and target gene
expressionJ Dairy Sci9459135925201110.3168/jds.2011-4230
|
|
42.
|
Y ColakO OzturkE SenatesSIRT1 as a
potential therapeutic target for treatment of nonalcoholic fatty
liver diseaseMed Sci Monit17HY59201110.12659/MSM.88174921525818
|
|
43.
|
E GlasgowL MishraTransforming growth
factor-beta signaling and ubiquitinators in cancerEndocr Relat
Cancer155972200810.1677/ERC-07-016818310276
|
|
44.
|
SS ThorgeirssonT TeramotoVM
FactorDysregulation of apoptosis in hepatocellular carcinomaSemin
Liver Dis18115122199810.1055/s-2007-10071489606809
|
|
45.
|
K BreuhahnP SchirmacherReactivation of the
insulin-like growth factor-II signaling pathway in human
hepatocellular carcinomaWorld J
Gastroenterol1416901698200810.3748/wjg.14.169018350600
|
|
46.
|
S JahanUA AshfaqS KhaliqB SamreenN
AfzalDual behavior of HCV core gene in regulation of apoptosis is
important in progression of HCCInfect Genet
Evol12236239201210.1016/j.meegid.2012.01.00622266242
|