Introduction
Cell-derived extracellular vesicles (EVs) contribute
to intercellular communication by transferring proteins, bioactive
lipids and nucleic acids (1,2).
EVs include exosomes released from multivesicular bodies and
microvesicles shed from the cell surface. Both vesicle types
contain membrane and cytoplasmic constituents of the cells of
origin (3). In particular, EVs
released from stem cells have been shown to transfer, following
receptor-mediated incorporation, into target cells, mRNAs and
miRNAs (4–8). Several studies have indicated that
the regenerative potential of stem cell-based therapy is related to
paracrine/endocrine mechanisms (9–11).
EVs play a critical role in transferring regenerative signals from
stem cells to the injured tissues (12–14).
Acute kidney injury (AKI) involves the rapid loss of
kidney function consequent to a number of causes, which represents
one of the main causes of morbidity and mortality in hospitalized
patients. Moreover, AKI frequently evolves into chronic renal
dysfunction (15). Bone
marrow-derived mesenchymal stem cells (MSCs) have been found to
improve recovery following AKI induced by toxic agents and
ischemia/reperfusion injury (16–18). The observation that
MSC-conditioned medium mimics the effect of cell treatment in AKI
has suggested a role of MSC-derived factors in coordinating the
repair process (11).
Previously, we found that EVs derived from human
MSCs accelerated recovery following AKI in SCID mice in a manner
comparable to the cells (13,19,20). Moreover, EVs, following
incorporation into renal tubular epithelial cells, have been shown
to transfer specific mRNA subsets and trigger a regenerative
program (13).
To evaluate whether MSC-derived EVs may represent a
potential therapeutic tool for AKI, it is essential to investigate
in vivo their biodistribution and recruitment within the
injured kidneys. Optical imaging (OI) offers the potential for a
non-invasive study of different targets within the body of living
animals. Recently, the OI technique has been improved with the
possibility of visualizing a few labeled cells in vivo by
using new dyes (21–24). Good candidate dyes to maximize the
depth of tissue penetration and reduce the background are
near-infrared (NIR) fluorophores (700–900 nm); the absorption
coefficient of tissue is very low and light possesses a high
potential for penetration (25–27).
The aim of this study was to use OI as a technique
to visualize in vivo the biodistribution and localization of
EVs derived from MSCs in AKI within 24 h post-injection (glycerol).
For this purpose, we compared two different labeling procedures,
one based on direct EV labeling (DL-EV), and the other on the
production of labeled EVs by donor cells pre-treated with the dye
(LCD-EV).
Materials and methods
EV isolation
The MSCs were supplied by Lonza (Lonza, Basel,
Switzerland) and cultured in the presence of MSC basal medium
(MSCBM; Lonza). MSC-derived EVs were collected from the supernatant
of MSCs cultured overnight in RPMI-1640 (Lonza) supplemented with
0.5% of BSA (Sigma-Aldrich, St. Louis, MO, USA). The cell
supernatant was centrifuged twice at 3,000 × g for 20 min to remove
cell debris and then ultracentrifuged at 100,000 × g (Beckman
Coulter Optima L-90K ultracentrifuge; Beckman Coulter, Brea, CA,
USA) for 1 h at 4ºC. EVs were stored in serum-free RPMI-1640
supplement with 1% DMSO at −80ºC. EV protein content was quantified
by the Bradford method (Bio-Rad, Hercules, CA, USA).
Labeling procedure
Two labeling protocols were used: i) Cells were
stained in suspension and incubated with 5 μM Vybrant Cell Tracers
DiD [excitation (Ex), 640 nm; emission (Em), 700 nm] or DiI (Ex,
530 nm; Em, 580 nm) (Molecular Probes, Eugene, OR, USA) solution
without serum for 20 min at 37ºC. Cells were then washed in
complete medium by centrifugation and cultivated for 24 h prior to
supernatant collection. i) EVs were isolated by ultracentrifugation
as previously described (LCD-EVs) (4,13).
ii) EVs were directly labeled with 1 μM Vybrant Cell Tracers DiI or
DiD during the ultracentrifugation procedure (DL-EVs) and then
washed twice by ultracentrifugation in 1X phosphate-buffered saline
(PBS) (28).
EV characterization
EVs labeled with the two methods were characterized
by cytofluorimetric analysis using FITC- or PE-conjugated antibody
against CD44, CD105, CD90 and α5-integrin. FITC or PE mouse
non-immune isotypic IgG (Miltenyi Biotec, Bergisch Gladbach,
Germany) were used as the controls. Briefly, EVs (10 μg) were
incubated for 15 min at 4ºC with antibodies in 100 μl and then
diluted in 300 μl and immediately acquired. FACS analysis was
performed using a guava easyCyte Flow Cytometer (Millipore,
Billerica, MA, USA) and analyzed with InCyte software, as
previously described (29,30).
The size distribution of the LCD-EVs and DL-EVs was
analyzed using a NanoSight LM10 instrument (NanoSight Ltd.,
Amesbury, UK) equipped with the nanoparticle tracking analyses
(NTA) 2.0 analytic software.
In vitro uptake of EVs by human renal
tubular epithelial cells
Human renal proximal tubular epitheial cells (PTECs)
were labeled following the manufacturer’s instructions with the
CFSE green dye (Vybrant CFDA SE Cell Tracer kit; Molecular Probes).
Cells were incubated for 5 h at 37ºC with 50 μg/ml DL-EVs or
LCD-EVs and after washing the cells were fixed in 3.5%
paraformaldehyde containing 2% sucrose. Confocal microscopy
analysis was performed using a Zeiss LSM 5 Pascal model confocal
microscope (Carl Zeiss, Oberkochen, Germany). Hoechst 33258 dye
(Sigma-Aldrich) was added for nuclear staining.
Mouse model of AKI
Studies were conducted in accordance with the
national guidelines and regulations and were approved by the Ethics
Committee of the University of Torino. Male CD1 nude mice (6–8
weeks old) (Charles River Laboratories, Lyon, France), were fed for
1 week with a special diet (AIN 79; Mucedola, Settimo Milanese,
Italy) to reduce tissue autofluorescence. AKI was induced, as
previously described (16), by an
intramuscular injection of glycerol (7 ml/kg body weight of 50%
glycerol solution) into the inferior hind limbs. At 3 days
post-injury, the mice were injected intravenously (i.v.) with 200
μg of DiD-labeled EVs. Sixteen nude mice with AKI were treated with
LCD-EVs and were sacrificed after 5 h (n=9) and 24 h (n=7). Eleven
nude mice with AKI were treated with DL-EVs and were sacrificed
after 5 h (n=6) and 24 h (n=5). The same amount of LCD- and DL-EVs
was i.v. injected in 12 and 6 healthy mice, respectively. The
animals were sacrificed after 5 h (LCD-EV, n=6; DL-EV, n=3) and 24
h (LCD-EV, n=6; DL-EV, n=3).
In vitro OI
In vitro experiments were performed using the
IVIS 200 small animal imaging system (PerkinElmer, Waltham, MA,
USA) using the Ex filter at 640 nm and the Em filter at 700 nm.
Background fluorescence was measured and subtracted by setting up a
background measurement (Ex filter, 530 nm). EV samples were placed
in a non-fluorescent black container and the fluorescence intensity
of increasing concentrations of LCD-EVs and DL-EVs (15, 30, 50 and
100 μg) in the same volume was evaluated. Image analysis involved
the designation of regions-of-interest (ROI) as the circular area
of the well containing the EV concentrations to obtain the average
intensity ± standard deviation (SD), as previously described
(31).
In vivo OI
In vivo fluorescence imaging was performed
with the same wavelength as described for in vitro
acquisition. Identical illumination settings, such as exposure time
(2 sec), binning factor (factor of 4), f/stop (set to 2) and 12
fields of view, were used for acquiring all images, and
fluorescence Em was normalized to photons per second per centimeter
squared per steradian (p/sec/cm2/sr). The color image
represents the spatial distribution of fluorescence within the
animal overlaid on black and white photographs of the mice,
collected at the same time. Images were acquired and analyzed using
Living Image 4.0 software (PerkinElmer), as previously described
(32).
The mice were anesthetized with 2.5% isoflurane
(Merial, Lyon, France) and images were acquired in the prone and
supine position after 15 min, 5 and 24 h post-EV injection. The
mice with AKI and the healthy mice treated with PBS were used as
blank controls for the fluorescence signal of EVs in the AKI and
healthy groups, respectively. The fluorescence signal was
quantified in the kidney region and in the abdominal area, in ROI
draw freehand. The relative mean fluorescence intensity of each ROI
was obtained by subtracting the mean fluorescence intensity of the
corresponding ROI on the blank mouse from the measured mean
fluorescent intensity, as previously described (22,33). Data were expressed as the average
radiance ± SD.
At the end of the experiments (5 or 24 h post-EV
injection), the mice were sacrificed and dissected tissues
(kidneys, spleen, liver and lungs) were imaged immediately. The
mean fluorescence of each tissue sample was obtained by subtracting
the fluorescence intensity of corresponding tissue from the blank
mouse, as previously described (33).
Immunofluorescence
Mice were sacrificed at 5 and 24 h and confocal
microscopy analysis (Leica TSC SP5 II) was performed on frozen
sections for localization of DiD-labeled EVs in the kidneys.
Hoechst 33258 dye (Sigma-Aldrich) was added for nuclear staining.
Images were analyzed using ImageJ software.
Statistical analysis
The results are generally expressed as the means ±
SD. Statistical analysis was performed by ANOVA with Dunnet’s
multi-comparison test or the Newman-Keuls multi-comparison
or by the Student’s t-test where appropriate. A p-value of <0.05
was considered to indicate a statistically significant
difference.
Results
In vitro OI of labeled EVs
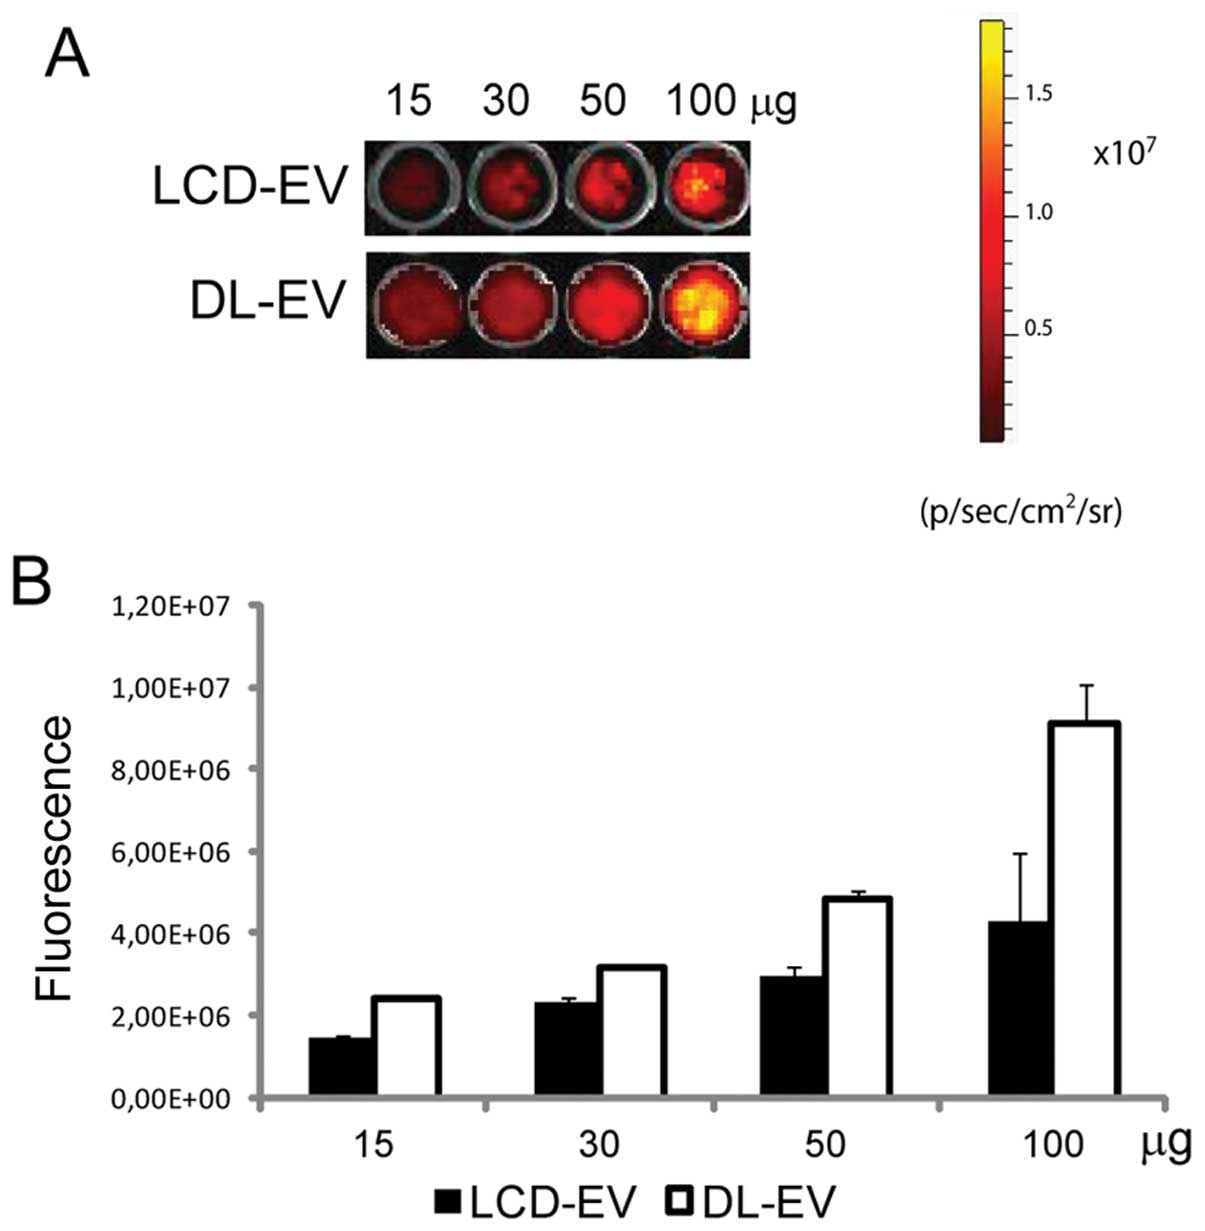
The OI of EVs obtained with the two following
methods was compared: i) DL-EVs were labeled with DiD after their
production and purification; ii) LCD-EVs were obtained by the
supernatant of MSCs previously labeled with DiD and then cultured
for 24 h prior to EV collection. OI images were acquired after EV
dilution, ranging from 15 to 100 μg of EV proteins, in 100 μl of
PBS and the average intensity within the entire circle area of each
well was calculated. The fluorescence signal correlated linearly
with the EV concentration for both labeling methods. DL-EVs were
brighter compared with LCD-EVs (Fig.
1).
In vitro characterization of fluorescent
EVs and incorporation into renal epithelial tubular cells
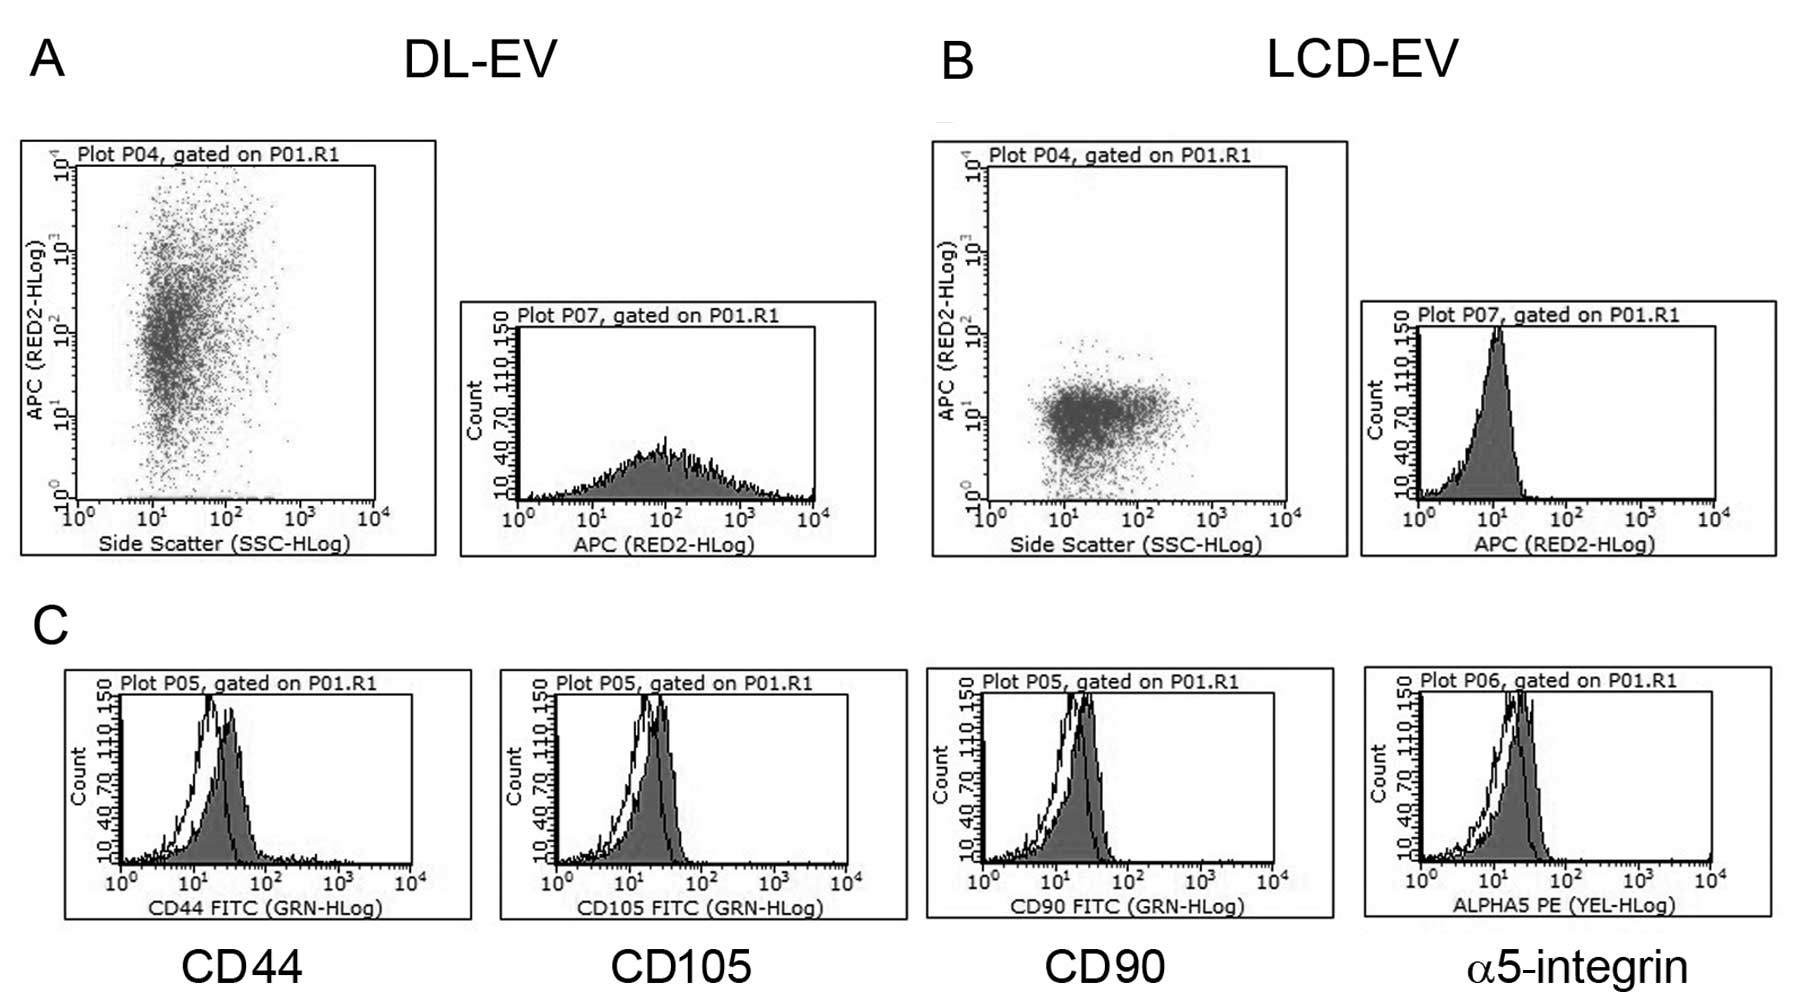
EVs labeled with two methods showed the same
phenotype as unlabeled EVs. Cytofluorimetric analyses showed their
fluorescent signal in the NIR region (Fig. 2A and B) and the presence of
several antigens typically expressed by MSCs and by their EVs
(13), such as CD44, CD105, CD90
and α5-integrin (Fig. 2C).
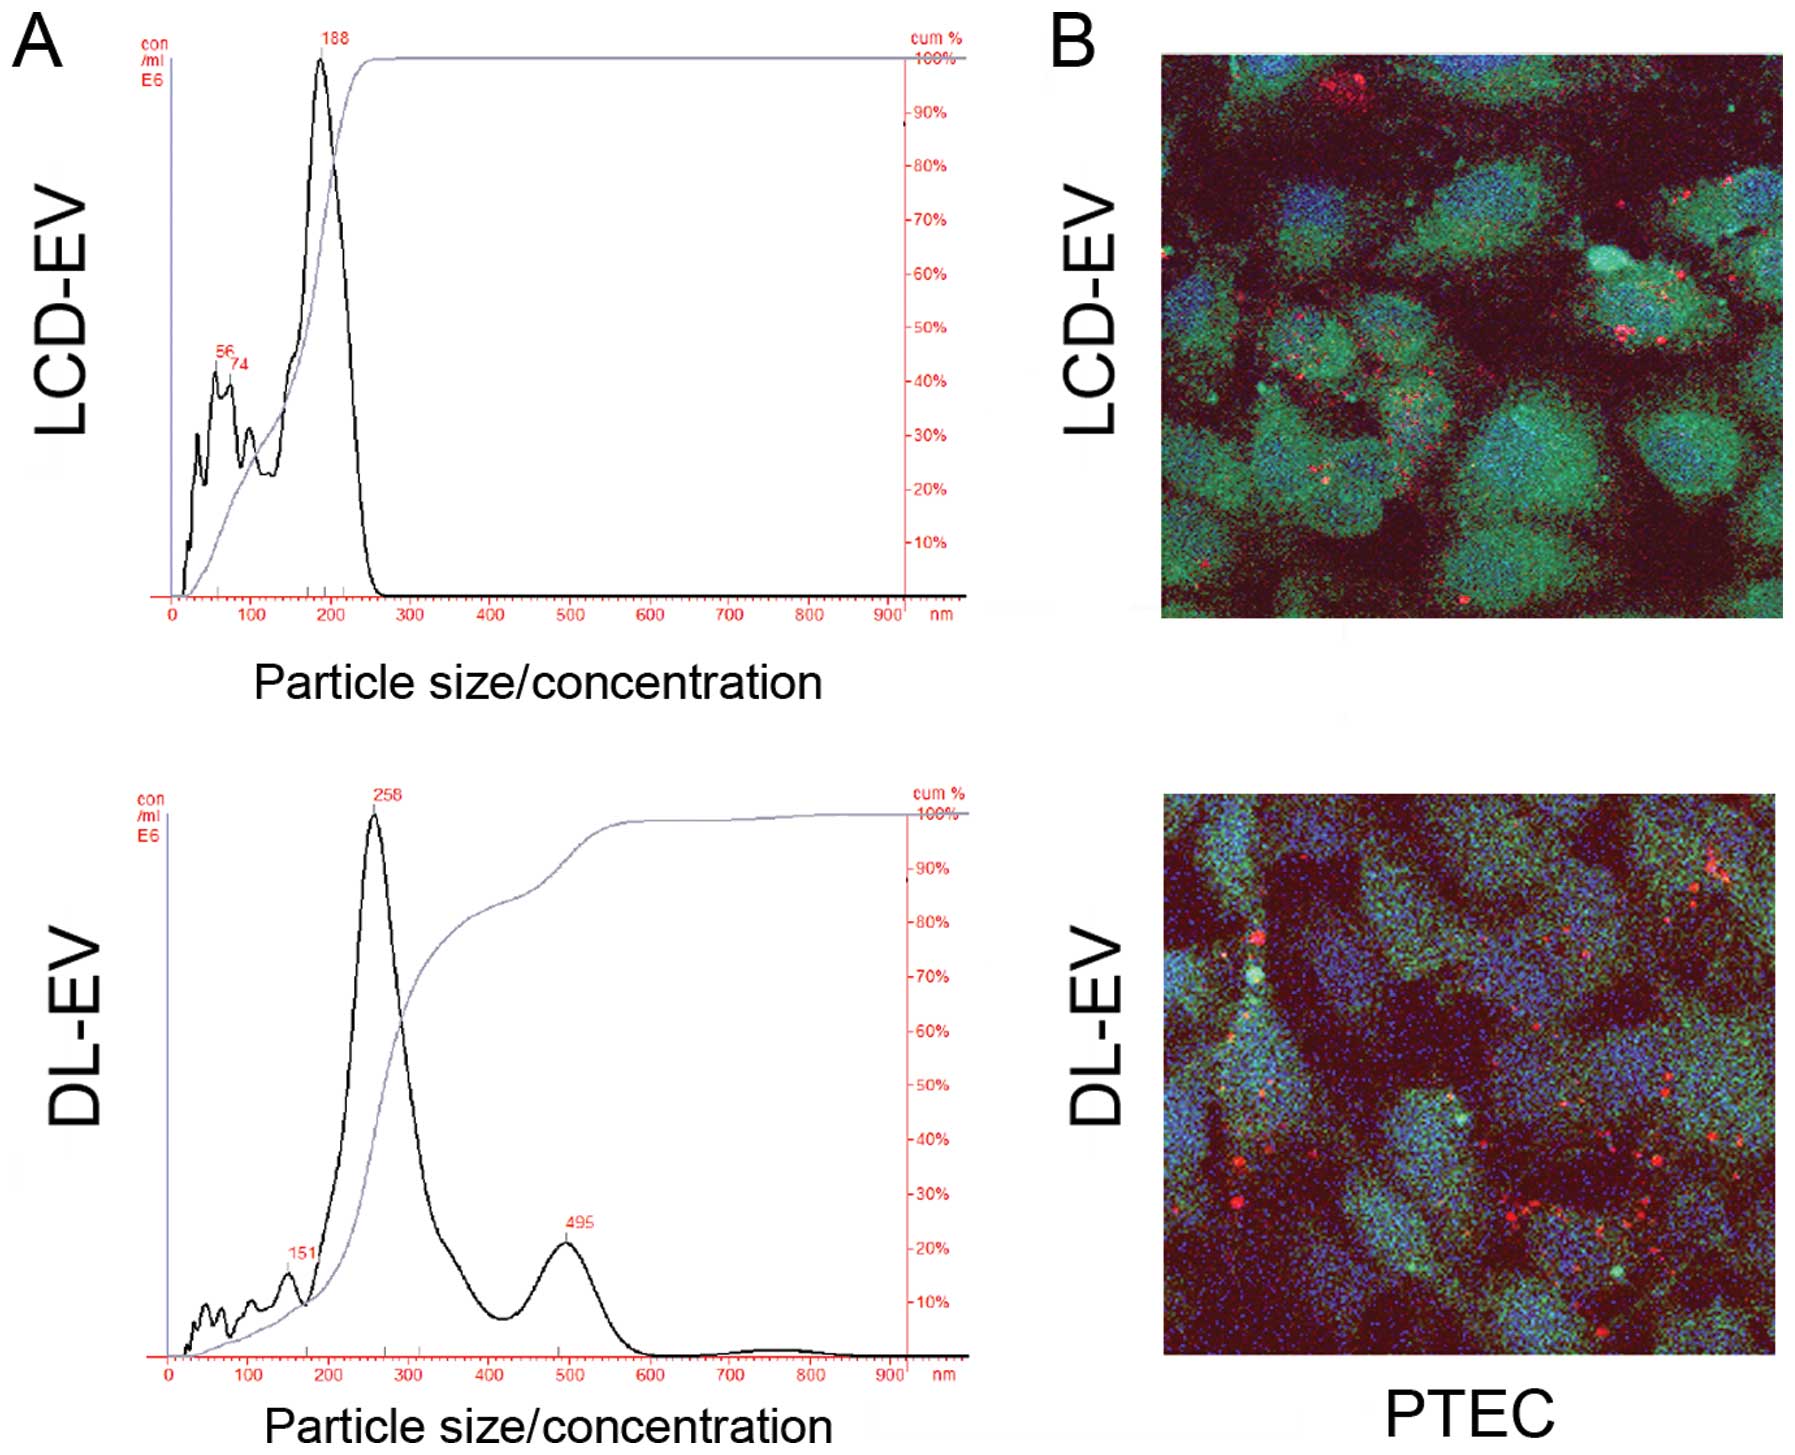
Regarding size distribution analyzed with NanoSight, LCD-EVs showed
a size range of 180±73 nm not significantly different from the size
distribution of unlabeled EVs (145±57 nm). DL-EVs showed a size of
250±89 nm with a second peak of larger size probably due to some
aggregations occurring during the labeling procedure (Fig. 3A).
To evaluate the ability of labeled EVs to be
incorporated by PTECs, 50 μg/ml of EVs labeled with the red dye,
DiI, following the same procedure described above, were added to
the cells. DL-EVs and LCD-EVs were equally incorporated within
PTECs, as observed by confocal microscopy after 5 h of incubation
(Fig. 3B).
In vivo non-invasive OI visualization of
EV biodistribution in AKI
The ability of labeled EVs to be visualized by OI on
the whole body of live mice was assessed using an IVIS 200 system
in a model of AKI induced by an intramuscular glycerol injection,
as previously described (13).
Three days after the glycerol injection, blood urea nitrogen
(131±16 mg/dl) and creatinine (0.9±0.2 mg/dl) levels were
significantly increased compared with the healthy controls (28±10
and 0.2±0.1 mg/dl, respectively) and were associated with diffuse
tubular epithelial injury, characterized by tubular hyaline casts,
vacuolization and widespread necrosis of the proximal and distal
tubular epithelium, loss of brush border and denudation of the
basal membrane (data not shown). The 200 μg of DL-EVs or LCD-EVs
was inoculated i.v. 3 days following the induction of AKI, when
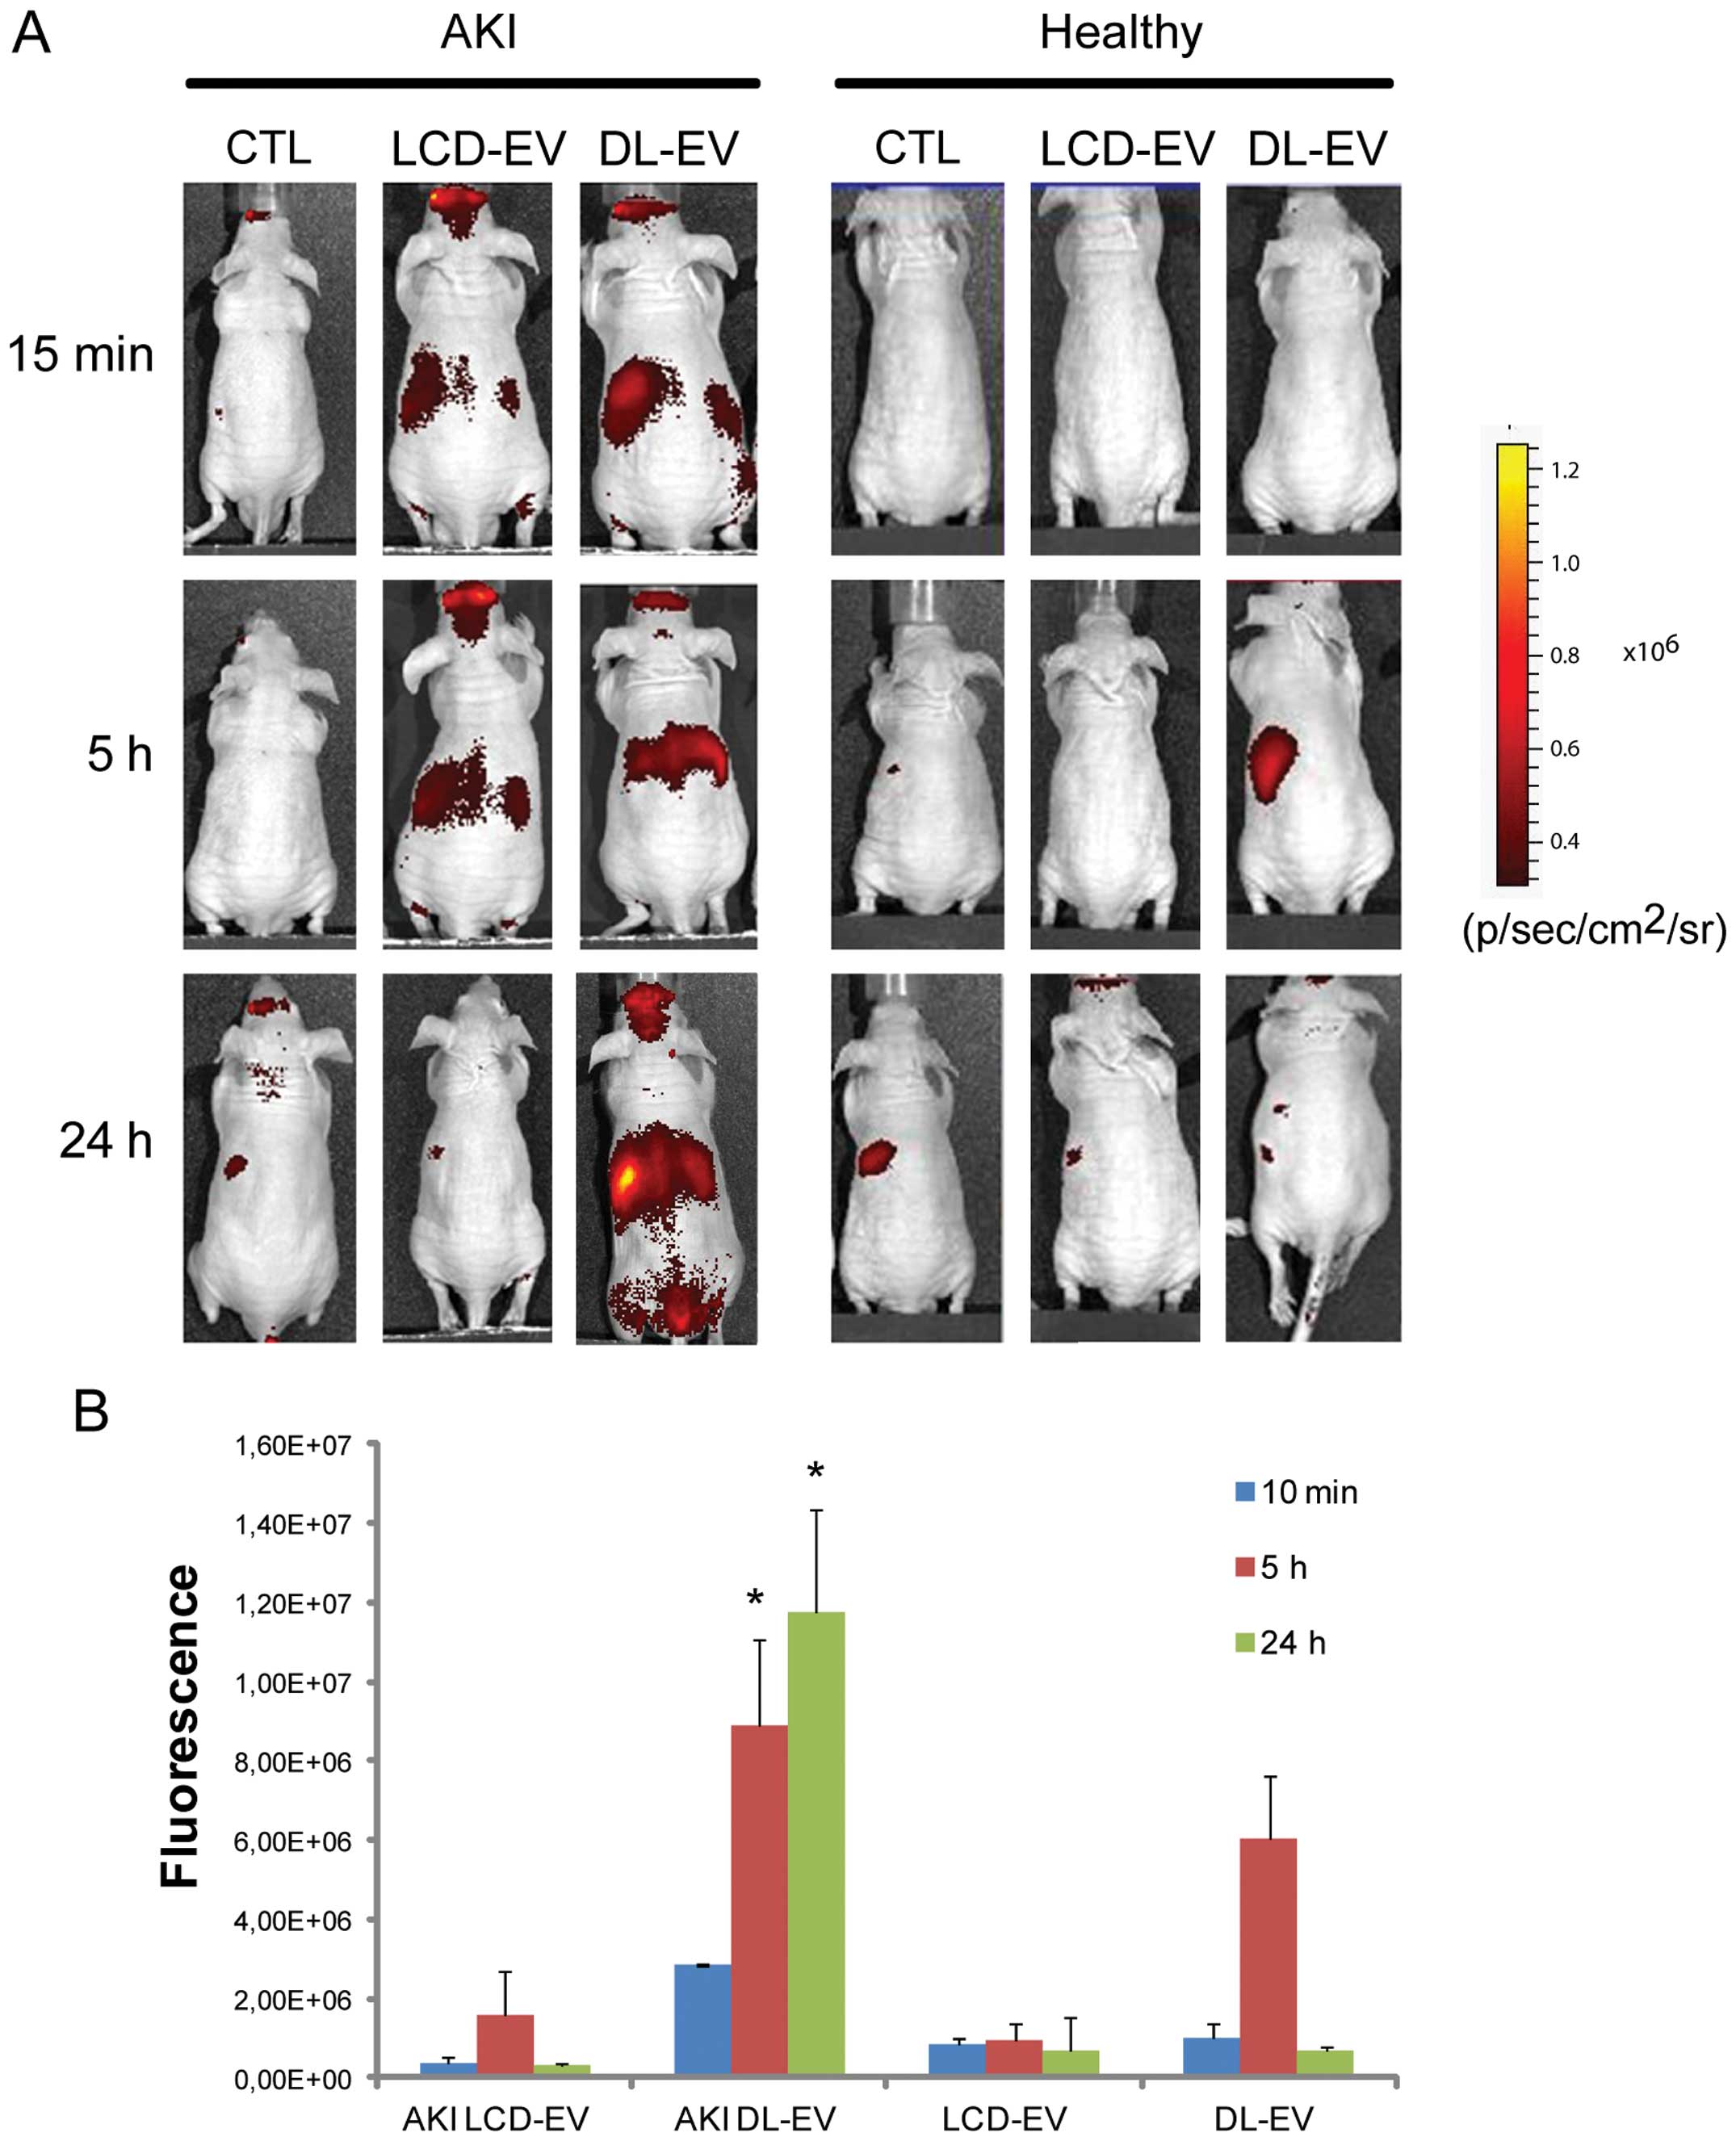
functional and morphological damage had reached its peak (13). Healthy mice were treated with the
same amount of EVs in order to evaluate whether the accumulation of
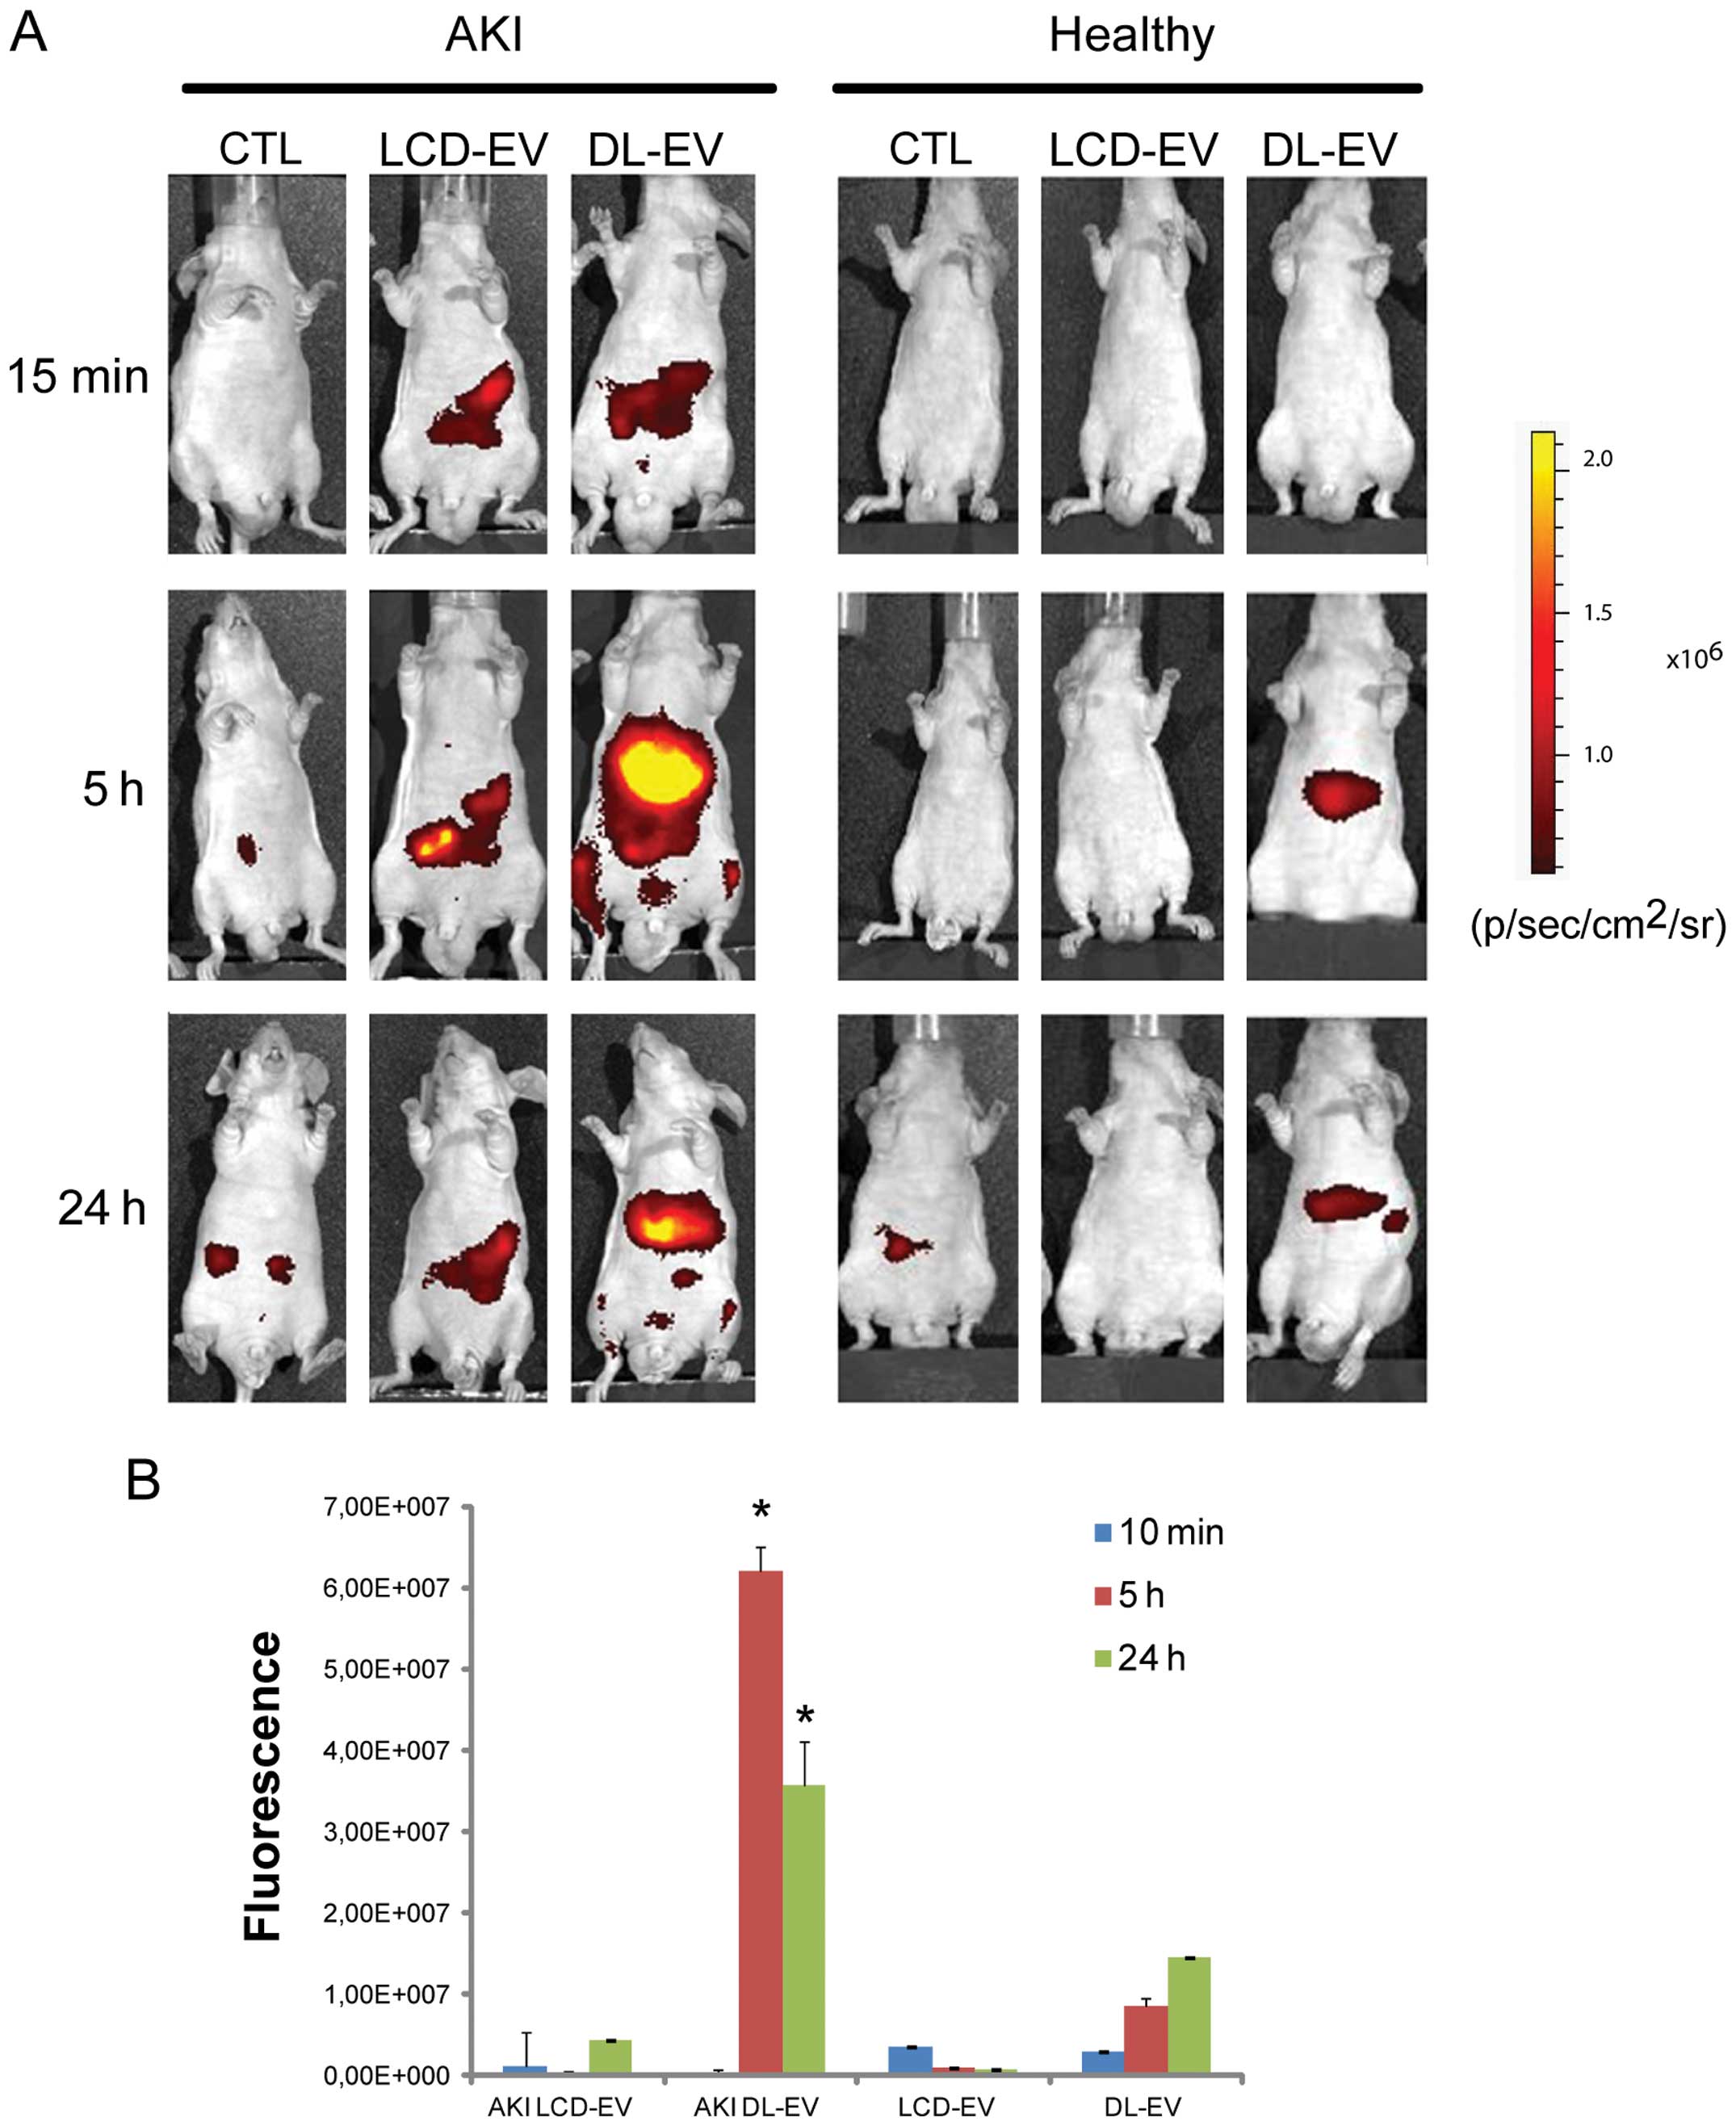
EVs was specific for the site of injury. Fig. 4 shows a fluorescent signal in the
region of kidneys of AKI mice treated with LCD-EVs and DL-EVs and
analyzed posterior after 15 min and 5 h. However, the intensity of
fluorescence in the DL-EV-treated mice with AKI was still present
at 24 h after the i.v. injection and was significantly higher than
the fluorescence signal generated by the kidneys of mice with AKI
injected with LCD-EVs. In the healthy mice, we observed a
fluorescent signal only in the mice treated with DL-EVs after 5 h
in the left dorsal region that may correspond to spleen
accumulation; however, the signal decreased rapidly and 24 h after
the i.v. injection was not detectable (Fig. 4). Analyzing the signal in the
abdominal area, a higher fluorescence intensity was observed in the
AKI groups compared with the healthy groups. Nevertheless, the
DL-EV-treated mice with AKI displayed a major increase in
fluorescence intensity in comparison with the LCD-EV-treated AKI
group, possibly due to the accumulation of EVs in the liver and
spleen (Fig. 5).
Ex vivo OI analysis of dissected
organs
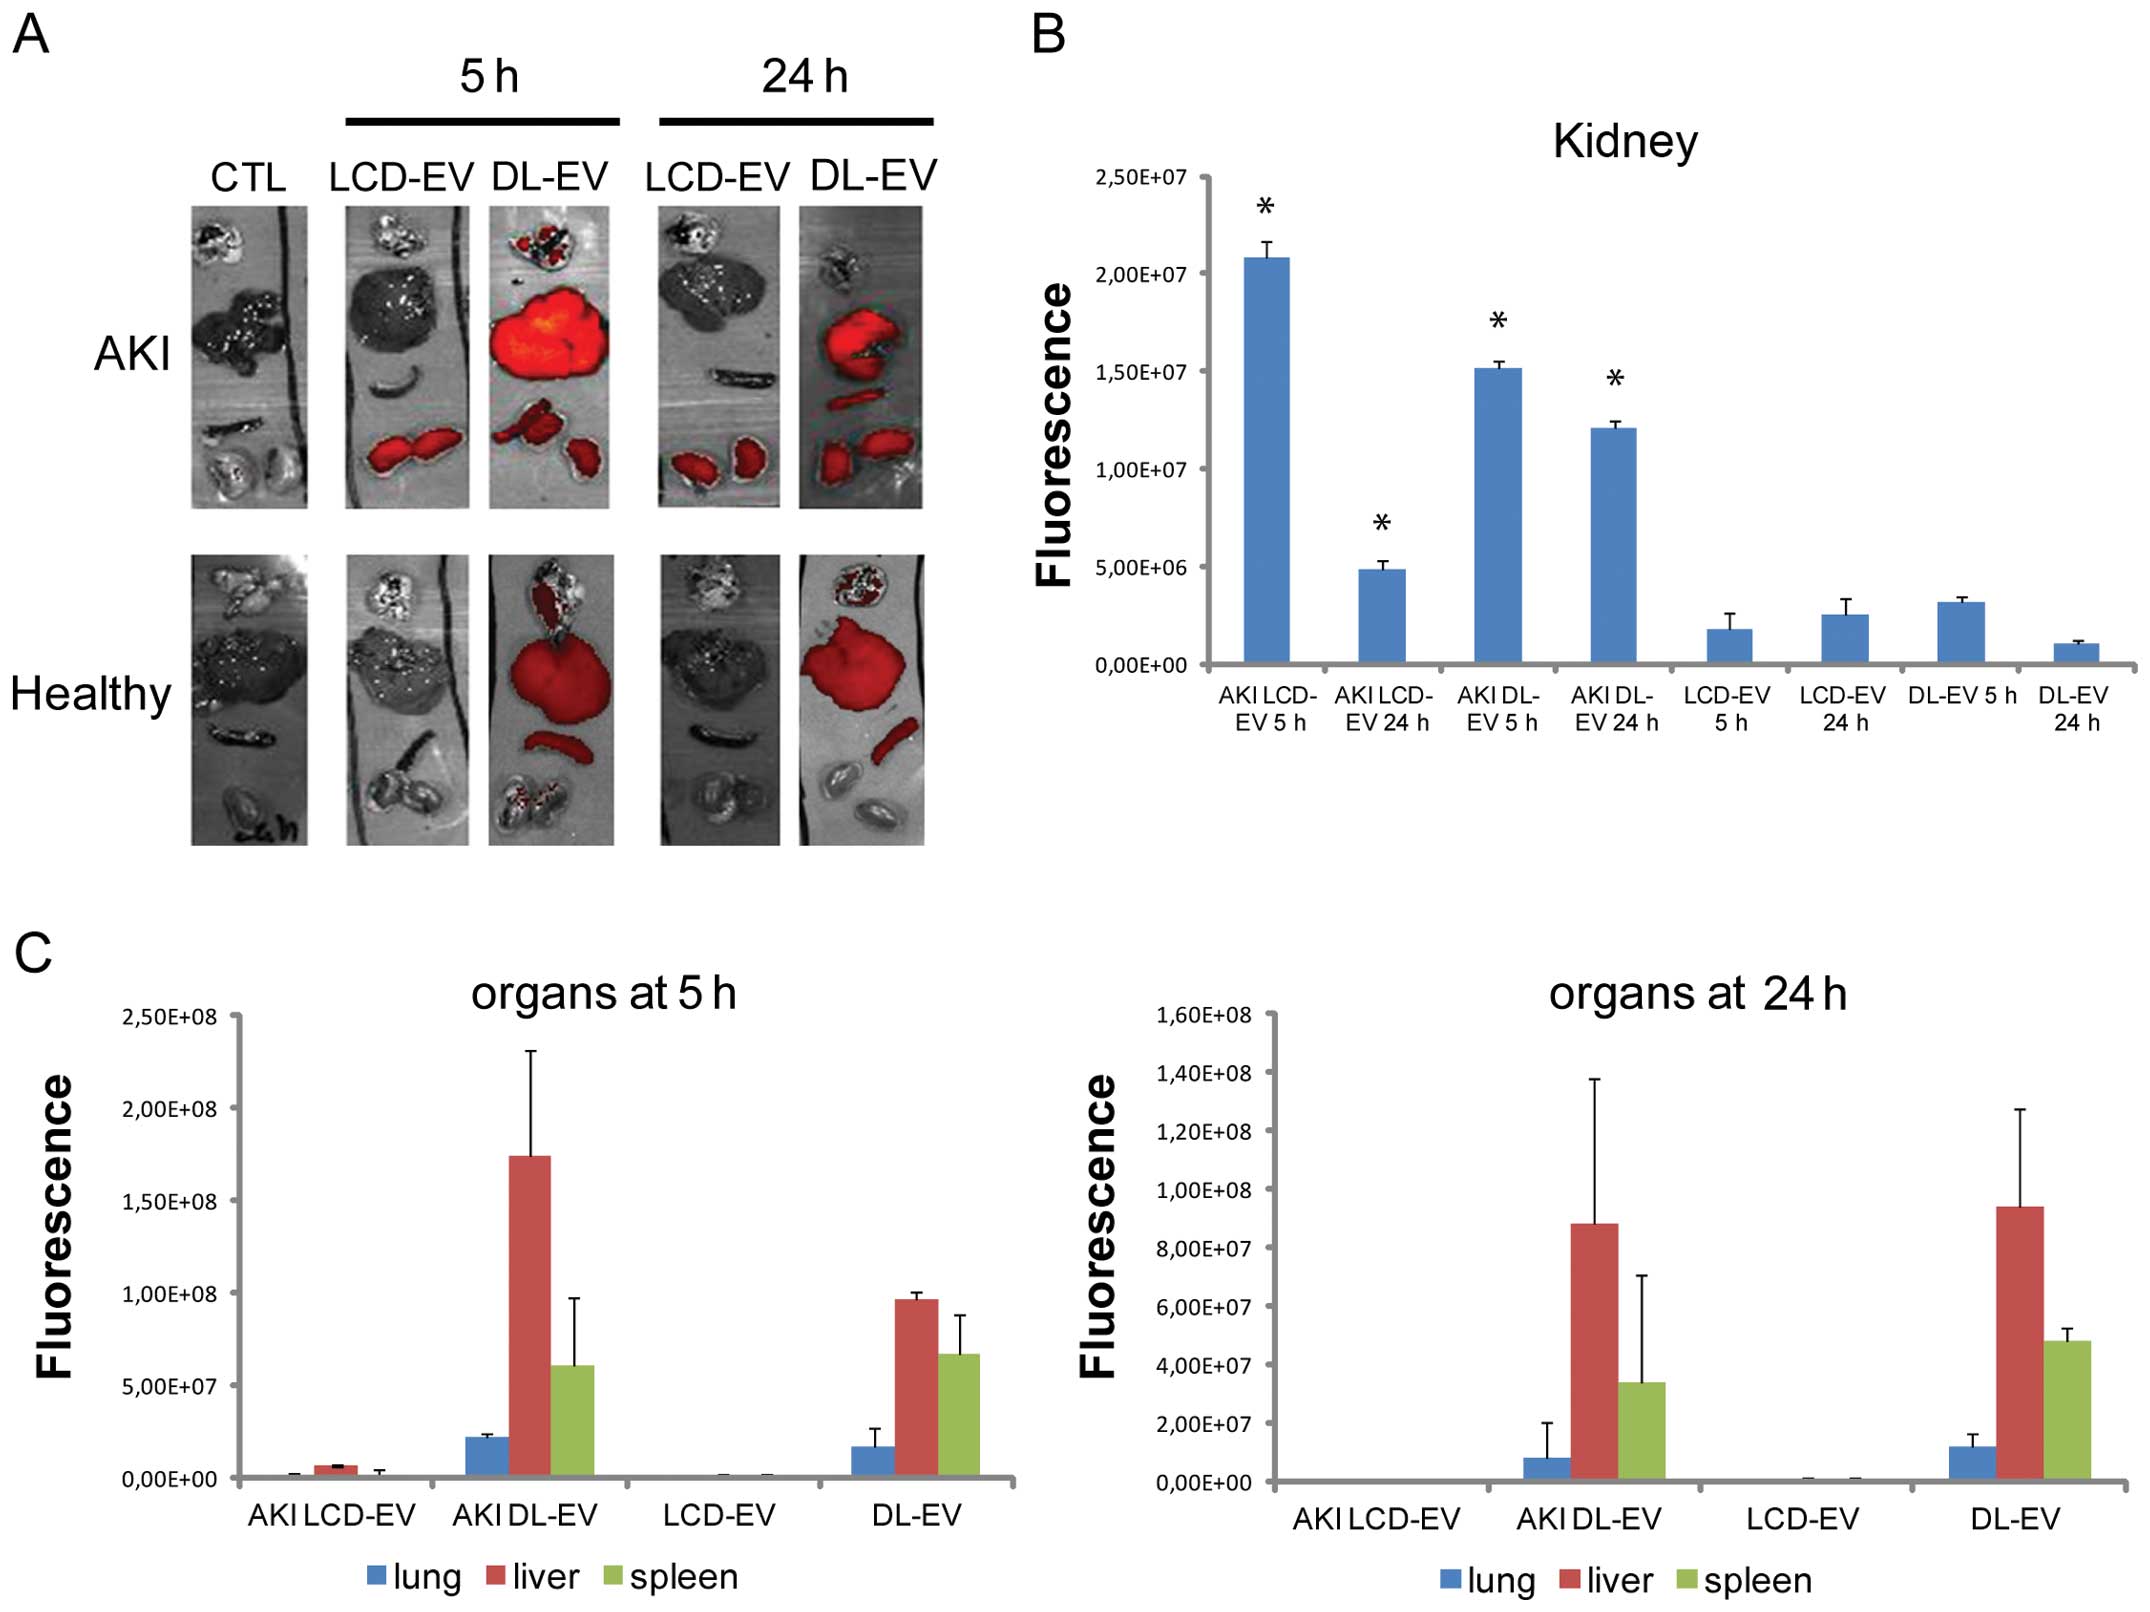
For each experimental group, the mice were
sacrificed at 5 and 24 h after the EV injection and the fluorescent
signal from freshly dissected tissues was quantified immediately by
OI. The fluorescence intensity of the kidneys of mice with AKI
treated with LCD-EVs and DL-EVs was significantly higher after 5 h
compared with the kidneys of mice with AKI treated with PBS [AKI
CTL (control)], as shown in Fig
6. Nevertheless, the increase in fluorescence was significantly
maintained for 24 h following treatment in the DL-EV group, whereas
it decreased in the LCD-EV group (Fig. 6A). No signal was detected in the
kidneys of healthy mice treated with LCD-EVs and DL-EVs, suggesting
a specific accumulation of EVs at the site of injury.
The fluorescence signal of DL-EVs was also detected
in the spleen and particularly in the liver with high variability.
The fluorescence signal of DL-EVs was of low intensity in the lungs
of both the AKI and healthy groups. LCD-EVs were detectable only in
the injured kidneys.
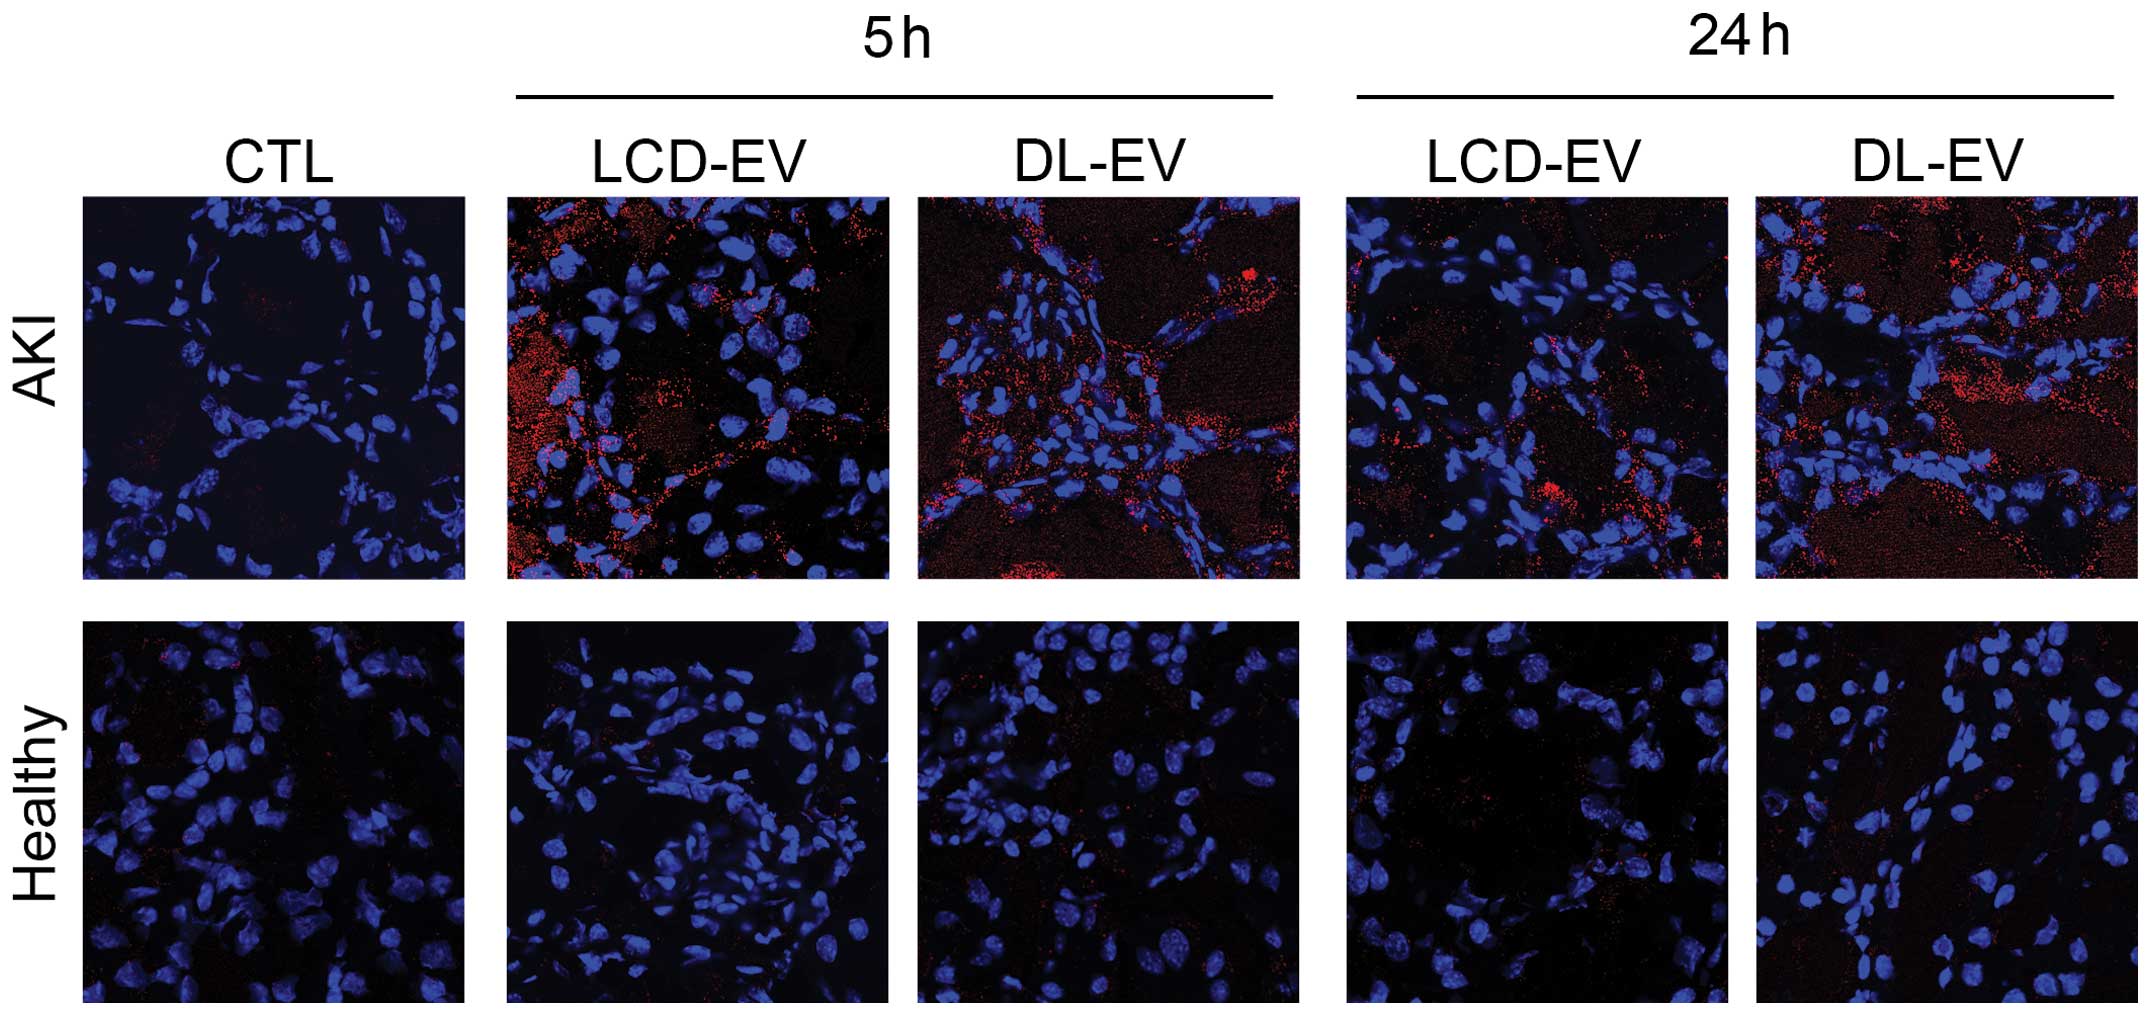
The presence of LCD-EVs and of DL-EVs within injured
kidneys was confirmed by confocal analysis using the appropriate
wavelength (Fig. 7). In the
kidney sections derived from healthy mice, the presence of
fluorescent EVs was almost absent.
Discussion
The results of the present study demonstrate that it
is possible to analyze the biodistribution of EVs either by direct
labeling or by the production of labeled EVs from MSCs. In
particular, labeled MSC-derived EVs were found to localize within
the injured kidneys.
The imaging of EVs in vivo may contribute to
understanding the regenerative potential of EVs released from stem
cells. Different approaches to visualize EVs have been proposed,
exploiting fluorescent protein-based imaging, such as green
fluorescent protein GFP (34),
red fluorescent protein (RFP) (35), or the enzymatic activity of the
luciferase enzyme which is secreted within exosomes (36). Nevertheless, the use of
fluorescent proteins limits the visualization only to the EVs that
possess the candidate proteins. Therefore, this technique cannot be
applied to all type of vesicles. Since extracellular vesicles are a
broad group, differing in content, size and surface markers
(37,38) we used a technique that allows the
labeling of EV lipid membranes.
The use of small-molecule fluorophores and, in
particular, NIR molecules, is a powerful tool to track EVs for
non-invasive visualization. These dyes present strong and stable
fluorescence in the EV membrane (28). NIR molecules exert a high tissue
penetration in concomitance with a low background signal. These
dyes have been employed for ex vivo EV detection (28). Since the possibility to trace
these dyes in vivo has been shown for labeled cells and
antibodies (33,39), in this study, we assessed the
possibility to label EVs with DiD for EV tracking.
Previous publications addressing the biodistribution
of EVs, have used the ex vivo detection of the dyes in
dissected organs (28). Takahashi
et al (36), using the
luciferase activity of EVs, described the possibility to monitor
their biodistribution within 4 h.
In this study, we compared the efficiency and
sensibility of two labeling methods to visualize EVs in living
animals. DiD-labeled EVs were obtained by direct labeling after
their production or from the supernatant of MSCs previously
incubated with DiD. Labeled EVs were administered to a mouse model
of AKI induced by a glycerol injection and compared with healthy
controls, to observe their biodistribution. EVs derived from human
MSCs have been shown to accelerate the recovery of AKI in different
mouse models (13,19,20). In the present study, we found that
labeled EVs accumulated specifically in the kidneys of mice with
AKI compared with healthy controls. After 5 h, the EVs were
detectable in whole body images and in dissected kidneys by OI
using both types of labeling procedure. However, the DL-EVs showed
a higher and brighter fluorescence compared with the LCD-EVs. In
the whole body, the signal generated by the DL-EVs was maintained
for 24 h after the injection, whereas the signal of the LCD-EVs was
detectable only in the dissected kidneys. Moreover, the liver and
spleen of the mice treated with DL-EVs possessed a fluorescence
signal due to a non-specific accumulation of EVs in the excretory
organs. Comparing the two methods, the LCD-EVs showed a greater
specificity due to their detection only in injured tissue, but the
intensity of the fluorescence was lower than that of the DL-EVs. It
is known that MSCs are recruited at the site of injury by
receptor-mediated interaction (16). MSC-derived EVs bear the same
membrane receptors of MSCs; it is therefore possible that they may
accumulate at the site of injury by exploiting the same mechanisms.
In addition, the increased permeability in the injured kidney may
account for the local accumulation of EVs in AKI.
In conclusion, both these labeling methods were
found to be suitable for the in vivo detection of the renal
localization of EVs. The localization of EVs in diseased, but not
normal kidneys, may explain their beneficial effects on recovery
following AKI.
Acknowledgements
We thank Federica Antico for providing precious
technical support. This study was supported by the Stem Kidney
grant of Fresenius Medical Care and by the National Center For
Advancing Translational Sciences of the National Institutes of
Health under Award no. UH2TR000880. The content is solely the
responsibility of the authors and does not necessarily represent
the official views of the National Institutes of Health.
References
|
1
|
Aliotta JM, Pereira M, Johnson KW, et al:
Microvesicle entry into marrow cells mediates tissue-specific
changes in mRNA by direct delivery of mRNA and induction of
transcription. Exp Hematol. 38:233–245. 2010. View Article : Google Scholar : PubMed/NCBI
|
|
2
|
Ludwig AK and Giebel B: Exosomes: small
vesicles participating in intercellular communication. Int J
Biochem Cell Biol. 44:11–15. 2012. View Article : Google Scholar : PubMed/NCBI
|
|
3
|
van Dommelen SM, Vader P, Lakhal S,
Kooijmans SA, van Solinge WW, Wood MJ and Schiffelers RM:
Microvesicles and exosomes: opportunities for cell-derived membrane
vesicles in drug delivery. J Control Release. 161:635–644.
2012.PubMed/NCBI
|
|
4
|
Deregibus MC, Cantaluppi V, Calogero R, Lo
Iacono M, Tetta C, Biancone L, Bruno S, et al: Endothelial
progenitor cell-derived microvescicles activate an angiogenic
program in endothelial cells by a horizontal transfer of mRNA.
Blood. 110:2440–2448. 2007. View Article : Google Scholar : PubMed/NCBI
|
|
5
|
Valadi H, Ekström K, Bossios A, Sjöstrand
M, Lee JJ and Lötvall JO: Exosome-mediated transfer of mRNAs and
microRNAs is a novel mechanism of genetic exchange between cells.
Nat Cell Biol. 9:654–659. 2007. View
Article : Google Scholar : PubMed/NCBI
|
|
6
|
Aliotta JM, Sanchez-Guijo FM, Dooner GJ,
et al: Alteration of marrow cell gene expression, protein
production, and engraftment into lung by lung-derived
microvesicles: a novel mechanism for phenotype modulation. Stem
Cells. 25:2245–2256. 2007. View Article : Google Scholar : PubMed/NCBI
|
|
7
|
Collino F, Deregibus MC, Bruno S, et al:
Microvesicles derived from adult human bone marrow and tissue
specific mesenchymal stem cells shuttle selected pattern of miRNAs.
PLoS One. 5:e118032010. View Article : Google Scholar : PubMed/NCBI
|
|
8
|
Ratajczak J, Miekus K, Kucia M, Zhang J,
Reca R, Dvorak P and Ratajczak MZ: Embryonic stem cell-derived
microvesicles reprogram hematopoietic progenitors: evidence for
horizontal transfer of mRNA and protein delivery. Leukemia.
20:847–856. 2006. View Article : Google Scholar : PubMed/NCBI
|
|
9
|
Jin HJ, Bae YK, Kim M, et al: Comparative
analysis of human mesenchymal stem cells from bone marrow, adipose
tissue, and umbilical cord blood as sources of cell therapy. Int J
Mol Sci. 14:17986–8001. 2013.PubMed/NCBI
|
|
10
|
Humphreys BD and Bonventre JV: Mesenchymal
stem cells in acute kidney injury. Annu Rev Med. 59:311–325. 2008.
View Article : Google Scholar : PubMed/NCBI
|
|
11
|
Bi B, Schmitt R, Israilova M, Nishio H and
Cantley LG: Stromal cells protect against acute tubular injury via
an endocrine effect. J Am Soc Nephrol. 18:2486–2496. 2007.
View Article : Google Scholar : PubMed/NCBI
|
|
12
|
Quesenberry PJ and Aliotta JM: Cellular
phenotype switching and microvesicles. Adv Drug Deliv Rev.
62:1141–1148. 2010. View Article : Google Scholar : PubMed/NCBI
|
|
13
|
Bruno S, Grange C, Deregibus MC, et al:
Mesenchymal stem cell-derived microvesicles protect against acute
tubular injury. J Am Soc Nephrol. 20:1053–1067. 2009. View Article : Google Scholar : PubMed/NCBI
|
|
14
|
Camussi G, Deregibus MC and Cantaluppi V:
Role of stem-cell-derived microvesicles in the paracrine action of
stem cells. Biochem Soc Trans. 41:283–287. 2013. View Article : Google Scholar : PubMed/NCBI
|
|
15
|
Goldstein SL, Jaber BL, Faubel S and
Chawla LS; Acute Kidney Injury Advisory Group of American Society
of Nephrology. AKI transition of care: a potential opportunity to
detect and prevent CKD. Clin J Am Soc Nephrol. 8:476–483. 2013.
View Article : Google Scholar : PubMed/NCBI
|
|
16
|
Herrera MB, Bussolati B, Bruno S, et al:
Exogenous mesenchymal stem cells localize to the kidney by means of
CD44 following acute tubular injury. Kidney Int. 72:430–441. 2007.
View Article : Google Scholar
|
|
17
|
Morigi M, Introna M, Imberti B, et al:
Human bone marrow mesenchymal stem cells accelerate recovery of
acute renal injury and prolong survival in mice. Stem Cells.
26:2075–2082. 2008. View Article : Google Scholar : PubMed/NCBI
|
|
18
|
Qi S and Wu D: Bone marrow-derived
mesenchymal stem cells protect against cisplatin-induced acute
kidney injury in rats by inhibiting cell apoptosis. Int J Mol Med.
32:1262–1272. 2013.PubMed/NCBI
|
|
19
|
Bruno S, Grange C, Collino F, Deregibus MC
and Cantaluppi V: Microvesicles derived from mesenchymal stem cells
enhance survival in a lethal model of acute kidney injury. PLoS
One. 7:e331152012. View Article : Google Scholar : PubMed/NCBI
|
|
20
|
Gatti S, Bruno S, Deregibus MC, Sordi A,
Cantaluppi V, Tetta C and Camussi G: Microvesicles derived from
human adult mesenchymal stem cells protect against
ischaemia-reperfusion-induced acute and chronic kidney injury.
Nephrol Dial Transplant. 26:1474–1483. 2011. View Article : Google Scholar : PubMed/NCBI
|
|
21
|
Boddington S, Henning TD, Sutton EJ and
Daldrup-Link HE: Labeling stem cells with fluorescent dyes for
non-invasive detection with optical imaging. J Vis Exp.
14:pii6862008.PubMed/NCBI
|
|
22
|
Tögel F, Yang Y, Zhang P, Hu Z and
Westenfelder C: Bioluminescence imaging to monitor the in vivo
distribution of administered mesenchymal stem cells in acute kidney
injury. Am J Physiol Renal Physiol. 295:F315–F321. 2008.PubMed/NCBI
|
|
23
|
Sutton EJ, Henning TD, Boddington S, Demos
S, Krug C, Meier R, Kornak J, et al: In vivo magnetic resonance
imaging and optical imaging comparison of viable and nonviable
mesenchymal stem cells with a bifunctional label. Mol Imaging.
9:278–290. 2010.PubMed/NCBI
|
|
24
|
Garrovo C, Bergamin N, Bates D, et al: In
vivo tracking of murine adipose tissue-derived multipotent adult
stem cells and ex vivo cross-validation. Int J Mol Imaging.
2013:4269612013. View Article : Google Scholar : PubMed/NCBI
|
|
25
|
Chatterjee DK, Gnanasammandhan MK and
Zhang Y: Small upconverting fluorescent nanoparticles for
biomedical applications. Small. 6:2781–2795. 2010. View Article : Google Scholar : PubMed/NCBI
|
|
26
|
Rao J, Dragulescu-Andrasi A and Yao H:
Fluorescence imaging in vivo: recent advances. Curr Opin
Biotechnol. 18:17–25. 2007. View Article : Google Scholar
|
|
27
|
Boddington SE, Sutton EJ, Henning TD,
Nedopil AJ, Sennino B, Kim A and Daldrup-Link HE: Labeling human
mesenchymal stem cells with fluorescent contrast agents: the
biological impact. Mol Imaging Biol. 13:3–9. 2011. View Article : Google Scholar : PubMed/NCBI
|
|
28
|
Hood JL, San RS and Wickline SA: Exosomes
released by melanoma cells prepare sentinel lymph nodes for tumor
metastasis. Cancer Res. 71:3792–3801. 2011. View Article : Google Scholar : PubMed/NCBI
|
|
29
|
Ansa-Addo EA, Lange S, Stratton D, et al:
Human plasma membrane-derived vesicles halt proliferation and
induce differentiation of THP-1 acute monocytic leukemia cells. J
Immunol. 185:5236–5246. 2010. View Article : Google Scholar : PubMed/NCBI
|
|
30
|
Grant R, Ansa-Addo E, Stratton D, et al: A
filtration-based protocol to isolate human plasma membrane-derived
vesicles and exosomes from blood plasma. J Immunol Methods.
371:143–151. 2011. View Article : Google Scholar : PubMed/NCBI
|
|
31
|
Sutton EJ, Boddington SE, Nedopil AJ,
Henning TD, Demos SG, Baehner R, Sennino B, et al: An optical
imaging method to monitor stem cell migration in a model of
immune-mediate arthritis. Opt Express. 17:24403–24413. 2009.
View Article : Google Scholar : PubMed/NCBI
|
|
32
|
Herrera MB, Fonsato V, Bruno S, et al:
Human liver stem cells improve liver injury in a model of fulminant
liver failure. Hepatology. 57:311–319. 2013. View Article : Google Scholar : PubMed/NCBI
|
|
33
|
Zou P, Xu S, Povoski SP, et al:
Near-infrared fluorescence labeled anti-TAG-72 monoclonal
antibodies for tumor imaging in colorectal cancer xenograft mice.
Mol Pharm. 6:428–440. 2009. View Article : Google Scholar : PubMed/NCBI
|
|
34
|
Lai CP, Tannous BA and Breakefield XO:
Noninvasive in vivo monitoring of extracellular vesicles. Methods
Mol Biol. 1098:249–258. 2014. View Article : Google Scholar : PubMed/NCBI
|
|
35
|
Suetsugu A, Honma K, Saji S, Moriwaki H,
Ochiya T and Hoffman RM: Imaging exosome transfer from breast
cancer cells to stroma at metastatic sites in orthotopic nude-mouse
models. Adv Drug Deliv Rev. 65:383–390. 2013. View Article : Google Scholar : PubMed/NCBI
|
|
36
|
Takahashi Y, Nishikawa M, Shinotsuka H,
Matsui Y, Ohara S, Imai T and Takakura Y: Visualization and in vivo
tracking of the exosomes of murine melanoma B16-BL6 cells in mice
after intravenous injection. J Biotechnol. 165:77–84. 2013.
View Article : Google Scholar : PubMed/NCBI
|
|
37
|
Raposo G and Stoorvogel W: Extracellular
vesicles: exosomes, microvesicles, and friends. J Cell Biol.
200:373–383. 2013. View Article : Google Scholar : PubMed/NCBI
|
|
38
|
Camussi G, Deregibus MC, Bruno S,
Cantaluppi V and Biancone L: Exosomes/microvesicles as a mechanism
of cell-to-cell communication. Kidney Int. 78:838–848. 2010.
View Article : Google Scholar : PubMed/NCBI
|
|
39
|
Kalchenko V, Shivtiel S, Malina V, Lapid
K, Haramati S, Lapidot T, Brill A and Harmelin A: Use of lipophilic
near-infrared dye in whole-body optical imaging of hematopoietic
cell homing. J Biomed Opt. 11:0505072006. View Article : Google Scholar : PubMed/NCBI
|