Introduction
Papillary thyroid carcinoma (PTC) is the most common
type of thyroid cancer, which represents 75–85% of all thyroid
cancer cases. Metabolomics is a newly emerging technology that
holds promise for the diagnosis of disease and discovery of
mechanisms linked to disease processes, particularly in cancers
(1–4). Cancer cells have fundamentally
altered cellular metabolism, which directly contributes to
tumorigenicity and malignancy. Deciphering the molecular networks
that are altered in PTC may lead to the identification of the
critical insight into the pathogenesis of PTC. Although PTC is an
important cancer with regard to research, little is known regarding
the global metabolomic alterations of PTC. Currently, the nuclear
magnetic resonance spectroscopy (NMR)-based metabolomic technique
has been widely used in studies regarding thyroid carcinomas
particularly in the diagnosis (5–7);
however, the metabolic pathways that drive tumorigenesis in PTC
remain to be elucidated.
NMR is non-destructive, highly selective and useful
in metabolite structural identification; however, it is limited by
relatively lower sensitivities. By contrast, gas chromatography
(GC) coupled with mass spectrometry (MS) offers a good combination
of sensitivity and selectivity, which makes GC-MS an important tool
in metabolomics. However, to the best of our knowledge, there are
no published GC-MS based metabolomic studies on PTC.
Currently, integration of multiple layers of
information is promising for acquiring a precise understanding of
disease. The combination of metabolomic results and metabolic
enzyme gene expression data can support the metabolomic results,
and also provide deeper insight into the metabolomic findings
(8).
In the present study, the GC-MS-based non-targeted
metabolomic technique (9,10) was used to study different
metabolite patterns and metabolic pathway disturbances in PTC.
Based on the metabolomic results, a follow-up study was performed
to understand the expression of the metabolic enzyme genes in
association with PTC. By the integration of the metabolomic and
metabolic enzyme gene expression data, the present study provided
the first critical insight into the metabolic network that may
drive tumorigenesis in PTC.
Patients and methods
Sample collection
The Ethics Committee of the First Affiliated
Hospital of Nanjing Medical University (Nanjing, China) approved
the study. Informed consent was obtained from each participant.
Matched PTC and normal thyroid tissues were obtained from the same
diagnosed PTC patients (n=16; 4 males, 12 females; age range, 19–59
years; tumor size, 1–4.2 cm) during surgery. The sample size and
characteristics of the population for metabolomic analysis were
similar to previous metabolomic studies on PTC and other types of
cancer, and as such can provide useful information on metabolic
changes of cancers using tissues (2,5–7).
All the patients had undergone surgical thyroidectomy at the First
Affiliated Hospital of Nanjing Medical University. Histological
assessment was conducted based on established criteria of the World
Health Organization (11).
Pathological diagnosis of all the PTC was confirmed independently
by two pathologists. Tumor samples were carefully microdissected to
ensure that >90% of the analyzed tissue contained cancer cells,
and normal tissues were not connected by follicular adenomas or
thyroid carcinoma. None of the patients received radiation therapy
or neo-adjuvant chemotherapy prior to surgery. Fresh tumor tissue
and corresponding normal thyroid were washed with
phosphate-buffered saline following removal and snap-frozen in
liquid nitrogen during surgery, and were subsequently stored at
−80°C until analysis.
Chemicals
13C6-Leucine was purchased
from Shanghai Intechem Technology Co., Ltd. (Shanghai, China).
Bis-(trimethylsilyl)trifluoroacetamide (BSTFA) with 1%
trimethylchlorosilane (TMCS) and methoxylamine were obtained from
Sigma-Aldrich (St. Louis, MO, USA). Water was purified by the
Milli-Q Reagent Water System (Millipore, Billerica, MA, USA).
Sample preparation
For GC-MS analysis, the sample preparation was
carried out according to a previous method (10). Each 40-mg tissue was transferred
to a centrifuge tube. An ice-cold mixture (800 µl) of
chloroform-methanol-water (2:5:2, v/v/v) and 100 µl of
13C6-leucine, as the internal standard (100
µg/ml), were added to each sample and the mixture was
homogenized in an ice-water bath. The samples were subsequently
centrifuged at 14,000 x g for 15 min at 4°C and 700 µl of
the supernatant was collected separately from each sample into a
new tube. Following the addition of 500 µl methanol into
each original tube, the solution was vortex-mixed, and centrifuged
at 14,000 x g for 15 min at 4°C. The supernatant (500 µl)
was collected from each original tube and transferred into the
corresponding new tube separately and the solution was
vortex-mixed. The solution (200 µl) from each new tube was
transferred to a screw vial with PTFE-lined screw caps and
evaporated to dryness under a stream of nitrogen gas. Subsequently,
methoximation was carried out by dissolving the samples in 30
µl of methoxamine solution (20 mg/ml in pyridine) and
incubating them at 37°C for 90 min. Following this, 30 µl
BSTFA with 1% TMCS was added to each vial, and the mixture was
incubated for 60 min at a temperature of 70°C. Following
derivatization and cooling to room temperature, the derivative (1
µl) was injected in the GC-MS for analysis.
GC-MS analysis
The metabolomic profiling was performed according to
previous studies (9,10). The GC-MS instrument used for
metabolite profiling was an Agilent 7890A/5975C GC-MS system with
an HP-5ms fused silica capillary column (30 m x 250 µm, 0.25
µm). Helium (purity>99.999%) was used as a carrier gas
with a flow rate of 1.0 ml/min, and a 1 µl sample was
injected at a splitless mode. The temperature of injection was set
to 280°C. The column temperature was first kept at 80°C for 2 min,
increased to 320°C at a rate of 10°C/min and maintained at 320°C
for 6 min. The detector was a quadrupole mass spectrometer and the
temperatures of the ion source and quadrupole were 230 and 150°C,
respectively. The electron energy was operated at 70 eV. The data
were acquired in full scan mode from m/z 50 to 600. All the samples
were analyzed randomly to avoid complications associated with the
injection order. The GC-MS analysis was performed within 24 h to
ensure the stability of instrument performance and derivatives. One
script of xcms package was run under R analytical platform (R Core
Team, Vienna, Austria; http://www.R-project.org/) to preprocess these raw
GC-MS data, including baseline filtering, peak identification,
integration, retention time correction, peak alignment and mass tag
correlation. Prior to analysis, the set of data were normalized by
dividing the spectral intensity of each metabolite by the sum of
all the metabolites in that spectrum. This was performed to account
for any differences in global sample concentrations resulting from
metabolomic analysis (12). A
data matrix of each sample was obtained for characterizing the
biochemical pattern, and subsequently employed for correlation
analysis and pattern recognition. The differential metabolites were
identified by searching the NIST library and author-constructed
standard library with a similarity of >80%, and were verified by
available reference compounds (9,13).
Reverse transcription-quantitative
polymerase chain reaction (RT-qPCR) analysis
Total RNA was extracted from snap-frozen tissue
fragments using TRIzol (Invitrogen, Carlsbad, CA, USA), according
to the manufacturer's protocol. Reverse transcription was performed
using the PrimeScript RT reagent kit (Takara, Dalian, China) in
accordance with the manufacturer's protocol. All RT-qPCR reactions
were carried out on the ABI 7900 HT Fast Real-Time system (Applied
Biosystems, Foster City, CA, USA) using SYBR-Green PCR Master Mix
reagent kits (Takara) according to the manufacturer's protocol for
quantification of gene expression. Human-specific primers for the
genes of interest are listed in Table
I. All PCR was performed in triplicate, and the specificity of
the PCR products was confirmed using melting curve analyses. The
2−ΔΔCt method was used to calculate the relative
expression (14). The reference
gene β-actin was used as an internal control. The levels of the
glucose-6-phosphate dehydrogenase (G6PD), phosphoglycerate
kinase 1 (PGK1), lactate dehydrogenase A (LDHA),
phosphoglycerate dehydrogenase (PHGDH) and
prostaglandin-endoperoxide synthase 2 (PTGS2) genes were
normalized relative to the expression levels of the gene
β-actin.
 | Table IPrimers for reverse
transcription-quantitative polymerase chain reaction. |
Table I
Primers for reverse
transcription-quantitative polymerase chain reaction.
| Target gene | Primer
sequences | Product length
(bp) |
|---|
| G6PD | Sense:
5′-ACAGAGTGAGCCCTTCTTCAA-3′ | 106 |
| Antisense:
5′-GGAGGCTGCATCATCGTACT-3′ | |
| PGK1 | Sense:
5′-TGGACGTTAAAGGGAAGCGG-3′ | 152 |
| Antisense:
5′-GCTCATAAGGACTACCGACTTGG-3′ | |
| LDHA | Sense:
5′-ATGGCAACTCTAAAGGATCAGC-3′ | 86 |
| Antisense:
5′-CCAACCCCAACAACTGTAATCT-3′ | |
| PHGDH | Sense:
5′-CTGCGGAAAGTGCTCATCAGT-3′ | 154 |
| Antisense:
5′-TGGCAGAGCGAACAATAAGGC-3′ | |
| PTGS2 | Sense:
5′-CTGGCGCTCAGCCATACAG-3′ | 94 |
| Antisense:
5′-CGCACTTATACTGGTCAAATCCC-3′ | |
| β-actin | Sense:
5′-GTGGACATCCGCAAAGAC-3′ | 303 |
| Antisense:
5′-GAAAGGGTGTAACGCAACT-3′ | |
Statistical analysis
Multivariate statistical analysis was performed with
SIMCA-P (Umetrics, Umeå, Sweden) with mean centering and unit
variance scaling applied (15).
To guard against over-fitting, the default 7-round cross-validation
was applied with 1/7th of the samples being excluded from the
mathematical model in each round. An orthogonal partial
least-squares discriminate analysis (OPLS-DA) model was taken as a
coefficient for peak selection (16). The significant metabolites were
identified using OPLS-DA to identify metabolites with a variable
importance in the projection (VIP) of >1 and by t-test
(P<0.05) (17). Paired t-tests
were used to compare the mRNA levels of metabolic enzyme genes.
Results
Metabolomic profiling
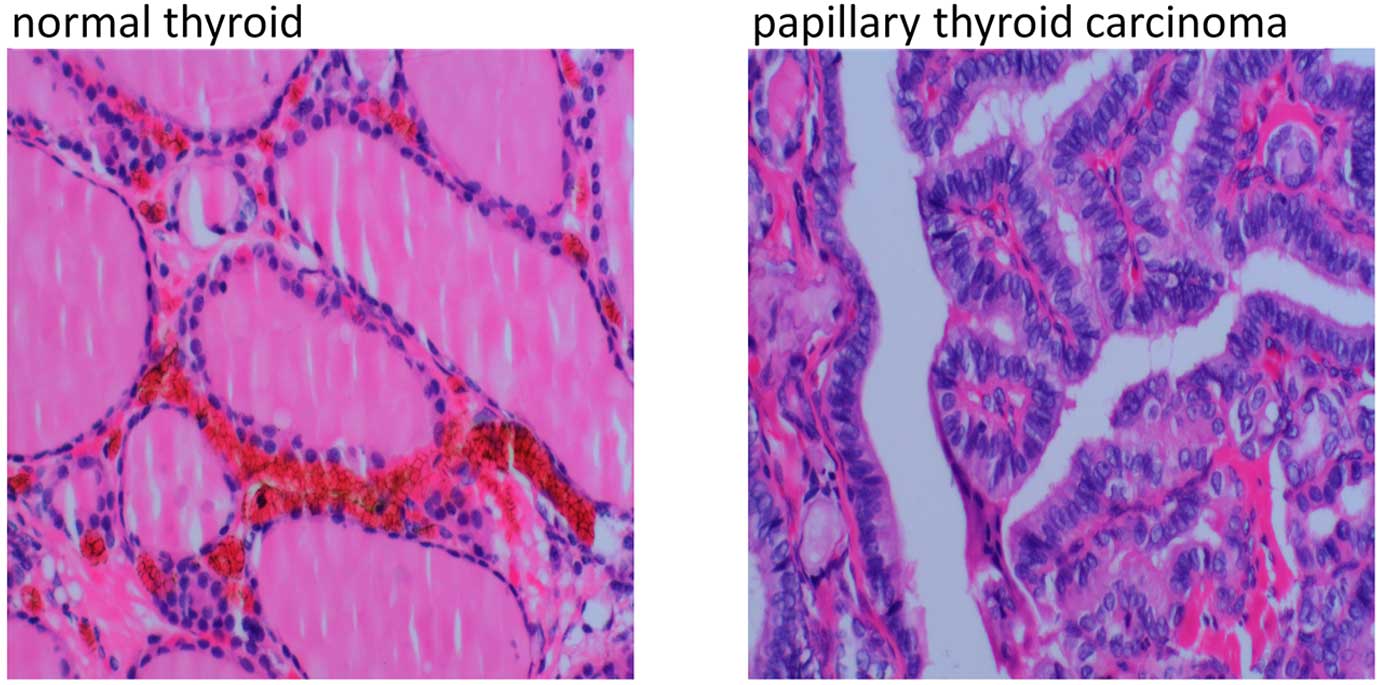
Fig. 1 shows the
magnified representative regions of normal thyroid and PTC from one
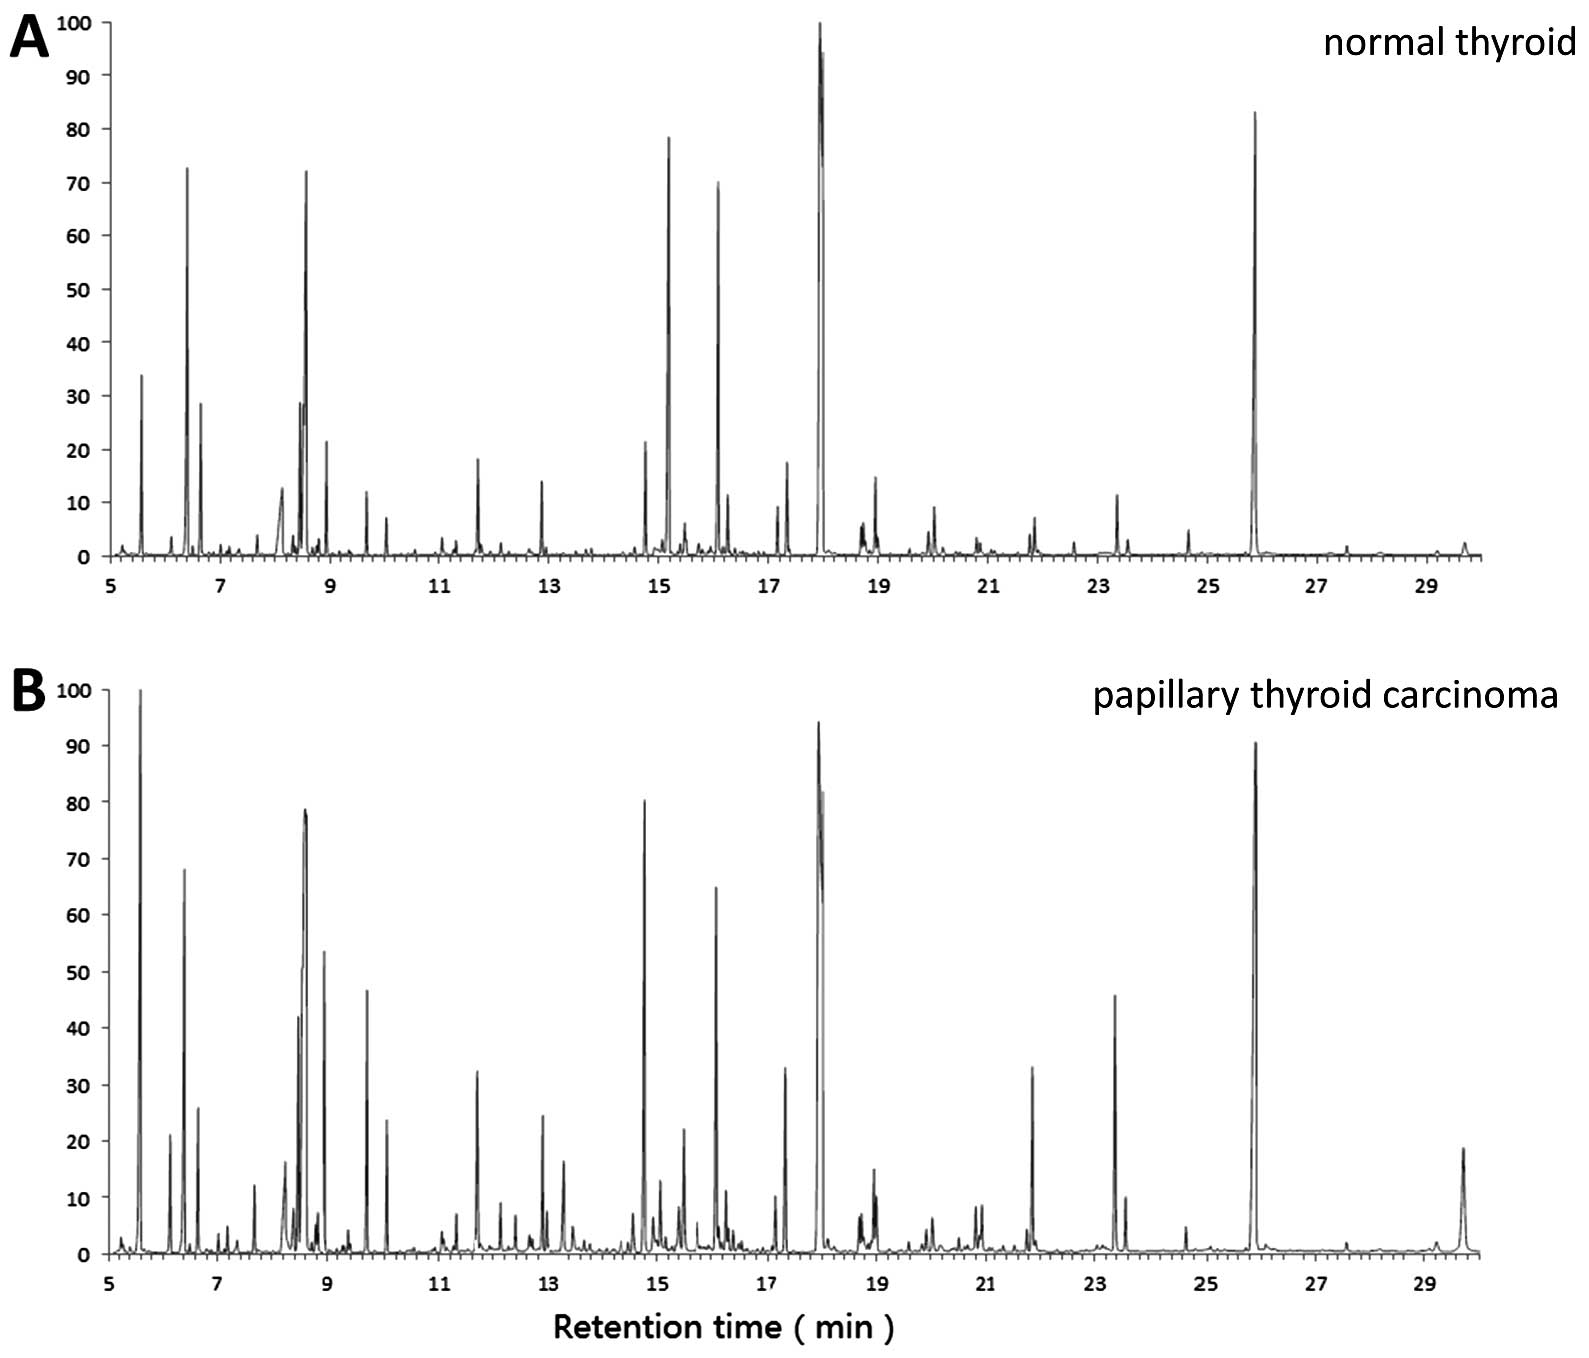
patient. Representative GC-MS total ion chromatograms of samples
from the control and case groups are shown in Fig. 2. The data showed a stable
retention time with no drift in all the peaks. To further validate
the quality of analysis, the variation of
13C6-leucine spectral intensities was
analyzed in all the samples, and identified that the coefficient of
variation % was 11.3%. All these data reflect the stability of
GC-MS analysis and the reliability of the metabolomic data
(9,10).
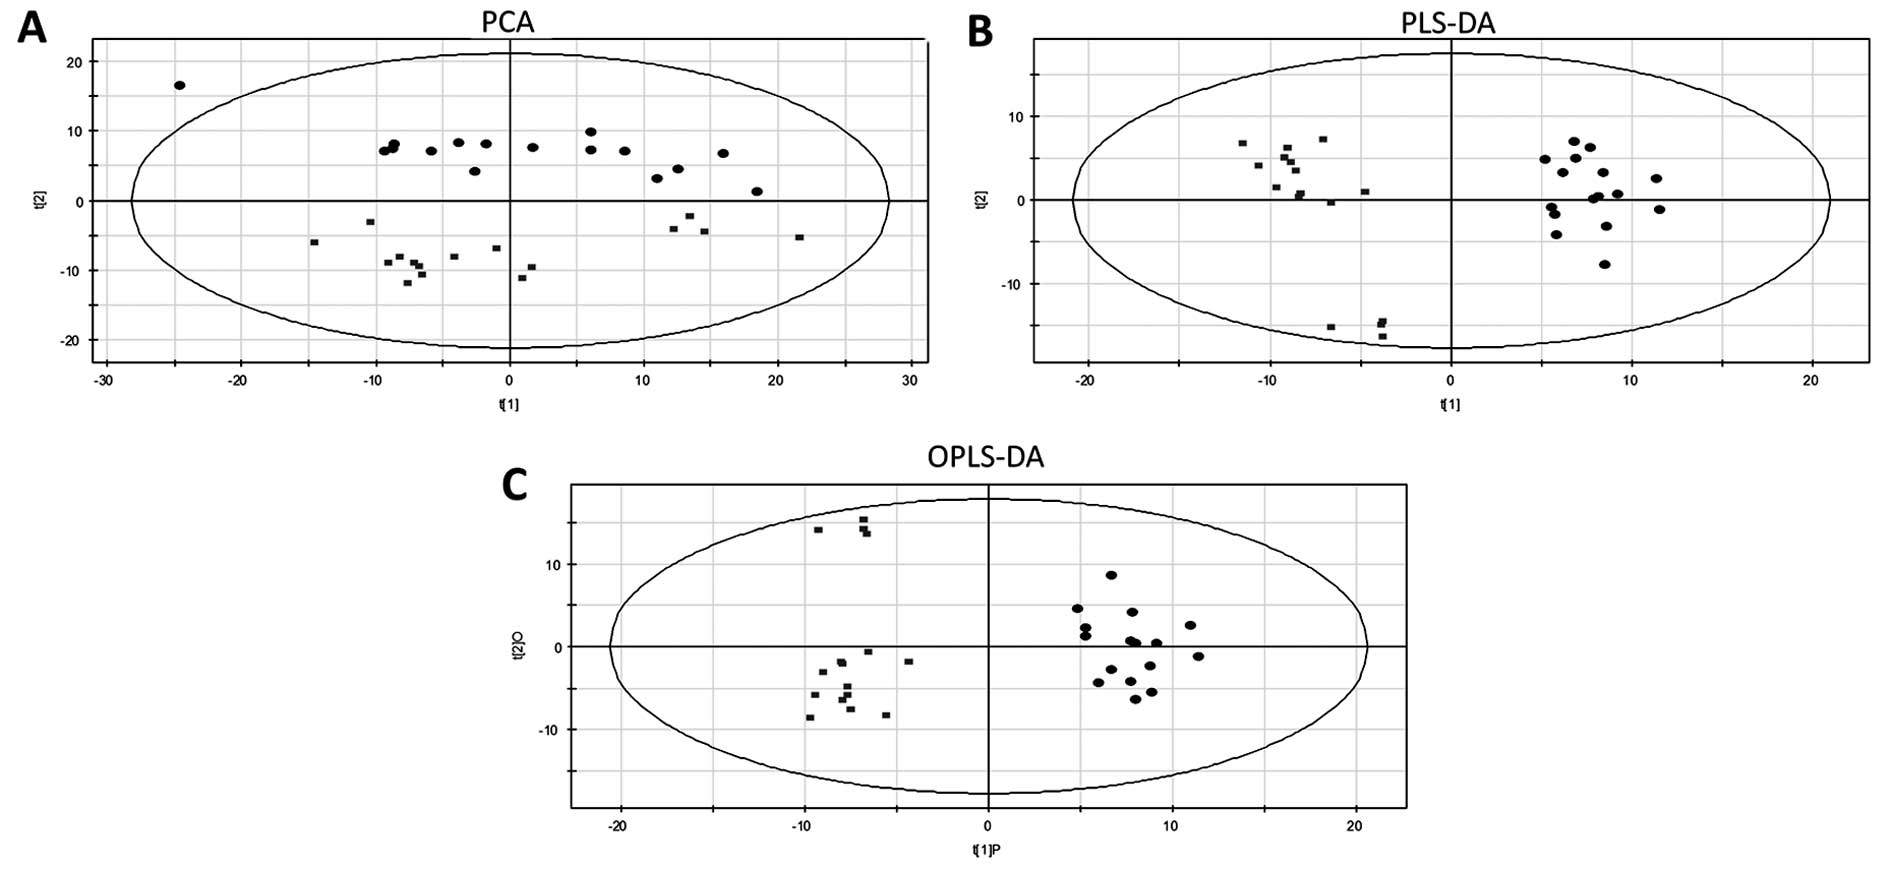
Principal component analysis (PCA)
PCA is an unsupervised, reductive statistical
modeling technique that separates samples based on their
differences from each other. PCA was used to identify overall
metabolic differences in the data set (Fig. 3A). The normal thyroid and tumor
samples were clearly separated, indicating that the metabolome was
significantly changed in PTC tissue and that metabolomic analysis
acquired enough metabolome information to explain the metabolic
disturbance in PTC.
Partial least-squares discriminate
analysis
Partial least-squares discriminant analysis (PLS-DA)
is similar to PCA but is supervised, allowing for the definition of
classes prior to performing the test. This allowed the differences
between the two classes to become apparent (Fig. 3B). R2Y of
PLS-DA was 0.98, indicating that the model presents a high degree
of goodness of fit, and the Q2 of PLS-DA was
0.88, indicating that the model presents a high degree of cross
validation predictive ability.
OPLS-DA
OPLS-DA maximizes the variation between the
specified groups and minimizes the variation between the individual
replicates. Therefore, it highlights the important differences
between the two compared sample classes. VIP provides an indication
of each metabolite's significance to that model. A metabolite with
a VIP of >1 is considered to have a statistically significant
contribution to the model (17).
Similar to the PLS-DA model, the OPLS-DA model provided optimal
modeling and predictive abilities
(R2Y=0.96, Q2=0.89),
achieving a distinct separation between the metabolite profiles of
the two groups (Fig. 3C).
Differential metabolites associated with
PTC
Differential metabolites associated with
tumorigenesis derived from the OPLS-DA mode of GC-MS analysis with
t-test are shown in Table II.
The metabolites in carbohydrate metabolism, including glucose,
fructose, galactose, mannose, 2-keto-D-gluconic acid and rhamnose,
consistently decreased, while metabolites in nucleotide metabolism,
including malonic acid and inosine, and lipid metabolism, including
cholesterol and arachidonic acid, significantly altered
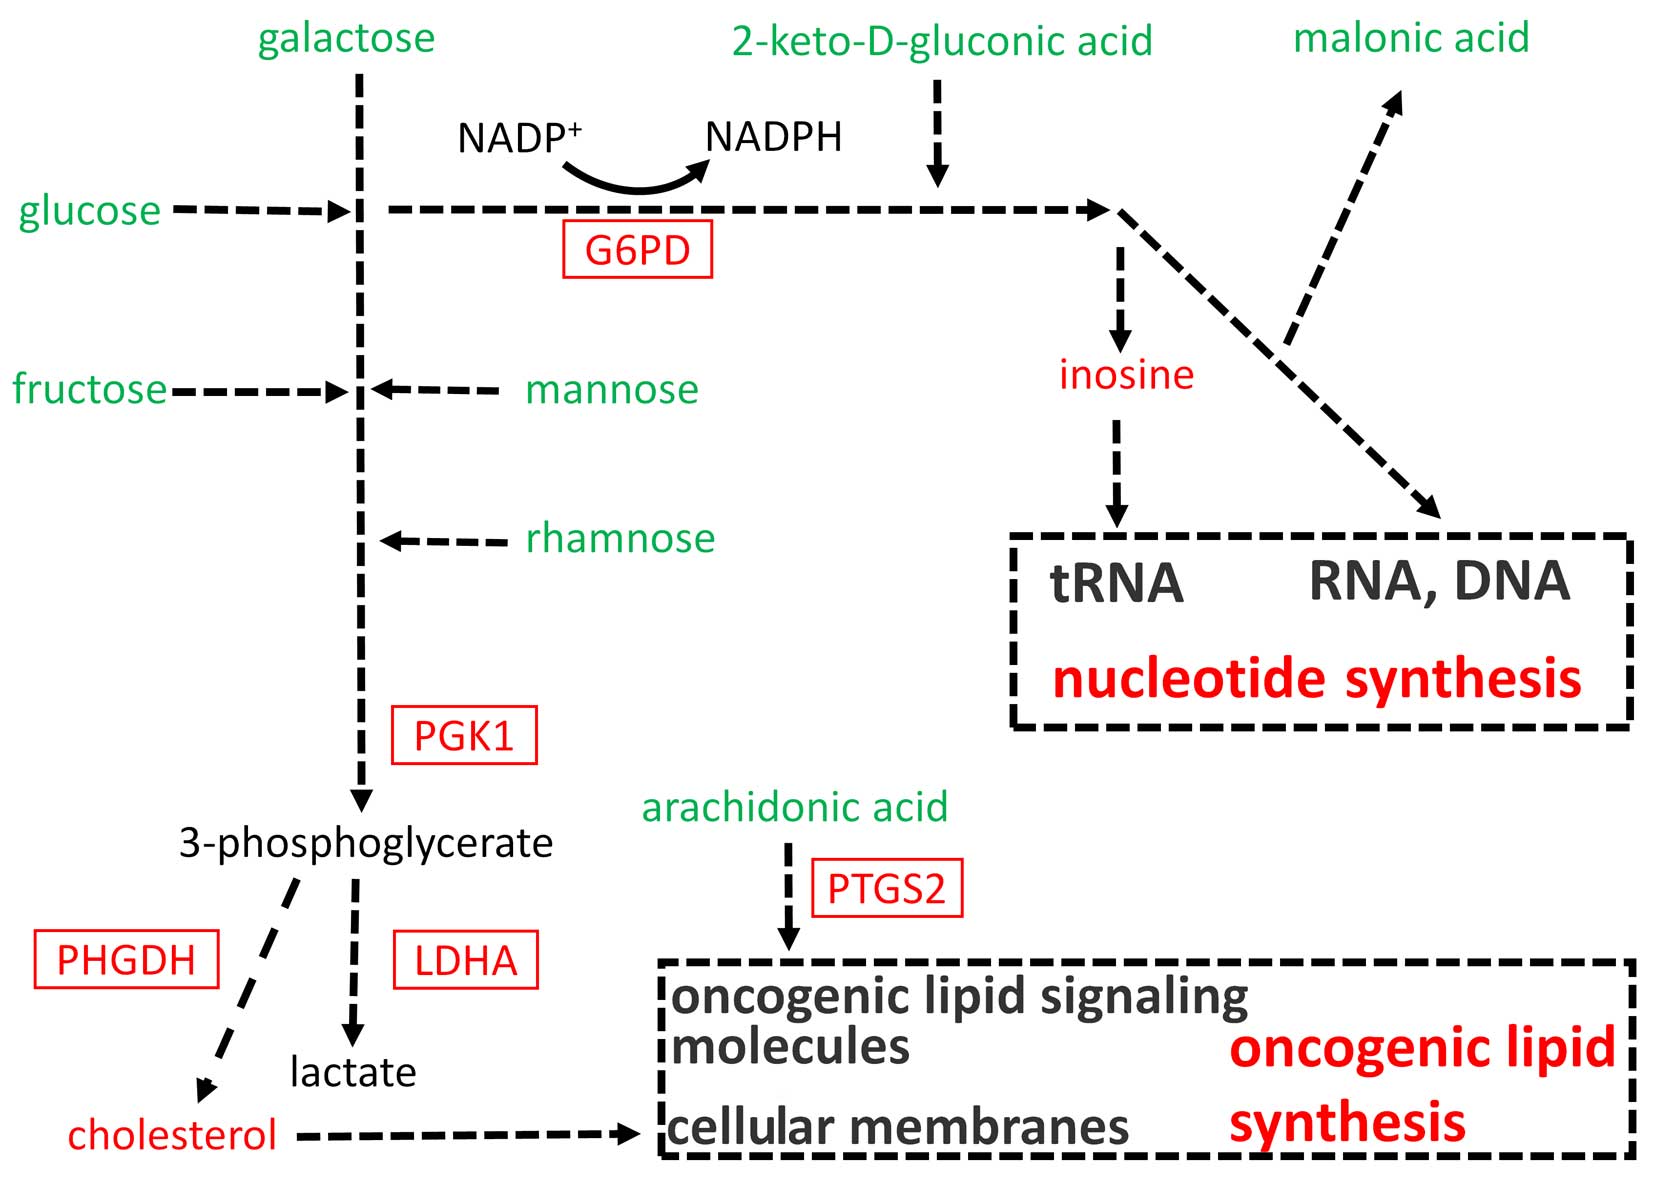
correspondingly. The classification of the chemicals and mapping of
the metabolites into general biochemical pathways, as illustrated
in the Kyoto Encyclopedia of Genes and Genomes (http://www.genome.jp/kegg/), suggested the possible
increased carbohydrate-derived flux into the glycolysis and pentose
phosphate pathway and increased oncogenic lipid synthesis in PTC
(Fig. 4).
| Table IIDifferential metabolites associated
with PTC derived from the OPLS-DA mode of gas chromatography
coupled with mass spectrometry analysis with t-test. |
Table II
Differential metabolites associated
with PTC derived from the OPLS-DA mode of gas chromatography
coupled with mass spectrometry analysis with t-test.
| Metabolites | VIP-valuea | P-valueb | Fold-changec |
|---|
| Arachidonic
acid | 1.72 |
1.14×10⁻³ | 0.50 |
| 2-keto-D-gluconic
acid | 2.25 |
2.87×10⁻⁶ | 0.26 |
| Malonic acid | 1.36 |
1.96×10⁻² | 0.16 |
| Glucose | 2.06 |
3.82×10⁻⁵ | 0.31 |
| Rhamnose | 1.79 |
5.70×10⁻⁴ | 0.48 |
| Fructose | 1.52 |
4.83×10⁻³ | 0.27 |
| Mannose | 1.63 |
2.19×10⁻³ | 0.22 |
| Galactose | 1.55 |
3.62×10⁻³ | 0.19 |
| Phenylalanine | 1.42 |
1.85×10⁻² | 2.02 |
|
N6-Acetyl-L-lysine | 1.13 |
4.06×10⁻² | 1.58 |
| Inosine | 2.21 |
5.39×10⁻⁶ | 3.53 |
| Hydroxyproline | 1.53 |
5.80×10⁻³ | 9.88 |
| Benzoic acid | 1.78 |
6.19×10⁻⁴ | 1.18 |
| Cholesterol | 1.12 |
4.54×10⁻² | 1.32 |
| Pelargonic
acid | 1.62 |
2.25×10⁻³ | 1.33 |
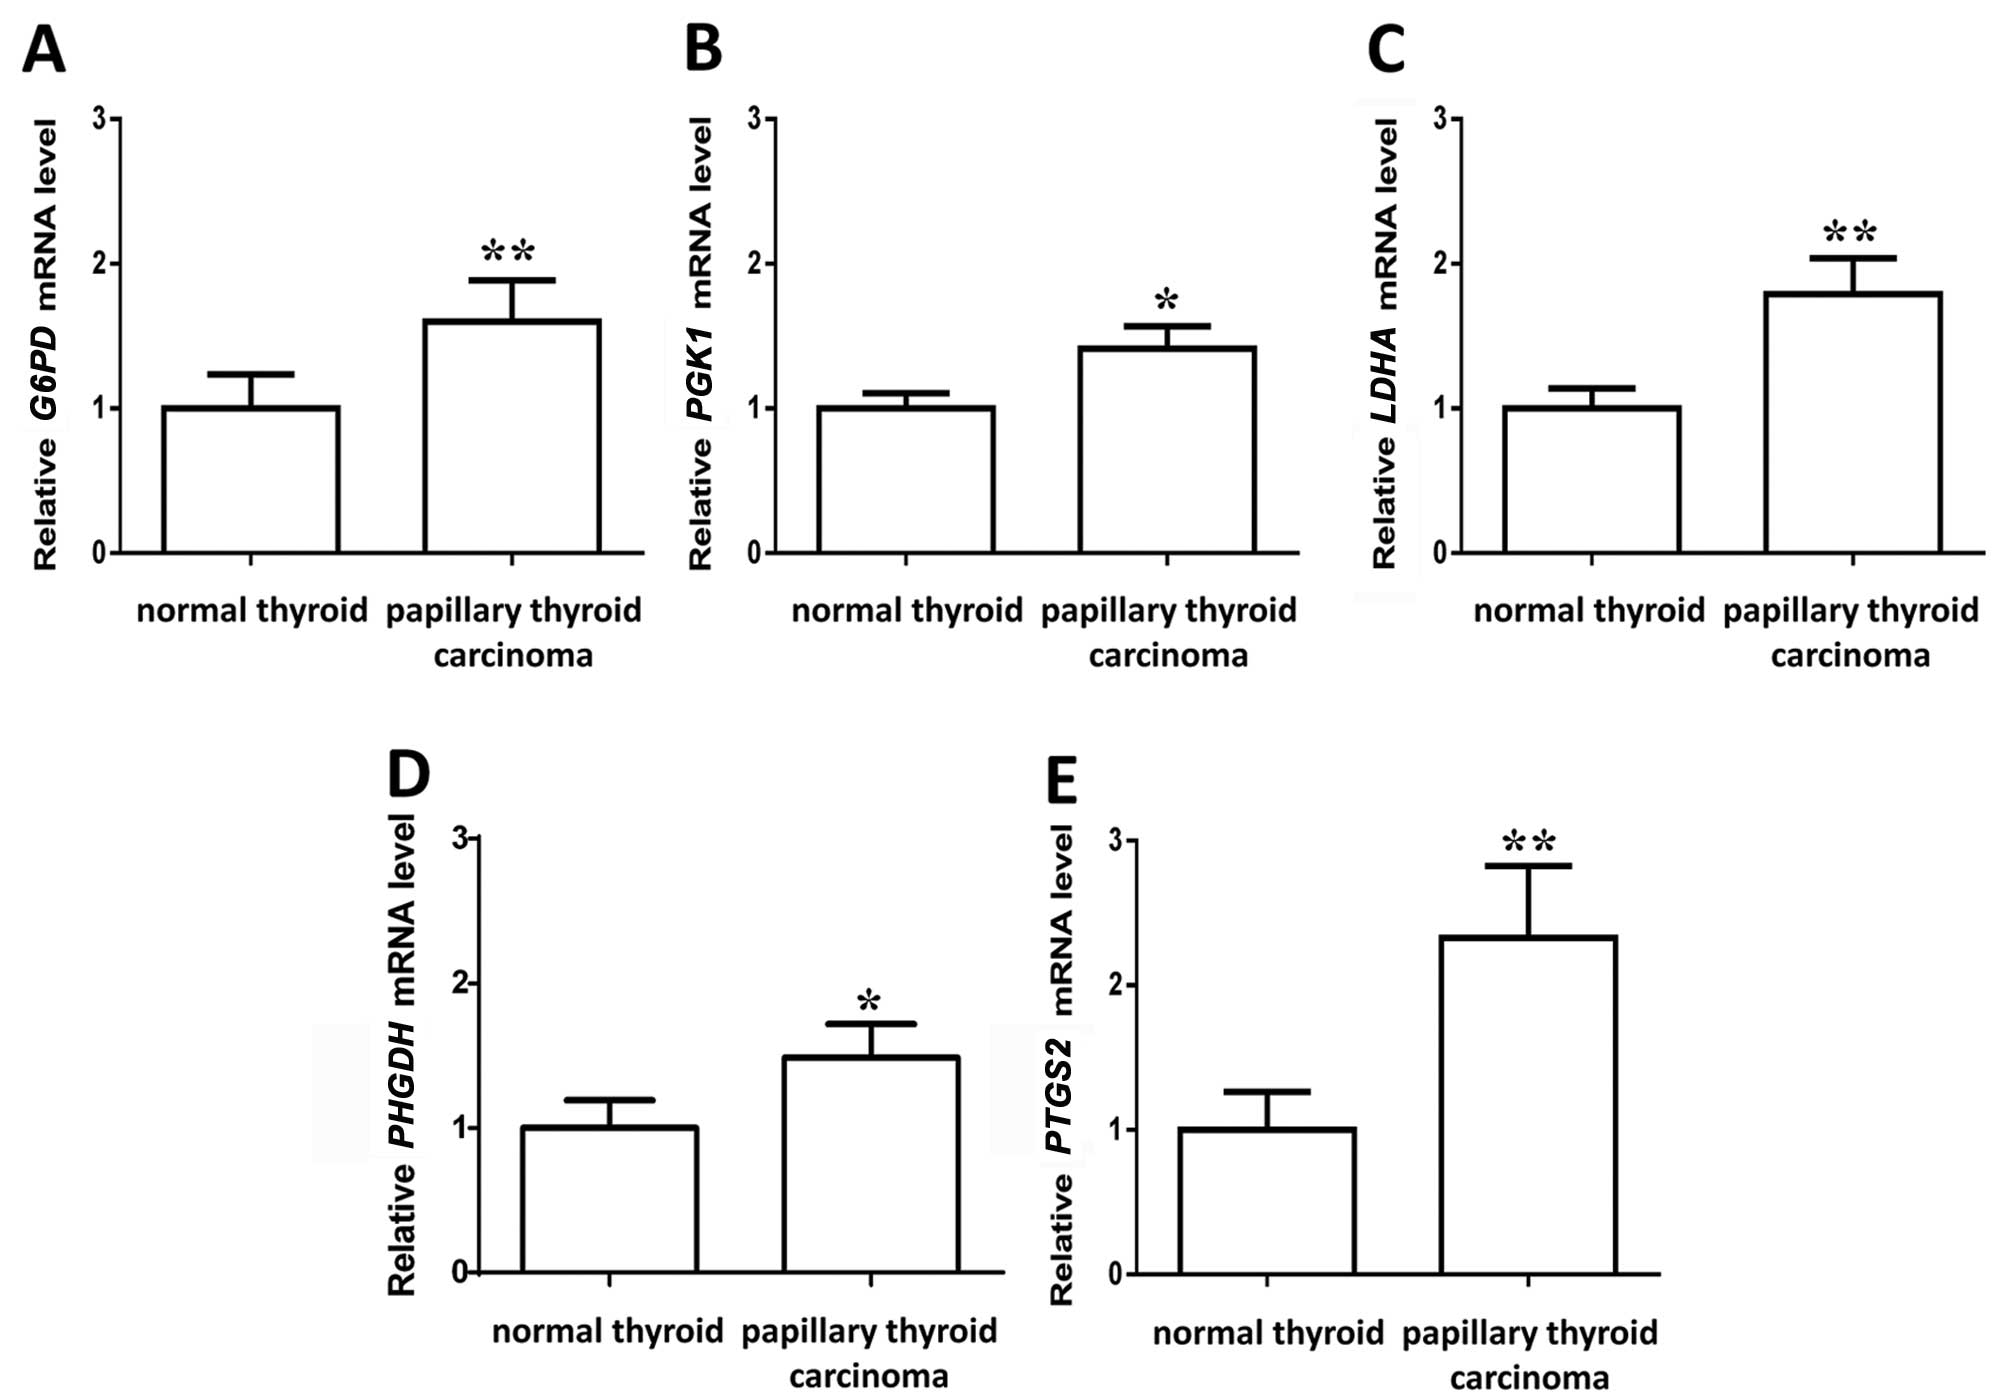
Metabolic enzyme gene expression change
and metabolic network in PTC
A combination of metabolomic and associated mRNA
data has been proven to be useful in providing deeper insight into
the metabolic changes (18).
In order to validate the metabolite changes and
further delineate the metabolic network in PTC, the expression of
several critical metabolic enzyme genes was determined in the
proposed metabolic pathway by analyzing the mRNA level. The mRNA
levels of gene G6PD encoding glucose-6-phosphate
dehydrogenase, which is the committed step of the pentose phosphate
pathway, significantly increased in PTC (Figs. 4 and 5A). In the glycolysis pathway, the mRNA
levels of the gene PGK1 encoding phosphoglycerate kinase,
which is a crucial enzyme in the glycolysis cycle and catalyzes the
formation of 3-phosphoglycerate, significantly increased in PTC
(Figs. 4 and 5B). The mRNA levels of the gene
LDHA encoding lactate dehydrogenase, significantly increased
in PTC (Figs. 4 and 5C), supporting the finding of increased
glycolysis in PTC. As mRNA levels of the PGK1 significantly
increased (Figs. 4 and 5B), the metabolism of 3-phosphoglycerate
was focused on, which can provide acetyl-CoA for cholesterol
synthesis. The mRNA levels of the gene PHGDH encoding
phosphoglycerate dehydrogenase increased in PTC (Fig. 5D), which can finally produce
acetyl-CoA to support lipogenesis, indicating that the
3-phosphoglycerate metabolic pathway may generate precursors for
the downstream production of cholesterol. The relative levels of
arachidonic acid decreased in PTC, which is the precursor of
oncogenic lipid. The mRNA levels of gene PTGS2 encoding
prostaglandin-endoperoxide synthase 2 increased (Fig. 5E) in PTC, indicating an increased
consumption of arachidonic acid to form the oncogenic lipid in PTC.
The metabolic network that may drive tumorigenesis in PTC is
summarized in Fig. 4.
Discussion
Although the metabolic changes have been studied in
different cancers (19–21), the metabolic changes that drive
tumorigenesis in PTC remain to be elucidated. Notable consistent
decreases in a wide range of metabolites, including glucose,
fructose, galactose, mannose, 2-keto-D-gluconic acid and rhamnose
in the upper section of the glycolysis and pentose phosphate
pathway, were observed in PTC samples. The increased LDHA
expression is in accordance with previous studies using the
NMR-based metabolomic technique, which has consistently revealed
that the lactate levels increased in PTC (6,7).
These results, including metabolomic and gene expression data,
consistently indicate upregulation of the glycolysis and pentose
phosphate pathway by high consumption of glucose, fructose,
galactose, mannose, 2-keto-D-gluconic acid and rhamnose in PTC.
The upregulation of the pentose phosphate pathway by
the increased G6PD expression and higher levels of consumption of
glucose, galactose and 2-keto-D-gluconic acid in tumor cells
provides important precursors (pentoses, 5-carbon sugars) of
nucleotide synthesis, such as DNA and RNA. Accordingly, the
production of the downstream metabolite, inosine, significantly
increased in PTC (Table II and
Fig. 4). Inosine is commonly
found in tRNAs and is essential for correct translation of the
genetic code. The decrease of the associated levels of malonic acid
in PTC indicates possible diversion into the uridine monophosphate
synthesis pathway in PTC to increase nucleotide synthesis (22). Therefore, these data suggest a
link between the upregulation of the pentose phosphate pathway and
increased nucleotide synthesis in PTC to initiate and maintain
tumorigenesis.
Aside from pentoses, the pentose phosphate pathway
is a process that also generates nicotinamide adenine dinucleotide
phosphate (NADPH). Ribonucleotide reductase (RNR) is an enzyme that
catalyzes the formation of deoxyribonucleotides from
ribonucleotides (23).
Deoxyribonucleotides are used in the synthesis of DNA, and RNR has
a critical role in regulating the total rate of DNA synthesis. The
ultimate reductant of this reduction system is NADPH. Therefore,
the upregulation of pentose phosphate pathway not only provides
more precursors for DNA synthesis, but also aids in the generation
of DNA by RNR in PTC. By contrast, a recent study has shown that
control of the intracellular reactive oxygen species concentrations
is critical for lung cancer cell survival (24). NADPH can also be used as the
primary reducing power, which may aid in proliferation and lung
cancer cell growth (24).
In the present study, the 3-phosphoglycerate
metabolic pathway may generate precursors for the increased
cholesterol production in PTC. Cholesterol is an essential
structural component of human cell membranes, and it is reported
that cholesterol increases in colorectal cancer tissue (25). In PTC tissue, the increase of
cholesterol may drive rapid cell growth and proliferation. It is
also noteworthy that the conversion of 3-phosphoglycerate generates
glycine. Glycine is a precursor of numerous important molecules
that are required for cell growth, such as purines, protein,
glutathione and 1-carbon units as 5,10-methylenetetrahydrofolate
(26).
In PTC, significantly decreased levels of
arachidonic acid were observed. Arachidonic acid is the precursor
of prostaglandins, which are a class of oncogenic lipid signaling
molecules (27). PTGS2 catalyzes
the conversion of arachidonic acid to prostaglandins, and it is
reported that PTGS2 can be induced at sites of inflammation by
cytokines, growth factors, tumor promoters and other agents in
colorectal cancer (28). In the
present study, the mRNA levels of PTGS2 encoding
prostaglandin-endoperoxide synthase 2 increased in PTC (Figs. 4 and 5E), and an increased consumption of
arachidonic acid was observed, which forms the oncogenic lipid in
PTC. Therefore, the decrease of arachidonic acid can be explained
by an increased generation of prostaglandins in PTC.
Although several NMR-based metabolomic studies on
thyroid carcinomas have been reported (5–7),
the GC-MS-based metabolomic analysis of thyroid carcinomas has
never been reported. In the present GC-MS-based metabolomic study,
the metabolomic data could establish models with high degrees of
goodness-of-fit and cross validation predictive ability, and the
normal thyroid and tumor samples could be clearly separated,
suggesting this GC-MS-based metabolomic approach has a significant
potential in improving the diagnostic efficacy of PTC in
conjunction with current diagnostics. Further metabolomic studies
focusing on the diagnosis of thyroid cancers should be conducted
using urine and blood samples and require the involvement of benign
masses, as well as other pathological types of thyroid cancers to
provide non-invasive and rapid diagnostic techniques for thyroid
cancers (29).
In addition to the dysregulated metabolism pathway
in PTC, there was a change of N6-Acetyl-L-lysine.
N6-Acetyl-L-lysine is an acetylated amino acid that has critical
roles in regulating gene transcription, cell-cycle progression,
apoptosis, DNA repair and cytoskeletal organization. The observed
increase of N6-Acetyl-L-lysine indicates that an intracellular
signaling mechanism by post-translational lysine-acetylation may be
involved in the pathogenesis of PTC.
In conclusion, through using a novel integrated
analysis of metabolome and metabolic enzyme gene expression in PTC,
to the best of our knowledge the metabolite patterns and metabolic
networks in PTC have been shown for the first time. Various
metabolites that may be used for increased synthesis of nucleotide
and oncogenic lipid were identified in PTC via the increased
expression of associated metabolic enzyme genes, which may
contribute to the pathogenesis of PTC. The present study provides
an understanding of dysregulated metabolism in PTC and identifies
potential avenues for the therapeutic intervention for this
disease.
Acknowledgments
The present study was supported by the National
Natural Science Foundation of China (no. 81370920); the Natural
Science Foundation of Jiangsu Province (no. BK20131110); the
Project of 'Six Talents Peak of Jiangsu province (no.
2013WSN-023)'; the Open Project Funding of Jiangsu Province Key
Research for Molecular and Functional Laboratory (no. PYZX
2012004); the Jiangyin City Science and Technology Founded Project
(2014); and the Jiangsu Province Official Hospital Scientific
Research Initial Funding (RPF201501).
Abbreviations:
|
PTC
|
papillary thyroid carcinoma
|
|
NMR
|
nuclear magnetic resonance
|
|
GC
|
gas chromatography
|
|
MS
|
mass spectrometry
|
|
BSTFA
|
Bis-(trimethylsilyl)trifluoroacetamide
|
|
TMCS
|
trimethylchlorosilane
|
|
OPLS-DA
|
orthogonal partial least-squares
discriminate analysis
|
|
VIP
|
variable influence on projection
|
|
PCA
|
principal component analysis
|
|
PLS-DA
|
partial least-squares discriminant
analysis
|
|
PHGDH
|
phoshphoglycerate dehydrogenase
|
|
G6PD
|
glucose-6-phosphate dehydrogenase
|
|
PGK1
|
phosphoglycerate kinase 1
|
|
LDHA
|
lactate dehydrogenase A
|
|
PTGS2
|
prostaglandin-endoperoxide synthase
2
|
|
NAPDH
|
nicotinamide adenine dinucleotide
phosphate
|
|
RNR
|
ribonucleotide reductase
|
References
|
1
|
Wang Z, Klipfell E, Bennett BJ, Koeth R,
Levison BS, Dugar B, Feldstein AE, Britt EB, Fu X, Chung YM, et al:
Gut flora metabolism of phosphatidylcholine promotes cardiovascular
disease. Nature. 472:57–63. 2011. View Article : Google Scholar : PubMed/NCBI
|
|
2
|
Sreekumar A, Poisson LM, Rajendiran TM,
Khan AP, Cao Q, Yu J, Laxman B, Mehra R, Lonigro RJ, Li Y, et al:
Metabolomic profiles delineate potential role for sarcosine in
prostate cancer progression. Nature. 457:910–914. 2009. View Article : Google Scholar : PubMed/NCBI
|
|
3
|
Tritten L, Keiser J, Godejohann M,
Utzinger J, Vargas M, Beckonert O, Holmes E and Saric J: Metabolic
profiling framework for discovery of candidate diagnostic markers
of malaria. Sci Rep. 3:27692013. View Article : Google Scholar : PubMed/NCBI
|
|
4
|
Wang L, Chen J, Chen L, Deng P, Bu Q,
Xiang P, Li M, Lu W, Xu Y, Lin H, et al: 1H-NMR based metabonomic
profiling of human esophageal cancer tissue. Mol Cancer. 12:252013.
View Article : Google Scholar : PubMed/NCBI
|
|
5
|
Jordan KW, Adkins CB, Cheng LL and Faquin
WC: Application of magnetic-resonance-spectroscopy- based
metabolomics to the fine-needle aspiration diagnosis of papillary
thyroid carcinoma. Acta Cytol. 55:584–589. 2011. View Article : Google Scholar : PubMed/NCBI
|
|
6
|
Miccoli P, Torregrossa L, Shintu L,
Magalhaes A, Chandran J, Tintaru A, Ugolini C, Minuto MN, Miccoli
M, Basolo F, et al: Metabolomics approach to thyroid nodules: A
high-resolution magic-angle spinning nuclear magnetic
resonance-based study. Surgery. 152:1118–1124. 2012. View Article : Google Scholar : PubMed/NCBI
|
|
7
|
Deja S, Dawiskiba T, Balcerzak W,
Orczyk-Pawiłowicz M, Głód M, Pawełka D and Młynarz P: Follicular
adenomas exhibit a unique metabolic profile. ¹H NMR studies of
thyroid lesions. PLoS One. 8:e846372013. View Article : Google Scholar
|
|
8
|
Chen M, Zhou K, Chen X, Qiao S, Hu Y, Xu
B, Xu B, Han X, Tang R, Mao Z, et al: Metabolomic analysis reveals
metabolic changes caused by bisphenol A in rats. Toxicol Sci.
138:256–267. 2014. View Article : Google Scholar : PubMed/NCBI
|
|
9
|
Wu H, Xue R, Lu C, Deng C, Liu T, Zeng H,
Wang Q and Shen X: Metabolomic study for diagnostic model of
oesophageal cancer using gas chromatography/mass spectrometry. J
Chromatogr B Analyt Technol Biomed Life Sci. 877:3111–3117. 2009.
View Article : Google Scholar : PubMed/NCBI
|
|
10
|
Wu H, Xue R, Tang Z, Deng C, Liu T, Zeng
H, Sun Y and Shen X: Metabolomic investigation of gastric cancer
tissue using gas chromatography/mass spectrometry. Anal Bioanal
Chem. 396:1385–1395. 2010. View Article : Google Scholar
|
|
11
|
DeLellis RA, Lloyd RV, Heitz PU and Eng C:
Pathology and Genetics of Tumours of Endocrine Organs. 8. 3rd
edition. World Health Organization; Lyon, France: IARC Press;
2004
|
|
12
|
Booth SC, Workentine ML, Wen J,
Shaykhutdinov R, Vogel HJ, Ceri H, Turner RJ and Weljie AM:
Differences in metabolism between the biofilm and planktonic
response to metal stress. J Proteome Res. 10:3190–3199. 2011.
View Article : Google Scholar : PubMed/NCBI
|
|
13
|
Qiu Y, Cai G, Zhou B, Li D, Zhao A, Xie G,
Li H, Cai S, Xie D, Huang C, et al: A distinct metabolic signature
of human colorectal cancer with prognostic potential. Clin Cancer
Res. 20:2136–2146. 2014. View Article : Google Scholar : PubMed/NCBI
|
|
14
|
Ferreira ID, Rosário VE and Cravo PV:
Real-time quantitative PCR with SYBR Green I detection for
estimating copy numbers of nine drug resistance candidate genes in
Plasmodium falciparum. Malar J. 5:12006. View Article : Google Scholar : PubMed/NCBI
|
|
15
|
Slupsky CM, Steed H, Wells TH, Dabbs K,
Schepansky A, Capstick V, Faught W and Sawyer MB: Urine metabolite
analysis offers potential early diagnosis of ovarian and breast
cancers. Clin Cancer Res. 16:5835–5841. 2010. View Article : Google Scholar : PubMed/NCBI
|
|
16
|
Chen T, Xie G, Wang X, Fan J, Qiu Y, Zheng
X, Qi X, Cao Y, Su M, Wang X, et al: Serum and urine metabolite
profiling reveals potential biomarkers of human hepatocellular
carcinoma. Mol Cell Proteomics. 10:M110 0049452011. View Article : Google Scholar : PubMed/NCBI
|
|
17
|
Cai Z, Zhao JS, Li JJ, Peng DN, Wang XY,
Chen TL, Qiu YP, Chen PP, Li WJ, Xu LY, et al: A combined
proteomics and metabolomics profiling of gastric cardia cancer
reveals characteristic dysregulations in glucose metabolism. Mol
Cell Proteomics. 9:2617–2628. 2010. View Article : Google Scholar : PubMed/NCBI
|
|
18
|
Parman T, Bunin DI, Ng HH, McDunn JE,
Wulff JE, Wang A, Swezey R, Rasay L, Fairchild DG, Kapetanovic IM,
et al: Toxicogenomics and metabolomics of pentamethylchromanol
(PMCol)-induced hepatotoxicity. Toxicol Sci. 124:487–501. 2011.
View Article : Google Scholar : PubMed/NCBI
|
|
19
|
Goedert JJ, Sampson JN, Moore SC, Xiao Q,
Xiong X, Hayes RB, Ahn J, Shi J and Sinha R: Fecal metabolomics:
Assay performance and association with colorectal cancer.
Carcinogenesis. 35:2089–2096. 2014. View Article : Google Scholar : PubMed/NCBI
|
|
20
|
Mathé EA, Patterson AD, Haznadar M, Manna
SK, Krausz KW, Bowman ED, Shields PG, Idle JR, Smith PB, Anami K,
et al: Noninvasive urinary metabolomic profiling identifies
diagnostic and prognostic markers in lung cancer. Cancer Res.
74:3259–3270. 2014. View Article : Google Scholar : PubMed/NCBI
|
|
21
|
Zhang AH, Sun H, Qiu S and Wang XJ:
Metabolomics in noninvasive breast cancer. Clin Chim Acta. 424:3–7.
2013. View Article : Google Scholar : PubMed/NCBI
|
|
22
|
Hayaishi O and Kornberg A: Metabolism of
cytosine, thymine, uracil, and barbituric acid by bacterial
enzymes. J Biol Chem. 197:717–732. 1952.PubMed/NCBI
|
|
23
|
Elledge SJ, Zhou Z and Allen JB:
Ribonucleotide reductase: Regulation, regulation, regulation.
Trends Biochem Sci. 17:119–123. 1992. View Article : Google Scholar : PubMed/NCBI
|
|
24
|
Anastasiou D, Poulogiannis G, Asara JM,
Boxer MB, Jiang JK, Shen M, Bellinger G, Sasaki AT, Locasale JW,
Auld DS, et al: Inhibition of pyruvate kinase M2 by reactive oxygen
species contributes to cellular antioxidant responses. Science.
334:1278–1283. 2011. View Article : Google Scholar : PubMed/NCBI
|
|
25
|
Chan EC, Koh PK, Mal M, Cheah PY, Eu KW,
Backshall A, Cavill R, Nicholson JK and Keun HC: Metabolic
profiling of human colorectal cancer using high-resolution magic
angle spinning nuclear magnetic resonance (HR-MAS NMR) spectroscopy
and gas chromatography mass spectrometry (GC/MS). J Proteome Res.
8:352–361. 2009. View Article : Google Scholar
|
|
26
|
Lamers Y, Williamson J, Ralat M, Quinlivan
EP, Gilbert LR, Keeling C, Stevens RD, Newgard CB, Ueland PM, Meyer
K, et al: Moderate dietary vitamin B-6 restriction raises plasma
glycine and cystathionine concentrations while minimally affecting
the rates of glycine turnover and glycine cleavage in healthy men
and women. J Nutr. 139:452–460. 2009. View Article : Google Scholar : PubMed/NCBI
|
|
27
|
Nomura DK, Long JZ, Niessen S, Hoover HS,
Ng SW and Cravatt BF: Monoacylglycerol lipase regulates a fatty
acid network that promotes cancer pathogenesis. Cell. 140:49–61.
2010. View Article : Google Scholar : PubMed/NCBI
|
|
28
|
Wang D, Xia D and Dubois RN: The crosstalk
of PTGS2 and EGF signaling pathways in colorectal cancer. Cancers
(Basel). 3:3894–3908. 2011. View Article : Google Scholar
|
|
29
|
Brindle JT, Antti H, Holmes E, Tranter G,
Nicholson JK, Bethell HW, Clarke S, Schofield PM, McKilligin E,
Mosedale DE, et al: Rapid and noninvasive diagnosis of the presence
and severity of coronary heart disease using 1H-NMR-based
meta-bonomics. Nat Med. 8:1439–1444. 2002. View Article : Google Scholar : PubMed/NCBI
|