Introduction
Sepsis, which is a systemic inflammatory syndrome,
is triggered by severe infections (1). Infection is the most common and
serious complication for the patients with a major burn (2). Once the burn wound is infected by
the bacteria, bacterium could rapidly proliferate within the
damaged tissue, which leads to sepsis and septic shock (3). Previously, it was reported that
50–60% of burn patients with sepsis succumb to the condition
(4). Therefore, it is of great
urgency to establish the mechanism of burn sepsis.
Previously, a study by Beffa et al (4) indicated that the interleukin 6
levels in burn mice were significantly increased by cecal ligation
and puncture (CLP). However, the interleukin 6 levels did not
decrease in the recovery patients following treatment with statin
showing that there should be other mechanisms of sepsis in the burn
patients. Additionally, high levels of interleukin 8 are correlated
with increased multi-organ failure, sepsis and mortality in
post-burn patients (5).
Additionally, intestinal regulatory T cell expression has been
found to exert immunosuppressive effects on other intestinal T
lymphocytes and be closely associated with endotoxin translocation
in porcine sepsis following severe burns injuries (6). However, the molecular mechanism of
burn sepsis remains unclear.
In 2007, Banta et al (7) used moderate burn injury followed by
CLP (used for producing sepsis) to construct three groups of rats:
Sham Burn-Sham CLP (Sham-Sham), Sham Burn-CLP (Sham-CLP) and
Burn-CLP. Subsequently, a microarray expression profile was
conducted to screen the differentially expressed genes with the
methods of significance analysis of microarrays and false discovery
rate of 10% to investigate the contribution of gene expression to
metabolic fluxes in hyper-metabolic livers induced by burn injury
and CLP in rats and identified that burn injury combined with CLP
led to the most significant changes, while CLP alone significantly
increased metabolic gene expression; however, it decreased a number
of the corresponding metabolic fluxes.
The present study aimed to use the same microarray
data to further screen the DEGs between Sham-CLP and Sham-Sham,
Burn-CLP and Sham-Sham, as well as Burn-CLP and Sham-CLP with the
limma package based on the criteria of P<0.05 and
|log2fold change (FC)| ≥2 and collected the specific
genes associated with burn sepsis. Additionally, the Kyoto
Encyclopedia of Genes and Genomes (KEGG) pathway enrichment,
transcription factor screening, protein-protein interaction (PPI)
network construction and co-expression analysis of DEGs were also
conducted to illustrate the mechanism of burn sepsis. A previous
study proposed that analysis based on differential statistical
tests may result in different outcomes (8). Therefore, we hypothesized that
certain different results may be obtained from the data of Banta
et al (7).
Materials and methods
Microarray data
The expression profile of GSE1781 deposited by Banta
et al (7) was downloaded
from Gene Expression Omnibus (GEO; http://www.ncbi.nlm.nih.gov/geo/), which was based on
the platform of the GPL341 [RAE230A] Affymetrix Rat Expression 230A
array. GSE1781 included a collection of three biological replicates
for each of the three conditions: Sham-Sham, Sham-CLP and
Burn-CLP.
Data preprocessing and DEGs
screening
The downloaded data were normalized using preprocess
Core (9). The probes, which were
not mapped to the corresponding gene symbols, were abandoned.
Furthermore, the average expression value was used for the genes
corresponding to multiple probes. Subsequently, the limma (linear
models for microarray data) package in R/Bioconductor was employed
to screen the DEGs between Sham-CLP and Sham-Sham, Burn-CLP and
Sham-Sham, as well as Burn-CLP and Sham-CLP. P<0.05 and
|log2FC| ≥2 were used as the cut-off criteria for the
DEGs.
Pathway enrichment analysis
The Database for Annotation, Visualization and
Integrated Discovery is a collection of functional annotation tools
for investigators to study the biological meaning behind a large
list of genes (10). The KEGG
pathway database (http://www.genome.jp/kegg/pathway.html), which
includes the functions in terms of the network of the interacting
molecules, was used to perform the pathway enrichment for the DEGs
(11). P<0.05 was the
threshold for the pathway enrichment analysis.
Transcription factors screening
The transcriptional regulation from patterns to
profiles (TRANSFAC) database (http://www.gene-regulation.com) containing the data on
transcription factors, their target genes and regulatory binding
sites was applied to discover the transcription factors (12). Additionally, different
transcription factors between the Sham-CLP and Burn-CLP were
further analyzed.
PPI network construction
The interaction associations of the proteins were
analyzed using the online tool Search Tool for the Retrieval of
Interacting Genes (STRING; http://string-db.org/) (13) and the required confidence
(combined score) ≥0.4 was used as the cut-off criterion.
Subsequently, Cytoscape was used to visualize the network (14).
Co-expression analysis of DEGs in
Burn-CLP compared with Sham-Sham and Sham-CLP
The union of DEGs in Burn-CLP and Sham-Sham, as well
as the DEGs in Burn-CLP and Sham-CLP, was screened. Subsequently,
CoExpress (http://www.bioinformatics.lu/CoExpress/) was employed
to calculate the correlation coefficient of the DEGs. Pearson
correlation coefficient was used to reflect the expression
correlation between the DEGs. The Pearson correlation coefficient
>0.9 was taken as the threshold.
Results
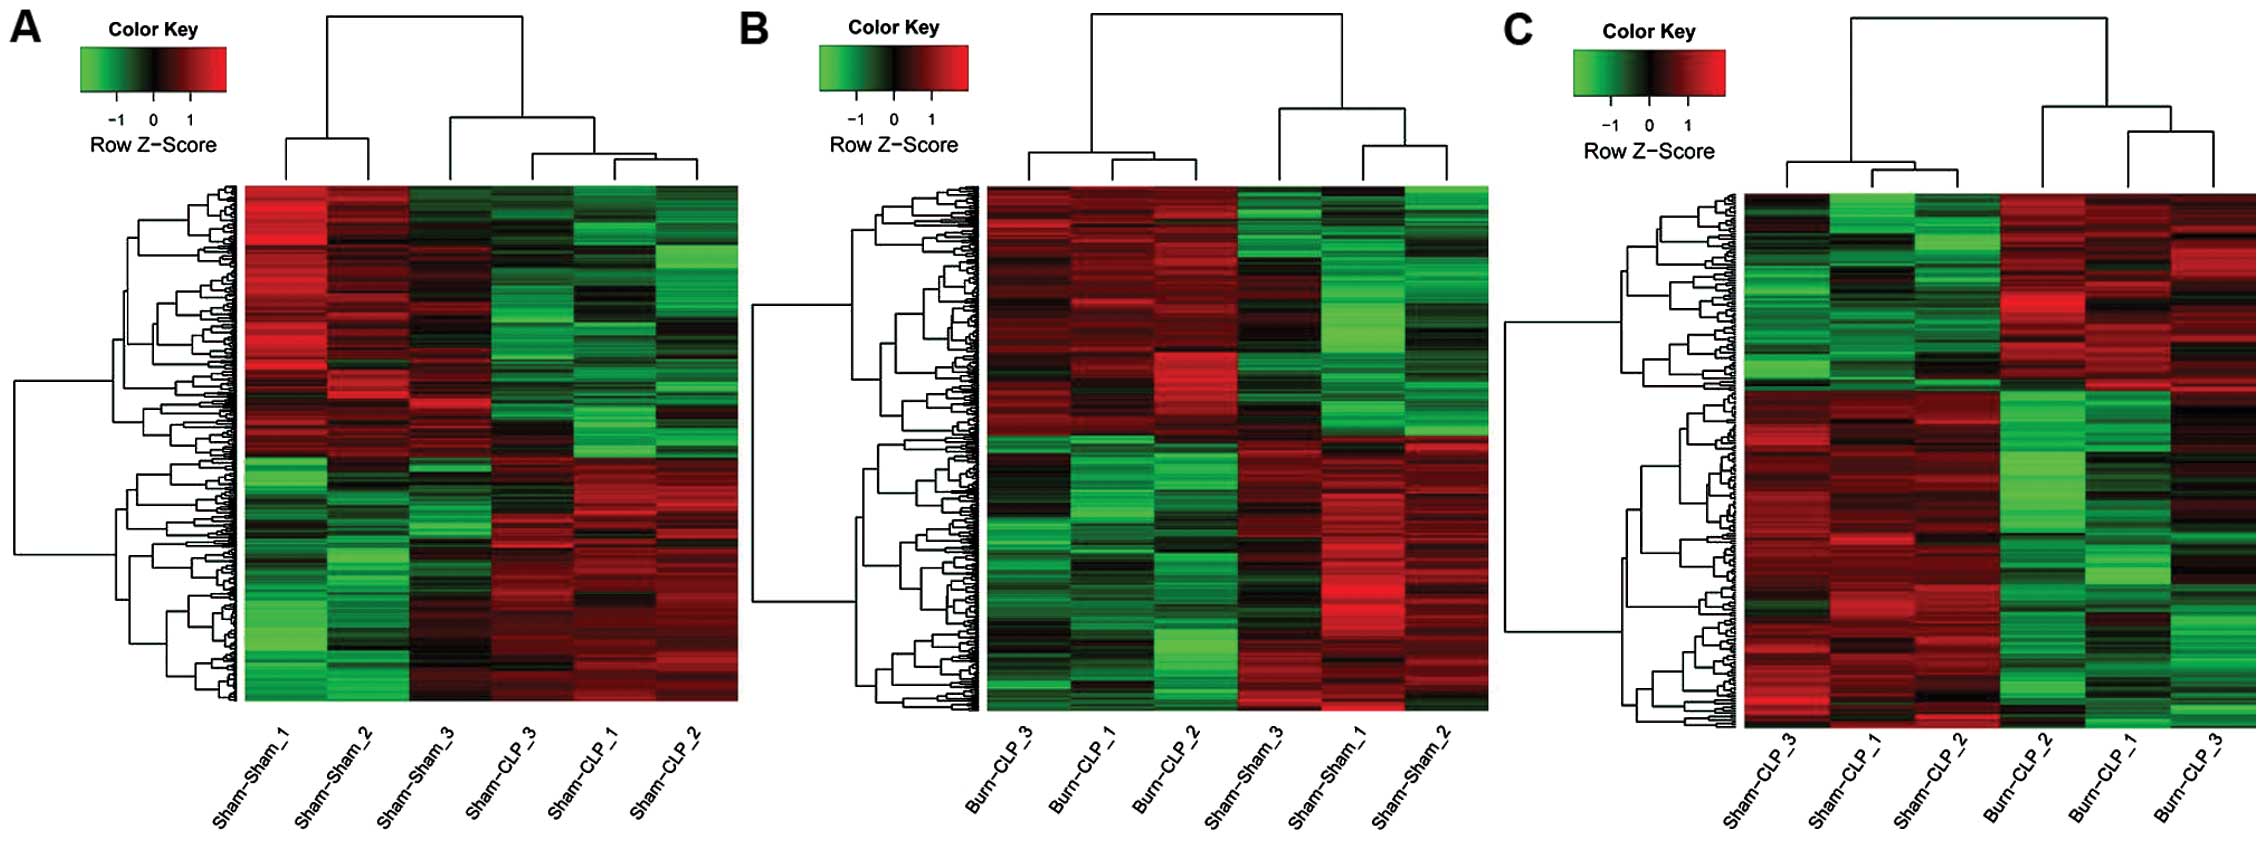
DEG analysis
Compared with Sham-Sham, a total of 476 DEGs
(including 225 upregulated DEGs, such as Lcn2 and
Zfhx2, and 251 downregulated DEGs, such as Tnnt1 and
Sv2a) and 682 DEGs (including 324 upregulated DEGs, such as
Arl6ip6 and Pla2g2a, and 358 downregulated DEGs, such
as Acadm and Ehhadh) were obtained in Sham-CLP and
Burn-CLP, respectively. Additionally, 230 DEGs, including 85
upregulated DEGs, such as Rbbp9 and Clca4, and 145 downregulated
DEGs, such as Igfals and G0s2, were screened in
Burn-CLP compared with Sham-CLP. The 10 most significantly
upregulated and downregulated DEGs are listed in Table I. Additionally, the hierarchical
cluster analysis is shown in Fig.
1.
 | Table ITen most significantly upregulated
and downregulated DEGs in Sham-CLP and Burn-CLP compared with
Sham-Sham and the DEGs in Burn-CLP compared with Sham-CLP. |
Table I
Ten most significantly upregulated
and downregulated DEGs in Sham-CLP and Burn-CLP compared with
Sham-Sham and the DEGs in Burn-CLP compared with Sham-CLP.
| Sham-CLP vs.
Sham-Sham
| Burn-CLP vs.
Sham-Sham
| Burn-CLP vs.
Sham-CLP
|
|---|
| DEGs | logFC | P-value | DEGs | logFC | P-value | DEGs | logFC | P-value |
|---|
| Upregulated | Lcn2 | 4.602548 |
3.83×10⁻⁸ | Arl6ip6 | 5.066561 | 0.008025 | Rbbp9 | 3.296154 | 0.027772 |
| Zfhx2 | 4.02276 | 0.000262 | Pla2g2a | 4.675226 |
5.34×10⁻⁷ | Clca4 | 3.295737 |
1.43×10⁻⁵ |
| Pla2g2a | 3.445816 |
5.64×10⁻⁶ | Lcn2 | 4.596656 |
3.86×10⁻⁸ | Taf1 | 2.915533 | 0.023838 |
| Plscr2 | 3.371389 | 0.037682 | Neb | 4.304198 | 0.000744 | Tnnt1 | 2.829013 |
6.28×10⁻⁵ |
| Neb | 3.345386 | 0.003449 | Zfhx2 | 4.267401 | 0.000174 |
Ppargc1a | 2.749841 | 0.036676 |
| Itgb3bp | 3.148196 | 0.005818 | S100a9 | 3.878773 | 0.000332 | Stard7 | 2.74522 | 0.004186 |
| Nfyb | 3.076118 | 0.006189 | Plscr2 | 3.500379 | 0.032474 | Pitx2 | 2.567246 | 0.015435 |
| Eif4e3 | 3.026708 | 0.004705 | Ly49s7 | 3.315606 |
9.63×10⁻⁵ | Smim3 | 2.395974 | 0.005767 |
| Mmrn1 | 3.011887 | 0.010381 | Ddit4 | 3.230954 | 0.009239 | Aurka | 2.347335 | 0.002993 |
| Sall2 | 2.919577 | 0.03118 | Sall2 | 3.217558 | 0.020624 |
Rnf113a1 | 2.168197 | 0.011317 |
| Downregulated | Tnnt1 | −4.03526 |
4.48×10⁻⁶ | G0s2 | −5.3812 | 0.005036 | G0s2 | −5.50634 | 0.004437 |
| Sv2a | −3.9502 | 0.001074 | Igfals | −4.95741 | 0.001784 | Igfals | −4.2644 | 0.004283 |
| Pitx2 | −3.73666 | 0.002074 | Bdh1 | −4.40114 | 0.009124 | Bdh1 | −3.23361 | 0.036533 |
| Klk1 | −3.43142 | 0.00292 | Hsd17b2 | −4.07748 | 0.001695 | Tpgs1 | −2.91959 | 0.000561 |
| Scgb1d2 | −3.30923 | 0.000102 | Nim1 | −3.73986 | 0.005966 | Tmed1 | −2.74594 |
8.49×10⁻⁶ |
| Rbbp9 | −3.25999 | 0.029075 | Car3 | −3.69018 | 0.000853 | Rnf213 | −2.64719 | 0.002884 |
|
LOC691984 | −3.22479 | 0.017167 | Nrep | −3.53501 | 0.000151 | S1pr3 | −2.6437 | 0.010497 |
| Kcnj1 | −3.19046 | 0.003682 | Lsp1 | −3.15146 | 0.00084 | Car3 | −2.64229 | 0.006101 |
| Gpr85 | −3.16711 | 0.000145 | Fabp3 | −3.10453 | 0.000821 | Gpr108 | −2.62186 | 0.012436 |
| Atp1a4 | −3.12916 | 0.015975 | Apol9a | −3.09277 | 0.000172 | Obfc1 | −2.56692 | 0.001367 |
KEGG pathway enrichment
Compared with Sham-Sham, the upregulated DEGs, such
as Cxcl14, Cxcl16 and Cxcr4, in Burn-CLP were
significantly enriched in the chemokine-signaling pathway (P=0.015)
(Table II). The downregulated
DEGs, such as Acadm and Ehhadh, were significantly
enriched in the PPAR signaling pathway (P=8.298×10⁻⁴).
Additionally, Gsta3, Gstm2 and Gstt1 in
Burn-CLP were significantly enriched in glutathione metabolism
(P=0.023) (Table III).
| Table IIKEGG pathway enrichments for the
upregulated DEGs in the Sham-CLP and Burn-CLP compared with
Sham-Sham. |
Table II
KEGG pathway enrichments for the
upregulated DEGs in the Sham-CLP and Burn-CLP compared with
Sham-Sham.
| Groups | KEGG | P-value | Gene symbol |
|---|
| Sham-CLP vs.
Sham-Sham | rno00900: Terpenoid
backbone biosynthesis |
3.85×10⁻⁵ | Acat2, Fdps,
Hmgcr, Idi1, Mvd |
| rno00100: Steroid
biosynthesis |
8.85×10⁻⁵ | Cyp51, Ebp,
Hsd17b7, Lss, Sqle |
| rno04520: Adherens
junction | 0.004 | Acvr1c, Crebbp,
Csnk2a1, Ptpn1, Ptprj, Ssx2ip |
| Burn-CLP vs.
Sham-Sham | rno00830: Retinol
metabolism | 0.005 | Cyp1a1, Cyp26a1,
Cyp2b12, Cyp3a9, Dhrs9, RGD1562200 |
| rno04060:
Cytokine-cytokine receptor interaction | 0.012 | Amhr2, Ccr1,
Csf1r, Cxcl14, Cxcl16, Cxcr4, Il1rap, Lifr, Pf4, Tnfrsf21 |
| rno04062: Chemokine
signaling pathway | 0.015 | Adcy3, Ccr1,
Cxcl14, Cxcl16, Cxcr4, Grk5, Pf4, Rock1, Wasl |
| Table IIIKEGG pathway enrichments with the
downregulated DEGs in Sham-CLP and Burn-CLP compared with Sham-Sham
and the downregulated DEGs in Burn-CLP compared with Sham-CLP. |
Table III
KEGG pathway enrichments with the
downregulated DEGs in Sham-CLP and Burn-CLP compared with Sham-Sham
and the downregulated DEGs in Burn-CLP compared with Sham-CLP.
| Groups | KEGG | P-value | Gene symbol |
|---|
| Sham-CLP vs.
Sham-Sham | rno04080:
Neuroactive ligand-receptor interaction |
6.575×10⁻⁴ | Adrb2, Agtr1b,
F2rl3, Gabrb1, Galr3, Glra3, Glrb, Htr1a, Lpar2, P2rx5, Pth2r,
Tacr3 |
| rno04260: Cardiac
muscle contraction | 0.004 | Atp1a4, Cacnb1,
Cox6a2, Cox8b, Fxyd2, Myl3 |
| rno05218:
Melanoma | 0.013 | Fgf13, Fgf18,
Fgf7, Mapk3, Pdgfa |
| rno04660: T cell
receptor signaling pathway | 0.015 | Cd28, Cd8a,
Cd8b, Il2, Mapk3, Tnf |
| rno04640:
Hematopoietic cell lineage | 0.020 | Cd2, Cd8a, Cd8b,
Il3, Tnf |
| rno04010: MAPK
signaling pathway | 0.025 | Cacnb1, Fgf13,
Fgf18, Fgf7, Hspa1l, Mapk3, Pdgfa, Pla2g1b, Tnf |
| rno05330: Allograft
rejection | 0.034 | Cd28, Il12a,
Il2, Tnf |
| rno04940: Type I
diabetes mellitus | 0.047 | Cd28, Il12a,
Il2, Tnf |
| rno04514: Cell
adhesion | 0.048 | Cd2, Cd28, Cd8a,
Cd8b, Mpzl1, Nrxn3 |
| molecules
(CAMs) | | |
| rno04060:
Cytokine-cytokine | 0.048 | Agtr1b, Cx3cl1,
Il12a, Il2, Il3, Pdgfa, |
| receptor
interaction | | Tnf |
| Burn-CLP vs.
Sham-Sham | rno00650: Butanoate
metabolism |
6.634×10⁻⁴ | Aldh3a2, Bdh1,
Bdh2, Ehhadh, Hmgcs2, Pdha2 |
| rno03320: PPAR
signaling pathway |
8.298×10⁻⁴ | Acadm, Angptl4,
Ehhadh, Fabp3, Fabp7, Fads2, Gk, Hmgcs2 |
| rno00561:
Glycerolipid metabolism | 0.003 | Aldh3a2, Dak,
Gk, Lipc, Mgll, Pnliprp2 |
| rno00410: β-Alanine
metabolism | 0.016 | Acadm, Aldh3a2,
Dpys, Ehhadh |
| rno00072: Synthesis
and degradation of ketone bodies | 0.015 | Bdh1, Bdh2,
Hmgcs2 |
| rno00480:
Glutathione metabolism | 0.023 | Gsta3, Gstm2,
Gstt1, Idh1, Oplah |
| Burn-CLP vs.
Sham-CLP | rno00072: Synthesis
and degradation of ketone bodies | 0.004 | Acat2, Bdh1,
Bdh2 |
| rno00140: Steroid
hormone biosynthesis | 0.011 | Cyp17a1,
Hsd17b1, Hsd17b2, Sult2a2 |
| rno00650: Butanoate
metabolism | 0.050 | Acat2, Bdh1,
Bdh2 |
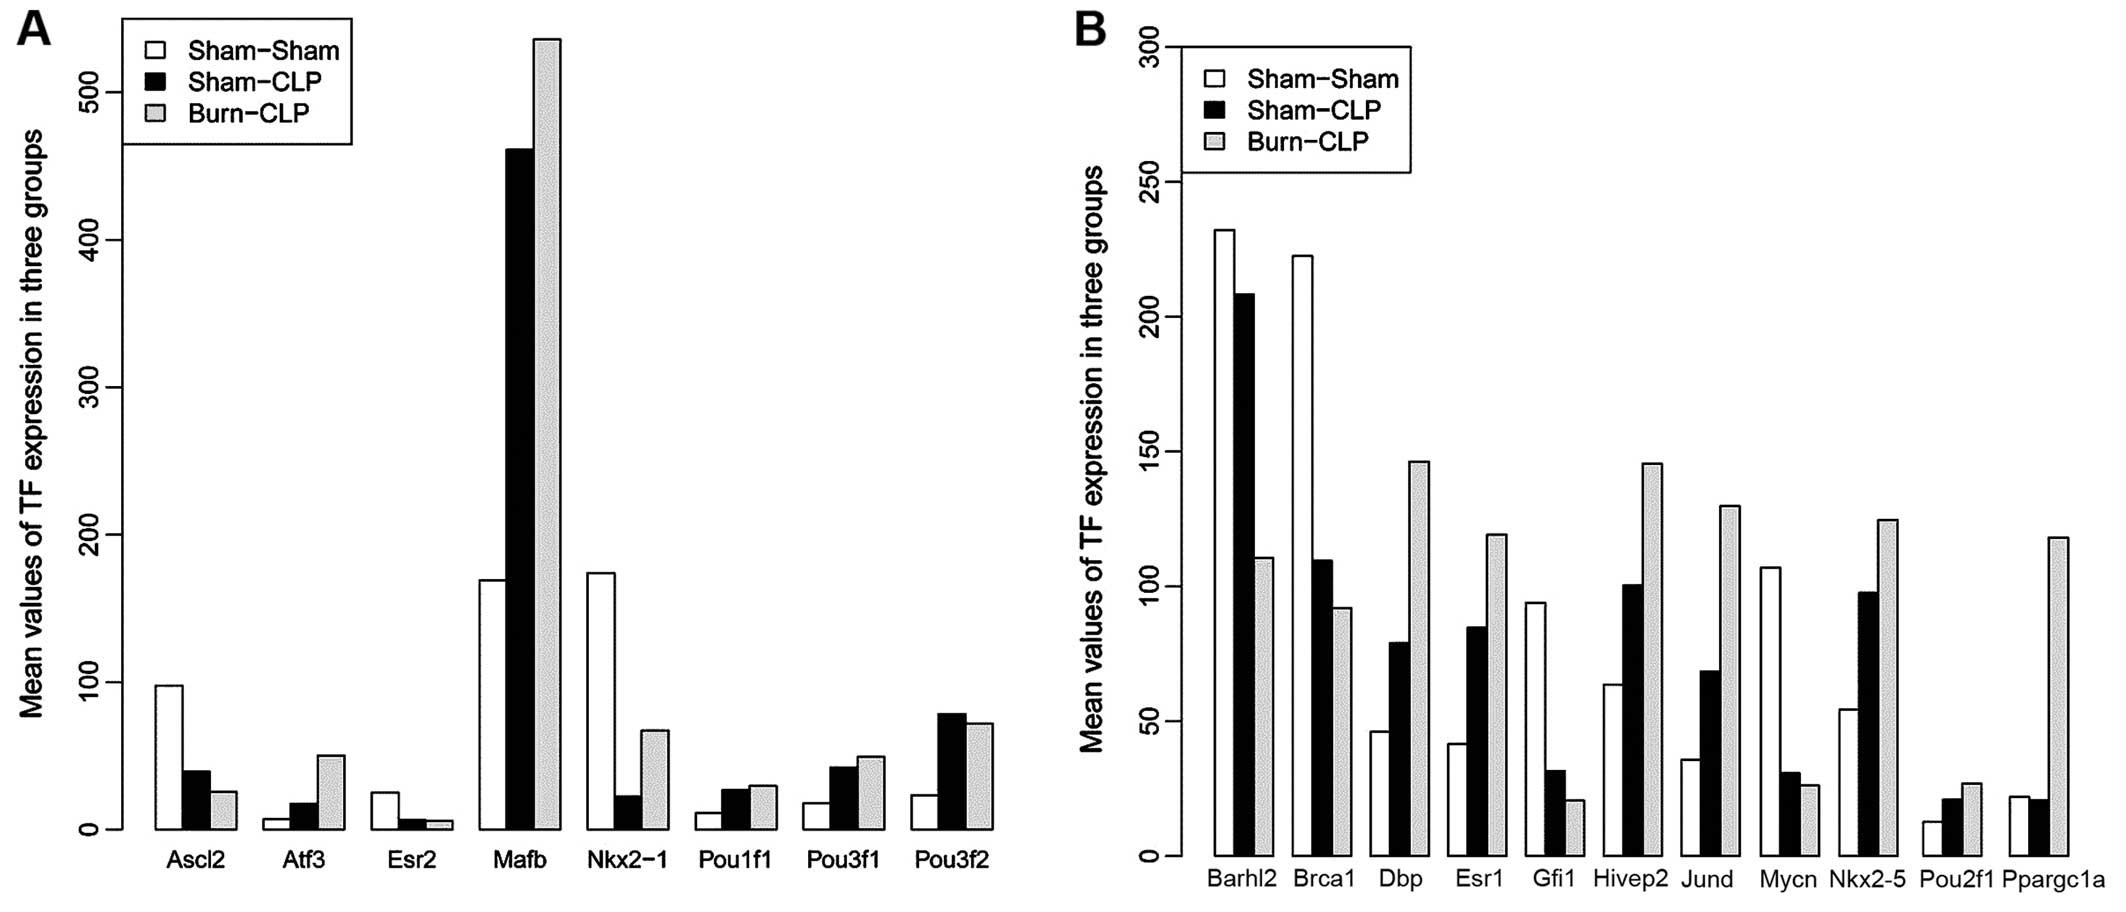
Transcription factor analysis
According to the TRANSFAC database, a total of 18
(including Ascl2 and Atf3) and 19 (including
Ascl2 and Ppargc1a) transcription factors were
screened among the DEGs in Sham-CLP and Burn-CLP, respectively,
compared with Sham-Sham. Additionally, Sham-CLP and Burn-CLP
possessed 8 identical transcription factors (Fig. 2A). Their expression levels are
exhibited in Fig. 2. Apart from
these 8 transcription factors, there were 11 transcription factors
(including Ppargc1a and DBP) in Burn-CLP compared
with Sham-Sham (Fig. 2B).
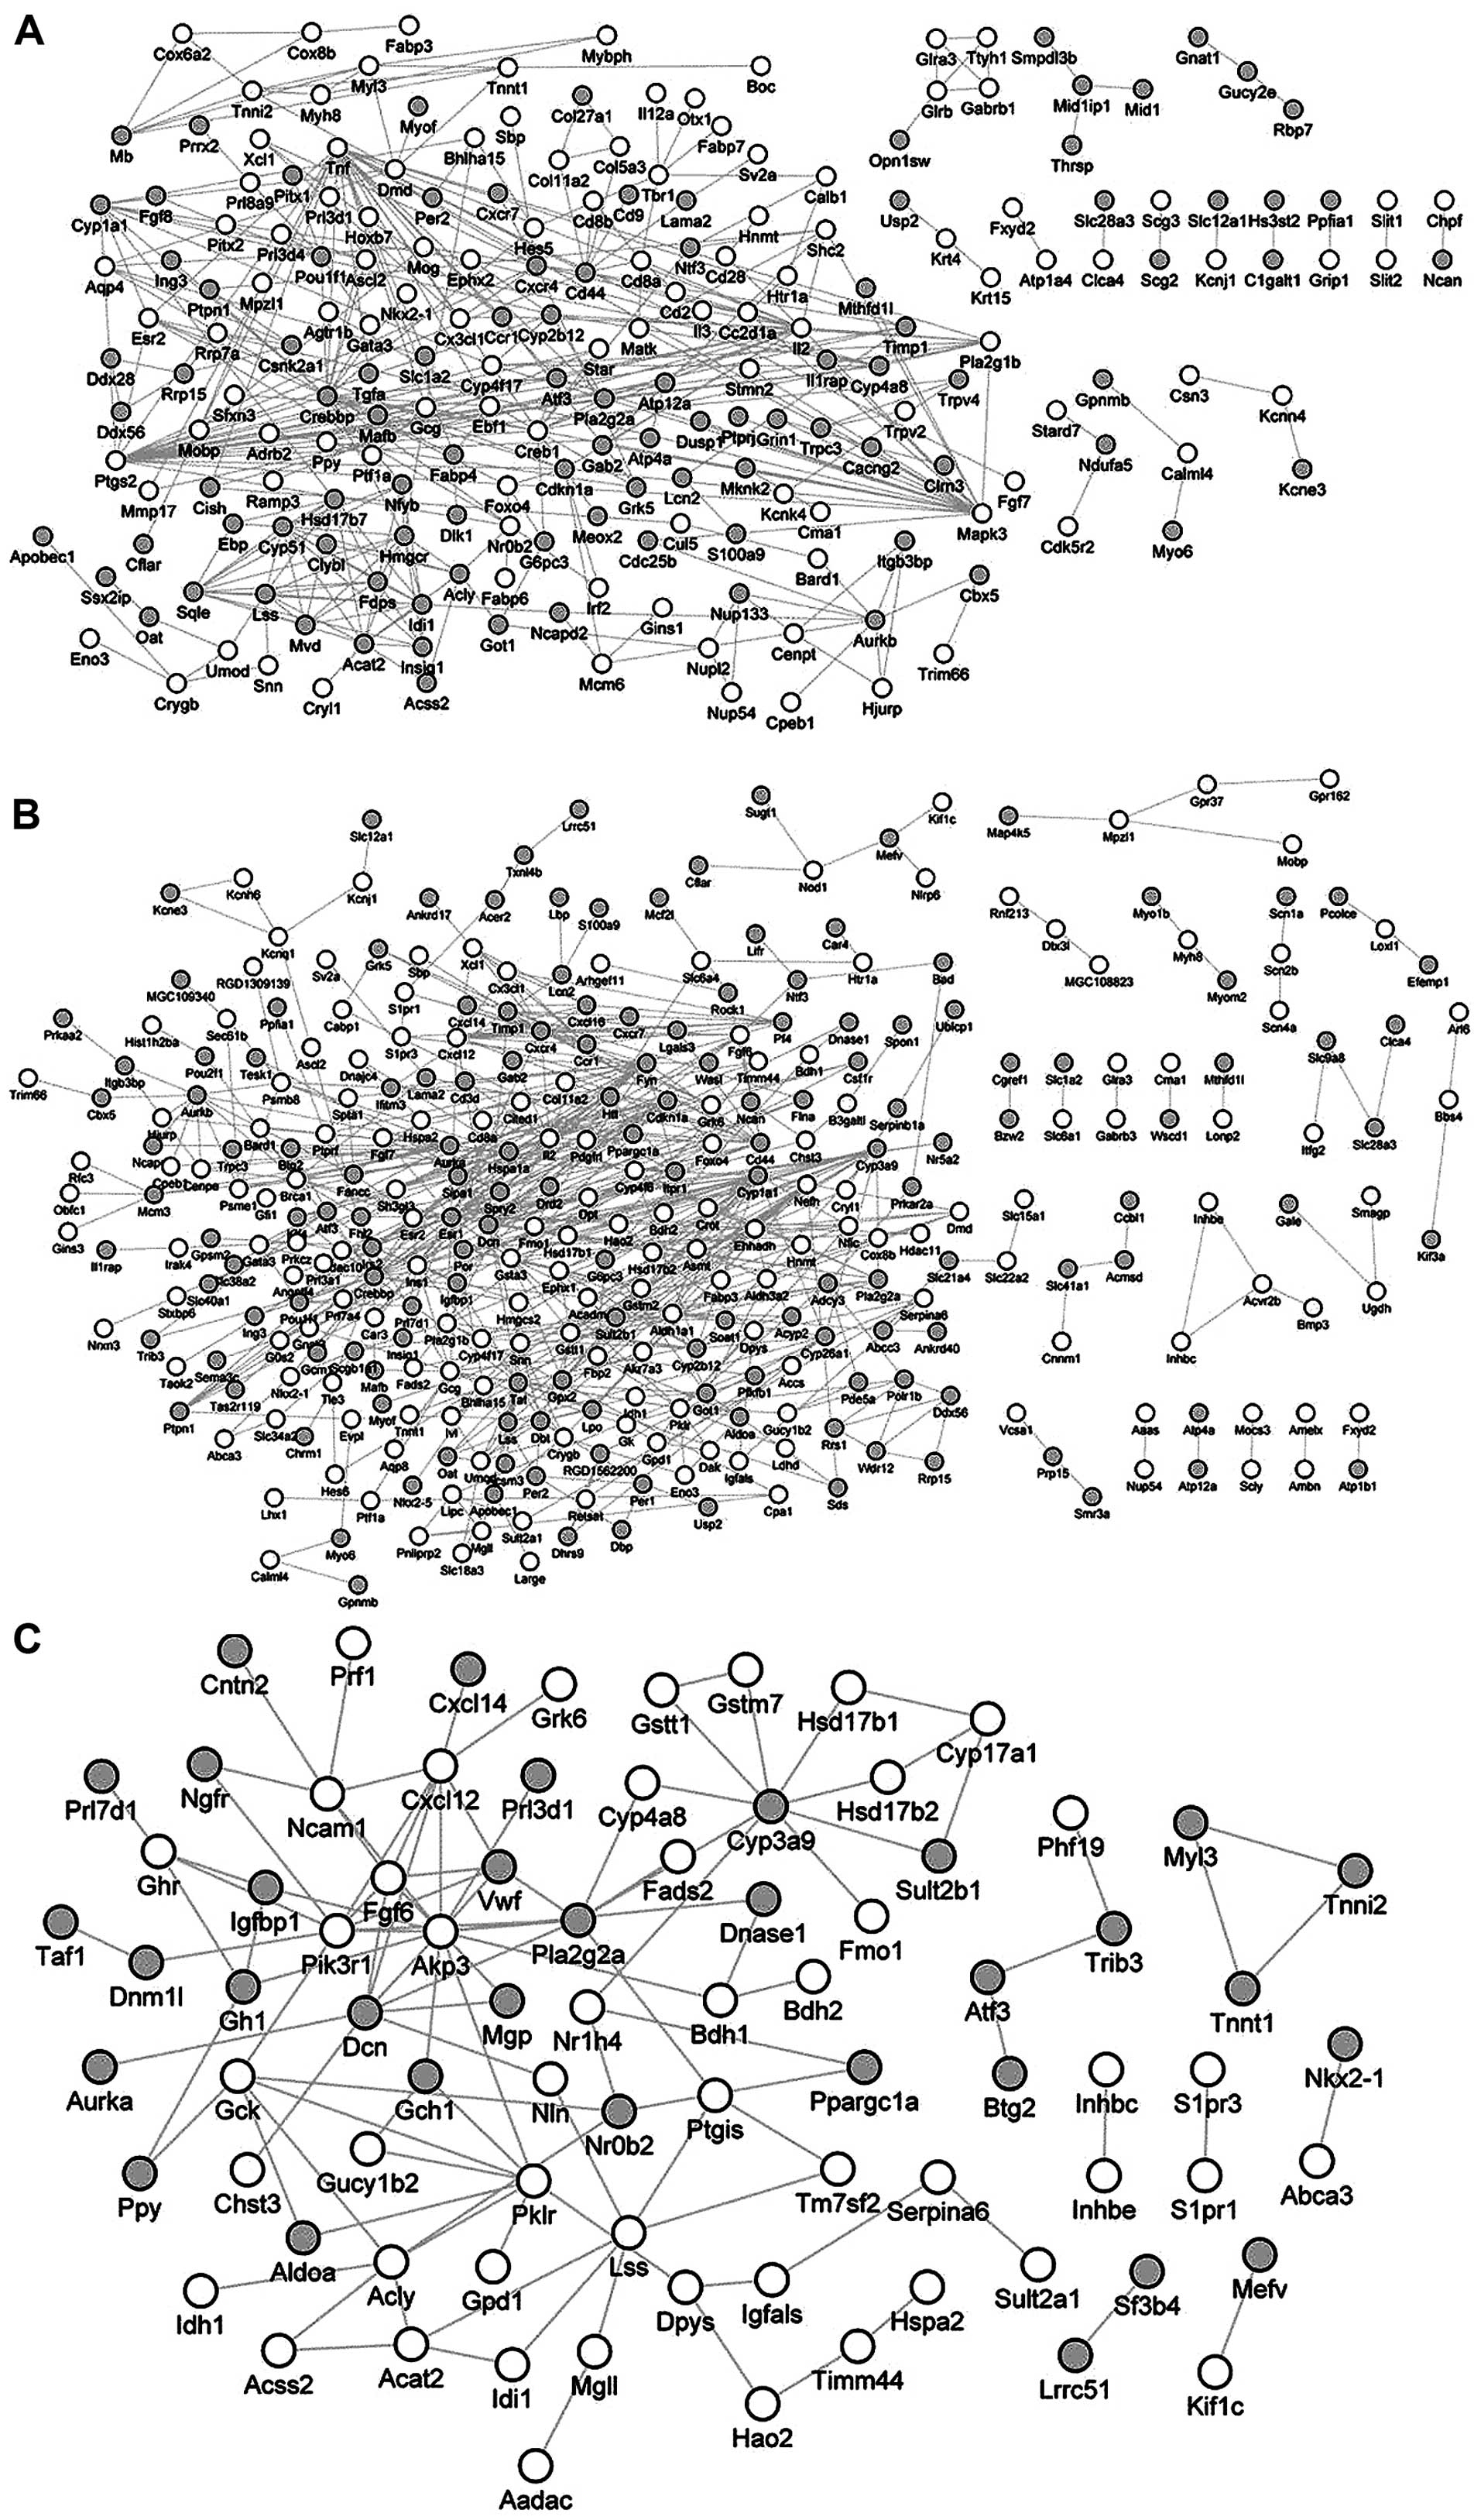
PPI network analysis
The PPI network for the DEGs in the three comparison
groups: Sham-Sham versus Sham-CLP, Sham-Sham versus Burn-CLP.
Burn-CLP versus Sham-CLP, are shown in Fig. 3C. For the DEGs between Sham-Sham
and Sham-CLP, a total of 361 pairs of PPI were obtained from the
STRING database. In the PPI network, Tnf possessed the
highest degree of 25 (Fig. 3A).
Additionally, for the DEGs between Sham-Sham and Burn-CLP, a total
of 595 pairs of PPI were obtained. In the PPI network, Esr1
had the highest degree of 31 and Ppargc1a could interact
with Angptl4 (Fig. 3B). As
for the DEGs between Burn-CLP and Sham-CLP, a total of 110 pairs of
PPI were obtained. In the PPI network, Pik3r1 had the
highest degree of 9 (Fig.
3C).
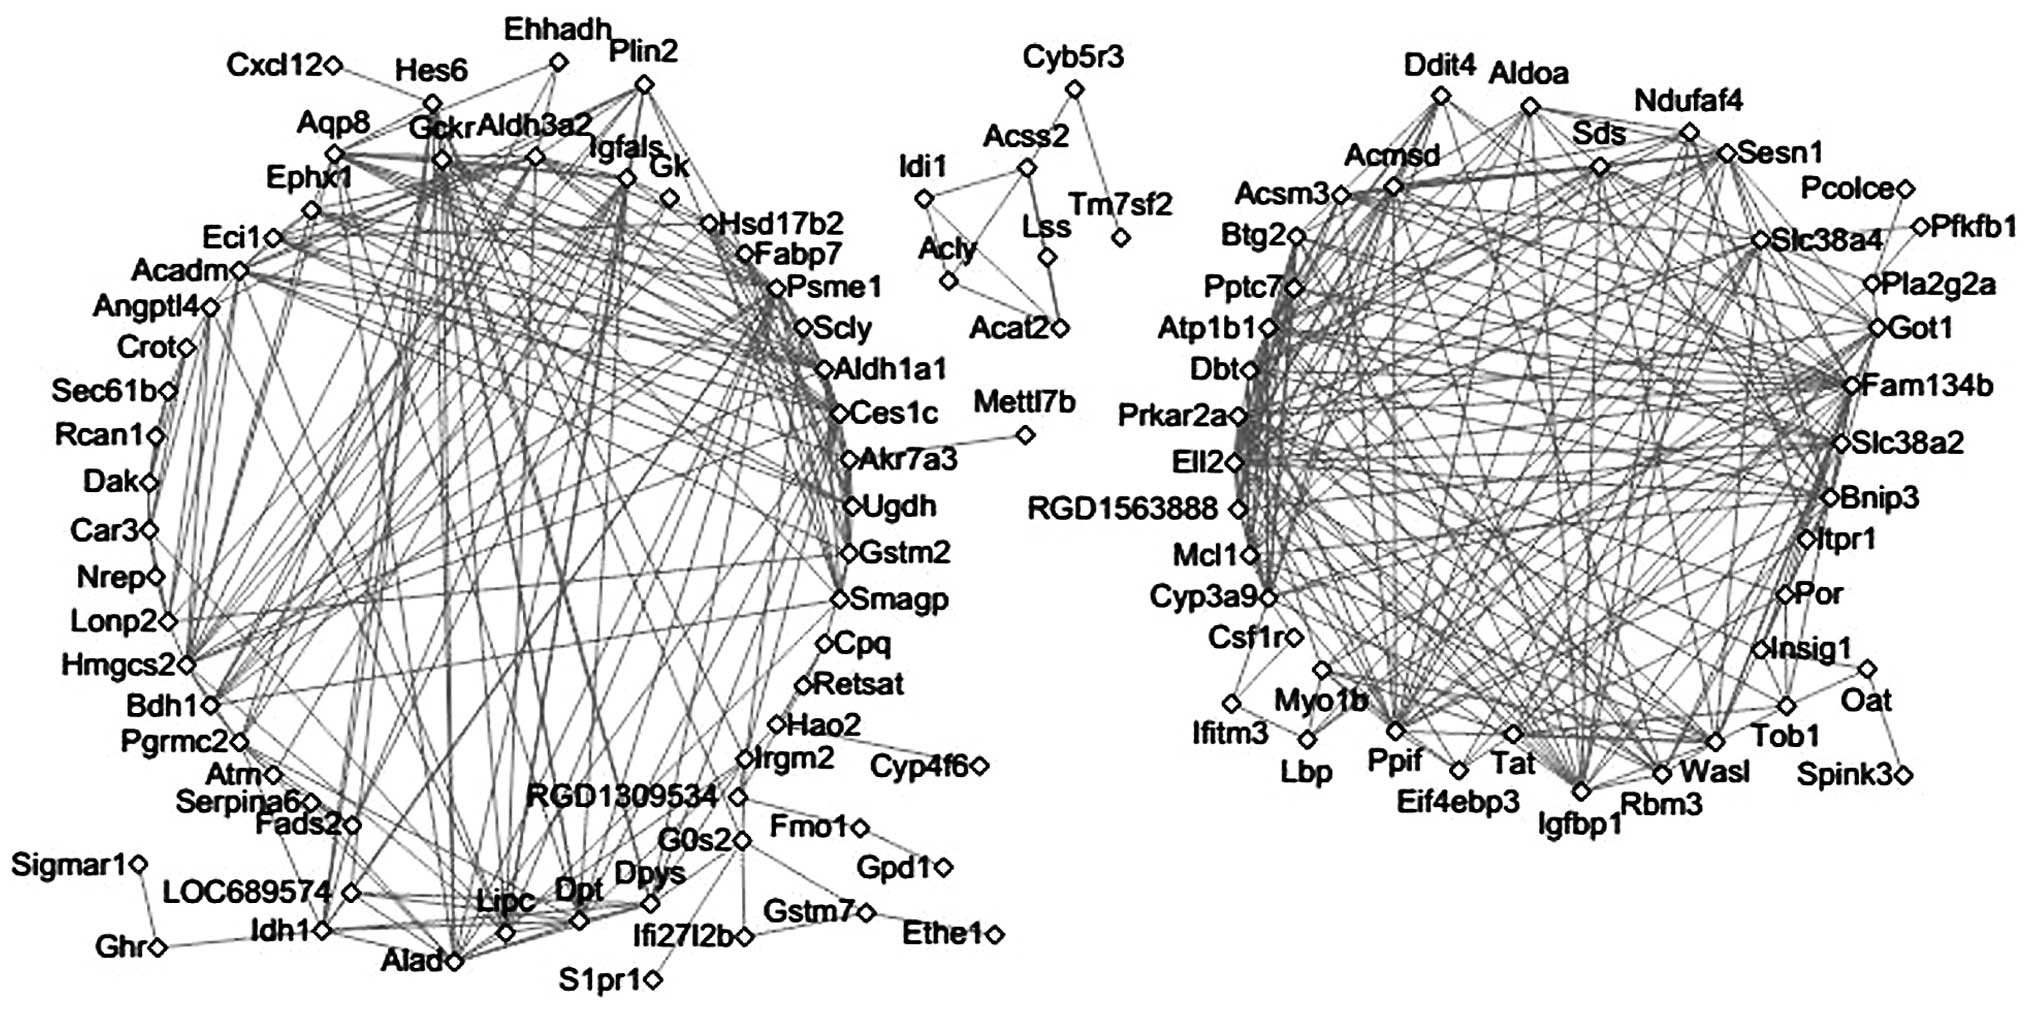
Co-expression analysis
A total of 413 pairs of co-expression associations,
including 105 genes, were obtained (Fig. 4). Among these genes, Cyp3a9
could be co-expressed with 13 genes (such as Atp1b1 and
Ell2). In addition, Ehhadh could be co-expressed with
Aldh3a2, Aqp8 and Bdh1.
Discussion
In the present study, 682 DEGs were screened in
Burn-CLP compared with Sham-Sham. The downregulated DEGs, such as
Acadm and Ehhadh, were significantly enriched in PPAR
signaling pathway. Additionally, in the PPI network, Acadm
could interact with Ehhadh. A former study identified that
the inhibition of PPARγ could possibly act as protection against
T-cell death, which improved the defense mechanisms during systemic
inflammation and sepsis (15).
Apart from the aforementioned function, PPARγ could also be
involved in the regulation of the mitochondrial dysfunction with
tumor necrosis factor α (16). A
study by Singer (17) illustrated
that mitochondrial dysfunction could give rise to sepsis. As for
the DEGs enriched in this pathway, Acadm, a member of the
acyl-CoA dehydrogenase (ACAD) family, has been found to be involved
in the metabolism of medium-chain fatty acids (18). In addition, Ehhadh has also
been proven to be an indispensable element for the production of
medium-chain dicarboxylic acids (19). In 2013, Hecker et al
(20) obtained the conclusion
that medium-chain fatty acids could serve as energy for the
mitochondrial respiratory capacity and inflammatory conditions in
sepsis. Therefore, we hypothesized that the interaction of
Acadm and Ehhadh could be associated with sepsis by
modulating the mitochondrial function through the PPAR signaling
pathway.
Furthermore, the gene co-expression analysis showed
that Ehhadh could be co-expressed with Aqp8. Aqp8 is
a water channel protein on the inner mitochondrial membrane
(21). The upregulation of
Aqp8 has been found to protect the mitochondria from damage
in sepsis, which could lead to the loss of energy (22). Additionally, it has been
discovered that Aqp8 was involved in
H2O2 release and decrease of reactive oxygen
species (ROS) production, which could damage the cells and
antioxidant defense system and thus lead to sepsis (23,24). Ehhadh has been found to be
involved in mitochondrial fatty acid β-oxidation (25). Therefore, we hypothesized that the
co-expression of Ehhadh and Aqp8 could be associated
with sepsis by regulating the mitochondrial function.
Furthermore, compared with Sham-Sham, the
down-regulated DEGs, Gsta3, Gstm2 and Gstt1,
in Burn-CLP were significantly enriched in glutathione metabolism.
The PPI network showed that interactions existed among these three
proteins. Previous studies have shown that improved outcomes in
animal models of sepsis were obtained by utilizing
mitochondrial-targeted antioxidants (26,27). Glutathione could protect the
mitochondria from dysfunction by the detoxification of hydrogen
peroxide in sepsis (28).
Gsta3, Gstm2 and Gstt1 encode the glutathione
S-transferase α3, glutathione S-transferase µ2 and
glutathione S-transferase θ1, respectively. Glutathione
S-transferases are well known for removing endogenous toxic
compounds through glutathionylation of diverse electrophilic
substrates and act as antioxidants against ROS (29). Accordingly, we hypothesized that
Gsta3, Gstm2 and Gstt1 may be involved in
sepsis through the pathway of glutathione metabolism.
In the present study, Ppargc1a, which was
upregulated in Burn-CLP compared with Sham-Sham, was screened as a
transcription factor. However, in Sham-CLP, it was not
differentially expressed, suggesting that Ppargc1a could be
associated with burn. AMPK-Ppargc1a possibly contributes to
autophagy activation leading to an antimicrobial response, which is
a novel host defense mechanism (30). In the PPI network, Ppargc1a
could interact with Angptl4. Additionally, Angptl4
was significantly enriched in the PPAR signaling pathway.
Angptl4 has been demonstrated to be involved with lipid
metabolism, and the disorder of lipid metabolism is a vital issue
in septic patients, particularly high-density lipoprotein, which
protects against polymicrobe-induced sepsis in mice (31,32). Consequently, we hypothesized that
the interaction of Angptl4 and Ppargc1a may be
associated with sepsis through the PPAR signaling pathway.
In conclusion, Acadm, Ehhadh,
Aqp8, Gsta3, Gstm2, Gstt1,
Ppargc1a and Angptl4 may be potential target genes
for the treatment of burn sepsis. However, further studies are
required to establish their mechanisms of action in burn
sepsis.
Acknowledgments
The present study was supported by the Nosocomial
Infection Control Research Fund of China (grant no. ZHYY
2014-0037), the Jinling Hospital Research Fund (grant no. YYMS
2014017), the Foundation of Medical Science and Technology
Innovation (grant no. CNJ2014L004) and the Medical Innovation Fund
(grant no. 14MS106).
References
|
1
|
Taylor FB Jr, Kinasewitz GT and Lupu F:
Pathophysiology, staging and therapy of severe sepsis in baboon
models. J Cell Mol Med. 16:672–682. 2012. View Article : Google Scholar :
|
|
2
|
Martin GS, Mannino DM, Eaton S and Moss M:
The epidemiology of sepsis in the United States from 1979 through
2000. N Engl J Med. 348:1546–1554. 2003. View Article : Google Scholar : PubMed/NCBI
|
|
3
|
Church D, Elsayed S, Reid O, Winston B and
Lindsay R: Burn wound infections. Clin Microbiol Rev. 19:403–434.
2006. View Article : Google Scholar : PubMed/NCBI
|
|
4
|
Beffa DC, Fischman AJ, Fagan SP, Hamrahi
VF, Paul KW, Kaneki M, Yu YM, Tompkins RG and Carter EA:
Simvastatin treatment improves survival in a murine model of burn
sepsis: Role of interleukin 6. Burns. 37:222–226. 2011. View Article : Google Scholar
|
|
5
|
Kraft R, Herndon DN, Finnerty CC, Cox RA,
Song J and Jeschke MG: Predictive value of IL-8 for sepsis and
severe infections after burn injury - A clinical study. Shock.
43:222–227. 2015. View Article : Google Scholar
|
|
6
|
Zu H, Li Q and Huang P: Expression of Treg
subsets on intestinal T cell immunity and endotoxin translocation
in porcine sepsis after severe burns. Cell Biochem Biophys.
70:1699–1704. 2014. View Article : Google Scholar : PubMed/NCBI
|
|
7
|
Banta S, Vemula M, Yokoyama T, Jayaraman
A, Berthiaume F and Yarmush ML: Contribution of gene expression to
metabolic fluxes in hypermetabolic livers induced through burn
injury and cecal ligation and puncture in rats. Biotechnol Bioeng.
97:118–137. 2007. View Article : Google Scholar
|
|
8
|
Afsari B, Geman D and Fertig EJ: Learning
dysregulated pathways in cancers from differential variability
analysis. Cancer Inform. 13(Suppl 5): 61–67. 2014.PubMed/NCBI
|
|
9
|
Bolstad B: preprocessCore: A collection of
pre-processing functions. R package version 1. 2013.
|
|
10
|
Huang W, Sherman BT and Lempicki RA:
Systematic and integrative analysis of large gene lists using DAVID
bioinformatics resources. Nat Protoc. 4:44–57. 2009. View Article : Google Scholar
|
|
11
|
Kanehisa M and Goto S: KEGG: Kyoto
encyclopedia of genes and genomes. Nucleic Acids Res. 28:27–30.
2000. View Article : Google Scholar
|
|
12
|
Matys V, Fricke E, Geffers R, Gössling E,
Haubrock M, Hehl R, Hornischer K, Karas D, Kel AE, Kel-Margoulis
OV, et al: TRANSFAC: Transcriptional regulation, from patterns to
profiles. Nucleic Acids Res. 31:374–378. 2003. View Article : Google Scholar : PubMed/NCBI
|
|
13
|
Franceschini A, Szklarczyk D, Frankild S,
Kuhn M, Simonovic M, Roth A, Lin J, Minguez P, Bork P, von Mering
C, et al: STRING v9.1: Protein-protein interaction networks, with
increased coverage and integration. Nucleic Acids Res.
41:D808–D815. 2013. View Article : Google Scholar :
|
|
14
|
Saito R, Smoot ME, Ono K, Ruscheinski J,
Wang PL, Lotia S, Pico AR, Bader GD and Ideker T: A travel guide to
Cytoscape plugins. Nat Methods. 9:1069–1076. 2012. View Article : Google Scholar : PubMed/NCBI
|
|
15
|
Schmidt MV, Paulus P, Kuhn AM, Weigert A,
Morbitzer V, Zacharowski K, Kempf VA, Brüne B and von Knethen A:
Peroxisome proliferator-activated receptor γ-induced T cell
apoptosis reduces survival during polymicrobial sepsis. Am J Respir
Crit Care Med. 184:64–74. 2011. View Article : Google Scholar : PubMed/NCBI
|
|
16
|
Chiang MC, Cheng YC, Lin KH and Yen CH:
PPARγ regulates the mitochondrial dysfunction in human neural stem
cells with tumor necrosis factor alpha. Neuroscience. 229:118–129.
2013. View Article : Google Scholar
|
|
17
|
Singer M: The role of mitochondrial
dysfunction in sepsis-induced multi-organ failure. Virulence.
5:66–72. 2014. View Article : Google Scholar :
|
|
18
|
Kim JJ and Miura R: Acyl-CoA
dehydrogenases and acyl-CoA oxidases. Structural basis for
mechanistic similarities and differences. Eur J Biochem.
271:483–493. 2004. View Article : Google Scholar : PubMed/NCBI
|
|
19
|
Houten SM, Denis S, Argmann CA, Jia Y,
Ferdinandusse S, Reddy JK and Wanders RJ: Peroxisomal
L-bifunctional enzyme (Ehhadh) is essential for the production of
medium-chain dicarboxylic acids. J Lipid Res. 53:1296–1303. 2012.
View Article : Google Scholar : PubMed/NCBI
|
|
20
|
Hecker M, Sommer N, Voigtmann H, Pak O,
Mohr A, Wolf M, Vadász I, Herold S, Weissmann N, Morty RE, et al:
Impact of short-and medium-chain fatty acids on mitochondrial
function in severe inflammation. JPEN J Parenter Enteral Nutr.
38:587–594. 2013. View Article : Google Scholar
|
|
21
|
Calamita G, Ferri D, Gena P, Liquori GE,
Cavalier A, Thomas D and Svelto M: The inner mitochondrial membrane
has aquaporin-8 water channels and is highly permeable to water. J
Biol Chem. 280:17149–17153. 2005. View Article : Google Scholar : PubMed/NCBI
|
|
22
|
Wang JQ, Zhang L, Tao XG, Wei L, Liu B,
Huang LL and Chen YG: Tetramethylpyrazine upregulates the aquaporin
8 expression of hepatocellular mitochondria in septic rats. J Surg
Res. 185:286–293. 2013. View Article : Google Scholar : PubMed/NCBI
|
|
23
|
Schulte J, Struck J, Köhrle J and Müller
B: Circulating levels of peroxiredoxin 4 as a novel biomarker of
oxidative stress in patients with sepsis. Shock. 35:460–465. 2011.
View Article : Google Scholar : PubMed/NCBI
|
|
24
|
Marchissio MJ, Francés DEA, Carnovale CE
and Marinelli RA: Mitochondrial aquaporin-8 knockdown in human
hepatoma HepG2 cells causes ROS-induced mitochondrial
depolarization and loss of viability. Toxicol Appl Pharmacol.
264:246–254. 2012. View Article : Google Scholar : PubMed/NCBI
|
|
25
|
Banasik K, Justesen JM, Hornbak M, Krarup
NT, Gjesing AP, Sandholt CH, Jensen TS, Grarup N, Andersson A,
Jørgensen T, et al: Bioinformatics-driven identification and
examination of candidate genes for non-alcoholic fatty liver
disease. PLoS One. 6:e165422011. View Article : Google Scholar : PubMed/NCBI
|
|
26
|
Andrades MÉ, Morina A, Spasić S and
Spasojević I: Bench-to-bedside review: sepsis - from the redox
point of view. Crit Care. 15:2302011. View Article : Google Scholar : PubMed/NCBI
|
|
27
|
Dare AJ, Phillips AR, Hickey AJ, Mittal A,
Loveday B, Thompson N and Windsor JA: A systematic review of
experimental treatments for mitochondrial dysfunction in sepsis and
multiple organ dysfunction syndrome. Free Radic Biol Med.
47:1517–1525. 2009. View Article : Google Scholar : PubMed/NCBI
|
|
28
|
Lowes DA and Galley HF: Mitochondrial
protection by the thioredoxin-2 and glutathione systems in an in
vitro endothelial model of sepsis. Biochem J. 436:123–132. 2011.
View Article : Google Scholar : PubMed/NCBI
|
|
29
|
Ito M, Imai M, Muraki M, Miyado K, Qin J,
Kyuwa S, Yoshikawa Y, Hosoi Y, Saito H and Takahashi Y: GSTT1 is
upregulated by oxidative stress through p38-MK2 signaling pathway
in human granulosa cells: Possible association with mitochondrial
activity. Aging (Albany NY). 3:1213–1223. 2011.
|
|
30
|
Yang CS, Kim JJ, Lee HM, Jin HS, Lee SH,
Park JH, Kim SJ, Kim JM, Han YM, Lee MS, et al: The AMPK-PPARGC1A
pathway is required for antimicrobial host defense through
activation of autophagy. Autophagy. 10:785–802. 2014. View Article : Google Scholar : PubMed/NCBI
|
|
31
|
Hato T, Tabata M and Oike Y: The role of
angiopoietin-like proteins in angiogenesis and metabolism. Trends
Cardiovasc Med. 18:6–14. 2008. View Article : Google Scholar : PubMed/NCBI
|
|
32
|
Guo L, Ai J, Zheng Z, Howatt DA, Daugherty
A, Huang B and Li XA: High density lipoprotein protects against
polymicrobe-induced sepsis in mice. J Biol Chem. 288:17947–17953.
2013. View Article : Google Scholar : PubMed/NCBI
|