Introduction
Acute pulmonary embolism (APE) refers to the
blockage of at least one vessel in the lungs, which occurs due to
thrombus lodging and leads to disrupted pulmonary circulation. The
pathological mechanisms of APE include endothelial injury,
activation of the coagulation cascade, inflammation, and the
promotion of thrombus formation via inflammatory cell recruitment
(1,2). APE-associated inflammation has been
somewhat neglected in investigations over previous years, and there
are limited reports on the condition. Our previous studies
demonstrated that a wide range of inflammatory responses, including
the expression of tumor necrosis factor-α (TNF-α), interleukin
(IL)-1β, IL-8, the irregular chemokine CX3C chemokine ligand 1
(CX3CL1) and its receptor CX3C chemokine receptor 1 (CX3CR1) were
found in an APE rat model. In addition, the level of CX3CL1 was
shown to positively correlate with the level of TNF-α (3,4).
It was also found that lipopolysaccharide (LPS) can induce the
expression of nuclear factor (NF)-κB and CX3CL1 in human bronchial
epithelial cells (5), and it was
found that aspirin improved the pathological changes in rats with
APE via the CX3CL1/CX3CR1 signaling pathway (3,4).
Based on these findings, adenovirus vectors carrying CX3CL1-short
hairpin (sh)RNA and CX3CL1-overexpression vectors were constructed
in the present study to identify the thrombus-induced inflammatory
response involving lung microvascular endothelial cells (LMVECs) at
the cellular level, and examine the intervention effect of
aspirin.
Materials and methods
Materials
Aspirin enteric-coated tablets were purchased from
Nanjing Baijingyu Pharmaceutical Co., Ltd. (Nanjing, China;
specifications: 25 mg ×100 tablets/bottle, batch no. 141201).
Western blot analysis
Western blot analysis was used to detect NF-κB. A
PVDF membrane was obtained from EMD Millipore (Billerica, MA, USA);
cat. no. IPVH00010; batch no. K5JA5013L). Anti-NF-kB p65 antibody
was obtained from Abcam (Cambridge, MA, USA; cat. no. ab7970).
β-actin was purchased from Multi Sciences (Lianke) Biotech, Co.,
Ltd. (cat. no. ab008-100). Goat anti-rabbit IgG was bought from
Multi Sciences (Lianke) Biotech, Co., Ltd. (cat. no. GAR0072). Goat
anti-mouse IgG was obtained from Bioworld Technology, Inc. (St.
Louis Park, MN, USA; cat. no. BS12478). An electrophoresis system
(Mini-Proten Tetra system) was purchased from Bio-Rad Laboratories,
Inc. (Hercules, CA, USA). A gel imager was obtained from Bio-Rad
Laboratories, Inc. (ChemiDoc XRS+ system).
Reverse transcription-quantitative
polymerase chain reaction (RT-qPCR) analysis
RT-qPCR analysis was performed to detect the
expression levels of CX3CL1, CX3CR1, IL-6 and TNF-α. A highly
purified total RNA rapid extraction kit was purchased from Generay
(cat. no. GK3016; batch no. 1512G14). A reverse transcription kit
(Prime Script™ RT reagent) was obtained from Takara Bio, Inc.
(Otsu, Japan; cat. no. RR037A; batch no: AK5102). qPCR reagent,
Super RealPreMix Color (SYBR Green), was purchased from Tiangen
Biotech Co., Ltd. (Beijing, China; cat. no. FP215-02; batch no.
O3911). Instrumentation for optical density (OD) measuring
(high-precision spectrophotometer SMA4000) was purchased from
Merinton Instrument, Inc. (Ann Arbor, MI, USA). The machine used
for qPCR was the CFX connect Real-Time PCR system, and the software
used for analysis was BIO-RAD CFX Manager 3.1 (Bio-Rad
Laboratories, Inc.).
ELISA
ELISA was used to evaluate the levels of IL-6, TNF-α
and intercellular adhesion molecule-1 (ICAM-1). The IL-6 ELISA kit
was purchased from USCN (cat. no. SEA079Ra, batch no. L160301015).
The TNF-α ELISA kit was purchased from USCN Life Science, Inc.
(Wuhan, China; cat. no. SEA133Ra, batch no. L160301011). The ICAM-1
ELISA kit was purchased from USCN (cat. no. SEA548Ra, batch no.
L160301001).
Laser confocal microscopy
Laser confocal microscopy was used to determine the
co-expression of 3CL1/CX3CR1 and CX3CL1/NF-κB. DAPI was purchased
from Sigma; EMD Millipore (cat. no. D9452). CX3CL1 antibody was
purchased from Santa Cruz Biotechnology Co., Ltd. (Dallas, TX, USA;
cat. no. sc-7227). CX3CR1 antibody was obtained from Abcam (cat.
no. ab7200). NF-κB p65 antibody was purchased from Abcam (cat. no.
ab7970). Alexa Fluor® 647 conjugate served as donkey
anti-goat IgG (H+L) secondary antibody, and Alexa Fluor®
594 conjugate served as goat anti-rabbit IgG (H+L) secondary
antibody. The laser confocal microscope (LSM510 Meta) was obtained
from Zeiss AG (Oberkochen, Germany).
Methods
Establishment of an LMVEC model
induced by thrombus stimulation (6,7)
All animal experiments, including the method of
sacrifice, were performed in compliance with the institutional
animal care regulations and guidelines of Zhejiang Chinese Medical
University (Hangzhou, China) and performed according to the
Association for Assessment and Accreditation of Laboratory Animal
Care International (AAALAC) and the Institutional Animal Care and
Use Committee (IACUC) guidelines. The present study was approved by
the Laboratory Animal Management and Ethical Review Committee (no.
ZSLL-2015-1015) of Zhejiang Chinese Medical University (Hangzhou,
China).
The rat LMVECs were purchased from Pri Cells
Biomedical Technology Co., Ltd. (Wuhan, China). Frozen LMVECs were
recovered and cultured in LHC-8 serum-free medium (Gibco; Thermo
Fisher Scientific, Inc., Waltham, MA, USA) at 37°C, in a 5%
CO2 incubator. For subculture, the cells were washed
with PBS, digested with 0.125% trypsin +0.01% EDTA, and maintained
in logarithmic phase culture. For treatment, the cells were
digested, counted and seeded in 6-well plates at a density of
2×10⁵ per well. Male Sprague-Dawley (SD) rats (n=3; 8
weeks old, 200 g) were purchased from Shanghai SLAC Laboratory
Animal Co., Ltd. (Shanghai, China). The animals were housed with 12
h dark/light cycles, temperature of 22-26°C and atmosphere of
~0.03-0.04% CO2. Animals were given access to food and
water ad libitum. Following a 6-day acclimation, the
experiment was initiated. The rats were anesthetized by
intraperitoneal injection of 2% sodium pentobarbital (0.25 ml/100
g); all surgery was performed under sodium pentobarbital anesthesia
and all efforts were made to minimize suffering. Rat venous blood
was collected, and a thrombus 5 mm in size was prepared. The LMVECs
were randomly divided into two groups (n=3): Normal group (group N)
and model group (group M); the cells in group N did not receive
thrombus stimulation. Thrombosis precipitated naturally (a 2/3
thrombosis pavement was considered a base). Time points of 0, 0.5,
1, 4, 8 and 12 h were set prior to experiment commencement; the
12-h time point was selected as the appropriate time to wash away
the thrombus for measurement based on the pre-experimental data.
For each group, experimentation was run in triplicate. ELISA was
used to detect IL-6, TNF-α and ICAM-1. RT-qPCR analysis was
performed to measure the expression levels of CX3CL1, CX3CR1, IL-6
and TNF-α; the primer sequences are listed in Table I. Total RNA was extracted using
TRIzol reagent (Thermo Fisher Scientific, Inc.), according to the
manufacturer's protocol. A total of 2 μg of extracted RNA
was converted to cDNA by MMLV-reverse transcriptase (Fermentas;
Thermo Fisher Scientific, Inc.), which was usedac-cording to its
manufacturer's protocol. The cDNA was amplified using the following
forward and reverse primers as previously described (8). The mRNA expression of CX3CL1,
CX3CR1, IL-6 and TNF-α was determined with qPCR using IQ SYBR Green
SuperMix PCR Array kit was purchased from Bio-Rad Laboratories,
Inc. The following thermo cycling conditions were used for the PCR:
40 cycles of 50.0°C for 3 min, 95.0°C for 15 min, 95.0°C for 10
sec, 58.0°C for 15 sec, 72.0°C for 15 sec. The sequence of primers
was as follows: Rat CX3CL1 forward, GCAGTGACTGGATCGTCTCC, rat
CX3CL1 reverse, ACTCGGCCAAATGGTGGTAG; rat CX3CR1 forward,
AGTTGTGGCATGAAGAGGGAC, rat CX3CR1 reverse, GGGGTTGAGGCAGCAGTG; rat
IL6 forward, TTCCAGCCAGTTGCCTTCTT, rat IL6 reverse,
TGTTGTGGGTGGTATCCTCTG T; rat TNFa forward, CCACCACGCTCTTCTGTCTAC
TG, rat TNFa reverse, GGGCTACGGGCTTGTCACTC. The primers were
designed and synthesized at Shanghai Generay Biotech (Shanghai,
China). The reaction was performed and analysed by a CFX Connect
Real-Time PCR System (Bio-Rad Laboratories, Inc). The relative
expression levels of the mRNA in each sample were calculated using
the 2−ΔΔCt method (9).
These levels were expressed in arbitrary units.
 | Table IPrimer sequences for reverse
transcription-quantitative polymerase chain reaction detection of
CX3CL1, CX3CR1, IL-6 and TNF-α. |
Table I
Primer sequences for reverse
transcription-quantitative polymerase chain reaction detection of
CX3CL1, CX3CR1, IL-6 and TNF-α.
| Target gene | Primer sequence
(5′-3′) | Product size
(bp) |
|---|
| Genbank ID:
89808 | | 117 |
|
RatCX3CL1Forward |
GCAGTGACTGGATCGTCTCC | |
|
RatCX3CL1Reverse |
ACTCGGCCAAATGGTGGTAG | |
| Genbank ID:
171056 | | 97 |
|
RatCX3CR1Forward |
AGTTGTGGCATGAAGAGGGAC | |
|
RatCX3CR1Reverse |
GGGGTTGAGGCAGCAGTG | |
| Genbank ID:
25464 | | 127 |
|
RatICAM1Forward |
ATCATTGCGGGCTTCGTG | |
|
RatICAM1Reverse |
AGGGAGGCGGGGCTTGTAC | |
| Genbank ID:
24835 | | 150 |
| RatTNF-αForward
CC |
ACCACGCTCTTCTGTCTACTG | |
|
RatTNF-αReverse |
GGGCTACGGGCTTGTCACTC | |
| Genbank ID:
24498 | | 103 |
| RatIL6Forward |
TTCCAGCCAGTTGCCTTCTT | |
| RatIL6Reverse |
TGTTGTGGGTGGTATCCTCTGT | |
Western blot analysis was used to evaluate the
expression of NF-κB. Protein samples were extracted from the rat
LMVECs using Protein Extraction kit (Beyotime Institute of
Biotechnology, Jiangsu, China). The protein concentration was
determined using bicinchoninic acid method. Protein samples (30 mg)
were separated using 4% to 12% Bis-Tris SDS-PAGE gelsand then
transferred to polyvinylidene fluoride membranes. Membranse were
blocked with 5% skim milk in PBS/1% Tween-20 for 1 h at room
temperature. Following incubation PVDF membrane waswashed with 1X
TBST solution for 5 min. The membranes were then incubated with
primary antibodies as described above overnight at 4°C.
Subsequently, the membranes were incubated with secondary
antibodiesas described above for 2 h at room temperature. ECL
chemiluminescence reagent (Beyotime Institute of Biotechnology) ws
used for visualization.
Chemiluminescent images of the blots were finally
captured using a ChemiDoc System. ImageJ software was used to
calculate the integrated absorbance of identified bands (IA), and
the expression of protein was calculated using the following
formula: The relative expression of
protein=IAprotein/IAβ-actin.
Laser confocal microscopy was used to evaluate the
co-expression of CX3CL1/CX3CR1 and CX3CL1/NF-κB. Fractalkine
(CX3CL1) antibody (Santa Cruz Biotechnology, Inc.; 1:10),
anti-NF-κB p65 antibody (1:50), anti-CX3CR1 antibody (1:100) (both
from Abcam), anti-rabbit IgG secondary antibody (488 conjugate;
Thermo Fisher Scientific, Inc.; excitation wavelength/emission wave
length: 488/520 nm; 1:200), anti-goat IgG secondary antibody (555
conjugate; Thermo Fisher Scientific, Inc., excitation
wavelength/emission wavelength: 555/562 nm; 1:200), and DAPI
(Sigma; EMD Millipore; excitation wavelength/emission wavelength:
358/461 nm) were used.
A fluoresceinisothiocyanate (FITC) labeling kit,
which was purchased from Sangon Biotech Co., Ltd. (Shanghai,
China), with excitation and emission wavelengths of 490 and 525 nm
respectively, was used to label recombinant protein. The
freeze-dried powder of the recombinant protein was dissolved in PBS
and mixed with FITC. The sample was then incubated in the dark at
room temperature for 5 h. Subsequently, the sample was purified in
a gel column, and unbound FITC was removed. A cell climbing slice
was prepared, and FITC-labeled CX3CL1/CX3CR1 and CX3CL1/NF-κB were
added to the slice and incubated at room temperature for 10 min.
Following incubation, the slice was washed with PBS four times.
Following mounting of the slice, laser confocal microscopy was used
to evaluate the cellular localization of CX3CL1/CX3CR1 and
CX3CL1/NF-κB. For staining, CX3CL1 (goat anti human antibodies) was
combined with either CX3CR1 (rabbit anti human antibodies) or NF-κB
p65 (rabbit anti human antibodies) for double staining. The
fluorescent secondary antibody applied to CX3CL1 was donkey
anti-goat IgG (H+L), secondary antibody® 647
(near-infrared; pseudocolor green). The fluorescent secondary
antibody applied to CX3CR1 and NF-κB p65 was goat anti-rabbit IgG
(H+L), secondary antibody® 594 (red). ImageJ 4.1
software (National Institutes of Health, Bethesda, MD, USA) was
used to calculate the fluorescence value (unit: pixels): Cell
fluorescence intensity = fluorescence value/mean value of group
N.
Vector construction
The construction of vectors carrying
CX3CL1-overexpression shRNA was performed as an in vitro
experiment. Vector pHBAd-MCMV-GFP (Hanbio, Shanghai, China), vector
pHBAd-U6-GFP (Hanbio), Escherichia coli strain DH5α (Tiangen
Biotech Co., Ltd.), restriction enzyme, T4 ligase (both from
Fermentas Thermo Fisher Scientific, Inc.) and a plasmid DNA
extraction kit (CWBio, Beijing, China) were used. The TCID50 method
was applied to detect the titer (10). The viral concentration was
MIO=10.
Verification of the effect of CX3CL1
on the model
The adenovirus vectors of CX3CL1-overexpression were
constructed. The LMVECs were randomly divided into four groups
(n=3): Normal group (group N), model group (group M), model +
CX3CL1-overexpression vector group (group M+CX3), and normal +
virus control group (group N+V). ELISA was used to determine the
levels of IL-6, TNF-α and ICAM-1. RT-qPCR analysis was performed to
detect the expression levels of CX3CL1, CX3CR1, IL-6 and TNF-α,
whereas the cell culture supernatant was separated for ELISA.
Western blot analysis was used to measure NF-κB; for which total
protein was extracted following washing of the cells with PBS.
Laser confocal microscopy was used for evaluation of the
co-expression of CX3CL1/CX3CR1 and CX3CL1/NF-κB.
Verification of the effects of
CX3CL1-shRNA on the model
The adenovirus vectors carrying CX3CL1-shRNA were
constructed. The LMVECs were randomly divided into four groups
(n=3): Group N, group M, model+CX3CL1-shRNA group (group M+SH), and
group N+V.
Verification of the effects of aspirin
combined with CX3CL1 on the model
The LMVECs were randomly divided into eight groups
(n=3): Group N, group M, model + aspirin group (group M+A), group
M+SH, group M+CX3, model + shRNA + aspirin group (group M+A+SH),
model + aspirin + CX3CL1-overexpression vector (group M+A+CX3), and
group N+V (Table II).
| Table IIExperimental grouping. |
Table II
Experimental grouping.
| Group | Treatment |
|---|
| Normal group (group
N) | No treatment,
cultured for 72 h. |
| Model group (group
M) | No treatment,
cultured for 72 h, with re-prepared thrombus added in last 12
h. |
| Model + ASP group
(group M+A), | Aspirin added at
aconcentration of 5 mM. Pre-prepared thrombus added in last 12
h. |
| Model + shRNAgroup
(group M+SH) | Treated with
MIO=10); knockdown virus added for 72 h, with final thrombus added
in last 12 h. |
|
Model+overexpression group (group
M+CX3) | Treated with
MIO=10a, overexpression virus
added for 72 h, final thrombus added in last 12 h. |
| Model + ASP + shRNA
group (group M+A+SH) | Treated with
MIO=10, knockdown virus and 5 nM aspirin added for 72 h, with final
thrombus added in the last 12 h. |
| Model + ASP +
CX3CL1-overexpression vector (group M+A+CX3) | Treated with
MIO=10, overexpression virus and 5 nM aspirin were added for 72 h,
with final thrombus added inlast 12 h. |
| Normal + virus
control group (group N+V) | Adenovirus was
added for 72 h. |
Statistical analysis
IBM SPSS 21.0 (IBM SPSS, Armonk, NY, USA) was used
for statistical analysis. The experimental results are expressed as
the mean ± standard deviation, and two independent samples were
compared using the paired t-tests. Single factor analysis of
variance was used to compare multiple samples, and the LSD test was
used for comparison among groups. P<0.05 was considered to
indicate a statistically significant difference.
Results
Thrombus-stimulated model ELISA
ELISA was used to detect the levels of IL-6, TNF-α
and ICAM-1. The levels of IL-6 (207.90±16.69) and TNF-α
(239.60±15.27) in group M was significantly increased, compared
with those in group N (85.93±20.31 and 101.23±11.91, respectively)
(all P<0.01); whereas there was no difference in the level of
ICAM-1 between group N (1.44±0.15) and group M (1.79±0.35)
(P>0.05; Fig. 1A).
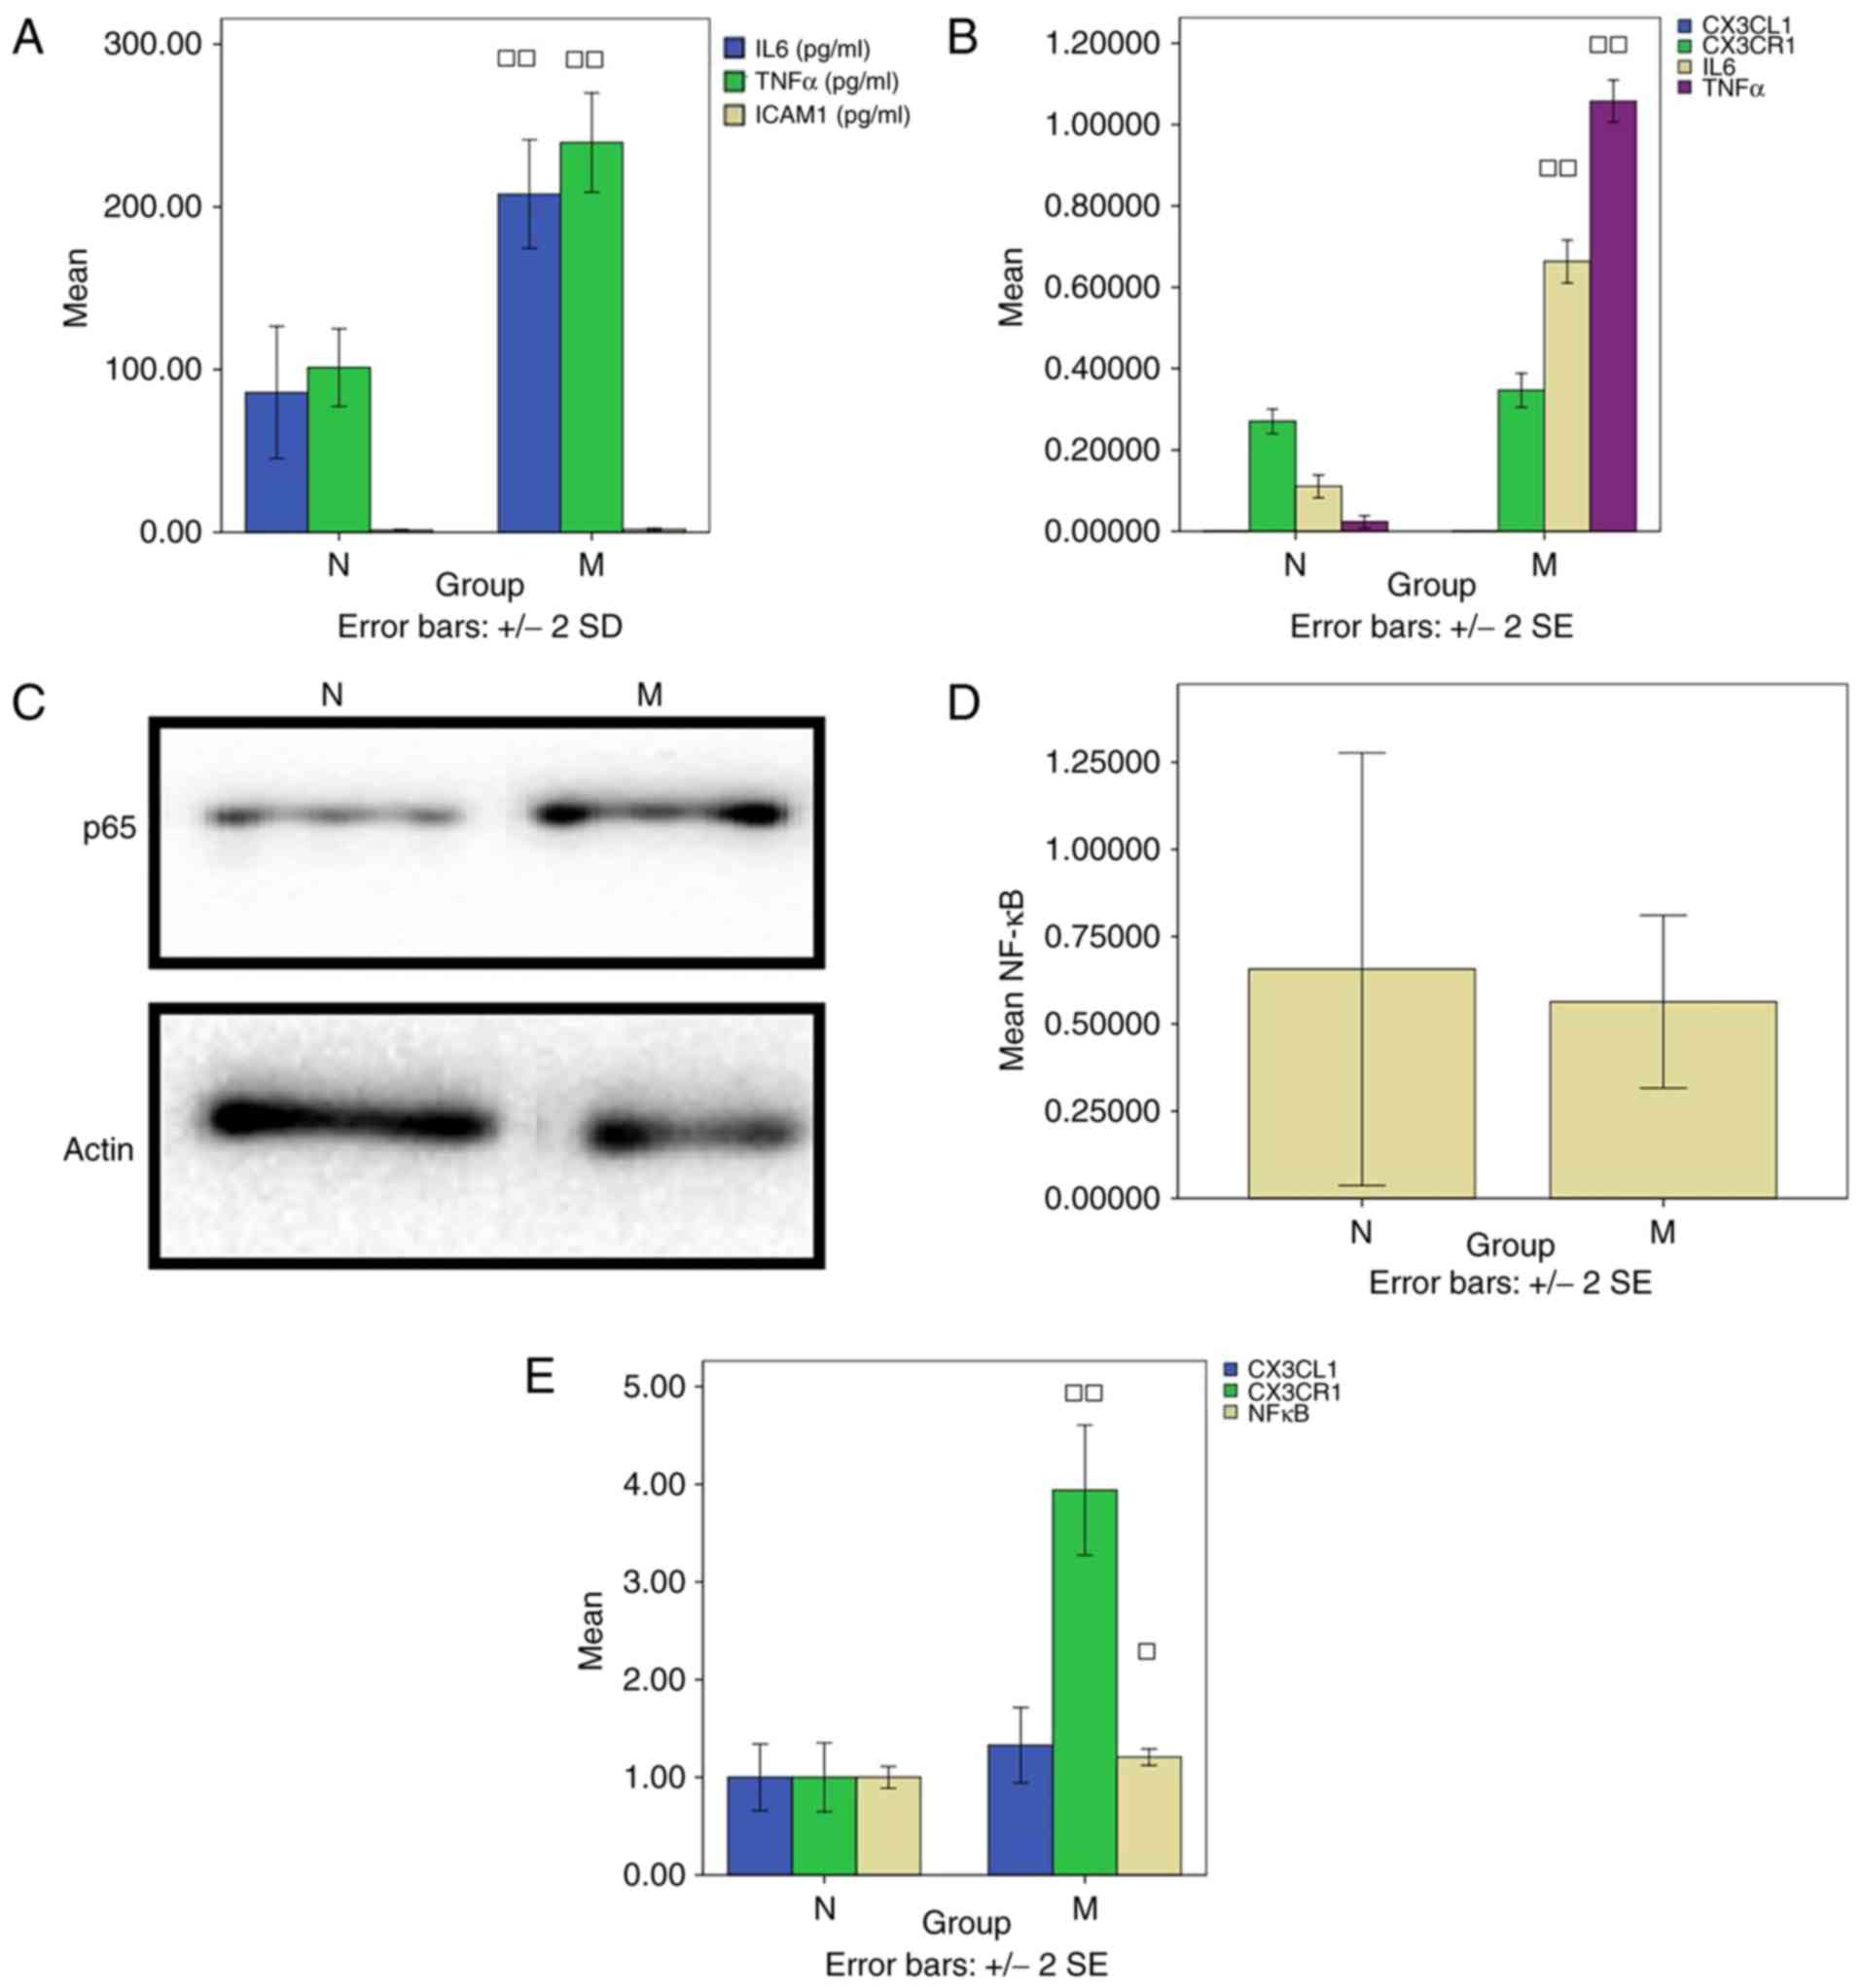 | Figure 1Thrombus-stimulated model. (A) ELISA
detection of IL-6 and TNF-α. (B) Reverse transcription-quantitative
polymerase chain reaction analysis was used to detect CX3CL1,
CX3CR1, IL-6 and TNF-α. (C) Western blotting was performed to
measure NF-κB. (D) Results of western blotting for NF-κB/P65 and
β-actin proteins. □P<0.05 and □□P<0.01,
compared with group N. (E) Laser confocal microscopy was used to
evaluate the co-expression of CX3CL1/CX3CR1 and CX3CL1/NF-κB.
CX3CL1, CX3C chemokine ligand 1; CX3CR1, CX3C chemokine receptor 1;
IL-6, interleukin-6; TNF-α, tumor necrosis factor-α; NF-κB, nuclear
factor-κB; N, normal; M, model. |
RT-qPCR detection
The levels of CX3CL1 (0.00033±0.000006) and CX3CR1
(0.27±0.03) in group N were similar to those in group M
(0.00020±0.000000 and 0.35±0.04) (P>0.05). There was a
significant difference in the level of IL-6 between groups N
(0.11±0.02) and M (0.66±0.05) (P<0.01). In addition, the level
of TNF-α in group N (0.02±0.01) differed significantly from that in
group M (1.06±0.04) (P<0.01; Fig.
1B).
Western blot analysis detection of
NF-κB
No difference in the level of NF-κB was found
between groups N (0.66±0.62) and M (0.56±0.25) (P>0.05; Fig. 1C and D).
Laser confocal microscopy
Laser confocal microscopy was used to evaluate the
co-expression of CX3CL1/CX3CR1 and CX3CL1/NF-κB, and to compare the
cell fluorescence intensities. The level of NF-κB in group N
(1.00±0.09) was decreased compared with that in group M (1.21±0.07)
(P<0.05). Compared with group N (1.00±0.31), the level of CX3CR1
in group M (3.94±0.58) was significantly increased (P<0.01;
Fig. 1E).
Verification of the effects of CX3CL1 on
the model
ELISA detection of IL-6, TNF-α and
ICAM-1
The level of IL-6 in group N was significantly
decreased compared with the levels in groups M and M+CX3
(159.27±15.02) (P<0.01; Fig.
2A). Compared with group M, the levels of IL-6 in groups N,
M+CX3 and N+V (107.40±12.26) were decreased (P<0.01). The level
of TNF-α was significantly higher in groups M, M+CX3 (216.97±9.20)
and N+V (158.00±13.95), compared with that in group N (P<0.01;
Fig. 2A). Compared with group M,
the levels of TNF-α were significantly decreased in groups N and
N+V (P<0.01). Compared with the group N, there was no difference
in the level of ICAM-1 in the other groups (P>0.05; Fig. 2A), nor was there a statistically
significant difference in the level in group M+CX3 (1.37±0.23),
compared with that in group M (P>0.05).
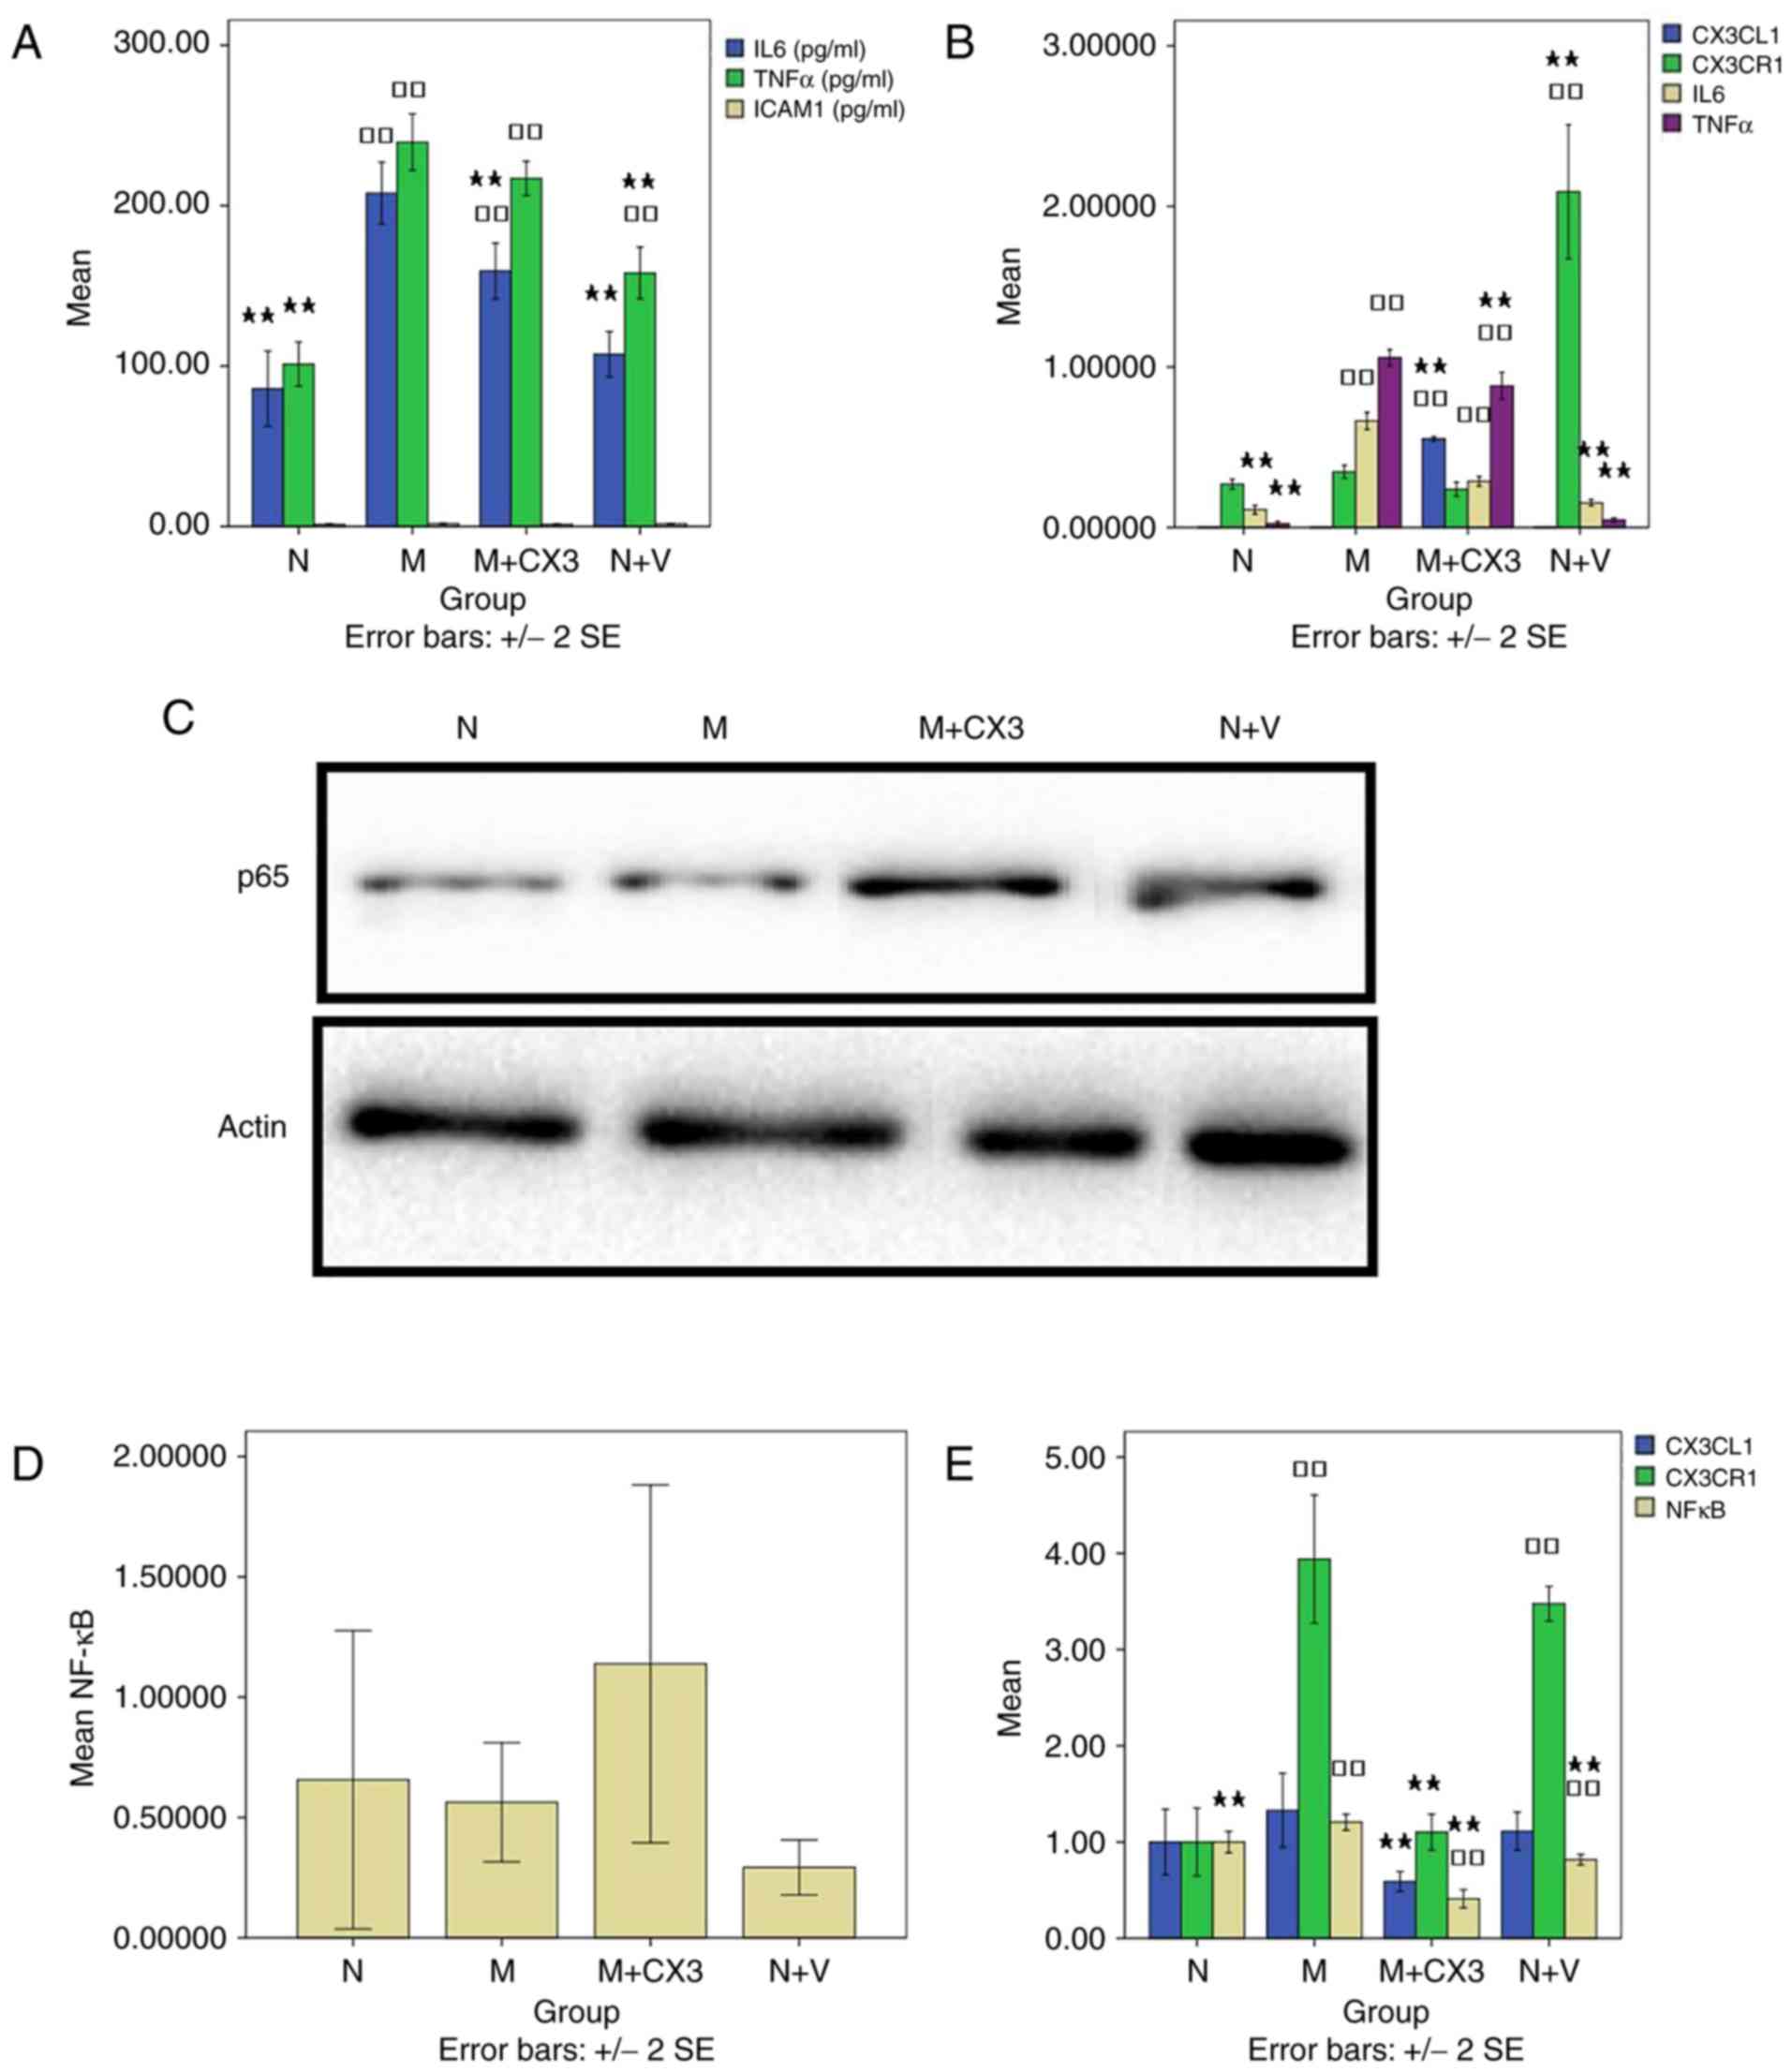 | Figure 2Effects of the overexpression of
CX3CL1 on the model. (A) ELISA was used to determine levels of
IL-6, TNF-α and ICAM-1. (B) Reverse transcription-quantitative
polymerase chain reaction analysis was used to detect CX3CL1,
CX3CR1, IL-6 and TNF-α. (C) Western blotting was performed to
measure NF-κB. (D) Results of western blotting for NF-κB/P65 and
β-actin proteins. □□P<0.01, compared with group N;
★P<0.05 and ★★P<0.01, compared with
group M. (E) Laser confocal microscopy was used to evaluate the
co-expression of CX3CL1/CX3CR1 and CX3CL1/NF-κB. CX3CL1, CX3C
chemokine ligand 1; CX3CR1, CX3C chemokine receptor 1; IL-6,
interleukin-6; TNF-α, tumor necrosis factor-α; ICAM-1,
intercellular adhesion molecule-1; NF-κB, nuclear factor-κB; N,
normal; M, model; M+CX3, model + CX3CL1-overexpression vector; N+V,
normal + virus control. |
RT-qPCR detection of CX3CL1, CX3CR1,
IL-6 and TNF-α
Compared with groups N and M, the level of CX3CL1 in
group M+CX3 (0.55±0.01) was significantly increased (P<0.01;
Fig. 2B). Compared with groups N
and M, the level of CX3CR1 in group N+V (2.09±0.36) was
significantly increased (P<0.01). Compared with the group N, the
levels of IL-6 in groups M and M+CX3 (0.29±0.03) were significantly
increased (P<0.01; Fig. 2B).
Compared with group M, the levels of IL-6 in groups N and N+V
(0.15±0.02) were signifi-cantly decreased (P<0.01). Compared
with the group N, the levels of TNF-α in groups M and M+CX3
(0.88±0.07) were significantly elevated (P<0.01). Compared with
group M, the level of TNF-α in groups N, M+CX3, and N+V (0.05±0.01)
were also significantly decreased (P<0.01; Fig. 2B).
Western blot analysis detection of
NF-κB
Compared with groups N (0.66±0.62) and M
(0.56±0.25), there was no significant difference between the levels
of NF-κB in groups M+CX3 (1.14±0.74) and N+V (0.29±0.11)
(P>0.05; Fig. 2C and D).
Laser confocal microscopy evaluation
of co-expression of CX3CL1/CX3CR1 and CX3CL1/NF-κB
CX3CL1 fluorescence intensity was significantly
decreased in group M+CX3 (0.59±0.09) compared with that in group M
(P<0.01; Fig. 2E). The
intensity of CX3CL1 fluorescence was elevated significantly in
groups M and N+V (3.47±0.16), compared with that in group N
(P<0.01). Compared with group M, the intensity of CX3CL1
fluorescence was decreased significantly in groups N and M+CX3
(1.10±0.16) (P<0.01). No significant differences in the
intensity of NF-κB fluorescence was observed between groups
(P<0.05). Compared with group M, the level of NF-κB fluorescence
was significantly decreased in groups N, M+CX3 (0.41±0.08) and N+V
(0.82±0.05) (P<0.05; Fig.
2E).
Verification of the effect of
CX3CL1-shRNA on the model ELISA detection of IL-6, TNF-α and
ICAM-1
Compared with group N, the level of IL-6 was
significantly elevated in groups M, M+SH (183.60±11.52) and N+V
(P<0.01; Fig. 3A). Compared
with group M, the level of IL-6 was significantly decreased in
groups N, M+SH, and N+V (P<0.01). Compared with group N, the
level of TNF-α was significantly increased in the other four groups
(P<0.01; Fig. 3A). Compared
with group M, no significant difference in the level of TNF-α was
found between groups N, M+SH (282.00±5.63) and N+V (P<0.01). The
level of ICAM-1 in group M+SH (2.39±0.13) was higher compared
withthat in group N (P<0.01; Fig.
3A). The level in group M+SH differed significantly compared
with that in group M (P<0.05).
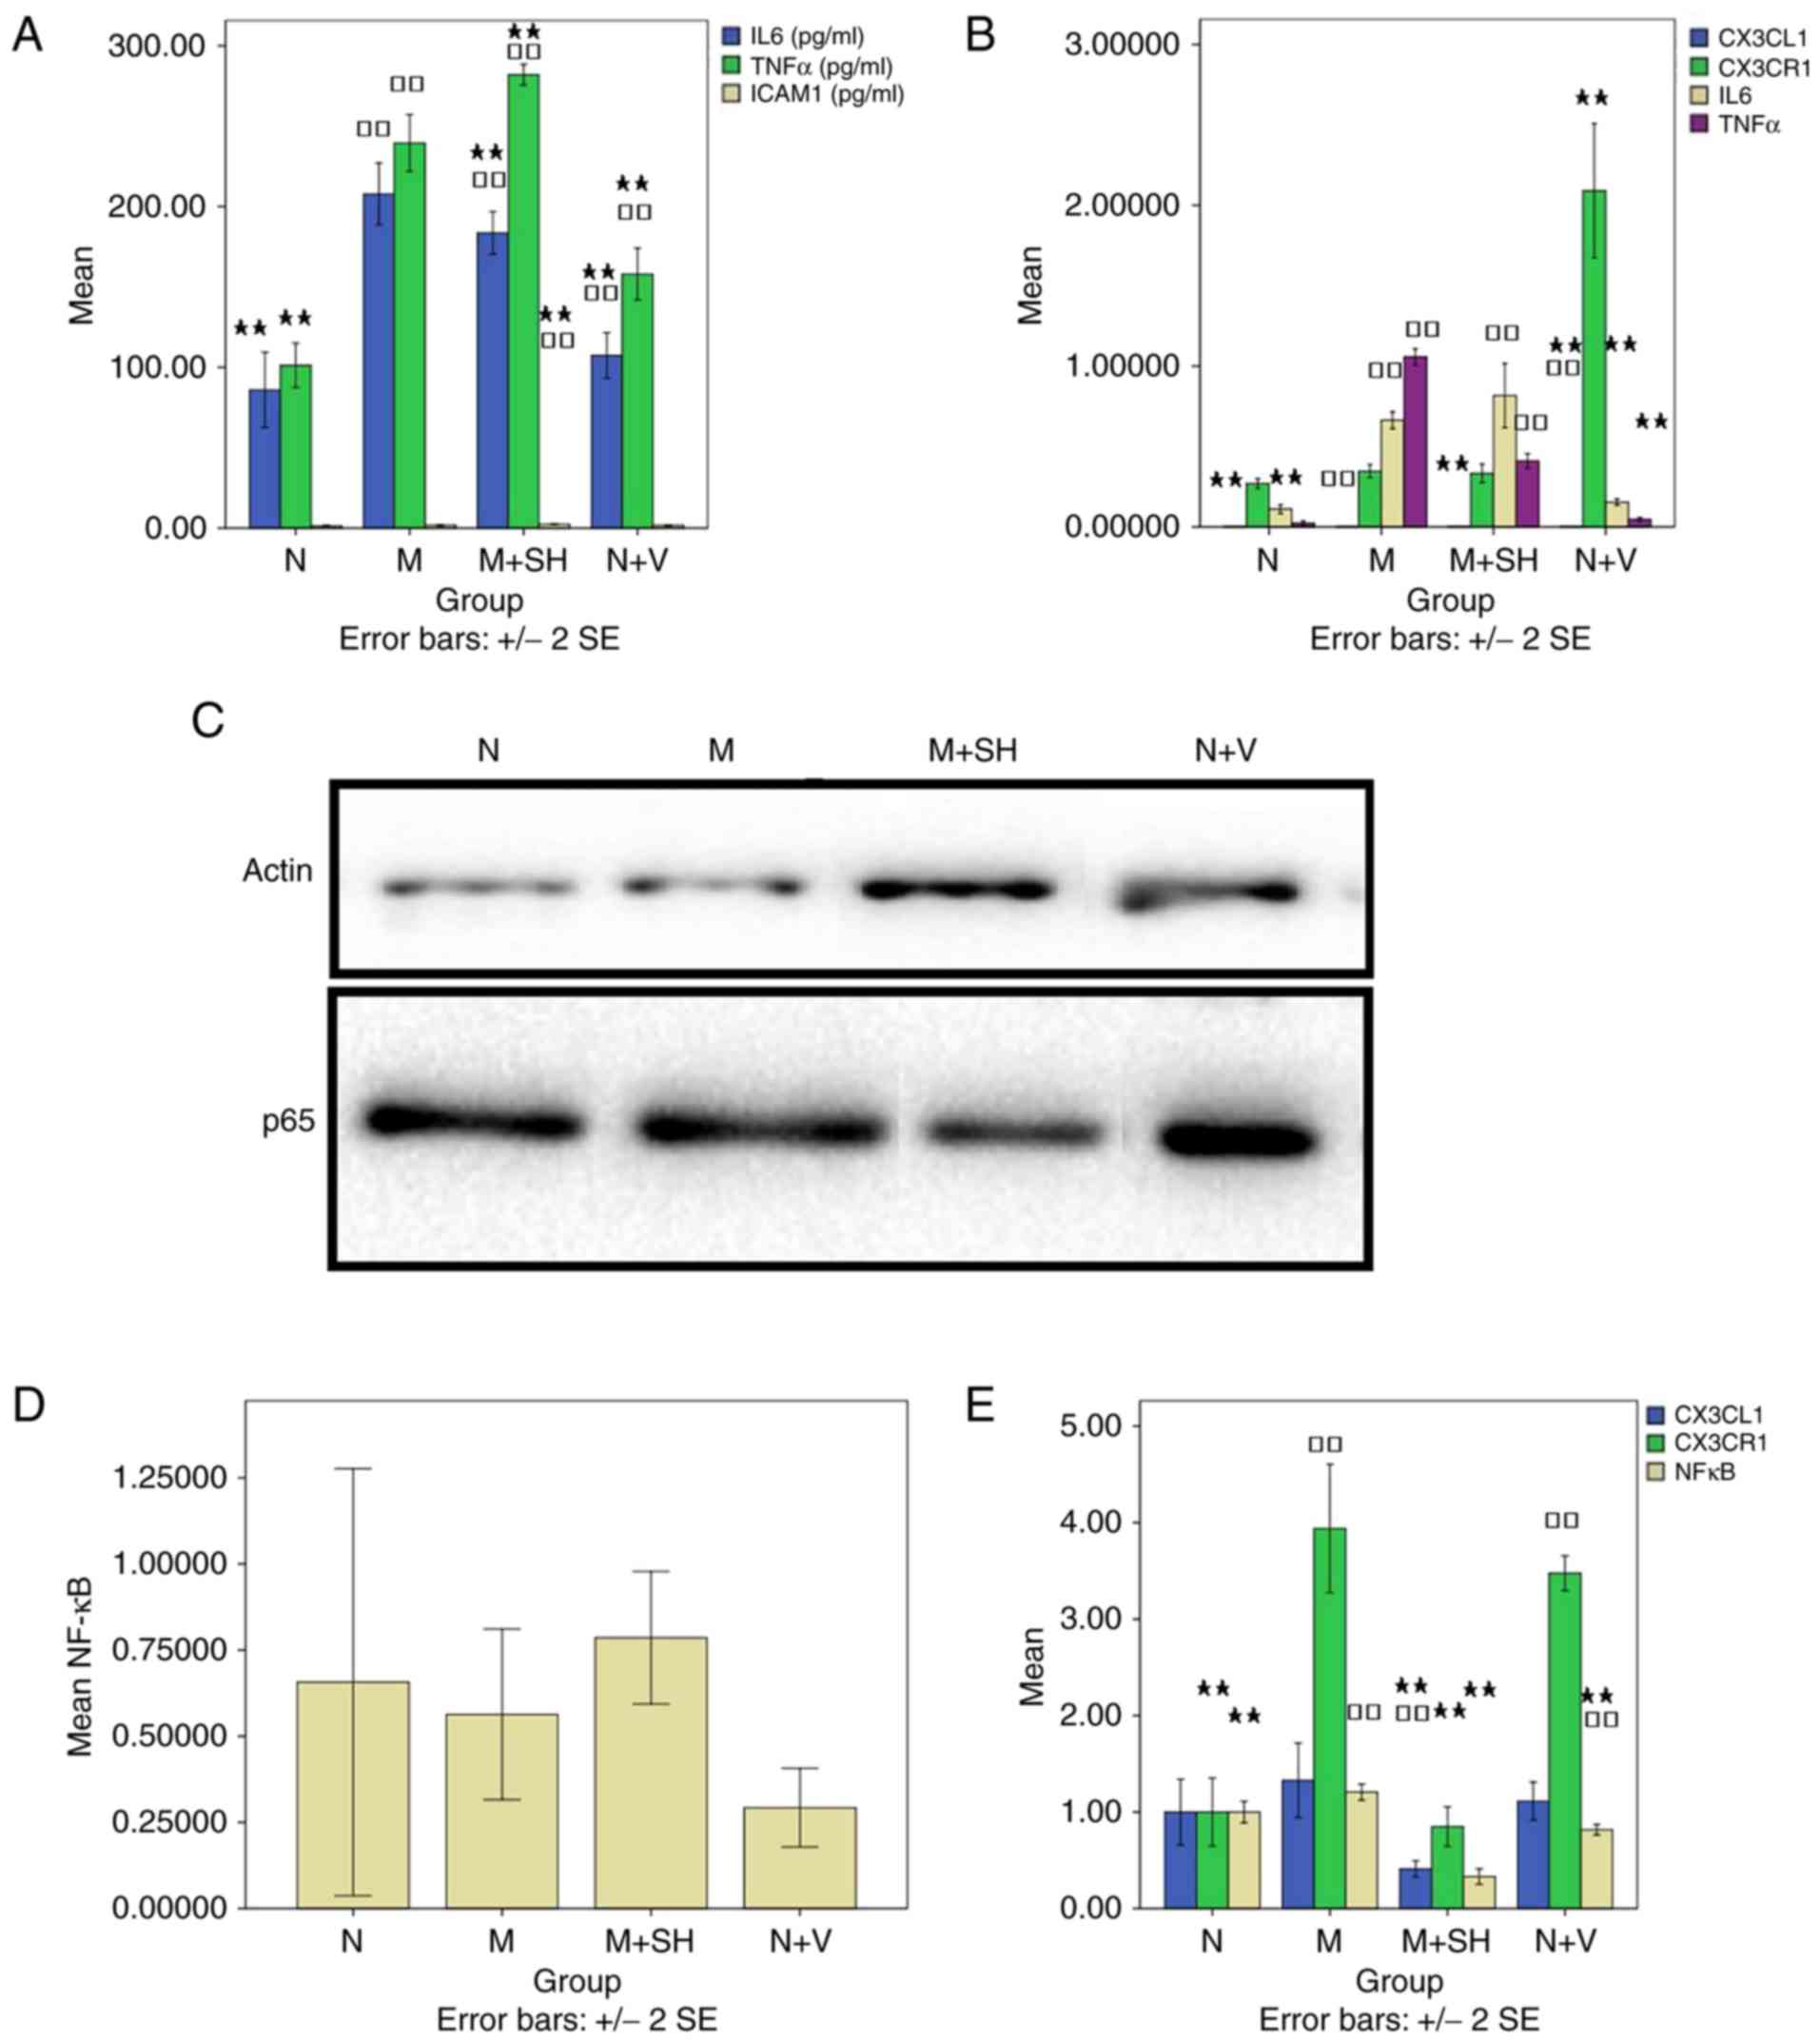 | Figure 3Effects of CX3CL1-shRNA on the model.
(A) ELISA was used to determine levels of IL-6, TNF-α and ICAM-1.
(B) Reverse transcription-quantitative polymerase chain reaction
analysis was performed to analyze CX3CL1, CX3CR1, IL-6 and TNF-α.
(C) Western blotting was used to measure NF-κB. (D) Results of
western blotting for NF-κB/P65 and β-actin proteins. (E) Laser
confocal microscopy was used to evaluate the co-expression of
CX3CL1/CX3CR1 and CX3CL1/NF-κB. □□P<0.01, compared
with group N; ★P<0.05 and ★★P<0.01,
compared with group M. CX3CL1, CX3C chemokine ligand 1; CX3CR1,
CX3C chemokine receptor 1; IL-6, interleukin-6; TNF-α, tumor
necrosis factor-α; ICAM-1, intercellular adhesion molecule-1;
NF-κB, nuclear factor-κB; N, normal; M, model; M+SH,
model+CX3CL1-shRNA; N+V, normal + virus control. |
RT-qPCR detection of CX3CL1, CX3CR1,
IL-6, and TNF-α
The level of CX3CL1 was significantly different in
groups M and N+V (P<0.05; Fig.
3B). Compared with group M, the level of CX3CL1 was
significantly different in groups N, M+SH (0.000033±0.000006) and
N+V (P<0.05). Compared with group N, there was no significant
difference in the level of CX3CR1 in group M+SH (0.33±0.05)
(P>0.05; Fig. 3B). Compared
with group M, the level of CX3CR1 was significantly increased in
group N+V (P<0.01). The level of IL-6 was significantly elevated
in groups M and M+SH (0.82±0.17) compared with that in group N
(P<0.01; Fig. 3B). Compared
with group M, the level of IL-6 was decreased significantly in
groups N and N+V (P<0.01). The level of TNF-α was increased
significantly in groups M and M+SH (0.41±0.04) compared with that
in group N (P<0.01; Fig. 3B).
Compared with group M, the level of TNF-α different significantly
in groups N, M+SH and N+V (P<0.01).
Western blot analysis for the
detection of NF-κB toverify the effect of CX3CL1-shRNA on the
model
Compared with groups N (0.66±0.62) and M
(0.56±0.25), no significant differences were found in groups M+SH
(0.79±0.19) and N+V (0.29±0.11) (P>0.05; Fig. 3C and D).
Evaluation of the co-expression of
CX3CL1/CX3CR1 and CX3CL1/NF-κB by laser confocal microscopy
Compared with groups N and M, the intensity of
CX3CL1 fluorescence was significantly decreased in group M+SH
(0.41±0.07) (P<0.01; Fig. 3E).
Compared with group N, the intensity of CX3CR1 fluorescence was
significantly elevated in groups M and N+V (P<0.01; Fig. 3E). Compared with group M, CX3CR1
fluorescence was significantly decreased in groups N and M+SH
(0.85±0.18) (P<0.01; Fig. 3E).
NF-κB fluorescence intensity was significantly different in groups
M, M+SH (0.33±0.7) and N+V, compared with that in group N
(P<0.05). Compared with group M, NF-κB fluorescence intensity
was significantly decreased in the other three groups
(P<0.05).
ELISA detection of IL-6, TNF-α and
ICAM-1 (Fig. 4)
Compared with group N, the level of IL-6 was
significantly increased in groups M (P<0.01), M+A (118.50±13.56)
(P<0.05), M+SH (P<0.01), M+A+SH (193.53±28.86; P<0.01) and
M+CX3 (P<0.01). Compared with group M, the level of IL-6 was
decreased in groups N, M+A, M+CX3, M+A+CX3 (97.63±13.57) and N+V
(P<0.01). Compared with group M+A, a significant difference in
the level ofIL-6 was found in groups N (P<0.05), M (P<0.01),
M+SH (P<0.01), M+CX3 (P<0.05) and M+A+SH (P<0.01).
Compared with group N+V, the level of IL-6 differed significantly
in groups M, M+SH, M+A+SH and M+CX3 (P<0.01).
Compared with group N, the level of TNF-α was
significantly increased in the other seven groups (P<0.01).
Compared with group M, there was significant difference in groups N
(P<0.01), M+SH (P<0.01), M+A+SH (197.90±14.19; P<0.01),
M+A+CX3 (205.07±25.81; P<0.05) and N+V (P<0.01). Compared
with group M+A (216.67±21.60), there was a significant difference
in groups N, M+SH and N+V (P<0.01). Compared with group N+V, the
level of TNF-α was significantly increased in groups M, M+A, M+SH,
M+CX3, M+A+SH and M+A+CX3 (P<0.01).
Compared with group N, the level of ICAM-1 was
significantly elevated in groups M+SH and M+A+SH (3.00±0.15)
(P<0.01). Compared with group M, there was a significant
difference in groups M+SH (P<0.01), M+A+SH (P<0.01), M+CX3
(P<0.05) and M+A+CX3 (1.32±0.32; P<0.05). Compared with group
M+A (1.74±0.18), there was a significant difference in the level of
ICAM-1 in groups M+SH (P<0.01), M+A+SH (P<0.01) and M+A+CX3
(P<0.05). Compared with group N+V, the level of ICAM-1 was
increased significantly in groups M+SH and M+A+SH (P<0.01).
RT-qPCR detection of CX3CL1, CX3CR1,
IL-6 and TNF-α (Fig. 5)
The level of CX3CL1 was found to differ
significantly in the other seven groups, compared with that in
group M+CX3 (P<0.01). Compared with group M+A+CX3 (1.30±0.08),
the level was decreased significantly in the other seven groups
(P<0.01). The level of CX3CR1 was decreased significantly in the
other seven groups, compared with that in group N+V (P<0.01).
Compared with group N, the level of IL-6 was significantly
different in groups M, M+A (0.27±0.02), M+SH, M+CX3 and M+A+SH
(0.86±0.05) (P<0.01). Compared with group M, the level was
increased significantly in groups M+SH (P<0.05) and M+A+SH
(P<0.01), but was decreased in groups N (P<0.01),
M+A(P<0.01), M+CX3 (P<0.01), M+A+CX3 (P<0.01) and N+V
(P<0.01). Compared with group M+A, the level differed
significantly in groups N, M, M+SH, M+A+SH, M+A+CX3 (0.09±0.01) and
N+V (P<0.05). Compared with group N+V, the level differed
significantly in groups M (P<0.01), M+A (P<0.05), M+SH
(P<0.01), M+A+SH (P<0.01) and M+CX3 (P<0.05). For TNF-α,
compared with group N, the level of was increased significantly in
all groups, with the exception of group N+V (P<0.01). Compared
with group M, there was a significant difference in levels between
groups N (P<0.01), M+SH (P<0.01), M+CX3 (P<0.05) and
M+A+SH (0.58±0.10; P<0.01), N+V (P<0.01). Compared with group
M+A (1.01±0.04), there was a significant difference in levels
between groups N, M+SH, M+A+SH and N+V (P<0.01). Compared with
group N+V, the level of TNF-α was increased significantly in all
groups, with the exception of group N (P<0.01).
Western blot analysis for the
detection of NF-κB (Figs. 6 and
7)
Compared with group M+CX3 (1.14±0.74), the level of
NF-κB was decreased significantly in group M+A+SH (0.47±0.30)
(P<0.05). Compared with group N+V (0.29±0.11), the level was
significantly elevated in group M+CX3 (1.14±0.74) (P<0.05).
There was no significant difference between groups N (0.66±0.62), M
(0.56±0.25) and N+V (0.29±0.11) (P>0.05).
Laser confocal microscopic evaluation
of the co-expression of CX3CL1/CX3CR1 and CX3CL1/NF-κB (Figs. 8Figure 9–10)
Compared with group N, the intensity of CX3CL1
fluorescence was decreased significantly in groups M+SH and M+CX3
(P<0.01). Compared with group M, fluorescence was significantly
decreased in groups M+SH, M+CX3 and M+A+CX3 (0.80±0.17)
(P<0.01). Compared with group M+A (1.49±0.19), fluorescence was
significantly decreased in groups N (P<0.01), M+SH (P<0.01),
M+CX3 (P<0.01), M+A+SH (0.98±0.26) (P<0.05), M+A+CX3 and N+V
(P<0.05). Compared with group N+V, there was a significant
difference in fluorescence between groups M+A (P<0.05), M+SH
(P<0.01) and M+CX3 (P<0.01).
Compared with group N, the intensity of CX3CR1
fluorescence was significantly elevated in groups M, M+A
(2.64±0.21), M+A+SH (1.99±0.47), M+A+CX3 (2.42±0.32) and N+V
(P<0.01). Compared with group M, fluorescence intensity was
decreased significantly in groups M+SH, M+CX3 and M+A+CX3
(P<0.01). Compared with group M+A, fluorescence was
significantly decreased in groups N (P<0.01), M+SH (P<0.01),
M+CX3 (P<0.01) and M+A+SH (P<0.05). Compared with group N+V,
a significant difference was found between all groups, with the
exception of group M (P<0.01).
Compared with group N, NF-κB fluorescence intensity
was significantly different in groups M (P<0.05), M+A
(1.21±0.07; P<0.01), M+SH (P<0.01), M+CX3 (P<0.01), M+A+SH
(0.80±0.09; P<0.05), M+A+CX3 (0.68±0.06) (P<0.01) and N+V
(P<0.05). Compared with group M, fluorescence intensity was
significantly different in group N (P<0.05), M+SH (P<0.01),
M+CX3 (P<0.01), M+A+SH (P<0.01), M+A+CX3 (P<0.01) and N+V
(P<0.01). Compared with group M+A, fluorescence intensity was
significantly different in all groups but group M (P<0.01).
Compared with group N+V, there was a significant difference in
groups N (P<0.05), M (P<0.01), M+A (P<0.01), M+SH
(P<0.01) and M+CX3 (P<0.01).
Discussion
In order to elucidate the potential roles of aspirin
in the inflammatory responses involving the LMVEC model, the
present study investigated gene-protein and receptor-nuclear
interactions. A total of four experimental stages were performed:
Validation of the successful construction of a thrombus-stimulated
cell model; validation of the effect of the overexpression of
CX3CL1 in the model; validation of the effect of CX3CL1-inhibition
in the model; and examination of the effects of aspirin combined
with CX3CL1 on the model. The data from the first three experiments
were derived from the fourth experiment, and the experiments were
performed in triplicate.
When thrombosis occurs, damage in endothelial cells
leads to an inflammatory response (2). In the initial pre-experimental stage
of the present study, a thrombus-stimulated LMVEC model and a cell
scratch test were used, which revealed that the inflammatory
effects were more pronounced, in the former and a previous report
argued that the model could be successfully manufactured (6). Accordingly, the model was improved
in the present study using the instrument-specialized flow of blood
to an advantage, with the experiment involving dynamic change.
Subsequently, the changes in NF-κB B, IL-6, TNF-α, ICAM-1, CX3CL1
and CX3CR1, generated by the stimulatory effect of the thrombus in
LMVECs, were investigated, and the effects of the overexpression
and inhibition of CX3CL1, or the effects of aspirin application
were examined. ELISA, RT-qPCR analysis and cell fluorescence
revealed that the model group secreted significantly higher levels
of TNF-α, IL-6, ICAM-1, CX3CL1, CX3CR1 and NF-κB, compared with the
control group, suggesting that the inflammatory response model of
the thrombus-stimulated LMVECs had been constructed
successfully.
Subsequently, the present study investigated the
changes generated by the stimulatory effects of the thrombus on
LMVECs via the overexpression of CX3CL1. It was found that,
compared with the control group, the overexpression of CX3CL1 in
the intervention model significantly stimulated the secretion of
IL-6, TNF-α and CX3CL1, but had minimal effect on the expression of
NF-κB, ICAM-1 and CX3CR1.
In the third step, it was noted that the levels of
IL-6, TNF-α and ICAM-1 were significantly elevated in the
CX3CL1-shRNA intervention model, compared with those in the control
group. However, the expression levels of IL-6, ICAM-1, CX3CL1,
CX3CR1 and NF-κB expression were significantly decreased in the
model group.
Finally, the present study found that aspirin
inhibited the expression of IL-6 in the model group; aspirin
combined with shRNA or the overexpression of CX3CL1 inhibited the
secretion of IL-6 in the model group, whereas aspirin combined with
shRNA inhibited TNF-α in the model group. The inhibition of CX3CL1
by shRNA in the model suggested that the construction of a
CX3CL1-shRNA adenovirus vector had been successful. Aspirin, either
alone or combined with shRNA, inhibited CX3CR1 in the model, with
shRNA being more effective than aspirin atinhibiting CX3CR1. shRNA
inhibited NF-κB, and was more effective than aspirin at inhibiting
NF-κB in the model.
Fractalkine (CX3CL1) is the only member of the CX3C
family that can bind to its specific receptor (CX3CR1) and mediate
tight adhesion between inflammatory cells and vascular endothelial
cells (11). CX3CL1 is important
in the recruitment of inflammatory cells into the vascular wall in
endothelial cell injury (12,13). Previous studies have reported that
TNF-α stimulates the CX3CL1/CX3CR1 inflammatory signaling pathway,
whereas our previous studies revealed that the expression levels of
TNF-α, CX3CL1 and CX3CR1 were significantly increased in rats with
pulmonary embolism (3,14). Certain studies have reported that
the presence and the stimulation of the CX3CL1 receptor, CX3CR1, is
correlated with the reduced release of IL-1β and TNF-α (15,16). Sukkar et al (17) reported that chemokines are
important in bronchial asthma and chronic obstructive pulmonary
disease, with CX3CL1 acting as a chemo attractant for cell adhesion
molecules, monocytes and T cells. The combination of interferon-γ
and TNF-α stimulated the mRNA and protein secretion of CX3CL1
dependent on time and concentration, whereas dexamethasone
significantly promoted the secretion of CX3CL1. Studies have also
reported that CX3CL1 is involved a variety of diseases, including
acute severe pancreatitis, cerebral ischemia and acute hypoxia,
breast cancer, rheumatoid arthritis, and increased pulmonary
hypertension (18-22). The regulatory mechanisms
associated with CX3CL1 may also involve NF-κB. Yang et al
(23) suggested that TNF-α
promotes the adhesion of monocyte THP-1 to human umbilical vein
endothelial cells via the regulation of adhesion molecules by the
NF-κB signaling pathway, including the expression of chemokine
CX3CL1/monocyte chemotactic protein-1 of ICAM/vascular cell
adhesion molecule/S-select in. Cimato et al (24) found that inflammatory cytokines,
rather than cholesterol, regulated the expression of CX3CL1 in
atherosclerosis. Cao et al suggested that human dermal
microvascular endothelial cell-1 in patients with inflammatory skin
disease induced chemokines, including CXCL8, CX3CL1 and CXCL16, by
activating the NF-κB signaling pathway when stimulated by TNF-α,
which is in agreement with our previous finding that
LPS-NF-κB-CX3CL1 exists in human bronchial epithelial cells
(5,25). The present study revealed that
CX3CL1-shRNA inhibited the secretion of NF-κB in the
thrombus-stimulated LMVEC model, which was also consistent with a
previous report (26). In
addition, aspirin combined with CX3CL1-shRNA inhibited the
secretion of NF-κB, further supporting our previous finding that
aspirin decreased the levels of NF-κB in rats with pulmonary
embolism (4). Our previous study
found that aspirin significantly decreased pulmonary arterial
pressure, improved pathological changes in embolism, and decreased
the expression of CX3CL1/CX3CR1 and CX3CL1/NF-κB, whereas the
adenovirus CX3CL1-overexpression vector aggravated the inflammatory
changes in APE improved by aspirin. In addition, the intervention
of the adenovirus CX3CL1 vector reduced the changes, and its
combination with aspirin significantly improved the changes
(4). These in vivo
experimental results were further validated in the cell experiments
in the present study.
ICAM-1 belongs to an immunoglobulin superfamily, and
is a transmembrane, single chain glycoprotein expressed in
leukocytes, fibroblasts and epithelial cells (27). ICAM-1 can induce the expression of
inflammatory factors, including IL-1α, IL-1β, IL-6 and TNF-α, via
signaling pathways involving NF-κB, thereby promoting the
development of inflammation (28). In the present study, it was found
that a significantly higher level of ICAM-1 was expressed in the
model group, compared with that in the control group, and that
CX3CL1-shRNA decreased the expression of ICAM-1. Aspirin did not
effectively inhibit the secretion of ICAM-1 in the model group,
which was consistent with a previous finding that CX3CL1 induced
cell migration by upregulating the expression of ICAM-1 via the
CX3CR1/PI3K/Akt/NF-κB pathway in human osteosarcoma cells (29).
Aspirin irreversibly inhibits cyclooxygenase,
preventing the formation of thromboxane A2 in platelets (30). The substance can also have
anti-inflammatory effects by preventing the activation of NF-κB
(31), associated with the
inhibited activation of NF-κB kinase β by aspirin, decreasing the
binding activity of NF-κB DNA (32). Studies have reported that aspirin
exerts certain effects on NF-κB, IL-6, TNF-α, ICAM-1, CX3CL1 and
CX3CR1, which is consistent with the findings of the present study
(33,34).
As the primary mechanism underlying pulmonary
embolism formation and propagation is not caused by the
inflammatory response itself, future investigations are required to
focus on the association between inflammation and blood coagulation
following endothelial cell damage in the pulmonary vasculature.
A major limitation of the present study was that the
Virchow'striad mechanism of venous thrombosis involves vascular
endothelial cell injury, circulatory stasis and a
hypercoagulablestate, therefore, the association between
inflammation and coagulation requires further investigation.
In conclusion, the present study showed that TNF-α,
IL-6, CX3CL, CX3CR1, NF-κB and ICAM-1 were secreted in the
thrombus-stimulated LMVEC model; the signaling pathways of
CX3CL1-NF-κB, IL-6 and TNF-α were important in the disease process
and were partly inhibited by aspirin.
Acknowledgments
The authors of the present study would like to thank
the following personnel for the collection of data: Dr Wen Feng, Dr
Zhaokun Fan, Dr Ronglin Jiang (all affiliated with the Department
of ICU, the First Affiliated Hospital of Zhejiang Chinese Medical
University, Hangzhou, Zhejiang 310006).
Abbreviations:
|
APE
|
acute pulmonary embolism
|
|
LMVECs
|
lung microvascularendothelial
cells
|
Notes
[1]
Funding
This study was supported by the Natural Sciences
Fund of Zhejiang Province (grant nos. LY17H290006 and LY14H290002),
the Zhejiang Provincial Program for the Cultivation of High-Level
Innovative Health Talents (grant no. 2014-108) and the Wenling City
Key Discipline Group of Oncology (grant no. 2016-127).
[2] Availability
of data and materials
The datasets used and/or analyzed during the current
study are available from the corresponding author on reasonable
request.
[3] Authors'
contributions
LW proposed the study and wrote the paper. RY
analyzed and interpreted the data from Thrombus-stimulated model,
HJ analyzed and interpreted the data from verification of the
effects of CX3CL1 on the model, QJ analyzed and interpreted the
data from verification of the effect of CX3CL1-shRNA on the model,
JK was involved in the ELISA and western blottin, ZZ was involved
in the confocal microscopy, YS in was involved in reverse
transcription-quantitative polymerase chain reaction, DC in was
involved in the confocal microscopy and RY was involved in vector
construction. All authors read and approved the final
manuscript.
[4] Ethics
approval and consent to participate
All animal experiments, including the method of
sacrifice, were performed in compliance with the institutional
animal care regulations and guidelines of Zhejiang Chinese Medical
University, and performed according to the AAALAC and the IACUC
guidelines. The present study was approved by the Laboratory Animal
Management and Ethical Review Committee (approval no.
ZSLL-2015-1015) of Zhejiang Chinese Medical University (Hangzhou,
China).
[5] Consent for
publication
Not applicable.
[6] Competing
interests
The authors declare that they have no competing
interests.
References
|
1
|
Saghazadeh A, Hafizi S and Rezaei N:
Inflammation in venous thromboembolism: Cause or consequence? Int
Immunopharmacol. 28:655–665. 2015. View Article : Google Scholar : PubMed/NCBI
|
|
2
|
Deng C, Zhai Z, Wu D, Lin Q, Yang Y, Yang
M, Ding H, Cao X, Zhang Q and Wang C: Inflammatory response and
pneumocyte apoptosis during lung ischemia-reperfusion injury in an
experimental pulmonary thromboembolism model. J Thromb
Thrombolysis. 40:42–53. 2015. View Article : Google Scholar : PubMed/NCBI
|
|
3
|
Wang LC, Wu JN, Xia GL, Mao W, Ying RB,
Huang LQ and Jiang GL: Effect of aspirin on fractalkine in rats
with pulmonary embolism. Trop J Pharm Res. 13:753–760. 2014.
View Article : Google Scholar
|
|
4
|
Wang LC, Jiang RL, Zhang W, Wei LL and
Yang RH: Effects of aspirin on the expression of nuclear factor-κB
in a rat model of acute pulmonary embolism. World J Emerg Med.
5:229–233. 2014. View Article : Google Scholar
|
|
5
|
Jiang R, Wei L, Zhu M, Wu J and Wang L:
Aspirin inhibits LPS-induced expression of PI3K/Akt, ERK, NF-κB,
CX3CL1, and MMPs in human bronchial epithelial cells. Inflammation.
39:643–650. 2016. View Article : Google Scholar
|
|
6
|
Felding-Habermann B, Habermann R, Saldívar
E and Ruggeri ZM: Role of beta3 integrins in melanoma cell adhesion
to activated platelets under flow. J Biol Chem. 271:5892–5900.
1996. View Article : Google Scholar : PubMed/NCBI
|
|
7
|
Terrisse AD, Puech N, Allart S, Gourdy P,
Xuereb JM, Payrastre B and Sié P: Internalization of microparticles
by endothelial cells promotes platelet/endothelial cell interaction
under flow. J Thromb Haemost. 8:2810–2819. 2010. View Article : Google Scholar : PubMed/NCBI
|
|
8
|
Liu X, Liu J, Zhao S, Zhang H, Cai W, Cai
M, Ji X, Leak RK, Gao Y, Chen J and Hu X: Interleukin-4 is
essential for Microglia/Macrophage M2 polarization and long-term
recovery after cerebral ischemia. Stroke. 47:498–504. 2016.
View Article : Google Scholar : PubMed/NCBI
|
|
9
|
Livak KJ and Schmittgen TD: Analysis of
relative gene expression data using real-time quantitative PCR and
the 2(−Delta Delta C(T)) method. Methods. 25:402–408. 2001.
View Article : Google Scholar
|
|
10
|
Malenovska H: Virus quantitation by
transmission electron microscopy, TCID50, and the role
of timing virus harvesting: A case study of three animal viruses. J
Virol Methods. 191:136–140. 2013. View Article : Google Scholar : PubMed/NCBI
|
|
11
|
Bazan JF, Bacon KB, Hardiman G, Wang W,
Soo K, Rossi D, Greaves DR, Zlotnik A and Schall TJ: A new class of
membrane-bound chemokine with a CX3C motif. Nature. 385:640–644.
1997. View
Article : Google Scholar : PubMed/NCBI
|
|
12
|
Todorova D, Sabatier F, Doria E, Lyonnet
L, Vacher Coponat H, Robert S, Despoix N, Legris T, Moal V, Loundou
A, et al: Fractalkine expression induces endothelial progenitor
cell lysis by natural killer cells. PLoS One. 6:e266632011.
View Article : Google Scholar : PubMed/NCBI
|
|
13
|
Matsumiya T, Ota K, Imaizumi T, Yoshida H,
Kimura H and Satoh K: Characterization of synergistic induction of
CX3CL1/fractalkine by TNF-alpha and IFN-gamma in vascular
endothelial cells: An essential role for TNF-alpha in
post-transcriptional regulation of CX3CL1. J Immunol.
184:4205–4214. 2010. View Article : Google Scholar : PubMed/NCBI
|
|
14
|
Szukiewicz D, Kochanowski J, Mittal TK,
Pyzlak M, Szewczyk G and Cendrowski K: CX3CL1 (fractalkine) and
TNFα production by perfused human placental lobules under normoxic
and hypoxic conditions in vitro: The importance of CX3CR1
signaling. Inflamm Res. 63:179–189. 2014. View Article : Google Scholar
|
|
15
|
Cardona AE, Pioro EP, Sasse ME, Kostenko
V, Cardona SM, Dijkstra IM, Huang D, Kidd G, Dombrowski S, Dutta R,
et al: Control of microglial neurotoxicity by the fractalkine
receptor. Nat Neurosci. 9:917–924. 2006. View Article : Google Scholar : PubMed/NCBI
|
|
16
|
Lyons A, Lynch AM, Downer EJ, Hanley R,
O'Sullivan JB, Smith A and Lynch MA: Fractalkine-induced activation
of the phosphatidylinositol-3 kinase pathway attentuates microglial
activation in vivo and in vitro. J Neurochem. 110:1547–1556. 2009.
View Article : Google Scholar : PubMed/NCBI
|
|
17
|
Sukkar MB, Issa R, Xie S, Oltmanns U,
Newton R and Chung KF: Fractalkine/CX3CL1 production by human
airway smooth muscle cells: Induction by IFN-gamma and TNF-alpha
and regulation by TGF-beta and corticosteroids. Am J Physiol Lung
Cell Mol Physiol. 287:L1230–L1240. 2004. View Article : Google Scholar : PubMed/NCBI
|
|
18
|
Li F, Zhang H, Xu KY, Wei Q and Zhou GX:
Role of the chemokine fractalkine in a rat model of acute
necrotizing pancreatitis and the interventional effect of
ulinastatin. Arch Iran Med. 16:83–87. 2013.PubMed/NCBI
|
|
19
|
Briones TL, Woods J and Wadowska M:
Chronic neuroinflammation and cognitive impairment following
transient global cerebral ischemia: Role of fractalkine/CX3CR1
signaling. J Neuroinflammation. 11:132014. View Article : Google Scholar : PubMed/NCBI
|
|
20
|
Tsang JY, Ni YB, Chan SK, Shao MM, Kwok
YK, Chan KW, Tan PH and Tse GM: CX3CL1 expression is associated
with poor outcome in breast cancer patients. Breast Cancer Res
Treat. 140:495–504. 2013. View Article : Google Scholar : PubMed/NCBI
|
|
21
|
Volin MV, Huynh N, Klosowska K, Reyes RD
and Woods JM: Fractalkine-induced endothelial cell migration
requires MAP kinase signaling. Pathobiology. 77:7–16. 2010.
View Article : Google Scholar : PubMed/NCBI
|
|
22
|
Ars C, Thurion P, Delos M, Sibille Y and
Pilette C: Small airway obstruction in severe pulmonary arterial
hypertension correlates with increased airway CD8+
T-cells and fractalkine expression. Eur Respir J. 34:1494–1496.
2009. View Article : Google Scholar : PubMed/NCBI
|
|
23
|
Yang RC, Chang CC, Sheen JM, Wu HT, Pang
JH and Huang ST: Davallia bilabiata inhibits TNF-α-induced adhesion
molecules and chemokines by suppressing IKK/NF-kappa B pathway in
vascular endothelial cells. Am J Chin Med. 42:1411–1429. 2014.
View Article : Google Scholar
|
|
24
|
Cimato TR and Palka BA: Fractalkine
(CX3CL1), GM-CSF and VEGF-a levels are reduced by statins in adult
patients. Clin Transl Med. 3:142014. View Article : Google Scholar : PubMed/NCBI
|
|
25
|
Cao N, Chen T, Guo ZP, Qin S and Li MM:
Monoammonium glycyrrhizate suppresses tumor necrosis factor-α
induced chemokine production in HMEC-1 cells, possibly by blocking
the translocation of nuclear factor-kB into the nucleus. Can J
Physiol Pharmacol. 92:859–865. 2014. View Article : Google Scholar : PubMed/NCBI
|
|
26
|
Guo X, Pan Y, Xiao C, Wu Y, Cai D and Gu
J: Fractalkine stimulates cell growth and increases its expression
via NF-κB pathway in RA-FLS. Int J Rheum Dis. 15:322–329. 2012.
View Article : Google Scholar : PubMed/NCBI
|
|
27
|
Anbarasan C, Bavanilatha M, Latchumanadhas
K and Ajit Mullasari S: ICAM-1 molecular mechanism and genome wide
SNP's association studies. Indian Heart J. 67:282–287. 2015.
View Article : Google Scholar : PubMed/NCBI
|
|
28
|
Lee SJ, Drabik K, Van Wagoner NJ, Lee S,
Choi C, Dong Y and Benveniste EN: ICAM-1-induced expression of
proinflammatory cytokines in astrocytes: Involvement of
extracellular signal-regulated kinase and p38 mitogen-activated
protein kinase pathways. J Immunol. 165:4658–4666. 2000. View Article : Google Scholar : PubMed/NCBI
|
|
29
|
Liu JF, Tsao YT and Hou CH:
Fractalkine/CX3CL1 induced intercellular adhesion
molecule-1-dependent tumor metastasis through the
CX3CR1/pI3K/Akt/NF-κB pathway in human osteosarcoma. Oncotarget.
8:54136–54148. 2016.
|
|
30
|
Tarantino E, Amadio P, Squellerio I, Porro
B, Sandrini L, Turnu L, Cavalca V, Tremoli E and Barbieri SS: Role
of thromboxane-dependent platelet activation in venous thrombosis:
Aspirin effects in mouse model. Pharmacol Res. 107:415–425. 2016.
View Article : Google Scholar : PubMed/NCBI
|
|
31
|
Zhang F, Lu M, Wang H and Ren T: Aspirin
attenuates angiotensin II-induced inflammation in bone marrow
mesenchymal stem cells via the inhibition of ERK1/2 and NF-κB
activation. Biomed Rep. 1:930–934. 2013. View Article : Google Scholar
|
|
32
|
Stark LA, Din FV, Zwacka RM and Dunlop MG:
Aspirin-induced activation of the NF-κB signaling pathway: A novel
mechanism for aspirin-mediated apoptosis in colon cancer cells.
Faseb J. 15:1273–1275. 2001. View Article : Google Scholar : PubMed/NCBI
|
|
33
|
Chang MC, Hung HP, Lin LD, Shyu YC, Wang
TM, Lin HJ, Chan CP, Huang CC and Jeng JH: Effect of interleukin-1β
on ICAM-1 expression of dental pulp cells: Role of PI3K/Akt,
MEK/ERK, and cyclooxygenase. Clin Oral Investig. 19:117–126. 2015.
View Article : Google Scholar
|
|
34
|
Szukiewicz D, Wojciechowska M, Bilska A,
Stangret A, Szewczyk G, Mittal TK, Watroba M and Kochanowski J:
Aspirin action in endothelial cells: Different patterns of response
between chemokine CX3CL1/CX3CR1 and TNF-α/TNFR1 signaling pathways.
Cardiovasc Drugs Ther. 29:219–229. 2015. View Article : Google Scholar : PubMed/NCBI
|


