Introduction
Electrohypersensitivity (EHS) is a new World Health
Organization (WHO)-acknowledged disabling condition occurring in
EHS self-reporting patients (1).
Following the WHO-sponsored international workshop
on electromagnetic hypersensitivity in 2004 in Prague (Czech
Republic) the use of the term 'idiopathic environmental intolerance
(IEI) attributed to electromagnetic fields (IEI-EMF)' was proposed
to qualify this new EHS-associated detrimental health condition
(2).
Using ultrasonic cerebral tomosphygmography (UCTS),
it was recently demonstrated that EHS self-reporting patients
present with a decrease in mean cerebral tissue pulsation index
(PI) in a number of areas of the temporal lobe, particularly in the
capsulo-thalamic area, which contains the limbic system and the
thalamus; it was additionally suggested that these abnormalities
may in fact be associated with a decrease in brain blood flow
and/or neuronal dysfunction in these particular brain areas
(3–5). EHS self-reporting patients were also
objectively identified and characterized by demonstrating potential
associations with a number of biological abnormalities, consisting
of a degree of inflammation, heat-shock protein-associated cellular
stress and autoimmune responses in the peripheral blood, and an
abnormal 6-hydroxy-melatonin sulfate/creatinine ratio in the urine
(3). In fact, since it was
reported that numerous EHS self-reporting patients present reliable
clinical symptoms each time they report exposure to electromagnetic
sources, and present with objective UCTS and biological
abnormalities (4,5), the authors of the present study
proposed the use of the more concise term electromagnetic field
intolerance syndrome (EMFIS) to qualify the so-called newly
WHO-recognized IEI-EMF pathological condition with which these
patients are associated (4).
The present prospective in vivo biochemical
investigation aimed to determine whether EHS self-reporting
patients may also be characterized by oxidative stress
abnormalities in the peripheral blood, to further identify and
characterize EMFIS.
Materials and methods
Inclusion criteria
According to a previous study (3), EHS, more precisely EMFIS in EHS
self-reporting patients, was defined on the basis of the five
following clinical criteria: i) Absence of known pathology
accounting for the observed clinical symptoms; ii) as reported by
the patients, reproducibility of symptoms under the supposed
influence of electromagnetic fields (EMFs), regardless of the
incriminated source; iii) regression or disappearance of symptoms
associated with reported EMF avoidance; iv) clinical symptoms
compatible with those previously ascribed to EHS self-reporting
patients in the scientific literature; and v) chronic evolution
(6–10).
Prior to inclusion, all patients had a face-to-face
interview based on a previously validated questionnaire, a complete
general and neurological clinical examination and a systematic
biological check-up, including currently used peripheral blood
tests, to exclude any non-EMFIS-associated pathology. Therefore, to
be included in the study, patients had no history of such
pathologies as cancer, Alzheimer's disease, diabetes type II and/or
cardiovascular disease. Patients also had no associated multiple
chemical sensitivity (MCS), and were in an active symptomatic phase
of their pathological condition(s), whether or not they had been
previously treated. In addition, patients had a normal carotid and
vertebral artery echodoppler scan, normal hematological, hepatic,
renal and metabolic peripheral blood tests, and, when available, a
normal magnetic resonance imaging or computed tomography scan.
However, since the majority of clinical symptoms in
EHS self-reporting patients are subjective, two biological
inclusion criteria were added to objectively identify EMFIS: i) A
mean decreased tissue pulsometric index in at least three middle
cerebral artery-dependent tissue sections in the temporal lobes, as
demonstrated using UCTS, as it has been previously reported that
UCTS is able to discriminate between EHS self-reporting patients
and healthy subjects using this criterion (11); and ii) an increase in at least one
of three inflammation-associated peripheral blood biomarkers that
have previously been identified as being possibly detected in EHS
self-reporting patients (3):
Increased histamine, a mediator of inflammation (12); increased protein S100B, a marker
of oxidative stress-associated blood brain barrier opening
(13,14); and increased chaperone proteins
heat shock protein β1 (HSP27) or heat shock 70 kDa protein 1B
(HSP70), markers of heat-shock cell stress-associated inflammation
and/or immune response (15,16). References for the methods used to
measure these three inflammation-associated peripheral blood
biomarkers are indicated in Table
I (17–20).
 | Table IInflammation-associated biomarkers
investigated in electrohypersensitivity self-reporting
patients. |
Table I
Inflammation-associated biomarkers
investigated in electrohypersensitivity self-reporting
patients.
| Author, year | Biomarker | Sample type | (Refs.) |
|---|
| Lebel et al,
1996 | Histamine | Plasma | (17) |
| Smit et al,
2005 | Protein S100B | Serum | (18) |
| De and Roach,
2004 | HSP27 | Serum | (19) |
| Pockley et
al, 1998 | HSP70 | Serum | (20) |
Oxidative and antioxidative
stress-related biomarkers
A battery of biomarkers were used to measure
oxidative stress and antioxidative stress responses, in plasma
and/or red blood cells (RBCs) (Table
II). Measurements were performed following centrifugation
(4,000 x g; 10 min; 4°C) to separate RBCs from plasma.
| Table IIMethods of measurement of oxidative
stress-associated biomarkers, antioxidative non-enzymatic proteins
and antioxidative enzymes in the plasma and/or red blood cells in
electrohypersensitivity self-reporting patients, with
electromagnetic field intolerance syndrome. |
Table II
Methods of measurement of oxidative
stress-associated biomarkers, antioxidative non-enzymatic proteins
and antioxidative enzymes in the plasma and/or red blood cells in
electrohypersensitivity self-reporting patients, with
electromagnetic field intolerance syndrome.
| Author, year | Biomarkers
oxidative stress | Sample type | (Refs.) |
|---|
| Londero and Lo
Greco, 1996 | MDA | Plasma | (24) |
| Okhawa et
al, 1979 | TBARS | Plasma | (25) |
| Akerboom and Sies,
1981 | GSSG | Plasma | (26) |
| Ischiropoulos et
al, 1992 | NTT
Antioxidative non-enzymatic proteins | Plasma | (27) |
| Jocelyn, 1987 | Total thiol | Plasma | (28) |
| Akerboom and Sies,
1981 | GSH | Plasma | (26) |
| Akerboom and Sies,
1981 | GluTa
Antioxidative enzymes | Plasma | (26) |
| Marklund and
Marklund, 1974 | SOD | RBC | (29) |
| Mannervik,
2001 | GR | Plasma/RBC | (30) |
| Günzler et
al, 1974 | GPx | Plasma/RBC | (31) |
Oxidative stress biomarkers
For oxidative stress assessment, the following
biomarkers were measured in the plasma: All thiobarbituric
acid-reactive substances (TBARs), and particularly one of them,
malondialdehyde (MDA), which are markers of lipid peroxidation
(21); glutathione disulfide
(GSSG), which is a marker of reduced glutathione (GSH) oxidation
(22); and nitrotyrosine (NTT),
which is a marker of peroxynitrite-induced oxidative/nitrosative
stress (23).
To measure MDA, the standard method described by
Londero and Lo Greco (24) was
used. When MDA reacts with TBA, the MDA-TBA complex is separated
from interfering substances and specifically identified using
reverse-phase high-performance liquid chromatography coupled with
UV/visible detection. MDA is quantified on the basis of its strong
light-absorbing and fluorescing properties following the reaction
with TBA. The results are expressed in µM. For the dosage of
lipid peroxidation intermediates, all plasma TBARs were measured,
including MDA, using a method similar to that of Ohkawa et
al (25). The present method
was based on the reaction of the aldehyde function of TBARs
released by acid hydrolysis at 95°C with TBA to form a TBAR-TBA
colored complex, which is quantified by fluorometry. Results are
expressed in µM. Total glutathione (GluT), GSH and oxidized
glutathione (GSSG) were determined enzymatically from the acidic
protein-free supernatant, according to the method of Akerboom and
Sies (26). The assay for GSSG
was performed subsequent to masking GSH by adding 2-vinylpyridine
to the deproteinized extract. The assay for NTT was performed
according to the method of Ischiropoulos et al (27), which uses a competitive ELISA test
(OxiSelect™ Nitrotyrosine ELISA kit; cat. no. STA-305; Cell Biolabs
Inc., San Diego, CA, USA). For the determination of this last
marker (NTT), plasma was first added to a nitrated bovine serum
albumin (BSA) (OxiSelect™ Nitrotyrosine ELISA kit; cat. no.
STA-319) preabsorbed enzyme immunoassay plate. Following a brief
incubation, a specific anti-nitrotyrosine antibody (OxiSelect™
Nitrotyrosine ELISA kit; part no. 230502) was added, followed by
the addition of a horseradish peroxidase (HRP)-conjugated secondary
antibody [OxiSelect™ Nitrotyrosine ELISA kit; HRP Conjugate (part
no. 231009)]. The dilution of the anti-nitrotyrosine antibody was
1:1,000 and that of the secondary antibody was 1:1,000, and the
incubation was performed at room temperature for 1 h. The protein
NTT content in the plasmatic sample was determined by comparison
with a standardized curve that was established from predetermined
nitrated BSA standards, the results being expressed in
µg/ml.
Antioxidative non-enzymatic proteins
For the non-enzymatic antioxidative response
assessment, the total thiol group molecules, which comprise such
peptides as glutathione and cysteine- and/or
homocysteine-containing proteins, were measured in the plasma. For
the dosage of the total SH group molecules, 5,5′-dithio-bis
(2-nitrobenzoic acid) was used as reagent and the level of
plasmatic SH group molecules was measured spectrophotometrically at
412 nm. The results are expressed in U/l (28). The dosage of GluT, GSH and GSSG in
the plasma was calculated using the method of Akerboom and Sies
(26). Prior to centrifugation
(400 x g; 10 min; 4°C), 400 µl whole blood was collected in
3.6 ml metaphoric acid. Following centrifugation, GluT and GSH were
measured enzymatically in the acidic protein-free-supernatant. The
assay of GSSG was performed following masking of GSH by adding
2-vinylpyridine to the deproteinized extract. Similar to GluT and
GSH, GSSG was measured enzymatically. Results are expressed in
µM.
Antioxidative enzymatic proteins
Measurement of the antioxidative enzymes was
performed in RBCs only, or in RBCs and plasma. To measure Cu-Zn
superoxide dismutase (SOD1) activity in RBCs, the method described
by Marklund and Marklund (29)
was used, which consists of a simple and rapid test based on the
ability of SOD1 to inhibit the autoxidation of pyrogallol. The
principle of this method is based on the competition between
pyrogallol autoxidation by the superoxide anion
(O2−) and the dismutation of this radical by
SOD1. In this method, the rate of pyrogallol autooxidation was
determined spectrophotometrically from the increase in absorbance
at 420 nm; 1 unit of SOD1 activity was defined as the amount of the
enzyme required to inhibit the rate of pyrogallol autooxidation by
50%. Results are expressed in U/mg hemoglobin (Hb). For the dosage
of glutathione reductase (GR), a standard Randox kit-based
colorimetric method was used (cat. no. GR2368; Randox Laboratories,
Crumlin, UK). Results are expressed in U/g Hb for GR in RBCs, and
U/l for GR in plasma (30). In
addition, glutathione peroxidase (GPx) activity was measured in
RBCs and plasma, according to a method derived from that of Günzler
et al (31). The GPx assay
was based on the oxidation of reduced nicotinamide dinucleotide
phosphate (NADPH) to NADP+, which is associated with a
decrease in the absorbance at 340 nm. The rate of this decrease is
directly proportional to the GPx activity in the sample. GPx
activity was subsequently evaluated in nM NADPH oxidized/min, and
the results are expressed in U/g Hb for GPx in RBCs and in U/l for
GPx in plasma.
Statistical analysis
A total of two different statistical tests were
used: i) The two-tailed Student's t-test, for comparison between
patient values and normal control reference values; and ii)
Pearson's correlation test for analyzing the statistical
association between the different variables of interest, including
oxidative and antioxidative stress-associated biomarkers. All
statistical analysis was performed using the XLSTAT software
(XLSTAT 2018.1.49725; Addinsoft; https://www.xlstat.com). Considering the fact that the
two-tailed Student's t-test was used to perform three comparisons
(total EHS patients values, EHS patients with values above upper
normal limits and EHS patients with values below the lower normal
limits) with the one dataset of normal control reference values,
the Bonferroni correction was applied, which sets the α cut-off of
significance at 0.05/3, i.e. 0.016. While statistical analysis
using the Pearson's correlation test was done with the cut-off
value of α=0.05.
Results
Demographic data
A total of 32 EMFIS-bearing patients were included
in this prospective study for oxidative and antioxidative stress
biomarker analysis. The mean age was 50.6 years, ranging between 32
and 75 years. There were 22 females and 10 males, for an overall
female/male sex ratio of 69%.
However, since NTT was measured in only 14 of the 32
cases in this series, the results obtained from a concomitant
series of 46 additional EHS self-reporting patients (mean age, 49
years; female/male sex ratio, 71% female), all complying with the
inclusion criteria (see above), were added, thus the results
presented for NTT are based on the analysis of an overall number of
60 EMFIS-bearing patients. The demographic data are presented in
Table III.
| Table IIIDemographic data. |
Table III
Demographic data.
| No. cases | Mean age,
years | Age range,
years | Sex ratio, F/M
(%F) |
|---|
| 32a | 50.6 | 32–75 | 22/10 (69) |
| 46b | 49 | 19–79 | 33/13 (71) |
| 123c | 44 | 18–65 | 61/62 (50) |
Oxidative stress biomarkers
The results are depicted in Fig. 1, and in Tables IV and V. Fig.
1 presents the distribution values of the different oxidative
stress biomarkers analyzed in EMFIS-bearing patients in comparison
with normal-range values obtained from healthy controls. As
indicated in Fig. 1, for a number
of cases, TBARs, MDA, GSSG and NTT peripheral blood level values
were above the upper normal limits, meaning that these cases were
associated with detectable oxidative stress in the peripheral
blood. These data are confirmed in Table IV. Overall, in comparison with
normal-range values, the mean values (± standard deviation) for all
32 patients analyzed were statistically significantly increased for
TBARs (P=0.013), and tended to be increased for MDA and GSSG
(P=0.053 and P=0.051 respectively), although not for NTT (P=0.790).
However, when restricting the analysis to EMFIS-bearing patients
having values above the upper normal limits, relative to the values
obtained in normal healthy controls (this concerns 30–50% of the
patients, depending on the biomarker considered), a statistically
significant difference was evident for TBARs, in addition to MDA,
GSSG and NTT (P<0.0001); that is, for all the oxidative stress
biomarkers analyzed thus far.
| Table IVElectromagnetic field intolerance
syndrome-associated oxidative stress biomarkers measured in the
peripheral blood of EHS self-reporting patients, including mean
values (± SD) for all patients, and mean values (± SD), numbers and
percentages of patients with mean values above the upper normal
limits. |
Table IV
Electromagnetic field intolerance
syndrome-associated oxidative stress biomarkers measured in the
peripheral blood of EHS self-reporting patients, including mean
values (± SD) for all patients, and mean values (± SD), numbers and
percentages of patients with mean values above the upper normal
limits.
| Oxidative stress
biomarkers | Normal values
(range) | Patients with EHS
Mean ± SD | P-valuea | Patients with EHS
with values above upper normal limits
| P-valueb |
|---|
| No. of cases | % of total
cases | Mean ± SD |
|---|
| TBARS | 2.5±0.18
(2.13–2.86) µM | 2.85±0.06 | 0.013 | 15/32 | 48.88 | 3.14±0.17 | <0.0001 |
| MDA | 1.46±0.17
(1.12–1.81) µM | 1.76±0.06 | 0.053 | 14/32 | 43.75 | 2.10±0.19 | <0.0001 |
| GSSG | 12.4±3.4 (5.5–19.3)
µM |
20.74±1.74 | 0.051 | 13/32 | 40.63 |
29.46±9.95 | <0.0001 |
| NTT | 0.75±0.08 (0.6–0.9)
µg/ml | 0.78±0.35 | 0.790 | 20/60 | 33.33 | 1.19±0.21 | <0.0001 |
| Table VElectromagnetic field intolerance
syndrome-associated non-enzymatic protein biomarkers measured in
the peripheral blood of EHS self-reporting patients, including mean
values (± SD) for all patients, and mean values (± SD), numbers and
percentages of patients with mean values above the upper normal
limits. |
Table V
Electromagnetic field intolerance
syndrome-associated non-enzymatic protein biomarkers measured in
the peripheral blood of EHS self-reporting patients, including mean
values (± SD) for all patients, and mean values (± SD), numbers and
percentages of patients with mean values above the upper normal
limits.
| Oxidative stress
biomarkers | Normal values
(range) | Patients with
EHSMean ± SD | P-valuea | Patients with EHS
with values above upper normal limits
| P-valueb |
|---|
| No. of cases | % of total
cases | Mean ± SD |
|---|
| GSH | 965±118 (729–1203)
µM | 794.62±34.74 | 0.012 | 6/32 | 18.75 | 639.47±69.27 | <0.0001 |
| GSH/GSSG ratio | 84.15±29.35
(40.1–155) µM/µM | 46.92±3.68 | <0.0001 | 13/32 | 40.63 | 29.77±4.72 | <0.0001 |
| GluT | 989±120 (749–1228)
µM | 873.47±27.85 | 0.041 | 6/32 | 18.75 |
669.83±9.67 | <0.0001 |
| GSH/GluT ratio | 99±0.19 (94.1–99.9)
% | 95.25±0.33 | 0.0009 | 9/32 | 29.13 | 92.86±1.29 | <0.0001 |
| NTT | 0.75±0.08 (0.6–0.9)
µg/ml | 0.78±0.35 | 0.790 | 20/60 | 33.33 | 0.41±0.14 | <0.0001 |
Non-enzymatic protein-associated
biomarkers
By contrast, as indicated in Fig. 1, considering the overall series of
patients investigated, all values for the total protein thiol group
were within the limits of normal-range values. There were also no
blood level values above the upper normal limits for GSH, the
GSH/GSSG ratio, GluT and the GSH/GluT ratio; however, in a number
of cases, for these GSH-related biomarkers and for NTT, blood level
values were below the normal-range values. These data are detailed
in Table V. When analyzing the
overall series of patients, all investigated biomarkers, with the
exception of GluT and NTT, were observed to be statistically
significantly below the lower normal limit values. However, when
considering the 20–40% of patients with values below the lower
normal limit values, this finding was confirmed for these
biomarkers and also for GluT and NTT (P<0.0001), suggesting that
certain oxidative stress-associated biomolecular processes
resulting in a decrease in GSH, GluT and NTT may have occurred in
these particular cases.
Antioxidative stress enzymes
The previous oxidative stress data were confirmed by
measuring a number of antioxidative stress-associated key enzymes
in RBCs and plasma. The results are depicted in Fig. 2 and Table VI. An important observation
indicated in Fig. 2 was that SOD1
activity measured in RBCs was associated with values above the
upper normal limits in ~60% of the patients, suggesting that this
antioxidative stress-inducible enzyme is primarily involved in the
oxidative stress detoxification process occurring in EMFIS-bearing
patients. Furthermore Table VI
indicates that when considering all included cases, there was
statistically significantly increased activity in RBCs of SOD1,
although not GPx (P=0.002 and P=0.044, respectively), and of GPx in
the plasma. Likewise, in comparison with normal-range values, the
mean values (± standard deviation) obtained in the ~60% of
EMFIS-bearing patients having increased SOD1 activity, were
revealed to be statistically significantly increased (P<0.0001).
However, when restricting the analysis to the patients with GPx and
CG increases, as indicated in Table
VI, a statistically significant difference in comparison with
normal control reference values in RBCs and plasma was identified
in 19 and 10% of the patients respectively, and for GR in RBCs in
~6% (P<0.0001), meaning that EMFIS may be characterized by
increased antioxidative stress-associated enzymatic activity in
RBCs, primarily involving SOD1.
| Table VIElectromagnetic field intolerance
syndrome-associated antioxidative detoxification enzymatic activity
measured in red blood cells and the plasma of EHS self-reporting
patients, including mean values (± SD) for all patients, and mean
values (± SD), number and percentage of patients with mean values
above the upper normal limits. |
Table VI
Electromagnetic field intolerance
syndrome-associated antioxidative detoxification enzymatic activity
measured in red blood cells and the plasma of EHS self-reporting
patients, including mean values (± SD) for all patients, and mean
values (± SD), number and percentage of patients with mean values
above the upper normal limits.
| Anti-oxidative
stress enzymes | Normal values
(range) | Patients with EHS
Mean ± SD | P-valuea | Patients with EHS
with values above upper normal limits
| P-valueb |
|---|
| No. of cases | % of total
cases | Mean ± SD |
|---|
| SOD (RBC) | 1.34±0.06
(1.22–1.46) U/mg Hb | 1.50±0.02 | 0.002 | 19/32 | 59.38 | 1.57±0.08 | <0.0001 |
| GPx (RBC) | 44.1±8.2
(27.8–60.5) U/g Hb |
51.92±1.62 | 0.044 | 6/32 | 18.75 | 66.70±4.76 | <0.0001 |
| GPx (plasma) | 375±37.5 (300–450)
U/l |
379.28±9.30 |
0.83 | 3/32 | 9.38 | 469.67±26.31 | <0.0001 |
| GR (RBC) | 8.9±2.1 (4.7–13.2)
U/g Hb | 9.42±0.34 |
0.56 | 2/32 | 6.25 | 14.15±0.35 | <0.0001 |
| GR (plasma) | 54±9 (33–75)
U/l |
61.69±9.17 |
0.16 | 0 | 0 | – | – |
Overall oxidative stress occurrence in
EMFIS-bearing patients
Table VII
reports the overall results obtained with the three principal
categories of oxidative stress biomarkers used in this study:
TBARs/MDA, GSSG and NTT. Fig. 3
summarizes the results: 42.85% of EHS self-reporting patients had
one positive detectable oxidative stress biomarker, and 21.43 and
14.28% had 2 or 3 positive detectable oxidative stress biomarkers,
respectively, meaning that overall, 80–90% of the cases were
associated with at least one detectable oxidative stress biomarker
in the peripheral blood. However, in order to provide a
comprehensive interpretation of the findings characterizing EMFIS,
the present study included a provisional molecular bioanalysis of
the different results obtained, as presented in Figs. 4Figure 5–6.
 | Figure 5Schematic diagram showing the
detoxification role of GSH, SOD1, GPx, GR and Cat during oxidative
stress. Superoxide radical can be generated through the activation
of specialized enzymes or be generated as by-product of abnormal
cellular metabolism, occurring particularly from the mitochondrial
electron transport chain. Superoxide dismutase then converts
superoxide to hydrogen peroxide which has to be rapidly removed
from the system. This is generally achieved by catalases or
peroxidases, such as the glutathione peroxidases which use reduced
glutathione (GSH) as electron donor. Alternatively Iron(II)
(present in the system) is oxidized by hydrogen peroxide to
iron(III), forming hydroxyl radical and hydroxide ion. GSH, reduced
glutathione; SOD1, Cu-Zn superoxide dismutase; GPx, glutathione
peroxidase; GR, glutathione reductase; Cat, catalase; NADPH,
reduced nicotinamide adenine dinucleotide phosphate. |
| Table VIIPercentage of electrohypersensitivity
self-reporting patients (electromagnetic field intolerance
syndrome-bearing patients) having positive TBARs, GSSG and/or NTT
oxidative stress biomarkers measured in the peripheral blood. |
Table VII
Percentage of electrohypersensitivity
self-reporting patients (electromagnetic field intolerance
syndrome-bearing patients) having positive TBARs, GSSG and/or NTT
oxidative stress biomarkers measured in the peripheral blood.
| No. of positive
biomarkers | Markers | Percentage of
patients (%) |
|---|
| 1 | NTT |
14.28 |
| GSSG | 7.14 |
| TBARs |
21.43 |
| NTT or GSSG or
TBARs |
42.85 |
| 2 | TBARs and GSSG | 7.14 |
| NTT and TBARs | 7.14 |
| NTT and GSSG | 7.14 |
| TBARs and GSSG, or
NTT and TBARs, or NTT and GSSG |
21.42 |
| 3 | NTT and TBARs and
GSSG |
14.28 |
Search for statistical correlations
Using Pearson's statistical correlation test, the
present study sought to identify a correlation between the
different biological parameters so far investigated.
Table VIII
reports the results. It was observed that the plasma level of MDA
(a well-known TBAR) was positively correlated with the TBAR plasma
level, and that the GSSG plasma level was positively correlated
with GSH and GluT plasma levels, and with GSH/GluT and GSH/GSSG
ratios.
| Table VIIIAnalysis of statistically significant
correlations between oxidative stress biomarkers, enzymatic and
non-enzymatic antioxidative stress proteins, using the Pearson's
correlation test. |
Table VIII
Analysis of statistically significant
correlations between oxidative stress biomarkers, enzymatic and
non-enzymatic antioxidative stress proteins, using the Pearson's
correlation test.
| Variables |
P-values
|
|---|
| TBARS | MDA | GSSG | GSH | GSH/GluT | GSH/GSSG | GluT | SOD1 | GPx Plasma | GPx RBC | GR Plasma | GR RBC |
|---|
| TBARS | – | <0.001 | 0.391 | 0.931 | 0.417 | 0.775 | 0.884 | 0.655 | 0.189 | 0.352 | 0.736 | 0.838 |
| MDA | <0.001 | – | 0.373 | 0.923 | 0.551 | 0.736 | 0.540 | 0.811 | 0.157 | 0.581 | 0.432 | 0.542 |
| GSSG | 0.391 | 0.373 | – | 0.023 | <0.001 | <0.001 | 0.043 | 0.105 | 0.249 | 0.603 | 0.145 | 0.388 |
| GSH | 0.931 | 0.923 | 0.023 | – | 0.201 | 0.030 | 0.070 | 0.611 | 0.014 | 0.371 | 0.625 | 0.339 |
| GSH/GluT | 0.417 | 0.551 | <0.001 | 0.201 | – | <0.001 | 0.963 | 0.062 | 0.725 | 0.870 | 0.102 | 0.180 |
| GSH/GSSG | 0.775 | 0.736 | <0.001 | 0.030 | <0.001 | – | 0.112 | 0.030 | 0.775 | 0.543 | 0.322 | 0.294 |
| GluT | 0.884 | 0.540 | 0.043 | 0.070 | 0.963 | 0.112 | – | 0.695 | 0.100 | 0.112 | 0.802 | 0.284 |
| SOD1 | 0.655 | 0.811 | 0.105 | 0.611 | 0.062 | 0.030 | 0.695 | – | 0.309 | 0.321 | 0.162 | 0.791 |
| GPx Plasma | 0.189 | 0.157 | 0.249 | 0.014 | 0.725 | 0.775 | 0.100 | 0.309 | – | 0.183 | 0.673 | 0.770 |
| GPx RBC | 0.352 | 0.581 | 0.603 | 0.371 | 0.870 | 0.543 | 0.112 | 0.321 | 0.183 | – | 0.854 | 0.401 |
| GR Plasma | 0.736 | 0.432 | 0.145 | 0.625 | 0.102 | 0.322 | 0.802 | 0.162 | 0.673 | 0.854 | – | 0.012 |
| GR RBC | 0.838 | 0.542 | 0.388 | 0.339 | 0.180 | 0.294 | 0.284 | 0.791 | 0.770 | 0.401 | 0.012 | – |
Furthermore, it was observed that the GSH/GSSG ratio
was positively correlated with SOD1 activity in RBC, as tended to
be the case for the GSH/GluT ratio (P=0.06). It was additionally
identified that the GSH plasma level was positively correlated with
the GPx activity level in plasma, although not with GPx activity in
RBCs (P=0.371).
Discussion
It is well established that oxidative stress may
cause profound alterations in biomolecules, including lipids,
proteins and nucleic acids, and consequently may alter various
cellular functions and structures (32,33). This explains why oxidative stress
has been implicated in ageing and in a number of age-associated
pathologies, including cancer, Alzheimer's disease, diabetes and
cardiovascular diseases through genetic and/or epigenetic
mechanisms (34). Concerning more
particularly the role of oxidative stress in tumorigenesis, a
general free radical theory was recently proposed linking oxidative
stress to direct genetic toxicity and DNA mutagenesis, and
indirectly to epigenetic alterations through free radical-induced
protein epimutations (35). The
present study reports for the first time, to the best of our
knowledge, that ~80% of so-called EHS self-reporting patients
present with oxidative stress, and thus may be considered to be
bearing a truly objective pathological disorder, as is the case for
cancer, Alzheimer's disease, or other diseases or pathological
conditions. In the present study, the term EMFIS was preferred to
EHS since, according to the clinical criteria used, it was not
possible to clearly assess whether the patients exhibited a
decreased tolerance threshold when exposed to EMFs. Furthermore,
the term EMFIS was used preferentially to IEI-EMF, which has been
proposed by the WHO, as all patients included in the present study
clearly reported EMF-associated clinical symptoms (4).
During oxidative stress, among the reactive oxygen
species (ROS) are the superoxide anion
(O2°−), hydrogen peroxide
(H2O2), the hydroxyl radical (OH°) and the
hydroperoxyl radical (O2H°). Further, in redox cycling,
transition metals including Fe, Cu, Ni and Co serve an important
role in ROS formation (36).
Fe is the most commonly involved transition metal,
and there are three classical reaction types. In the first step,
namely the Haber-Weiss reaction, the superoxide anion reduces
ferric ion into ferrous ion: Fe3+ +
O2°− → Fe2+ + O2 [A];
while in a second step, namely the Fenton reaction, ferrous ion
reacts with hydrogen peroxide to generate hydroxyl radicals and
hydroxide ions: Fe2+ + H2O2 →
Fe3+ + OH° + OH− [B].
Finally, in a third reaction, ferric ion is reduced
to ferrous ion by reacting with a second hydrogen peroxide
molecule, to recycle ferrous ion and form a hydroperoxyl radical
and a proton: Fe3+ + H2O2 →
Fe2+ + O2H° + H+ [C].
The net effect of [B] and [C] is the generation of
the two ROS, OH° and O2H°, with H2O as a
byproduct.
ROS are, however, difficult to measure directly due
to their very short half-life. This explains why measurement of the
products resulting from the molecular damage induced by ROS is the
usual way to assess and measure oxidative stress. To that end,
different oxidative stress and antioxidative response biomarkers
were selected in the present study, representative of the different
biochemical pathways and biological structural alterations that may
occur when the organism is subjected to environmental stressors
(37).
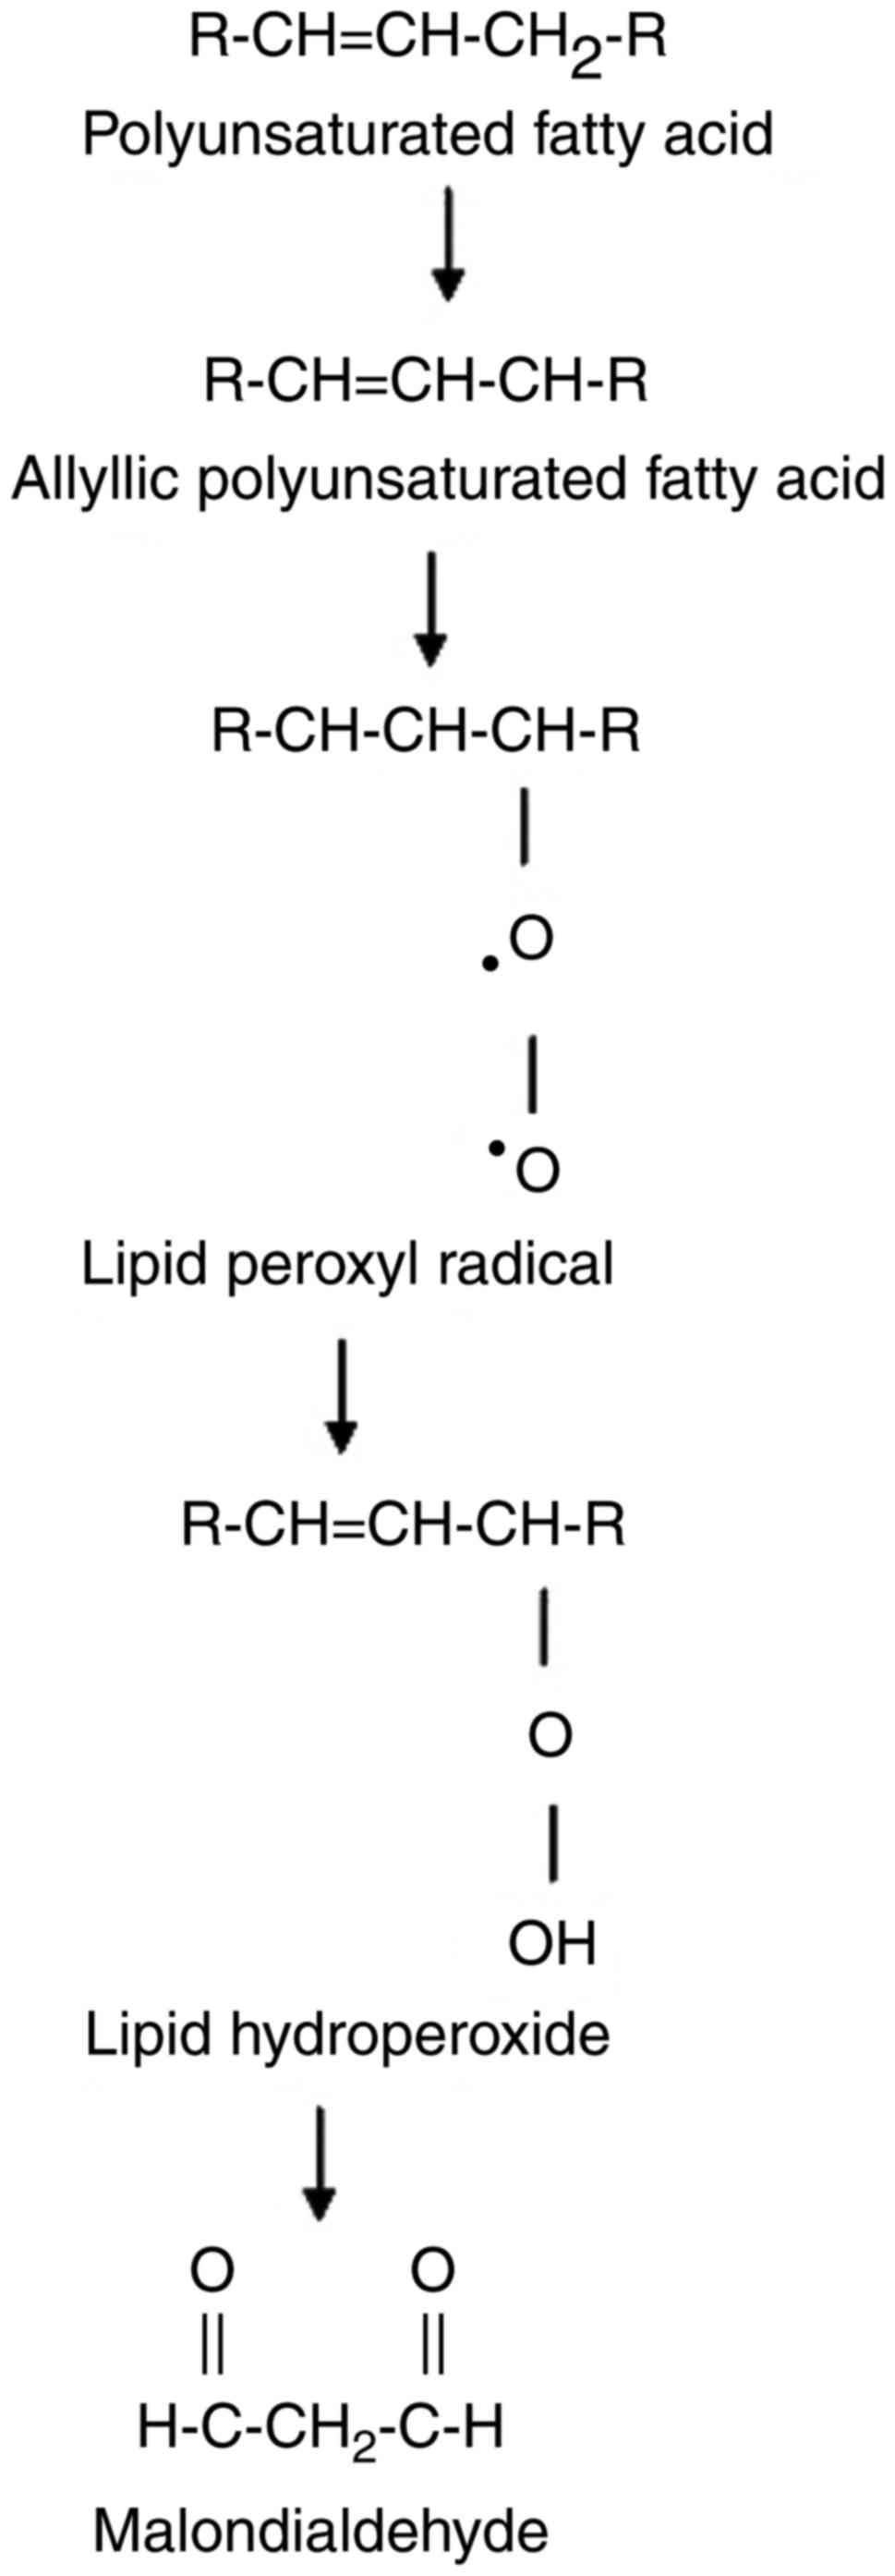
TBARs, which reflect the overall damage induced by
non-enzymatic ROS-associated lipid peroxidation, among which MDA is
the most prevalent byproduct (38), are commonly used biomarkers of
lipoxidative stress (21). The
reactive aldehyde MDA is a major indicator of the tissue damage
resulting from the peroxidation of polyunsaturated fatty acids
(PUFAs) induced by the two most prevalent ROS involved in
lipoxidative stress: OH° and O2H° (39).
In fact, lipid peroxidation leads to the formation
of numerous aldehydes, among which certain of them are highly
reactive and may be considered as secondary messengers, which
disseminate and amplify the initial oxidative stress. This is
particularly the case for MDA, which is a bi-functional
electrophile that is able to react strongly with nucleophiles,
including amino acid residues in proteins (39). MDA adducts are thus biologically
highly toxic, since they induce profound alterations in the
structure and function of biomolecules by creating intramolecular
or intermolecular protein/DNA cross-links (40,41).
This may explain why the majority of assays that
have been developed to measure MDA on the basis of its
derivatization with TBA have been challenged for their relative
lack of specificity (42). This
is due to the fact that TBA (in addition to MDA) is able to react
spontaneously with numerous other molecules present in the test
tube; by using a high temperature (90–100°C) to obtain the TBA/MDA
spectrophotometrically-measurable condensation product, the process
is able to generate in vitro further oxidation (43). In the present study, the method
developed by Londero and Lo Greco (24) was used, which is considered to
minimize the biases due to the procedure itself, and thus may
increase specificity. Moreover, TBARs and MDA were measured
simultaneously in the same sample and the values obtained for these
two biomarkers were compared with the normal-range values obtained
in healthy controls. Using this procedure, it was demonstrated that
40–50% of the patients had statistically significantly increased
TBAR and MDA mean plasmatic values relative to normal values, a
finding which strongly suggests that these patients present with an
increased lipid peroxidation state detectable in their peripheral
blood. In addition, these data were confirmed in the overall sample
of 32 patients studied for TBARs, and tended to be significant for
MDA.
Indeed these data may not be restricted to the
peripheral blood, since cellular and nuclear membranes are
primarily composed of fatty acids, including PUFAs. In the past 20
years MDA has been recognized as a reliable lipid peroxidation
marker in a number of diseases, including cancer (44–47), type 2 diabetes (48), cardiovascular diseases (49,50) and Alzheimer's disease (51). On the basis of the present data,
this is also the case for EMFIS, and this result is unsurprising
since oxidative stress, including lipid peroxidation, has also been
evidenced in similar recognized pathological conditions, including
chronic fatigue syndrome (CFS) (52–56) and MCS (57).
However, as previously outlined, oxidative stress is
an extremely complex redox cycling process resulting in various
oxidizing/nitrosating free radical and molecular species attacks
that exceed natural defense mechanisms; thus, it may not be
measured by only one biomarker. In addition to TBARs and MDA, the
present study measured GSH and, more specifically, GSSG and NTT as
oxidative stress biomarkers. Glutathione is the primary compound
that determines the redox state of a cell. It is a prototype
antioxidant involved in cellular protection from the noxious
effects of oxidative stress, directly and as cofactor of GPx. This
thiol-containing tripeptide exists in an oxidized (GSSG) and
reduced (GSH) form, and thus is a nucleophile and a reducing agent
that is able to react with electrophilic and oxidizing species,
allowing cells to escape the interaction of ROS with critical
molecular targets, including proteins or nucleic acids (58). The ratio of GSH to the GSSG is a
well-known marker of the redox state of a cell (59). Consequently GSH and GSSG were
measured and their ratio (GSH/GSSG) and sum (GluT) were determined
for the analysis of oxidative stress and the antioxidative stress
response.
During oxidative stress, GSSG results from the
oxidation of two GSH molecules by one hydrogen peroxide molecule,
according to the following formula: 2GSH +
H2O2 GSSG + 2H2O [D]; while the
two GSH molecules are usually recycled from the reduction of GSSG,
according to a reaction involving the coenzyme NADPH: GSSG + NADPH
2GSH + NADP+ [E].
It is notable that the oxidation of GSH according to
[D] is catalyzed by GPx, while the reduction of GSSG according to
[E] is catalyzed by GR; thus, according to [D] and [E], the
activity of these two key enzymes in RBCs and plasma was
measured.
In the present study, it was demonstrated that in
comparison with normal-range values, the GSSG plasmatic mean value
was statistically significantly increased in 40% of the patients,
meaning that these patients presented with an oxidative redox state
detectable in their peripheral blood. However, these data were not
confirmed for the overall 32-patient sample for which the mean GSSG
plasmatic mean value was not statistically significantly
increased.
According to [D], it is assumed that increased GSSG
may result in GSH depletion and consequently contribute to a
decrease in antioxidant defenses. This may explain the result that
in the overall patient sample studied, mean plasmatic values of
GSH, the GSH/GSSG ratio and the GSH/GluT ratio were all
statistically significantly decreased in comparison with normal
control values; and that 20–40% of the patients with values of
these biomarkers below the lower normal limits presented with
statistically significantly decreased mean values in comparison
with normal values, a finding which also confirmed that EHS
self-reporting patients present with oxidative stress. Similar data
were obtained in RBCs for GSH, although not for the GSSG/GluT
ratio, in the De Luca et al (57) study, suggesting that the plasmatic
measurement of GSSG, the GSH/GSSG ratio or the GSH/GluT ratio may
be more informative compared with the measurement of the GSSG/GluT
ratio in RBCs for the assessment of oxidative stress in EHS
self-reporting patients.
Since the GSSG increase may be caused by an increase
in GPx activity and/or by a decrease in GR activity, as indicated
above, the present study measured the activity of these two key
enzymes in RBCs and plasma. The overall mean GPx activity in the
all 32 cases studied was not statistically significantly increased
in RBCs and in plasma; with the exception of two cases, mean GR
activity in RBCs and plasma was normal in all sample cases studied.
However when considering the 18.75 and 9.28% of patients with
increased GPx activity in RBCs and in plasma, respectively, a
statistically significant difference was identified. Accordingly,
it was suggested that the GSSG mean level increase in the
peripheral blood may be associated with the increased GPx activity
in ~19% of the patients, and/or by lower or normal GR activity;
according to [E], the activity of this latter inducible enzyme is
insufficient to recycle GSH from GSSG.
In the redox process GPx is an important enzyme as,
by acting as a peroxynitrite reductase, it is able to efficiently
reduce peroxynitrite/peroxynitrous acid (ONOO−/ONOOH)
into nitrite (NO), thereby protecting cells against oxidative and
nitrative reactions (60). The
present data was not completely concordant with that obtained in
the De Luca et al (57)
study, which exhibited an overall statistically significant
increase in GPx activity in RBCs in comparison with normal values.
In addition, since GR activity was not measured in this latter
study, it is not possible to confirm the accuracy of the present
data demonstrating a normal level of GR activity in RBCs and
plasma. In the present study, the evidence of oxidative stress in
EHS self-reporting patients was, however, considerably reinforced
by the evidence that, relative to normal values, the SOD1 mean
value in RBCs was observed to be statistically significantly
increased when considering the overall patient sample and the near
60% of the patients with mean values above the upper normal
limit.
Such results were confirmed in patients with MCS in
the De Luca et al (57)
study, although not in patients with EHS; however, in these
patients there was a strong tendency towards an increase in the
SOD1 mean value in RBCs. The reason for such differences in
comparison with the present data are not clear, and may be due to
different inclusion criteria, since these criteria were not clearly
detailed in the De Luca et al study, and/or to the use of a
different dosage techniques.
SOD1 catalyzes the detoxification of the superoxide
anion by dismuting this anion into hydrogen peroxide and molecular
oxygen. O2°− + O2°− +
2H+ → H2O2 + O2
[F].
A further consideration to be made concerning the
increased SOD1 activity in EMFIS-bearing patients is that according
to [B] and [C], excessive production of H2O2
may provide excessive OH° and O2H° free radical and
OH− ion production, and thus may amplify oxidative
stress-induced detrimental health effects. Such a hypothesis is
plausible since, in the present study, GPx activity was observed to
be increased in only 10–18% of cases, thereby limiting its
H2O2 detoxifying capacity. Another
possibility for detoxifying H2O2 is catalase.
However, catalase activity was not measured in the present study,
although it was reported that in comparison with normal controls
catalase activity tends to be decreased in EHS self-reporting
patients (57), meaning that the
H2O2 detoxifying capacity of catalase may be
not sufficient in these patients.
It is possible, according to [D] and [F] by
providing H2O2 in excess, that SOD1 may also
indirectly contribute to the increased formation of GSSG, since as
reported above it was demonstrated that GPx activity was normal or
even increased in EHS self-reporting patients. In fact, whatever
the resulting effects of the SOD1 increase in EHS self-reporting
patients, it is notable that a similar increased level of SOD1
activity was reported in patients with Alzheimer's disease, with
this increased level having been considered for the early diagnosis
and therapeutic monitoring of this disease (61). This may also be the case for
EMFIS-bearing patients.
During the oxidative process, peroxynitrite
(ONOO−) may also be generated from the reaction of the
superoxide anion with nitric oxide in the framework of an
oxidative/nitrosative stress process, according to the following
formula: O2−° + NO → ONOO−
[G].
In this in vivo reaction, the radical
coupling of NO with O2−° to form the non-free
radical anion ONOO− is fast enough to outcompete the
protective endogenous effect of SOD1. Although NO is regarded as a
physiological cellular regulating agent, due to its rapid
intra-tissue diffusion, it is also considered to be a crucial
mediator of cellular damage occurring in different
inflammation-associated pathological conditions, more particularly
in neurodegenerative diseases, including Alzheimer's disease
(62). Since NO is produced in
large quantities in the brain, it is thought that it may serve a
major contributing role in amplifying the peroxynitrite-induced
toxicity in the central nervous system, thereby accounting for the
fact that Alzheimer's disease is associated with
peroxynitrite-associated oxidative stress. In fact, contrary to
what was believed in the past, that the majority of oxidative
stress-associated toxic effects may be attributed to NO, it is
known that in vitro NO may inhibit lipid peroxidation
(63); and it is now clearly
established that due to the almost instantaneous formation of
peroxynitrite each time NO and superoxide collide, peroxynitrite is
the true toxic tissue damaging agent; peroxynitrite is a powerful
oxidant that has been proven to cause pathogenic damage by
interacting at a relatively slow rate and diffusion-limiting
capacity with intracellular lipids, proteins and DNA (62).
A good example of such a selective reaction is the
nitration of tyrosine residues in proteins and the formation of
NTT, which thereby serves as a marker of peroxynitrite formation
(64) and is a marker of
oxidative/nitrosative stress (65).
The present study therefore included NTT in the
battery of oxidative stress biomarkers used. Considering the
overall sample of 60 EHS self-reporting patients investigated, wit
was possible to define three categories of patients according to
their NTT values: One-third of the patients exhibited values within
the normal-range values, and another one-third exhibited values
above the upper normal limits, while a further one-third of the
patients presented with values below the lower normal limits.
Notably, these findings were corroborated by the fact that in the
latter two last categories, patients with abnormal mean values,
these values were statistically significantly increased or
decreased relative to normal values.
These data strongly suggested that one-third of the
patients studied, those with statistically significantly increased
NTT mean values, presented with detectable oxidative/nitrosative
stress in the peripheral blood; overall, these data called into
question why two-thirds of the patients presented with normal or
statistically significantly decreased NTT values. The increase in
NTT values in one-third of the patients may be easily explained by
the increased peroxynitrite formation, and also by the fact that a
decrease in GSH, usually an efficient scavenger of peroxynitrite
(60), may result in a decrease
in peroxynitrite detoxification. Furthermore, since SOD1 may also
catalyze peroxynitrite-mediated tyrosine nitration (24), it may be hypothesized that the
increased SOD1 activity that was identified in a number of patients
may also contribute to the increased NTT detection in these
patients.
Explaining the normal or decreased NTT values in
two-thirds of the patients, however, is more problematic. A
plausible hypothesis may be that according to [F], the increased
SOD1 activity may strongly detoxify the organism of superoxide
anions, thus decreasing the formation of peroxynitrite to such a
level that the NTT may have been normalized or even decreased. If
such hypothesis were to be validated, it may further confirm the
existence of oxidative stress in these patients, since this
detoxification process would involve increased SOD1 activity. A
second hypothesis may be associated with the scavenging of
peroxynitrite by GSH since, as reported above, peroxynitrite is
able to directly oxidize low molecular weight thiols, including
GSH; this hypothesis is in agreement with the decrease in GSH
bioavailability that was observed in the patients. Finally, a third
hypothesis may involve the inactivating effects of peroxynitrite on
certain enzymes, by inducing the nitration of tyrosine and the
oxidation of cysteine. In agreement with the present data, this may
be the case for GR in a majority of patients, and for GPx and SOD1
in a number of them, and it may be the case for catalase, according
to the data obtained by De Luca et al (57). Tyrosine nitration may indeed
affect the structure and function of selective proteins (66), and consequently must be considered
to be a central process of peroxynitrite-mediated toxicity. It is
notable that tyrosine nitration and, more particularly, GSH
depletion, in association with increased peroxynitrite toxicity,
has been proposed to contribute to the occurrence and progression
of a number of inflammation-associated diseases, particularly the
neuro-degenerative diseases Parkinson's disease (67), Alzheimer's disease (68) and amyotrophic lateral sclerosis
(69). A key molecular mechanism
that may account for the occurrence of these pathological disorders
may involve the activation of the proinflammatory transcription
factor nuclear factor (NF)-κB by hydrogen peroxide (70) and/or peroxynitrite, possibly
through the classical inhibitor of NF-κB kinase-dependent cell-type
specific pathway (71). Further
research in this field of molecular biology is required in order to
elucidate the molecular causal role of oxidative stress in the
onset of inflammation and, more particularly,
inflammation-associated disease.
Whatever the precise molecular mechanism to be
considered, the present data strongly suggest that EHS
self-reporting patients, more precisely EMFIS-bearing patients,
present with oxidative/nitrosative stress. This has been evidenced
by measuring TBARs, MDA, GSSG/GSH and NTT in the plasma, and the
inducible enzymes SOD1 in RBCs and GPx in RBCs and plasma. The
search for a correlation between these different parameters
confirmed the coherence of the present molecular dissection
analysis.
A major finding of the present study was that by
using a limited number of oxidative stress biomarkers, 70–80% of
EHS self-reporting patients were able to be characterized by the
existence of oxidative stress. Consequently, as is the case for
numerous chronic pathological disorders, including cancer (44–47), diabetes (48), cardiovascular diseases (49,50), neurodegenerative diseases
(51), and similar pathological
syndromes including CFS (51–55) and MCS (57), the present data strongly suggested
that EMFIS may be characterized by some degree of chronic
inflammation (3,4) in addition to oxidative stress. This
means that EMFIS (as for MCS and CFS) is a novel pathological
disorder which merits recognition by the international biomedical
community and classification as such by the WHO.
There remains no clear explanation as to the causal
origin of oxidative stress in EHS self-reporting patients. The
hypothesis that a nocebo effect may have been initially causal in
the onset of oxidative stress is unlikely, since this is unable to
explain the molecular abnormalities that were evident in the
present study (4). The hypothesis
that certain environmental stressors may be causally implicated in
the onset of this pathology requires further investigation. Since
it was previously demonstrated that MCS is frequently associated
with EHS in EHS self-reporting patients (3), man-made chemicals may theoretically
be these environmental stressors. However, in the present study,
all patients with MCS that may have been associated with EHS were
excluded, thus EMF exposure, as reported by the patients, may be an
environmental stressor. This hypothesis merits consideration since
numerous in vitro and animal experimental studies have
reported that extremely low frequencies (ELF) radiation exposure
(72,73), and more importantly
radio-frequencies (RF) EMF exposure (74–79), are associated with oxidative
stress occurrence, with the resulting biological effects including
alterations in differentiation (72,73), inflammatory responses and DNA
damage (77,80); all these detrimental effects occur
more frequently in the brain (74,76–79).
Finally, it may be concluded that regardless of its
causal origin, EMFIS may be biologically characterized as a novel
pathological disorder, and thus may be diagnosed in medical
practice on the basis of clinical symptoms, and more objectively by
measuring: Inflammation-associated biomarkers, including histamine,
protein S100B and the cellular stress chaperone proteins Hsp70 and
Hsp27 (3); oxidative stress
biomarkers, including TBARs, MDA, GSS and NTT in plasma; and
anti-oxidative defense biomarkers, including SOD in RBCs, and GSH
and GPx in plasma.
Acknowledgments
The authors acknowledge Ms. Marie Anne Barros from
the Association for Research on Treatment Against Cancer (ARTAC;
Paris, France) for clinical assistance, and Dr Natalio Awaida from
Labo XV-Paris (Paris, France) for blood collection. The authors
also thank Mr. Tony Tweedale from Rebutting Industry Science with
Knowledge (RISK) Consultancy for his careful review of the
manuscript.
Abbreviations:
|
CFS
|
chronic fatigue syndrome
|
|
EHS
|
electro-hypersensitivity
|
|
EMFIS
|
electromagnetic fields intolerance
syndrome
|
|
GluT
|
total glutathione
|
|
GPx
|
glutathione peroxidase
|
|
GSH
|
reduced glutathione
|
|
GR
|
glutathione reductase
|
|
GSSG
|
oxidized glutathione
|
|
MCS
|
multiple chemical sensitivity
|
|
MDA
|
malondialdehyde
|
|
NTT
|
nitrotyrosine
|
|
RBC
|
red blood cells
|
|
SOD1
|
Cu-Zn superoxide dismutase
|
|
TBARs
|
thiobarbituric acid-reactive
substances
|
Funding
The present study was supported by a specific grant
(grant no. F13080012) provided by the Osato Research Institute
(Gifu, Japan) and by ARTAC, a non-profit private research center
(Paris, France; www.artac.info).
Availability of data and materials
The datasets used and analyzed during the current
study are available from the corresponding author on reasonable
request.
Authors' contributions
PI and DB designed the study and developed data
collection tools. DB, as principal investigator, led the overall
study with respect to data collection, data management, data
analysis and interpretation. PI and DC directly provided technical
input and guidance for participant selection, data collection, and
data analysis and interpretation. DB wrote the manuscript, and PI
and DB directly provided critical input to frame and finalize the
manuscript. All authors read and approved the final manuscript.
Ethics approval and consent to
participate
The present study, part of a therapeutic clinical
trial using Fermented Papaya Preparation to treat EHS
self-reporting patients (4), was
agreed by the European Cancer and Environmental Research Institute
(ECERI) scientific/ethical advisory committee, and was conducted
according to currently accepted ethical guidelines, including
informed written consent approval signed by all patients prior to
inclusion. This investigation has been also registered in the
European Clinical Trials Database ('EudraCT') under the
registration no. 2017-003937-27.
Patient consent for publication
Not applicable.
Competing interests
The authors declare that they have no competing
interests.
References
|
1
|
WHO (World Health Organization): WHO Fact
Sheet No. 296. Electromagnetic Fields and Public Health,
Electromagnetic Hypersensitivity Electromagnetic Fields and Public
Health, Electromagnetic Hypersensitivity. Available from:
http://www.who.int/peh-emf/publications/facts/fs296/en/.
2005
|
|
2
|
Hansson Mild K, Repacholi M, van Deventer
E and Ravazzani P: Working Group Report. Proceedings International
Workshop on EMF hypersensitivity; 25-27 October 2004; Prague, Czech
Republic. WHO Press; Milan: pp. 15–26. 2006
|
|
3
|
Belpomme D, Campagnac C and Irigaray P:
Reliable disease biomarkers characterizing and identifying
electrohypersensi-tivity and multiple chemical sensitivity as two
etiopathogenic aspects of a unique pathological disorder. Rev
Environ Health. 30:251–271. 2015. View Article : Google Scholar
|
|
4
|
Irigaray P, Garrel C, Houssay C, Mantello
P and Belpomme D: Beneficial effects of a Fermented Papaya
Preparation for the treatment of electrohypersensitivity
self-reporting patients: Results of a phase I-II clinical trial
with special reference to cerebral pulsation measurement and
oxidative stress analysis. Funct Foods Health Dis. 8:122–144.
2018.
|
|
5
|
Belpomme D, Hardell L, Belyaev I, Burgio E
and Carpenter D: Thermal and non-thermal health effects of
non-ionizing radiation: An international consensus perspective.
Envpol. In press.
|
|
6
|
Bergqvist U and Vogel E: Possible health
implications of subjective symptoms and electromagnetic fields. A
report prepared by a European group of experts for the European
Commission, DGV. Arbete och Hälsa, European Commission DG V,
National Institute for Working Life; 1997, https://gupea.ub.gu.se//bitstream/2077/4156/1/ah1997_19.pdf.
|
|
7
|
Santini R, Seigne M, Bonhomme-Faivre L,
Bouffet S, Defrasme E and Sage M: Symptoms experienced by users of
digital cellular phones: A study of a French engineering school.
Electromagn Biol Med. 21:81–88. 2002. View Article : Google Scholar
|
|
8
|
Röösli M: Radiofrequency electromagnetic
field exposure and non-specific symptoms of ill health: A
systematic review. Environ Res. 107:277–287. 2008. View Article : Google Scholar : PubMed/NCBI
|
|
9
|
Baliatsas C, Van Kamp I, Bolte J, Schipper
M, Yzermans J and Lebret E: Non-specific physical symptoms and
electromagnetic field exposure in the general population: Can we
get more specific? A systematic review. Environ Int. 41:15–28.
2012. View Article : Google Scholar : PubMed/NCBI
|
|
10
|
Hagström M, Auranen J and Ekman R:
Electromagnetic hypersensitive Finns: Symptoms, perceived sources
and treatments, a questionnaire study. Pathophysiology. 20:117–122.
2013. View Article : Google Scholar : PubMed/NCBI
|
|
11
|
Irigaray P, Lebar P and Belpomme D: How
ultrasonic cerebral tomosphygmography can contribute to the
diagnosis of electro-hypersensitivity. JUM. In press.
|
|
12
|
Greaves MW and Sabroe RA: Histamine: The
quintessential mediator. J Dermatol. 23:735–740. 1996. View Article : Google Scholar : PubMed/NCBI
|
|
13
|
Kapural M, Krizanac-Bengez LJ, Barnett G,
Perl J, Masaryk T, Apollo D, Rasmussen P, Mayberg MR and Janigro D:
Serum S-100beta as a possible marker of blood-brain barrier
disruption. Brain Res. 940:102–104. 2002. View Article : Google Scholar : PubMed/NCBI
|
|
14
|
Kanner AA, Marchi N, Fazio V, Mayberg MR,
Koltz MT, Siomin V, Stevens GH, Masaryk T, Aumayr B, Vogelbaum MA,
et al: Serum S100beta: A noninvasive marker of blood-brain barrier
function and brain lesions. Cancer. 97:2806–2813. 2003. View Article : Google Scholar : PubMed/NCBI
|
|
15
|
Morimoto RI: Cells in stress:
Transcriptional activation of heat shock genes. Science.
259:1409–1410. 1993. View Article : Google Scholar : PubMed/NCBI
|
|
16
|
Santoro MG: Heat shock factors and the
control of the stress response. Biochem Pharmacol. 59:55–63. 2000.
View Article : Google Scholar
|
|
17
|
Lebel B, Arnoux B, Chanez P, Bougeard YH,
Daures JP, Bousquet J and Campbell AM: Ex vivo pharmacologic
modulation of basophil histamine release in asthmatic patients.
Allergy. 51:394–400. 1996. View Article : Google Scholar : PubMed/NCBI
|
|
18
|
Smit LH, Korse CM and Bonfrer JM:
Comparison of four different assays for determination of serum
S-100B. Int J Biol Markers. 20:34–42. 2005. View Article : Google Scholar : PubMed/NCBI
|
|
19
|
De AK and Roach SE: Detection of the
soluble heat shock protein 27 (hsp27) in human serum by an ELISA. J
Immunoassay Immunochem. 25:159–170. 2004. View Article : Google Scholar : PubMed/NCBI
|
|
20
|
Pockley AG, Shepherd J and Corton JM:
Detection of heat shock protein 70 (Hsp70) and anti-Hsp70
antibodies in the serum of normal individuals. Immunol Invest.
27:367–377. 1998. View Article : Google Scholar : PubMed/NCBI
|
|
21
|
Pryor WA: On the detection of lipid
hydroperoxides in biological samples. Free Radic Biol Med.
7:177–178. 1989. View Article : Google Scholar : PubMed/NCBI
|
|
22
|
Sies H: Glutathione and its role in
cellular functions. Free Radic Biol Med. 27:916–921. 1999.
View Article : Google Scholar : PubMed/NCBI
|
|
23
|
Radi R: Nitric oxide, oxidants, and
protein tyrosine nitration. Proc Natl Acad Sci USA. 101:4003–4008.
2004. View Article : Google Scholar : PubMed/NCBI
|
|
24
|
Londero D and Lo Greco P: Automated
high-performance liquid chromatographic separation with
spectrofluorometric detection of a malondialdehyde-thiobarbituric
acid adduct in plasma. J Chromatogr A. 729:207–210. 1996.
View Article : Google Scholar : PubMed/NCBI
|
|
25
|
Ohkawa H, Ohishi N and Yagi K: Assay for
lipid peroxides in animal tissues by thiobarbituric acid reaction.
Anal Biochem. 95:351–358. 1979. View Article : Google Scholar : PubMed/NCBI
|
|
26
|
Akerboom TP and Sies H: Assay of
glutathione, glutathione disulfide, and glutathione mixed
disulfides in biological samples. Methods Enzymol. 77:373–382.
1981. View Article : Google Scholar : PubMed/NCBI
|
|
27
|
Ischiropoulos H, Zhu L, Chen J, Tsai M,
Martin JC, Smith CD and Beckman JS: Peroxynitrite-mediated tyrosine
nitration catalyzed by superoxide dismutase. Arch Biochem Biophys.
298:431–437. 1992. View Article : Google Scholar : PubMed/NCBI
|
|
28
|
Jocelyn PC: Spectrophotometric assay of
thiols. Methods Enzymol. 143:44–67. 1987. View Article : Google Scholar : PubMed/NCBI
|
|
29
|
Marklund S and Marklund G: Involvement of
the superoxide anion radical in the autoxidation of pyrogallol and
a convenient assay for superoxide dismutase. Eur J Biochem.
47:469–474. 1974. View Article : Google Scholar : PubMed/NCBI
|
|
30
|
Mannervik B: Measurement of glutathione
reductase activity. Curr Protoc Toxicol. May;2001.PubMed/NCBI
|
|
31
|
Günzler WA, Kremers H and Flohé L: An
improved coupled test procedure for glutathione peroxidase (EC
1-11-1-9-) in blood. Z Klin Chem Klin Biochem. 12:444–448.
1974.PubMed/NCBI
|
|
32
|
Avery SV: Molecular targets of oxidative
stress. Biochem J. 434:201–210. 2011. View Article : Google Scholar : PubMed/NCBI
|
|
33
|
Holmström KM and Finkel T: Cellular
mechanisms and physiological consequences of redox-dependent
signalling. Nat Rev Mol Cell Biol. 15:411–421. 2014. View Article : Google Scholar : PubMed/NCBI
|
|
34
|
Cencioni C, Spallotta F, Martelli F,
Valente S, Mai A, Zeiher AM and Gaetano C: Oxidative stress and
epigenetic regulation in ageing and age-related diseases. Int J Mol
Sci. 14:17643–17663. 2013. View Article : Google Scholar : PubMed/NCBI
|
|
35
|
Belpomme D: Epigenetics and environmental
carcinogenesis: Towards a general free radical theory of cancer.
In: World Cancer Congress. Session 202: Cancer Epigenetics and DNA
Methylation; Abstract no. 1. Barcelona, Spain. pp. 732017
|
|
36
|
Beckman JS: Oxidative damage and tyrosine
nitration from peroxynitrite. Chem Res Toxicol. 9:836–844. 1996.
View Article : Google Scholar : PubMed/NCBI
|
|
37
|
Ray PD, Huang BW and Tsuji Y: Reactive
oxygen species (ROS) homeostasis and redox regulation in cellular
signaling. Cell Signal. 24:981–990. 2012. View Article : Google Scholar : PubMed/NCBI
|
|
38
|
Nielsen F, Mikkelsen BB, Nielsen JB,
Andersen HR and Grandjean P: Plasma malondialdehyde as biomarker
for oxida-tive stress: Reference interval and effects of life-style
factors. Clin Chem. 43:1209–1214. 1997.PubMed/NCBI
|
|
39
|
Ayala A, Muñoz MF and Argüelles S: Lipid
peroxidation: Production, metabolism, and signaling mechanisms of
malondi-aldehyde and 4-hydroxy-2-nonenal. Oxid Med Cell Longev.
2014:3604382014. View Article : Google Scholar
|
|
40
|
Negre-Salvayre A, Coatrieux C, Ingueneau C
and Salvayre R: Advanced lipid peroxidation end products in
oxidative damage to proteins. Potential role in diseases and
therapeutic prospects for the inhibitors. Br J Pharmacol. 153:6–20.
2008. View Article : Google Scholar
|
|
41
|
Pizzimenti S, Ciamporcero E, Daga M,
Pettazzoni P, Arcaro A, Cetrangolo G, Minelli R, Dianzani C, Lepore
A, Gentile F and Barrera G: Interaction of aldehydes derived from
lipid peroxidation and membrane proteins. Front Physiol. 4:2422013.
View Article : Google Scholar : PubMed/NCBI
|
|
42
|
Del Rio D, Stewart AJ and Pellegrini N: A
review of recent studies on malondialdehyde as toxic molecule and
biological marker of oxidative stress. Nutr Metab Cardiovasc Dis.
15:316–328. 2005. View Article : Google Scholar : PubMed/NCBI
|
|
43
|
Slatter DA, Avery NC and Bailey AJ:
Identification of a new cross-link and unique histidine adduct from
bovine serum albumin incubated with malondialdehyde. J Biol Chem.
279:61–69. 2004. View Article : Google Scholar
|
|
44
|
Gönenç A, Ozkan Y, Torun M and Simşek B:
Plasma malondi-aldehyde (MDA) levels in breast and lung cancer
patients. J Clin Pharm Ther. 26:141–144. 2001. View Article : Google Scholar
|
|
45
|
Akbulut H, Akbulut KG, Icli F and
Büyükcelik A: Daily variations of plasma malondialdehyde levels in
patients with early breast cancer. Cancer Detect Prev. 27:122–126.
2003. View Article : Google Scholar : PubMed/NCBI
|
|
46
|
Manju V, Kalaivani Sailaja J and Nalini N:
Circulating lipid peroxidation and antioxidant status in cervical
cancer patients: A case-control study. Clin Biochem. 35:621–625.
2002. View Article : Google Scholar : PubMed/NCBI
|
|
47
|
Bakan E, Taysi S, Polat MF, Dalga S,
Umudum Z, Bakan N and Gumus M: Nitric oxide levels and lipid
peroxidation in plasma of patients with gastric cancer. Jpn J Clin
Oncol. 32:162–166. 2002. View Article : Google Scholar : PubMed/NCBI
|
|
48
|
Dierckx N, Horvath G, van Gils C,
Vertommen J, van de Vliet J, De Leeuw I and Manuel-y-Keenoy B:
Oxidative stress status in patients with diabetes mellitus:
Relationship to diet. Eur J Clin Nutr. 57:999–1008. 2003.
View Article : Google Scholar : PubMed/NCBI
|
|
49
|
Polidori MC, Savino K, Alunni G, Freddio
M, Senin U, Sies H, Stahl W and Mecocci P: Plasma lipophilic
antioxidants and malo-ndialdehyde in congestive heart failure
patients: Relationship to disease severity. Free Radic Biol Med.
32:148–152. 2002. View Article : Google Scholar : PubMed/NCBI
|
|
50
|
Tamer L, Sucu N, Polat G, Ercan B,
Aytacoglu B, Yücebilgiç G, Unlü A, Dikmengil M and Atik U:
Decreased serum total antioxidant status and erythrocyte-reduced
glutathione levels are associated with increased serum
malondialdehyde in atherosclerotic patients. Arch Med Res.
33:257–260. 2002. View Article : Google Scholar : PubMed/NCBI
|
|
51
|
Delibas N, Ozcankaya R and Altuntas I:
Clinical importance of erythrocyte malondialdehyde levels as a
marker for cognitive deterioration in patients with dementia of
Alzheimer type: A repeated study in 5-year interval. Clin Biochem.
35:137–141. 2002. View Article : Google Scholar : PubMed/NCBI
|
|
52
|
Logan AC and Wong C: Chronic fatigue
syndrome: Oxidative stress and dietary modifications. Altern Med
Rev. 6:450–459. 2001.PubMed/NCBI
|
|
53
|
Manuel y Keenoy B, Moorkens G, Vertommen J
and De Leeuw I: Antioxidant status and lipoprotein peroxidation in
chronic fatigue syndrome. Life Sci. 68:2037–2049. 2001. View Article : Google Scholar : PubMed/NCBI
|
|
54
|
Vecchiet J, Cipollone F, Falasca K,
Mezzetti A, Pizzigallo E, Bucciarelli T, De Laurentis S, Affaitati
G, De Cesare D and Giamberardino MA: Relationship between
musculoskeletal symptoms and blood markers of oxidative stress in
patients with chronic fatigue syndrome. Neurosci Lett. 335:151–154.
2003. View Article : Google Scholar : PubMed/NCBI
|
|
55
|
Richards RS, Wang L and Jelinek H:
Erythrocyte oxidative damage in chronic fatigue syndrome. Arch Med
Res. 38:94–98. 2007. View Article : Google Scholar
|
|
56
|
Maes M: Inflammatory and oxidative and
nitrosative stress pathways underpinning chronic fatigue,
somatization and psychosomatic symptoms. Curr Opin Psychiatry.
22:75–83. 2009. View Article : Google Scholar : PubMed/NCBI
|
|
57
|
De Luca C, Thai JC, Raskovic D, Cesareo E,
Caccamo D, Trukhanov A and Korkina L: Metabolic and genetic
screening of electromagnetic hypersensitive subjects as a feasible
tool for diagnostics and intervention. Mediators Inflamm.
2014:9241842014. View Article : Google Scholar : PubMed/NCBI
|
|
58
|
Aquilano K, Baldelli S and Ciriolo MR:
Glutathione: New roles in redox signaling for an old antioxidant.
Front Pharmacol. 5:1962014. View Article : Google Scholar : PubMed/NCBI
|
|
59
|
Zitka O, Skalickova S, Gumulec J, Masarik
M, Adam V, Hubalek J, Trnkova L, Kruseova J, Eckschlager T and
Kizek R: Redox status expressed as GSH:GSSG ratio as a marker for
oxidative stress in paediatric tumour patients. Oncol Lett.
4:1247–1253. 2012. View Article : Google Scholar : PubMed/NCBI
|
|
60
|
Briviba K, Kissner R, Koppenol WH and Sies
H: Kinetic study of the reaction of glutathione peroxidase with
peroxynitrite. Chem Res Toxicol. 11:1398–1401. 1998. View Article : Google Scholar : PubMed/NCBI
|
|
61
|
Rossi L, Squitti R, Pasqualetti P,
Marchese E, Cassetta E, Forastiere E, Rotilio G, Rossini PM and
Finazzi-Agró A: Red blood cell copper, zinc superoxide dismutase
activity is higher in Alzheimer's disease and is decreased by
D-penicillamine. Neurosci Lett. 329:137–140. 2002. View Article : Google Scholar : PubMed/NCBI
|
|
62
|
Pacher P, Beckman JS and Liaudet L: Nitric
oxide and peroxyni-trite in health and disease. Physiol Rev.
87:315–424. 2007. View Article : Google Scholar : PubMed/NCBI
|
|
63
|
O'Donnell VB, Chumley PH, Hogg N,
Bloodsworth A, Darley-Usmar VM and Freeman BA: Nitric oxide
inhibition of lipid peroxidation: Kinetics of reaction with lipid
peroxyl radicals and comparison with alpha-tocopherol.
Biochemistry. 36:15216–15223. 1997. View Article : Google Scholar
|
|
64
|
Ohshima H, Friesen M, Brouet I and Bartsch
H: Nitrotyrosine as a new marker for endogenous nitrosation and
nitration of proteins. Food Chem Toxicol. 28:647–652. 1990.
View Article : Google Scholar : PubMed/NCBI
|
|
65
|
Ischiropoulos H: Biological tyrosine
nitration: A pathophysi-ological function of nitric oxide and
reactive oxygen species. Arch Biochem Biophys. 356:1–11. 1998.
View Article : Google Scholar : PubMed/NCBI
|
|
66
|
Schopfer FJ, Baker PR and Freeman BA:
NO-dependent protein nitration: A cell signaling event or an
oxidative inflammatory response? Trends Biochem Sci. 28:646–654.
2003. View Article : Google Scholar : PubMed/NCBI
|
|
67
|
Marshall KA, Reist M, Jenner P and
Halliwell B: The neuronal toxicity of sulfite plus peroxynitrite is
enhanced by glutathione depletion: Implications for Parkinson's
disease. Free Radic Biol Med. 27:515–520. 1999. View Article : Google Scholar : PubMed/NCBI
|
|
68
|
Reynolds MR, Berry RW and Binder LI:
Site-specific nitration and oxidative dityrosine bridging of the
tau protein by peroxyni-trite: Implications for Alzheimer's
disease. Biochemistry. 44:1690–1700. 2005. View Article : Google Scholar : PubMed/NCBI
|
|
69
|
Vargas MR, Pehar M, Cassina P, Beckman JS
and Barbeito L: Increased glutathione biosynthesis by Nrf2
activation in astro-cytes prevents p75NTR-dependent motor neuron
apoptosis. J Neurochem. 97:687–696. 2006. View Article : Google Scholar : PubMed/NCBI
|
|
70
|
Gloire G, Legrand-Poels S and Piette J:
NF-kappaB activation by reactive oxygen species: Fifteen years
later. Biochem Pharmacol. 72:1493–1505. 2006. View Article : Google Scholar : PubMed/NCBI
|
|
71
|
Matata BM and Galinanes M: Peroxynitrite
is an essential component of cytokines production mechanism in
human monocytes through modulation of nuclear factor-kappa B DNA
binding activity. J Biol Chem. 277:2330–2335. 2002. View Article : Google Scholar
|
|
72
|
Falone S, Grossi MR, Cinque B, D'Angelo B,
Tettamanti E, Cimini A, Di Ilio C and Amicarelli F: Fifty hertz
extremely low-frequency electromagnetic field causes changes in
redox and differentiative status in neuroblastoma cells. Int J
Biochem Cell Biol. 39:2093–2106. 2007. View Article : Google Scholar : PubMed/NCBI
|
|
73
|
Park JE, Seo YK, Yoon HH, Kim CW, Park JK
and Jeon S: Electromagnetic fields induce neural differentiation of
human bone marrow derived mesenchymal stem cells via ROS mediated
EGFR activation. Neurochem Int. 62:418–424. 2013. View Article : Google Scholar : PubMed/NCBI
|
|
74
|
Consales C, Merla C, Marino C and Benassi
B: Electromagnetic fields, oxidative stress, and neurodegeneration.
Int J Cell Biol. 2012:6838972012. View Article : Google Scholar : PubMed/NCBI
|
|
75
|
Esmekaya MA, Ozer C and Seyhan N: 900 MHz
pulse-modulated radiofrequency radiation induces oxidative stress
on heart, lung, testis and liver tissues. Gen Physiol Biophys.
30:84–89. 2011. View Article : Google Scholar : PubMed/NCBI
|
|
76
|
Kesari KK, Kumar S and Behari J: 900-MHz
microwave radiation promotes oxidation in rat brain. Electromagn
Biol Med. 30:219–234. 2011. View Article : Google Scholar : PubMed/NCBI
|
|
77
|
Megha K, Deshmukh PS, Banerjee BD,
Tripathi AK, Ahmed R and Abegaonkar MP: Low intensity microwave
radiation induced oxidative stress, inflammatory response and DNA
damage in rat brain. Neurotoxicology. 51:158–165. 2015. View Article : Google Scholar : PubMed/NCBI
|
|
78
|
Furtado-Filho OV, Borba JB, Maraschin T,
Souza LM, Henriques JA, Moreira JC and Saffi J: Effects of chronic
exposure to 950 MHz ultra-high-frequency electromagnetic radiation
on reactive oxygen species metabolism in the right and left
cerebral cortex of young rats of different ages. Int J Radiat Biol.
91:891–897. 2015. View Article : Google Scholar : PubMed/NCBI
|
|
79
|
Dasdag S, Akdag MZ, Ulukaya E, Uzunlar AK
and Ocak AR: Effect of mobile phone exposure on apoptotic glial
cells and status of oxidative stress in rat brain. Electromagn Biol
Med. 28:342–354. 2009. View Article : Google Scholar : PubMed/NCBI
|
|
80
|
Simkó M: Cell type specific redox status
is responsible for diverse electromagnetic field effects. Curr Med
Chem. 14:1141–1152. 2007. View Article : Google Scholar : PubMed/NCBI
|