Introduction
Colorectal cancer (CRC) is a major international
health problem that is the third most frequent type of cancer and
the second most common cause of cancer related death in the Western
world (1). It has been reported
that when CRC is diagnosed at early stage, nearly 90% of the
patients can be cured by surgery. However, this disease is very
often diagnosed at an advanced stage, resulting in poor prognosis
subsequently (2–4). In addition, the mechanisms of CRC
development and progression are not quite clear and have yet to be
further explored. Therefore, more insight and new methods to
investigate the underlying mechanisms of CRC are needed to identify
effective biomarkers and this is critical for proper control of
CRC.
In recent years, proteomics have burst onto the
scientific scene rapidly (5).
Based on 2-DE and mass spectrometry, hundreds of proteins can be
identified simultaneously and precisely through high-throughput
identification. Therefore, proteomics have been widely applied to
search for diagnostic biomarkers in early disease detection, as
well as mechanism analysis of disease, especially in the field of
cancer research (6–8). In the present study, differentially
expressed proteins between individually matched CRC and normal
tissues were profiled from 8 CRC patients. Of 36 proteins
identified, carbonic anhydrase II (CA II) was chosen for
verification and function and mechanism analysis. It was expected
that the results from the study may contribute to a better
understanding of the molecular mechanism of CRC and provide insight
into colorectal cancer treatment.
Materials and methods
Patients and tissue preparation
For proteomic analysis, 8 cases of CRC and pared
adjacent normal tissues were obtained from West China Hospital,
Sichuan University. The clinical characteristics of the patients
are summarized in Table I. Fresh
tissues samples were obtained immediately after the surgery,
snap-frozen immediately in liquid nitrogen and then stored at −80°C
before analysis. For the validation studies, 25 cases of
paraffin-embedded primary CRC tissues and pared adjacent normal
tissues were collected consecutively from patients at West China
Hospital in 2009. Written informed consent was obtained from all
patients and the study procedures were approved by the Scientific
and Ethics Committee of Sichuan University (Chengdu, China).
 | Table I.Clinical features of all human tissue
samples. |
Table I.
Clinical features of all human tissue
samples.
| Sample | Age | Gender | Locationa | UICC staging |
|---|
| 1 | 84 | Male | A | I |
| 2 | 53 | Male | R | III |
| 3 | 66 | Male | A | II |
| 4 | 72 | Male | D | III |
| 5 | 59 | Female | T | III |
| 6 | 79 | Male | S | II |
| 7 | 60 | Female | R | III |
| 8 | 57 | Male | R | II |
Proteomic analysis and protein
identification
2-DE was carried out as previously described
(9) with minor modifications.
Briefly, tissue sample was ground into powder in liquid nitrogen
and sonicated in lysis buffer (7 M urea, 2 M thiourea, 4% CHAPS, 65
mM DTT, 0.2% ampholyte pH 3.0–10.0; Bio-Rad, Hercules, CA, USA)
containing protease inhibitor cocktail. IPG strips loaded with 1 mg
protein (17 cm, pH 3.0–10.0, non-linear; Bio-Rad) were passively
rehydrated for 12–16 h. Having been separated according to their pI
for the first dimension, the strips were transferred to the second
dimension 12% SDS-PAGE for the separation according to the
molecular weight. Spots that showed consistent and significant
differences (>2-fold) were selected for mass spectrometry (MS)
analysis.
In-gel digestion of protein was conducted using
MS-grade Trypsin Gold (Promega, Madison, WI, USA) by following the
manufacturer’s instructions. ESI-Q-TOF MS/MS analysis and protein
identification were performed as described in our previous
proteomic studies (9). Briefly,
peptide mass maps were acquired using a Q-TOF mass spectrometer
(Micromass, Manchester, UK) fitted with an ESI source. For MASCOT
analysis, peptide and fragment mass tolerance were set at 0.1 and
0.05 Da, respectively.
Semiquantitative RT-PCR
Total RNA extraction was performed using TRIzol
reagent (Invitrogen). cDNA was then synthesized using the ExScript™
reagent kit (Takara, Shiga, Japan) following the manufacturer’s
instructions. The primer sequences and the expected sizes for PCR
products were as follows: CA II, 5′-GTCCCATAGTCTGTATCCAA-3′ (sense)
and 5′-GAGTGCTCATCACCCTACAT-3′ (antisense) (301 bp); GAPDH,
5′-TGGAAGGACTCATGACCACA-3′ (sense) and 5′-GCTTCCCACCTTCTTGATG-3′
(antisense) (280 bp). The amplification parameters consisted of 25
(CA II) or 20 cycles (GAPDH) at 94°C for 30 sec, 60°C (CA II) or
57°C (GAPDH) for 30 sec and 72°C for 30 sec. The PCR products were
analyzed by electrophoresis in 1.2% agarose gels and visualized by
Gold View (Takara) staining.
Western blotting
CRC tissues and cells were lysed with cold RIPA
lysis buffer containing protease inhibitors. Thirty micrograms of
protein extraction were applied to 12% SDS-PAGE gels and then
transferred to polyvinylidene fluoride membrane. The membrane was
probed with primary antibodies against CA II (1:1,000, GeneTex),
E-cadherin (1:1,000, Cell Signaling Technology, MA, USA), vimentin
(1:1,000, Cell Signaling Technology), PKM2 (1:1,000, Cell Signaling
Technology) and GAPDH (1:1,000, Santa Cruz Biotechnology, Inc.
Santa Cruz, CA, USA), respectively. Blots were developed with
HRP-conjugated secondary antibodies (1:5,000, Santa Cruz) and
chemiluminescent substrate (Millipore, MA, USA) on Kodak X-ray
film.
Immunohistochemistry and
immunocytochemistry
Tissue slides or SW480 cells fixed in polystyrene
culture were stained with the rabbit anti-human CA II antibody
(diluted 1:200, GeneTex) using the DAB substrate solution according
to the manufacturer’s instructions.
Cell culture and establishment of a
stable cell line
Four human colorectal cancer cell lines, SW480,
SW620, HCT116 and LoVo cell were purchased from ATCC (American Type
Culture Collection, Manassas, VA, USA). Cells were grown in DMEM
medium (Gibco, Carlsbad, CA, USA) supplemented with 2 mM
L-glutamine, 10% FBS, 100 U/ml penicillin and 100 μg/ml
streptomycin. Cells were maintained in a humidified environment
containing 5% CO2 at 37°C.
For establishment of the stable cell line SW480,
cells were transfected with DNA constructs (OriGene) encoding
EGFP-CA II (SW480-CA II-over) or EGFP (SW480-control). Forty-eight
hours after transfection, cells are harvested, diluted (1:10) and
plated in fresh medium containing G418 (800 μg/ml,
Invitrogen, Carlsbad, CA, USA). Colonies with green fluorescent
signal were then picked and expanded.
Drug treatments and MTT assay
Tumor cells were seeded in 96-well plates at
5×10³ cells per well. After 16 h, cells were incubated
with various concentrations of drugs. SW480 cells were treated with
different concentration of oxaliplatin (10, 20, 30, 40 and 50
μM respectively, Sigma, St. Louis, MO, USA); and, after
pretreatment with 100 μM acetazolamide (Sigma) for 8 h,
HCT116 cells were treated with oxaliplatin as in SW480 cells.
Forty-eight hours later, the effects of drugs on cells were
assessed using MTT methods. Briefly, cells were incubated with 20
μl of MTT reagent (20 mg/ml) for 4 h, followed by addition
of 100 μl of solubilization solution into each well. The
plates were left in the dark room overnight and optical density
(OD) was measured at 590 nm wavelength. Results are expressed as
percentage of viable cells compared with untreated cells (with 100%
viability). The results are based on three independent experiments.
Drug concentrations that inhibit 50% of cell viability
(IC50) for oxaliplatin were determined using the method
described previously (10).
Colony formation assay
SW480 cells overexpressing CA II and control cells
were seeded at 300 cells/well in a 6-well plate with triplicate
wells for each group. After 14 days of culture, cells were fixed in
methanol for 30 min and stained with Giemsa (Beyotime). The number
of clones consisting of >50 cells was counted. The colony
forming efficiency was calculated according to the formula: (the
clone number/the plated cell number) × 100.
Flow cytometry
The cells were harvested, washed twice with PBS and
fixed in 70% ethanol overnight. After incubation with RNAse A and
propidium iodide (Beyotime) for 30 min at 4°C in the dark, cell
cycle data were collected on a flow cytometer with a 488-nm laser
and analyzed with the manufacturer’s software.
Statistical analyses
All quantitative data were expressed as mean ± SD.
Comparisons between two groups were performed by Student’s t-test.
Statistical calculations were performed with SPSS 11.0.0
statistical software. Data were considered as statistically
significant at P<0.05.
Results
Identification of differentially
expressed proteins between CRC and the corresponding normal
tissues
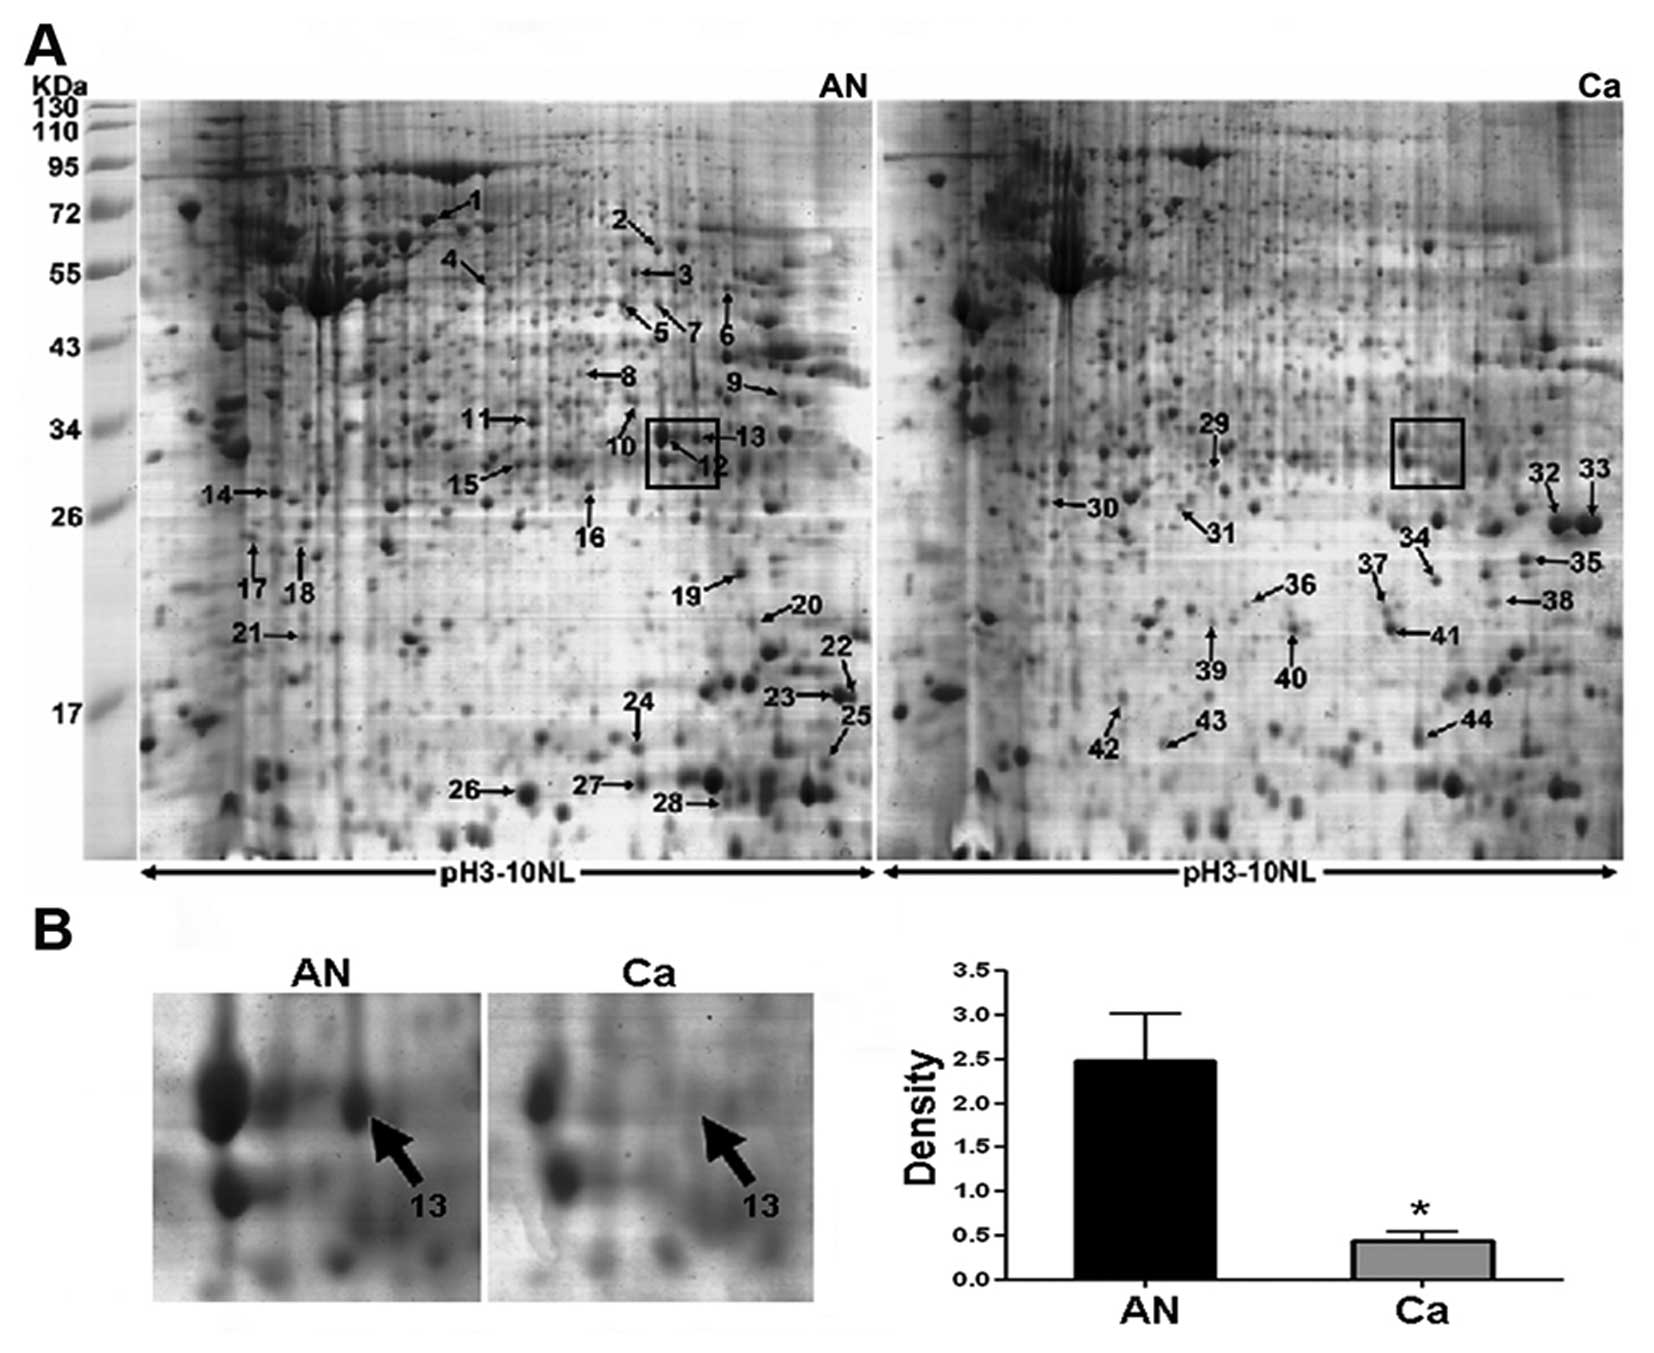
The proteome of individual-matched CRC and normal
colorectal tissues from 8 patients (mean age 66.25±10.39 years;
range 53–84 years) were compared by 2-dimensional gel
electrophoresis (2-DE) using a broad pH gradient (pH 3.0–10.0
non-linear). Coomassie staining of 2-D gels visualized 852±46 and
871±34 protein spots within normal colorectal tissues and CRC,
respectively. Representative 2-DE maps are showed in Fig. 1A and spot no. 13 (boxed in Fig. 1A) as a selected example, was
significantly downregulated in CRC as shown in enlarged form in
Fig. 1B. As a result, 52 spots
showed >2.0-fold change (P<0.05). Differentially expressed
protein spots were subsequently subjected to MS/MS analysis. Of 52
spots, 44 spots corresponding to 36 unique proteins were identified
probably due to post-translational modification such as protein
phosphorylation (Table II).
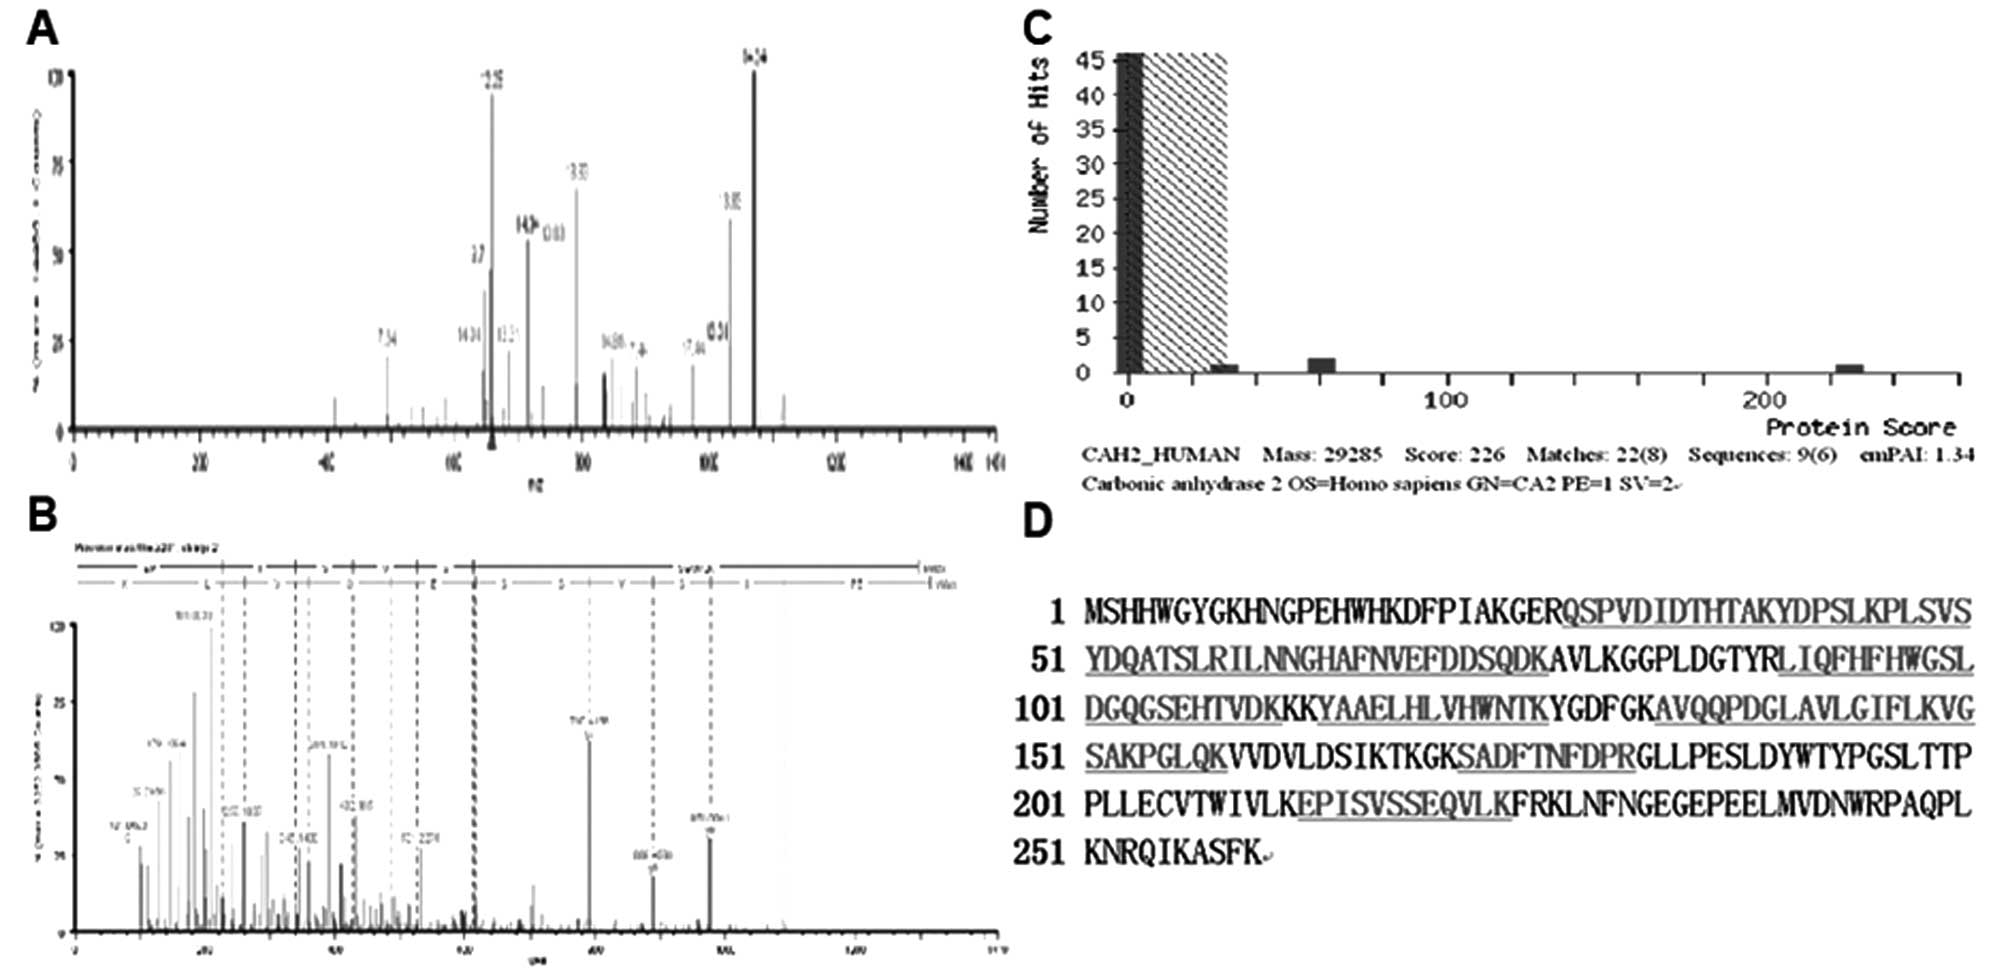
Notably, carbonic anhydrase II (CA II) corresponding to spot no. 13
(Fig. 1B) was found to be one of
the most significantly differential expression between cancer and
normal tissues. It was downregulated >5-fold in CRC compared
with the normal tissues. The mass spectra of CA II is shown in
Fig. 2. MS/MS analysis of CA II
revealed 8 matched-peptides, 50% sequence coverage and a MOWSE
score of 226. Due to the confident identification, CA II was chosen
as the subsequent focus of this study.
| Table II.Identified proteins by MS/MS
analysis. |
Table II.
Identified proteins by MS/MS
analysis.
| Protein
description | Gene name | Function | Accession no. | Theoretical
Mr/pIa | Scoreb | No. of pepc (%) | Fold-changed (mean ± SD) |
|---|
| 1 | Protein
disulfide-isomerase A3 | PDIA3 | Protein
folding | P30101 | 57146/5.98 | 388 | 12/28 | ↓2.1±0.7 |
| 2 |
Hydroxymethylglutaryl-CoA synthase,
mitochondrial | HMCS2 | Energy
metabolism | P54868 | 57113/8.40 | 228 | 7/29 | ↓2.4±0.6 |
| 3 | Isocitrate
dehydrogenase [NADP] cytoplasmic | IDHC | Energy
metabolism | O75874 | 46915/6.53 | 263 | 10/41 | ↓2.2±0.7 |
| 4 | Leukocyte elastase
inhibitor | ILEU | Proteolysis | P30740 | 42829/5.90 | 205 | 12/41 | ↓3.2±0.9 |
| 5 | Sialic acid
synthase | SIAS | Glucose
metabolism | Q9NR45 | 40738/6.29 | 196 | 7/37 | ↓2.2±0.4 |
| 6 | Creatine kinase
U-type, mitochondrial | KCRU | Metabolism | P12532 | 47406/8.60 | 519 | 9/41 | ↓2.0±0.6 |
| 7 | Poly(rC)-binding
protein 1 | PCBP1 | RNA binding | Q15365 | 37987/6.66 | 251 | 10/54 | ↓2.3±0.8 |
| 8 | Ribose-phosphate
pyrophosphokinase 2 | PRPS2 | Nucleic acid
metabolism | P11908 | 35146/6.15 | 191 | 6/30 | ↓2.2±0.8 |
| 9 |
Hydroxyacyl-coenzyme A dehydrogenase,
mitochondrial | HCDH | Energy
metabolism | Q16836 | 34313/8.88 | 218 | 6/39 | ↓3.1±0.7 |
| 10 | Sulfotransferase
family cytosolic 1B member 1 | ST1B1 | Protein
modification | O43704 | 35048/6.57 | 64 | 1/4 | ↓4.2±0.9 |
| 11 | Sulfotransferase
1A1 | ST1A1 | Protein
modification | P50225 | 34289/6.16 | 304 | 11/51 | ↓3.6±1.1 |
| 12 | Carbonic anhydrase
1 | CAH1 | Carbonate
dehydratase | P00915 | 28909/6.59 | 1130 | 10/61 | ↓2.5±0.8 |
| 13 | Carbonic anhydrase
2 | CAH2 | Carbonate
dehydratase | P00918 | 29285/6.87 | 226 | 8/50 | ↓5.6±1.5 |
| 14 | Rho
GDP-dissociation inhibitor 1 | GDIR1 | GTPase
activator | P52565 | 23250/5.02 | 793 | 9/57 | ↓2.4±0.6 |
| 15 | Protein ETHE1,
mitochondrial | ETHE1 | Energy
metabolism | O95571 | 28368/6.35 | 875 | 11/74 | ↓1.6±0.4 |
| 16 | Cytochrome b-c1
complex subunit Rieske, mitochondrial | UCRI | Electron
transport | P47985 | 29934/8.55 | 272 | 6/29 | ↓2.3±0.9 |
| 17 |
Translationally-controlled tumor
protein | TCTP | Calcium ion
binding | P13693 | 19697/4.84 | 129 | 5/36 | ↓2.9±0.8 |
| 18 | NADH dehydrogenase
[ubiquinone] iron-sulfur protein 8, mitochondrial | NDUS8 | Energy
metabolism | O00217 | 24203/6.00 | 287 | 6/32 | ↓2.2±0.6 |
| 19 | Superoxide
dismutase [Mn], mitochondrial | SODM | Redox
regulation | P04179 | 24878/8.35 | 703 | 9/71 | ↓2.4±0.8 |
| 20 |
Phosphatidylethanolamine-binding protein
1 | PEBP1 | ATP binding | P30086 | 21158/7.01 | 1276 | 11/76 | ↓N/A e |
| 21 | Plasma cell-induced
resident endoplasmic reticulum protein | PERP1 | Protein
binding | Q8WU39 | 21023/5.37 | 397 | 5/55 | ↓2.1±0.6 |
| 22 | Anterior gradient
protein 2 homolog | AGR2 | Protein
binding | O95994 | 20024/9.03 | 462 | 9/42 | ↓2.3±0.7 |
| 23 | Anterior gradient
protein 2 homolog | AGR2 | Protein
binding | O95994 | 20024/9.03 | 279 | 9/42 | ↓3.4±0.6 |
| 24 | Cytochrome c
oxidase subunit 5B, mitochondrial | COX5B | Electron
transport | P10606 | 13915/9.07 | 47 | 2/19 | ↓2.4±0.8 |
| 25 | Cytochrome b-c1
complex subunit 7 | QCR7 | Electron
transport | P14927 | 13522/8.73 | 112 | 3/34 | ↓2.1±0.8 |
| 26 | Fatty acid-binding
protein, liver | FABPL | Lipid
metabolism | P07148 | 14256/6.60 | 367 | 9/61 | ↓3.0±0.9 |
| 27 | Fatty acid-binding
protein, liver | FABPL | Lipid
metabolism | P07148 | 14256/6.60 | 67 | 2/33 | ↓3.6±1.3 |
| 28 | D-dopachrome
decarboxylase | DOPD | Protein
modification | P30046 | 12818/6.71 | 145 | 5/44 | ↓2.2±0.7 |
| 29 | Myosin-11 | MYH11 | Muscle
contraction | P35749 | 228054/5.42 | 68 | 2/2 | ↑N/A |
| 30 | ATP synthase
subunit d, mitochondrial | ATP5H | Metabolism | O75947 | 18537/5.21 | 116 | 4/43 | ↑2.6±0.5 |
| 31 | Triosephosphate
isomerase | TPIS | Glucose
metabolism | P60174 | 26938/6.45 | 160 | 7/41 | ↑2.3±0.6 |
| 32 | Transgelin | TAGL | Actin binding | Q01995 | 22653/8.87 | 858 | 13/59 | ↑N/A |
| 33 | Transgelin | TAGL | Actin binding | Q01995 | 22653/8.87 | 1428 | 15/55 | ↑N/A |
| 34 | Transgelin | TAGL | Actin binding | Q01995 | 22653/8.87 | 487 | 11/64 | ↑2.2±0.7 |
| 35 | Transgelin-2 | TAGL2 | Not determined | P37802 | 22548/8.41 | 640 | 16/67 | ↑2.3±0.7 |
| 36 | Actin-related
protein 2/3 complex subunit 5-like protein | ARP5L | Structural
component | Q9BPX5 | 16931/6.15 | 84 | 1/16 | ↑2.2±0.7 |
| 37 | Transgelin | TAGL | Actin binding | Q01995 | 22653/8.87 | 184 | 7/43 | ↑3.3±0.7 |
| 38 | Transgelin | TAGL | Actin binding | Q01995 | 22653/8.87 | 487 | 11/64 | ↑N/A |
| 39 | Transgelin | TAGL | Actin binding | Q01995 | 22653/8.87 | 326 | 10/52 | ↑N/A |
| 40 | Transgelin | TAGL | Actin binding | Q01995 | 22653/8.87 | 102 | 10/52 | ↑3.3±0.9 |
| 41 | Transgelin | TAGL | Actin binding | Q01995 | 22653/8.87 | 326 | 6/55 | ↑4.3±1.3 |
| 42 | Transthyretin | TTHY | Thyroid
hormone-binding | P02766 | 15991/5.52 | 423 | 6/55 | ↑N/A |
| 43 | Protein
S100-A9 | S10A9 | Calcium ion
binding | P06702 | 13291/5.71 | 100 | 4/49 | ↑2.3±0.7 |
| 44 | Eosinophil
lysophospholipase | LPPL | Lipid
metabolism | Q05315 | 16584/6.82 | 42 | 3/25 | ↑2.0±0.9 |
Validation of CA II by semiquantitative
RT-PCR and western blot analysis
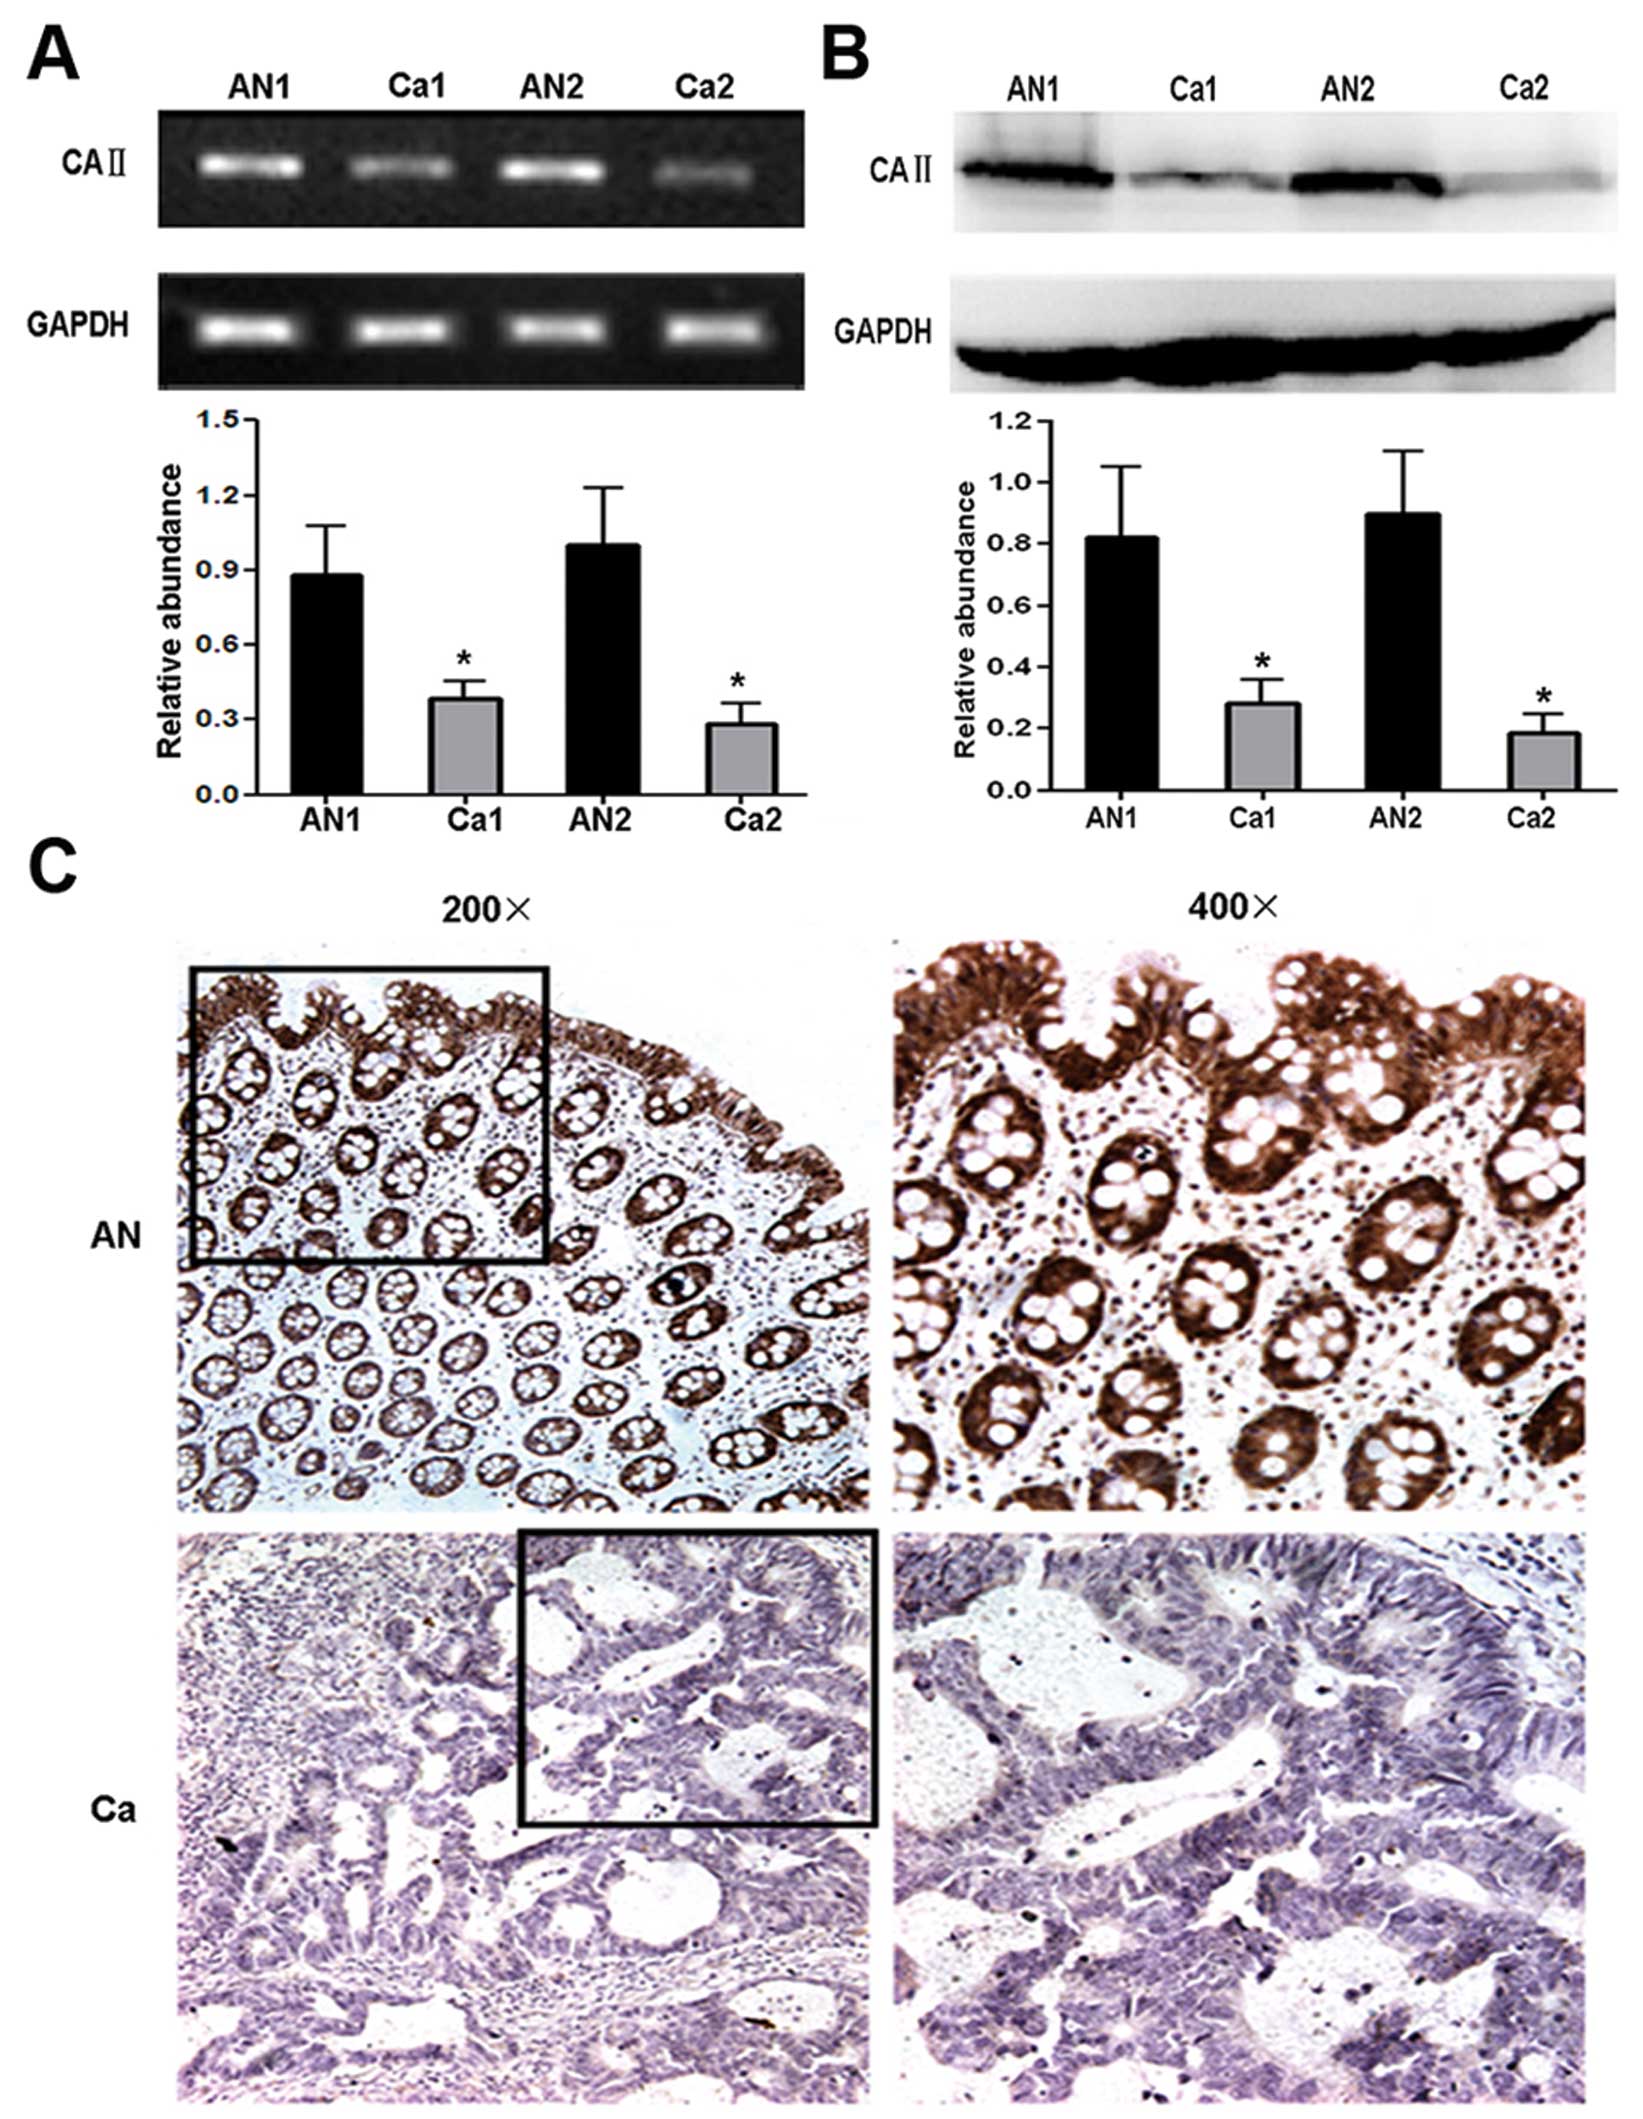
To confirm the differential expression of CA II
between CRC and corresponding normal tissues, validation
experiments were performed by RT-PCR and western blot analysis at
mRNA and protein level, respectively. The result of RT-PCR analysis
showed significantly different mRNA level of CA II between CRC and
normal tissues (cancer tissues, 0.31±0.07; normal tissues,
0.98±0.25; Student’s t-test, P<0.01) (Fig. 3A). Western blot analysis was
performed using anti-CA II antibody and remarkable CA II
downregulation was observed in CRC tissues (cancer tissues,
0.22±0.05; normal tissues, 0.85±0.28; Student’s t-test, P<0.01)
(Fig. 3B). Taken together, our
data demonstrated that CA II expression notably decreased in CRC
compared with normal tissues, which was consistent with the results
of 2-DE.
Further verification of CA II expression
by immunohistochemistry
To further confirm the reduction of CA II expression
in CRC, 25 paraffin-embedded individual-matched CRC and normal
colorectal tissues were stained using anti-human CA II antibody.
Strong positive staining for CA II mainly located in the cytoplasm
and nucleus of epithelium and gland cells in normal colorectal
tissues. In contrast, there were weakly or negative staining signal
in CRC tissues (Fig. 3C). As shown
in Table III significant
differences in staining intensity and positive cells were observed
between CRC and normal colorectal specimens (rank-sum test,
P<0.05). The semiquantitative scoring of immunoreactivity for
normal tissues and CRC was 6.45±2.84, 1.57±0.86, respectively
(Student’s t-test, P<0.01), suggesting the expression of CA II
had a decreased tendency in both frequency and intensity from
normal tissues to CRC.
| Table III.The expression of carbonic anhydrase
II in colorectal cancer tissues. |
Table III.
The expression of carbonic anhydrase
II in colorectal cancer tissues.
| No. | − | + | ++ | +++a | Total score | Average
scoreb |
|---|
| AN | 25 | 0 | 20% (5/25) | 32% (8/25) | 48% (12/25) | 161 | 6.45±.84 |
| Ca | 25 | 52% (13/25) | 28% (7/25) | 20% (5/25) | 0 | 39 | 1.57±0.86 |
CA II overexpression exerts inhibitory
effect on CRC cell growth both in vitro and in vivo
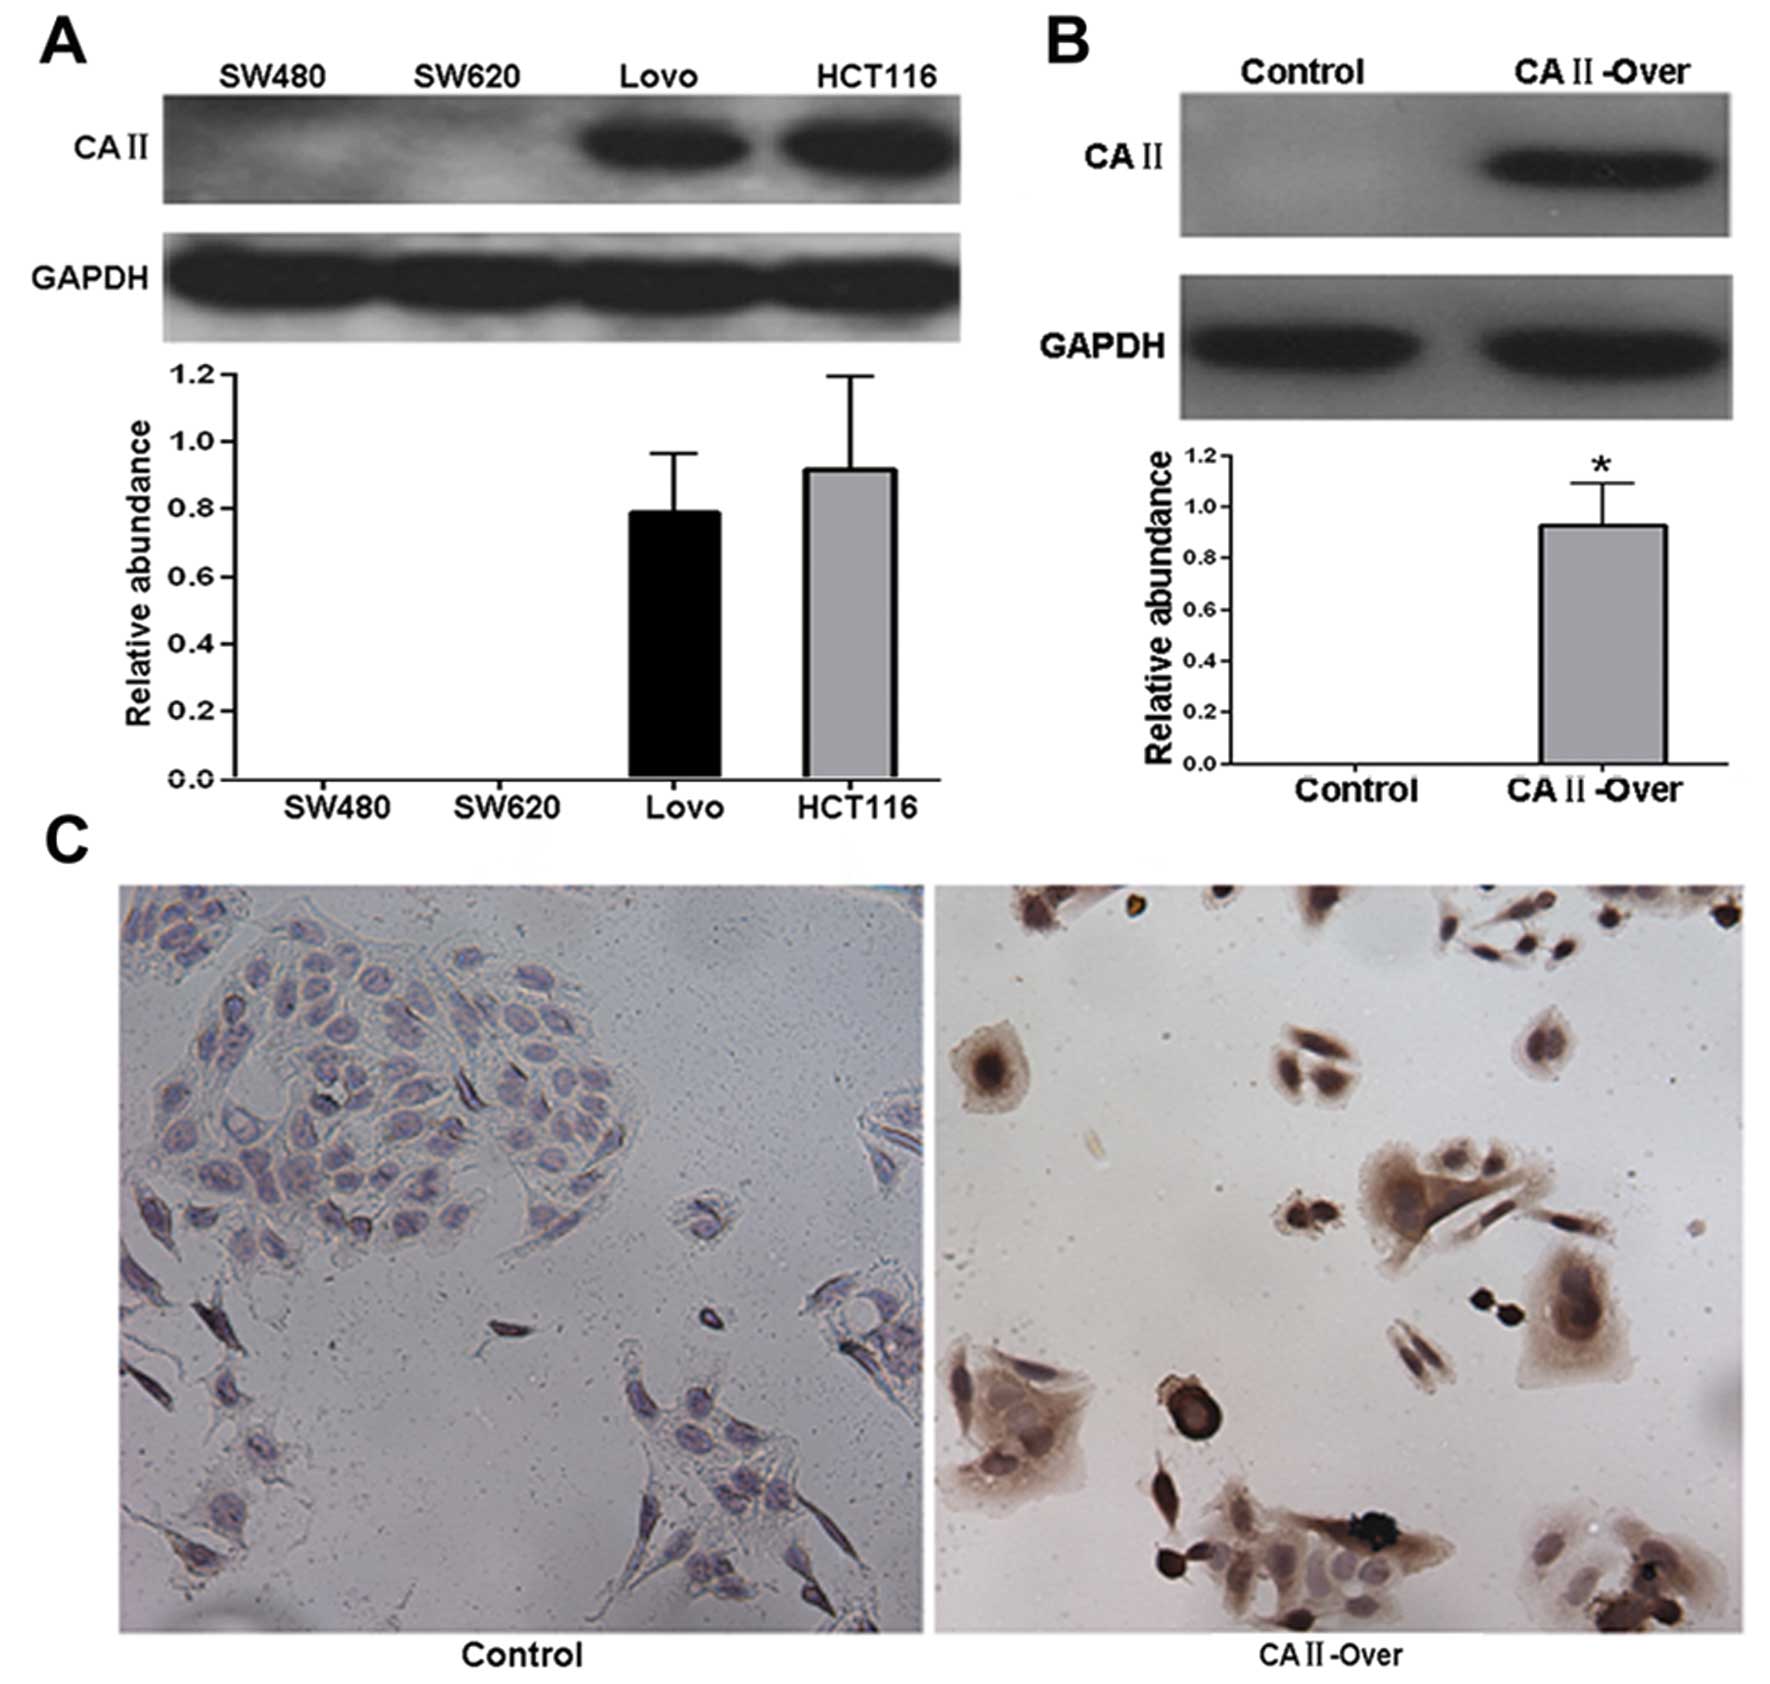
In order to investigate the function of CA II in
colorectal carcinoma, CRC cancer cell line SW480 was used to
establish a stable cell line overexpressing CA II (SW480-CA
II-over), since CA II was not detected in SW480 cells (Fig. 4A). Western blot and
immunocytochemistry analysis showed that in contrast with no
expression in control stable cell line (SW480-control), remarkable
expression of CA II was observed in SW480-CA II-over stable cell
line (Fig. 4A and B), suggesting
successful establishment of stable SW480-CA II-over cell line.
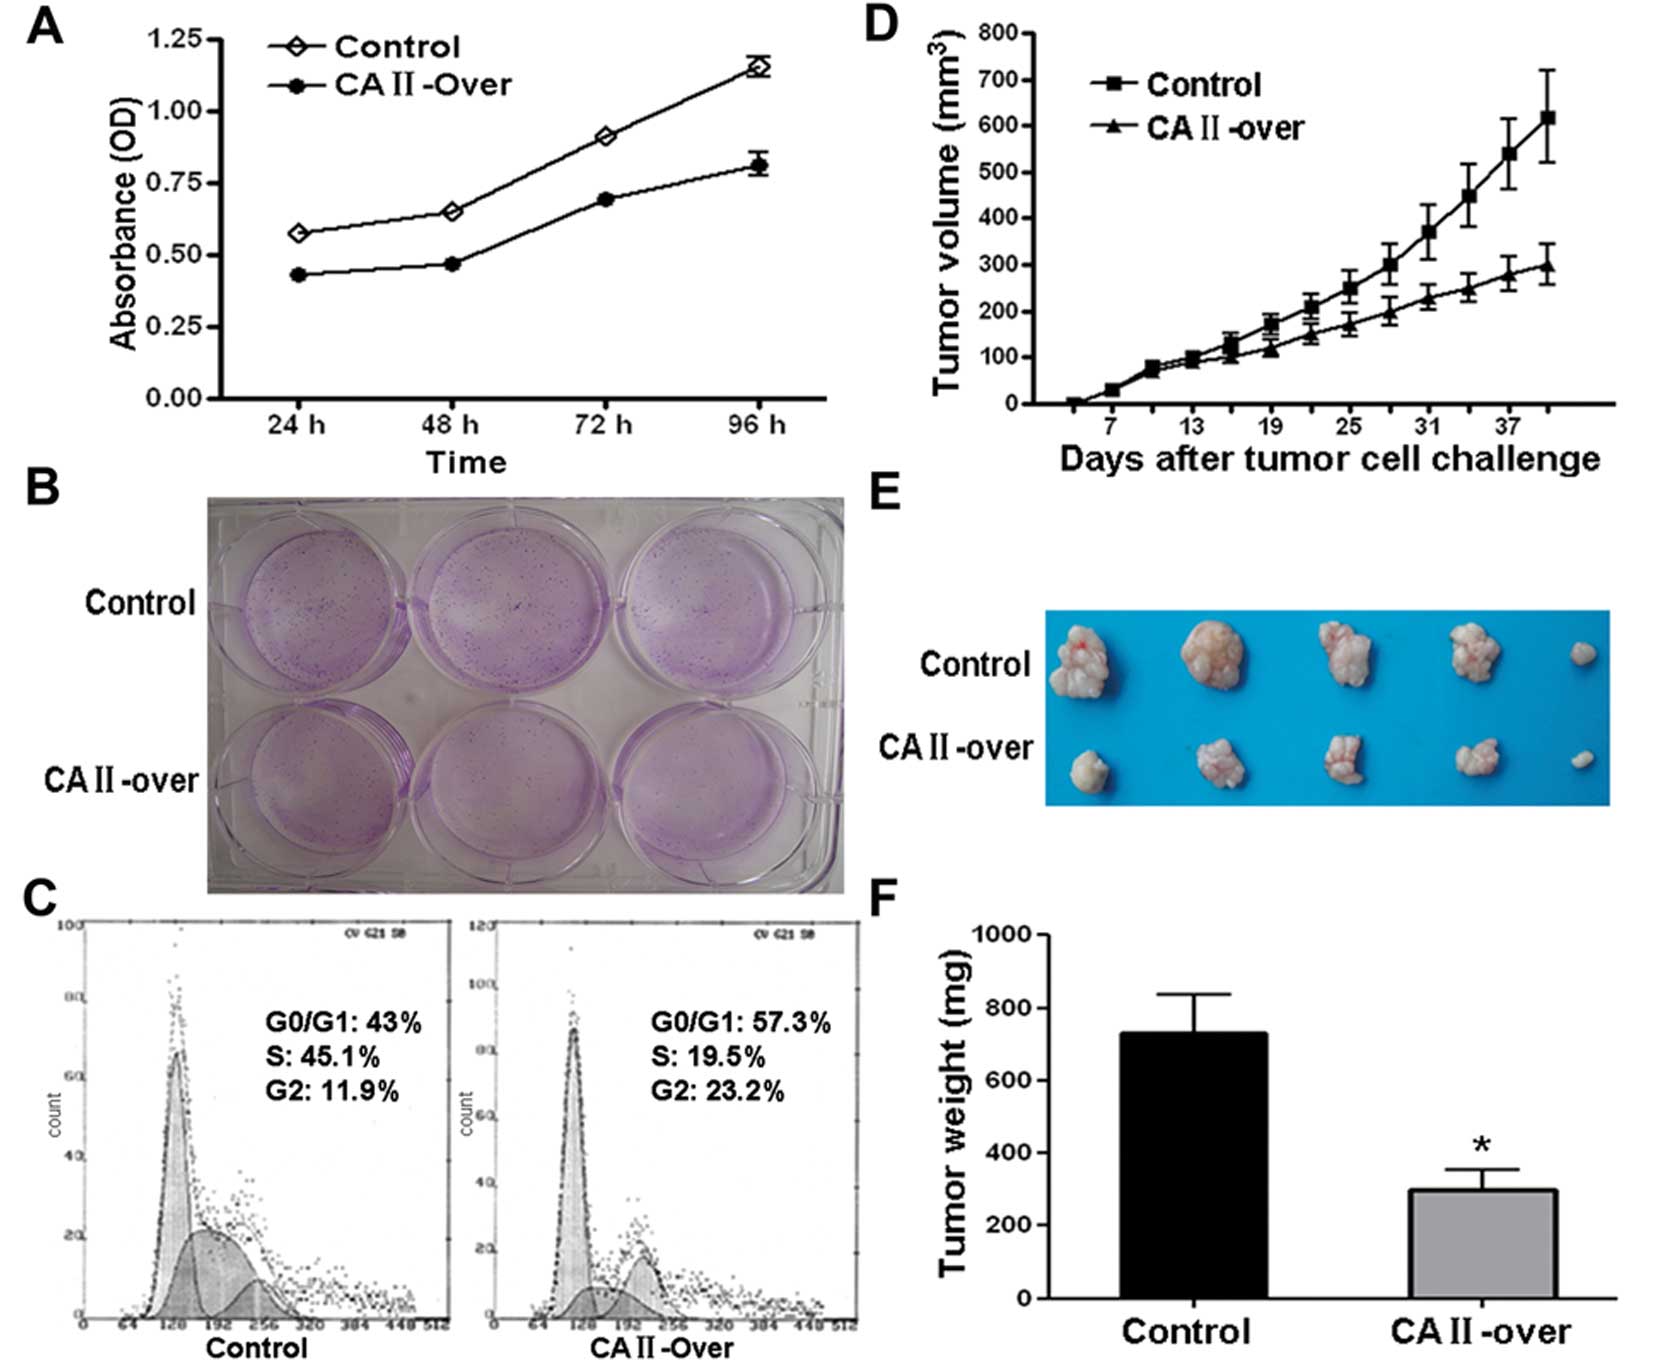
To examine the effect of on CRC cells, MTT assay was
carried out. As shown in Fig. 5A,
CA II overexpression notably suppressed SW480 cell viability in a
time-dependent manner. Colony formation assay showed that
overexpression of CA II in SW480 cell significantly suppressed
colony formation efficiency compared with control cells (Fig. 5B). Further flow cytometry analysis
demonstrated that SW480 cells stably and highly expressing CA II
were stalled at G0/G1 and G2 phase with subsequent decrease in S
phase compared with control stable cell line (Fig. 5C).
Moreover, the inhibitory effects on CRC cancer cell
growth were examined in an animal model. Tumor growth curve drawn
based on the data from in vivo tumor model showed that SW480
overexpressing CA II had a slowed growth rate (Fig. 5D). Representative images of tumor
dissection showed that high expression of CA II in tumor cell
resulted in suppressed tumor volume (Fig. 5E). As shown in Fig. 5F, there was a remarkable difference
in average tumor weight between CA II-overexpression and control
group (CA II-over, 301.3±120.7 mg; control, 730±240.5 mg; Student’s
t-test, P<0.01). Our results in vitro and in vivo
suggested that CA II could serve as a tumor suppressor gene and
suppress colorectal carcinoma growth and development.
Cytotoxicity assay suggests CA II
increases the sensitivity of CRC cells to oxaliplatin
Through catalyzing the reversible reactions of
CO2 and water: CO2 +
H2O⇆H+ + HCO3−, CA II
exerts an important role in acid-base balance in living organism.
Thus, it was hypothesized that some signal pathways underling tumor
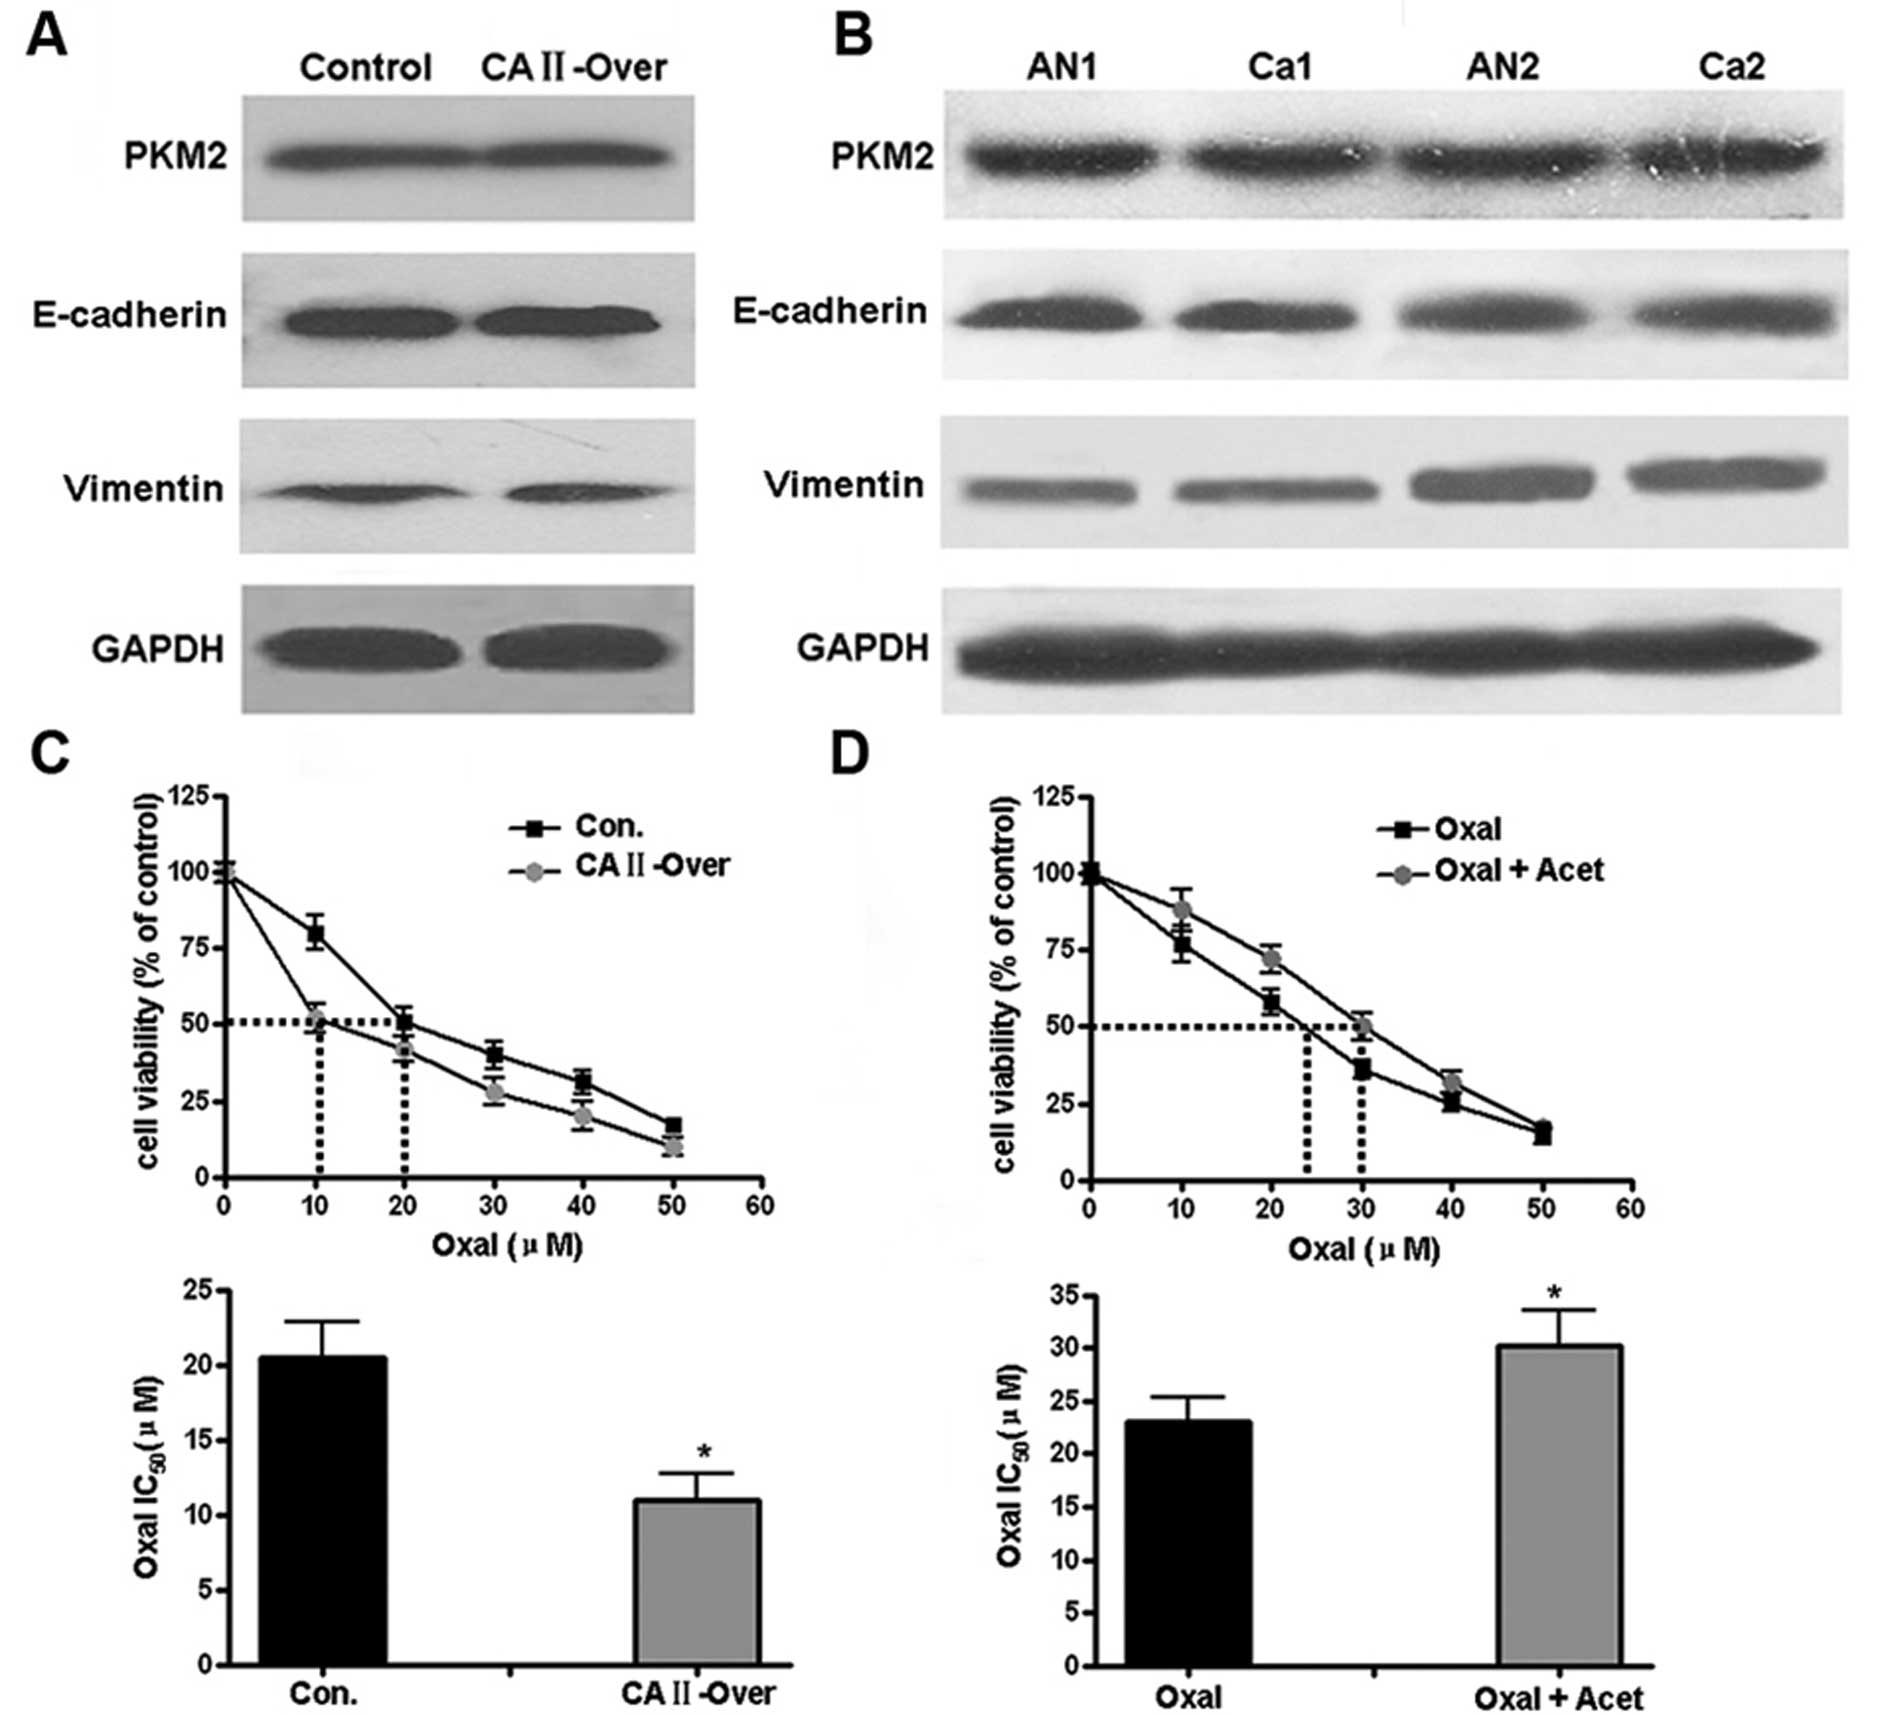
development might be regulated by CA II. As a rate-limiting enzyme
of aerobic glycolysis in tumor, embryonic M2 isoform of pyruvate
kinase (PKM2) was first determined by western blotting. Similar
protein level of PKM2 was observed in control and SW480-CA II-over
cells (Fig. 6A); there was no
significant difference of PKM2 expression in CRC and corresponding
normal tissues (Fig. 6B).
E-cadherin and vimentin, two markers corresponding to epithelial
and mesenchymal cells, respectively, in epithelial-mesenchymal
transition (EMT) were then examined. As shown in Fig. 6A and B, both in vitro cells
and CRC tissues, no differential expression of CA II was
observed.
Since extracellular acidification of cancer cells in
tumor tissues leading to decreased anticancer drug uptake is one of
drug-resistance mechanism, it was hypothesized that through pH
regulation, CA II may affect sensitivity of CRC cancer cells to
anticancer drug. Chemosensitivity tests by MTT showed that CA II
overexpression increased the sensitivity of SW480 cells to
oxaliplatin (IC50), from 20.5±4.3 μM in control
group to 11±5.5 μM (Student’s t-test, P<0.05). In
contrast, for HCT116 cells with high expression of CA II, with or
without pretreatment with acetazolamide, a non-specific antagonist
against CA II, the corresponding IC50 for oxaliplatin
was 30.3±3.2 and 23±4.1 μM, respectively (P<0.05),
suggesting CA II could induce the chemotherapeutic sensitivity of
colon cancer cells.
Discussion
In the Western world colorectal cancer (CRC) is the
third most frequent type of cancer and the second most common cause
of cancer related death (1).
Clearly, early diagnosis and prognosis are urgent for efficient
control of CRC and this largely dependents on more advances in the
knowledge of mechanisms associated with CRC. In the present study,
we compared the proteome between CRC and corresponding normal
tissues with 2-DE and MS/MS-based approach. Thirty-six
differentially expressed proteins were identified between two
groups and most of these proteins were involved in fundamental
biological processes. Among these 36 proteins, CA II was further
studied according to the following selection criteria: i) it is one
of the most significantly and differentially expressed proteins
between CRC and matched normal tissues; ii) good reliability of the
MS identification of protein; iii) evolutionarily conserved
sequence and physiological function is crucial; iv) no or few
studies reported the function and mechanism in tumor.
Carbonic anhydrase II (CA II), one of CA family
isozymes, catalyzes the reversible hydration of carbon dioxide:
CO2 + H2O⇆H+ +
HCO3−, which is involved in many critical
physiological or biochemical processes based on ion transport and
pH balance such as respiration, digestion, bone resorption and
renal acidification (11). In
addition to physiological function, it has recently been found that
CA II is abnormally expressed in many types of human cancer. It was
noteworthy that there was no consistent expression profile of CA II
in different types of cancer tissues (12–15).
Moreover, there is a contradictory correlation between CA II and
the prognosis, progression of cancer patient among different types
of cancer (12–15). It was shown that CA II was
overexpressed in most gastrointestinal stromal tumors and strong
staining of CA II indicated significantly better survival rates,
suggesting CA II may serve as a diagnostic and prognostic biomarker
for gastrointestinal stromal tumors (12). In contrast, immunostaining of the
tumors and normal tissues from melanoma, esophageal, renal and lung
cancers revealed that CA II was expressed in the tumor vessel while
not in normal vessel endothelium (13). Furthermore, compared with negative
staining, positive staining of CA II in vessel endothelial cells
from meningiomas and glial tumors predicted worse survival rates
(14,15). In our study, comparative proteomic
analysis showed expression of CA II notably decreased in CRC
compared to normal colorectal tissues. RT-PCR, western blot
analyses and immunohistochemistry were further performed to
validate downregulation of CA II in CRC tissues and these results
were also consistent with previous studies that paralleled with
increasing severity of colorectal tissue lesions and progression of
CRC, the staining intensity of CA II among normal tissues, benign
lesions and malignant lesions revealed clearly decreased tendency
(16–18). However, function and mechanism of
CA II in the CRC development and progression have not been
investigated.
Considering that CA II expressed is low in CRC
tissues, gain of function strategy was utilized to study function
of CA II in CRC. Stable cell line overexpressing CA II, SW480-CA
II-over was then established given that CA II could not be examined
in colorectal cancer cell line SW480. Serial in vitro as
well as in vivo experiment results demonstrated that
overexpressing CA II significantly suppressed colorectal cancer
cell SW480 proliferation both in vitro and in vivo,
which could be partially explained by remarkable cell cycle arrest
at G0/G1 and G2 phase. To our knowledge, there is no report on how
CA II functions in cancer development and progression, in spite of
its abnormal expression in many types of cancer. We report that at
least in colorectal cancer, CA II may play a role as tumor
suppressor gene in cancer development and progression.
A distinguishing phenotype of acidic extracellular
pH (pHe) and alkaline intracellar pH (pHi) in solid tumors appears
to give selective advantage for tumor growth and development
(19). Since carbonic anhydrase
isoenzymes were involved in generating acidic tumor
microenvironment (20,21), we hypothesized that CA II may also
influence the processes associated with tumor microenvironment.
Embryonic M2 isoform of pyruvate kinase (PKM2) was first determined
by western blotting since it is a rate-limiting enzyme of aerobic
glycolysis in tumors and this is specific to metabolism of solid
tumors originally described by Otto Warburg (22,23).
Overexpressing CA II failed to alter PKM2 protein level and there
was no significant change of CA II between matched CRC and normal
tissues. Epithelial-tomesenchymal transition (EMT) is a
transdifferentiation shift in which epithelial cells lose
adhesiveness and polarity and acquire spindle morphology and
migratory capacity characteristic of fibroblasts (24,25).
It has been shown that EMT plays crucial roles in acquisition of
tumoral invasiveness, the initial step of the metastatic cascade in
cancer (24,25). Differently expressed E-cadherin and
vimentin, two markers corresponding to epithelial and mesenchymal
cells, respectively, were not observed in vitro or in
tissues. Changed tumor microenvironment can influence the uptake of
anticancer drugs and modulate the response of tumor cells to
anticancer drugs (19). In the
present study, overexpression of CA II decreased the oxaliplatin
IC50 compared with that in control SW480 cells. In
contrast, in HCT16 cells with high CA II expression, oxaliplatin
IC50 increased after pretreatment with CA II antagonist,
which suggested that CA II could increase the sensitivity of
colorectal cancer cells to chemotherapy drugs. Inconsistent with
our results, Mallory et al (26) found that in highly tumorigenic
MDA-MB-231 breast cancer cells, knockdown of CA II expression using
RNAi strategy resulted in less IC50 than in control
cells for doxorubicin, an antineoplastic drug, implicating that CA
II may negatively regulate sensitivity of breast cancer cells to
chemotherapy drugs. In order to explain this contradiction and get
more precise results, it is obviously necessary to increase the
number of cell types and chemotherapy drugs for IC50
determination.
In the present study, we only utilized gain of
function strategy to study the functions of CA II. Through
establishing the colorectal cancer cell line stably overexpressing
CA II, we concluded that CA II might serve as a tumor suppressor
gene in at least CRC development and progression. In future
research, it is necessary to further strengthen our conclusion by
using loss of function strategies such as knockout or knockdown of
CA II gene expression. Another limitation is the mechanism by which
CA II suppressed the development and progression of CRC has yet to
be thoroughly revealed, although it was shown that CA II could
increase the sensitivity of CRC cells to anticancer drugs. Further
study to explore the mechanism of CA II tumor inhibitory effects
will be conducted in our research group.
In this study, CA II was identified by proteomic
analysis as a potential biomarker for diagnosis of CRC followed by
further verification by molecular biology methods. Moreover, it was
shown that CA II might play a role as tumor suppressor gene in
cancer development and progression. In conclusion, our data may
contribute to a better understanding of the molecular mechanism of
CRC and provide insight into colorectal cancer treatment.
Acknowledgements
This study was supported by grants
from Chinese NSFC (31171370) and the National 973 Basic Research
Program of China (2011CB910703).
References
|
1.
|
Jemal A, Siegel R, Ward E, Hao Y, Xu J,
Murray T and Thun MJ: Cancer statistics. CA Cancer J Clin.
58:71–96. 2008.
|
|
2.
|
Woolf SH: The best screening test for
colorectal cancer - a personal choice. N Engl J Med. 343:1641–1643.
2000. View Article : Google Scholar : PubMed/NCBI
|
|
3.
|
Walsh JM and Terdiman JP: Colorectal
cancer screening: scientific review. JAMA. 289:1288–1296. 2003.
View Article : Google Scholar : PubMed/NCBI
|
|
4.
|
Jemal A, Murray T, Ward E, et al: Cancer
statistics, 2005. CA Cancer J Clin. 55:10–30. 2005. View Article : Google Scholar
|
|
5.
|
Phizicky E, Bastiaens PI, Zhu H, Snyder M
and Fields S: Protein analysis on a proteomic scale. Nature.
422:208–215. 2003. View Article : Google Scholar : PubMed/NCBI
|
|
6.
|
Alessandro R, Belluco C and Kohn EC:
Proteomic approaches in colon cancer: promising tools for new
cancer markers and drug target discovery. Clin Colorectal Cancer.
4:396–402. 2005. View Article : Google Scholar : PubMed/NCBI
|
|
7.
|
Nedelkov D, Kiernan UA, Niederkofler EE,
Tubbs KA and Nelson RW: Population proteomics: the concept,
attributes and potential for cancer biomarker research. Mol Cell
Proteomics. 5:1811–1818. 2006. View Article : Google Scholar : PubMed/NCBI
|
|
8.
|
Tyers M and Mann M: From genomics to
proteomics. Nature. 422:193–197. 2003. View Article : Google Scholar
|
|
9.
|
Tong A, Zhang H, Li Z, et al: Proteomic
analysis of liver cancer cells treated with suberonylanilide
hydroxamic acid. Cancer Chemother Pharmacol. 61:791–802. 2008.
View Article : Google Scholar : PubMed/NCBI
|
|
10.
|
Dahan L, Sadok A, Formento JL, Seitz JF
and Kovacic H: Modulation of cellular redox state underlies
antagonism between oxaliplatin and cetuximab in human colorectal
cancer cell lines. Br J Pharmacol. 158:610–620. 2009. View Article : Google Scholar : PubMed/NCBI
|
|
11.
|
Gilmour KM: Perspectives on carbonic
anhydrase. Comp Biochem Physiol A Mol Integr Physiol. 157:193–197.
2010. View Article : Google Scholar : PubMed/NCBI
|
|
12.
|
Yoshiura K, Nakaoka T, Nishishita T, et
al: Carbonic anhydrase II. A novel biomarker for gastrointestinal
stromal tumors. Mod Pathol. 23:743–750. 2010. View Article : Google Scholar
|
|
13.
|
Yoshiura K, Nakaoka T, Nishishita T, et
al: Carbonic anhydrase II is a tumor vessel endothelium-associated
antigen targeted by dendritic cell therapy. Clin Cancer Res.
11:8201–8207. 2005. View Article : Google Scholar : PubMed/NCBI
|
|
14.
|
Haapasalo J, Nordfors K, Järvelä S, et al:
Carbonic anhydrase II in the endothelium of glial tumors: a
potential target for therapy. Neurooncology. 9:308–313.
2007.PubMed/NCBI
|
|
15.
|
Korhonen K, Parkkila AK, Helen P, et al:
Carbonic anhydrases in meningiomas: association of endothelial
carbonic anhydrase II with aggressive tumor features. J Neurosurg.
111:472–477. 2009. View Article : Google Scholar : PubMed/NCBI
|
|
16.
|
Kivela AJ, Saarnio J, Karttunen TJ, et al:
Differential expression of cytoplasmic carbonic anhydrases, CA I
and II and membrane-associated isozymes, CA IX and XII, in normal
mucosa of large intestine and in colorectal tumors. Dig Dis Sci.
46:2179–2186. 2001. View Article : Google Scholar
|
|
17.
|
Kummola L, Hämäläinen JM, Kivelä J, Kivelä
AJ, Saarnio J, Karttunen T and Parkkila S: Expression of a novel
carbonic anhydrase, CA XIII, in normal and neoplastic colorectal
mucosa. BMC Cancer. 5:412005. View Article : Google Scholar : PubMed/NCBI
|
|
18.
|
Niemelä AM, Hynninen P, Mecklin JP, et al:
Carbonic anhydrase IX is highly expressed in hereditary
nonpolyposis colorectal cancer. Cancer Epidemiol Biomarkers Prev.
16:1760–1766. 2007.PubMed/NCBI
|
|
19.
|
Parks SK, Chiche J and Pouyssegur J: pH
control mechanisms of tumor survival and growth. J Cell Physiol.
226:299–308. 2011. View Article : Google Scholar : PubMed/NCBI
|
|
20.
|
Swietach P, Vaughan-Jones RD and Harris
AL: Regulation of tumor pH and the role of carbonic anhydrase 9.
Cancer Metastasis Rev. 26:299–310. 2007. View Article : Google Scholar : PubMed/NCBI
|
|
21.
|
Pastorekova S, Ratcliffe PJ and Pastorek
J: Molecular mechanisms of carbonic anhydrase IX-mediated pH
regulation under hypoxia. BJU Int. 101:8–15. 2008. View Article : Google Scholar : PubMed/NCBI
|
|
22.
|
Lv L, Li D, Zhao D, et al: Acetylation
targets the M2 isoform of pyruvate kinase for degradation through
chaperone-mediated autophagy and promotes tumor growth. Mol Cell.
42:719–730. 2011. View Article : Google Scholar : PubMed/NCBI
|
|
23.
|
Harris I, McCracken S and Mak TW: PKM2: a
gatekeeper between growth and survival. Cell Res. 22:447–449. 2012.
View Article : Google Scholar : PubMed/NCBI
|
|
24.
|
Kalluri R and Weinberg RA: The basics of
epithelial-mesenchymal transition. J Clin Invest. 119:1420–1428.
2009. View
Article : Google Scholar : PubMed/NCBI
|
|
25.
|
Thiery JP, Acloque H, Huang RY and Nieto
MA: Epithelialmesenchymal transitions in development and disease.
Cell. 139:871–890. 2009. View Article : Google Scholar : PubMed/NCBI
|
|
26.
|
Mallory JC, Crudden G, Oliva A, Saunders
C, Stromberg A and Craven RJ: A novel group of genes regulates
susceptibility to antineoplastic drugs in highly tumorigenic breast
cancer cells. Mol Pharmacol. 68:1747–1756. 2005.PubMed/NCBI
|