Introduction
Metastasis to distant organs is an acquired
characteristic of cancer cells (1)
and is a major cause of deaths from various human cancers.
Metastatic progression from the primary tumor site involves
multiple factors such as accumulation of genetic and epigenetic
events and aquiring ability to colonize at the distant host organs
(2). Although understanding the
biology of primary tumors have been a main strategy to treat
metastatic tumors, how these primary tumor cells evolve in the
course of spreading to the mestatic organ is poorly understood.
Lung and colorectal cancer are the top and third
most common cancers in the world, with over 1.6 million and 1.2
million new cases each year, respectively (3). Mutation status of EGFR, K-ras
and EML4-ALK are important factors determining therapeutic
regimens in non-small cell lung cancer (NSCLC) patients (4–5).
Colon cancer is a genetically well-characterized human cancer.
Since the multi-step carcinogenesis model was suggested, sequential
genetic alterations such as mutations of APC, K-ras,
Mismatch repair (MMRs), TP53 and loss of 18q have been
reported in colorectal cancers (6,7).
Genotype-phenotype correlations are also well-characterized in
colorectal cancer. Notwithstanding these well-established genetic
characteristics of colorectal cancer, the genetic mechanism causing
metastasis to other organs is unclear. Liver and lung are the most
common metastatic sites from colorectal cancer. Although metastasis
to the lung from different primary tumors is a frequent event
considering its dense connectivity with lymph nodes and blood
vessels and its physical location, genetic alterations and
underlying mechanisms would also affect its frequency and
biological characteristics.
In this study, we describe a comprehensive genomic
analysis of a metastatic colon cancer to the lung. Mutation
analysis targeting whole exome is becoming prevalent and several
papers describing somatic mutations at exome level have been
published in primary lung and colorectal cancers (8–10).
Nontheless, mutation or genetic information underlying metastatic
colorectal cancer to the lung is very limited. To gain insights
into genetic alterations associated with lung metastasis from colon
cancer, we performed whole exome sequencing and genome-wide
expression analysis in a patient with metastatic colon cancer to
the lung. Among the identified mutation candidates, we chose 16
mutations for further validation using Ion Torrent PGM customized
panel. Our pathway analyses identified that most of mutations were
related with lung caner pathogenesis rather than a primary colon
cancer, while gene expression signatures of the metastatic tumor
were more correlated with the primary colon cancer. Undiscovered
potential tumor supressor and oncogenes were also identified by
combined exome sequencing and copy number analysis.
Materials and methods
Patient information
Samples were collected under the IRB approval
(11-06107) granted by the CHR of the University of California San
Francisco (UCSF) along with written informed consent from the
patient. The tumor and matched normal lung tissue studied came from
a 74-year-old Asian female never-smoker who had colorectal cancer 4
years prior to this incident. She visited the hospital for chest
discomfort. A chest X-ray revealed a mass-like lesion in the right
lung. Chest computed tomography (CT) scan showed a 2 cm sized tumor
in the right upper lobe. A positron emission tomography (PET) scan
showed hypermetabolic fluorodeoxyglucose uptake with no evidence of
other metastasis. She was suspected to have a lung metastasis,
because of her history of colon cancer. She underwent a wedge
resection of the right upper lobe via thoracotomy and had an
uneventful recovery after the operation. The pathologic examination
confirmed the lesion was metastatic adenocarcinoma originating from
the primary colon cancer. She lived for 1 1/2 years after the lung
metastasis operation.
Whole exome sequencing
Whole exome sequencing was done on SOLiD 5500 (Life
Technologies). Samples were prepared according to protocols
suggested by the manufacturer. Fragment library preparation began
with 3 μg DNA and sheared with the Covaris S220 system.
Resulting DNA fragments were end repaired, size selected with
Agencourt Ampure XP reagent, dA-tailed, adaptor and barcode
ligated, and then amplified with 6 PCR cycles. The library was then
quantified with Agilent Technologies High Sensitivity DNA chip. A
total of 500 ng of DNA was used to capture the exome regions using
TargetSeq Exome Enrichment kit, for about 72 h. Exome DNA was
amplified and then quantified with the SOLiD Library TaqMan
Quantitation kit. The final exome library was diluted to 500 pM,
templated to beads, amplified through emulsion PCR and enriched
using the SOLiD EZ Bead Emulsifier, Amplifier and Enricher. The
resulting libraries were then loaded onto the Flow Chip with a
total of 6 multiplexed samples in 6 lanes.
Ion Torrent AmpliSeq sequencing for
validation
Sixteen mutation candidates from the exome
sequencing were validated by deep sequencing (more than 1,000 x
coverage) using the Ion Torrent PGM AmpliSeq Custom Panel for the
selected targets. In brief, the 200 bp Standard DNA option was used
for the AmpliSeq primer design. Sample DNA was diluted to a
concentration of 10 ng/μl. A total of 1 μl of the
diluted DNA was used for amplicon library preparation according to
the Ion Torrent protocol. Target sequences were amplified using the
custom primers, followed by a partial digestion of the primers.
Adapters and barcodes were ligated to the amplicons and purified
using Agencourt AMPure XP reagent. The library was quantified by
qPCR using the Ion Library Quantitation kit according to the
protocol. The libraries were combined, templated onto beads and run
through emulsion PCR using the OneTouch2 and ES machines. Samples
were loaded into the 318 chips and run on the Ion Torrent PGM.
Microarray gene expression analysis
We also measured the mRNA expression level of
samples using Affymetrix GeneTitan Gene ST 1.1 array. The detailed
protocol has been previously described (11). In short, total RNA was extracted
from the matched tumor and normal tissues, amplified into cRNA, and
then made into cDNA. The cDNA was then fragmented and labeled. The
labeled cDNA was added into the hybridization cocktail. The samples
were then put onto hybridization trays and loaded into the
Affymetrix GeneTitan MC for hybridization, washing and scanning.
The Log2-scale expression data were extracted using the built-in
Robust Multi-array Average (RMA) algorithm in the Affymetrix
software (12).
Data analysis: somatic mutation
detections
For the whole exome sequencing performed by SOLiD
5500, the color space raw data (XSQ) were converted to sequences
and aligned to reference human genome hg19 using LifeScope Genomic
Analysis Software v2.5.1, creating a BAM file for each barcode in
each lane. The paired-end targeted resequencing workflow of the
software was used for the task, which also includes the DiBayes
algorithm for Single Nucleotide Variation (SNV) detection. In the
tumor tissue, 40,314 SNPs and 2,287 InDels were called, of which
37,456 and 1,990 were in concordance with dbSNP132 (92.91 and
80.03%, respectively). The transition/transversion ratio of the
SNPs in the tumor was 2.60. In the adjacent normal tissue, 41,738
SNPs and 2,570 InDels were called, of which 39,069 and 2,096 were
in concordance with dbSNP132 (93.61 and 81.56%, respectively). The
transition/transversion ratio of the SNPs in the matched normal was
2.61.
BAM files for each barcode and each lane were merged
into a single BAM file for every sample (the tumor and the matched
normal) using Picard 1.87 (http://picard.sourceforge.net). We used Strelka
(13) and MuTect (14) for small somatic mutation
detections. Both algorithms adopt a Bayesian probability model
comparing the tumor with its matched normal data, taken into
consideration that tumor samples are often heterogeneous and
impure. Default configurations were kept when using both software,
e.g., prior probability of somatic mutation is 10−6. The
mutation calls were output in a VCF (variant calling format) file.
Each variant was annotated by ANNOVAR, which annotates the gene
symbol, chromosome position and the type of variant (e.g.,
synonymous, missense, nonsense, etc.) (15).
Ion Torrent PGM generated fastq files were aligned
to hg19 using the MAP2 alignment algorithm of Torrent Mapping
Alignment Program (TMAP 3.4.0). The number of reference and novel
allele counts for the 16 sites were tallied using the Samtools
0.1.18 mpileup function (16).
Copy number analysis
We used ExomeCNV, an R package, to conduct a copy
number variation (CNV) analysis to the exome sequencing data
(17). ExomeCNV infers copy number
alteration based on the normalized Log2 ratio of the depth of
coverage between the tumor and its matched normal tissue (17). The highest novel-to-reference
(i.e., mutant to wild-type) allele ratio in our mutation data was
about 1:2. If we assume that a mutation occurs in all tumor cells
and none in normal cells, then in the tumor tissue, we expect a
50-50 ratio of novel/reference counts for heterozygous mutations.
The extra reference counts would come from normal cell
contamination, contributing for a total of 1/3 of the coverage.
Hence, we estimated a normal contamination of 1/3 in this tumor
sample. The estimated normal contamination value 0.3 was applied to
the copy number analysis.
Copy number of the JAZF1 gene, identified as
being amplified in whole exome sequencing data was chosen for
further individual validation by TaqMan Copy Number assay (Life
Technologies). Genomic DNAs from matched tumor and normal were
amplified in ABI 7900HT according to the manufacturer’s instruction
and analyzed by copy number analysis algorithm as previously
described (18). Copy number of
RNase P gene was simultaneously analyzed to use as an endogenous
normalization contol. Additional genomic DNAs from 8 matched
primary lung tumors and normal tissues were included.
Results
Identification of somatic mutations: a
comparison of Strelka and MuTect
To retrieve somatic mutation calls from the whole
exome sequencing data, Strelka (13) and MuTect (14) software was used. Strelka is a more
stringent somatic mutation caller, identifying a total of 310
somatic variants including 135 non-synonymous variants. MuTect is
more permissive, having identified a total of 7,341 somatic
variants including 1,393 non-synonymous variants. Among the 135
identified non-synonymous candidate sites by Strelka, 100 of those
non-synonymous variants were overlapped with MuTect’s calls (74.1%
of concordance rate). Among the 310 total Strelka identified
candidate sites, 221 of them were in common with MuTect’s calls
(71.3% of the Strelka findings). On the other hand, well under 10%
of MuTect calls were in common with Strelka. The mutation calls in
common were much more likely to be true mutations, with an average
novel allele (i.e., mutant) frequency of nearly 0.30, and novel
allele counts of about 15. There was also no statistically
significant difference between the variant and non-synonymous
variants.
Pathway analysis using 71 high-confidence
somatic mutations
Among 135 non-synonymous somatic mutation calls by
Strelka, there were 70 mutation candidates with a somatic quality
score (QSS) greater than 30, and a mutant allele frequency greater
than 10% (Table I). We defined
those 70 mutation calls as high-confidence mutations. In addition
to those 70 high-confidence mutations, JAZF1 was a validated
mutation with a QSS of 27 and mutant allele frequency of 25.2%, so
a total of 71 genes were used for pathway analysis (Ingenuity
Pathway Analysis, IPA) to get a general overview of their genetic
pathways and functions (Table I).
Perhaps unsurprisingly, due to the fact that those are somatic
mutations from a metastatic colon cancer to the lung, the top two
‘Diseases and Disorders Networks’ were cancer and respiratory
disease. The top 3 functional networks within Cancer were lung
cancer (p=1.3×10⁻⁶, 35 genes), lung adenocarcinoma
(p=5.4×10⁻⁶), and carcinoma in lung
(p=7.7×10⁻⁶). Colon-related cancer network was not
included in the top 10 networks (Table
II).
 | Table I.Summary of 71 high-confidence
mutations from whole exome sequencing. |
Table I.
Summary of 71 high-confidence
mutations from whole exome sequencing.
| Gene | Chr | Exon | Amino acid
change | Nucleotide
change | QSS | Frequency | Copy no. | Exp-T | Exp-N |
|---|
| EIF4G3 | chr1 | exon9 | I335V | c.1003A>G | 118 | 0.34 | 2 | 6.81 | 6.66 |
| C1orf173 | chr1 | exon12 | G689R | c.2065G>A | 140 | 0.32 | 2 | 2.05 | 2.3 |
| BCAN | chr1 | exon6 | T287M | c.860C>T | 31 | 0.3 | 2 | 2.29 | 2.5 |
| SLC9C2 | chr1 | exon14 | K552R | c.1655A>G | 129 | 0.51 | 2 | 0 | 0 |
| KLHL12 | chr1 | exon9 | R416Q | c.1247G>A | 52 | 0.3 | 2 | 5.58 | 5.29 |
| ZNF512 | chr2 | exon14 | R507W | c.1519C>T | 39 | 0.35 | 1 | 5.17 | 5.47 |
| THADA | chr2 | exon36 | V1752M | c.5254G>A | 37 | 0.3 | 2 | 6.22 | 6.53 |
| C2orf78 | chr2 | exon3 | P860T | c.2578C>A | 35 | 0.28 | 2 | 2.83 | 2.41 |
| LONRF2 | chr2 | exon12 | R743W | c.2227C>T | 34 | 0.38 | 2 | 2.4 | 3.38 |
| LRP1B | chr2 | exon75 | E3802V | c.11405A>T | 35 | 0.3 | 3 | 2.21 | 2.1 |
| SCN2A | chr2 | exon27 | R1902C | c.5704C>T | 96 | 0.28 | 2 | 1.87 | 1.85 |
| SCN7A | chr2 | exon6 | I194R | c.581C>G | 68 | 0.29 | 2 | 3.36 | 7.28 |
| SCRN3 | chr2 | exon8 | L389F | c.1165C>T | 108 | 0.31 | 2 | 4.89 | 5.14 |
| COL4A3 | chr2 | exon24 | A507S | c.1519G>T | 44 | 0.31 | 2 | 3.21 | 5.16 |
| CNTN4 | chr3 | exon17 | G620R | c.1858G>A | 158 | 0.76 | 2 | 2.28 | 3.29 |
| ITIH4 | chr3 | exon6 | R214W | c.640C>T | 53 | 0.33 | 2 | 3 | 3.53 |
| MYLK | chr3 | exon12 | A524T | c.1570G>A | 81 | 0.33 | 2 | 5.08 | 7.64 |
| CPNE4 | chr3 | exon9 | K269T | c.806A>C | 80 | 0.32 | 3 | 2.47 | 2.28 |
| EPHB1 | chr3 | exon11 | R691Q | c.2072G>A | 145 | 0.45 | 2 | 3.34 | 2.93 |
| RBPJ | chr4 | exon12 | E478K | c.1432G>A | 61 | 0.24 | 2 | 6.62 | 6.78 |
| GRID2 | chr4 | exon11 | T601M | c.1802C>T | 120 | 0.46 | 2 | 2.01 | 2.11 |
| ADCY2 | chr5 | exon17 | T714A | c.2140A>G | 98 | 0.47 | 2 | 3.34 | 3.33 |
| RAD17 | chr5 | exon6 | M200T | c.599T>C | 72 | 0.26 | 2 | 4.79 | 4.91 |
| APC | chr5 | exon16 | Q767X | c.2299C>T | 39 | 0.31 | 2 | 4.57 | 5.02 |
| SEMA6A | chr5 | exon3 | H44R | c.131A>G | 79 | 0.2 | 2 | 3.94 | 5.8 |
| ATP10B | chr5 | exon26 | E1360K | c.4078G>A | 46 | 0.31 | 2 | 5.93 | 3.3 |
| SERPINB6 | chr6 | exon7 | P239L | c.716C>T | 50 | 0.45 | 2 | 6.9 | 7.2 |
| ROS1 | chr6 | exon40 | F2103S | c.6308T>C | 37 | 0.35 | 2 | 6.47 | 6.65 |
| TMEM244 | chr6 | exon5 | L126M | c.376T>A | 94 | 0.27 | 3 | 0 | 0 |
| SOSTDC1 | chr7 | exon1 | I31S | c.92T>G | 47 | 0.29 | 3 | 1.97 | 3.53 |
| DNAH11 | chr7 | exon68 | R3663H | c.10988G>A | 35 | 0.28 | 3 | 2.64 | 2.95 |
| JAZF1 | chr7 | exon3 | R71Q | c.212G>A | 27 | 0.19 | 3 | 4.95 | 5.56 |
| CNOT7 | chr8 | exon6 | R220W | c.658C>T | 58 | 0.64 | 1 | 7.47 | 7.64 |
| PDE7A | chr8 | exon8 | L228M | c.682C>A | 51 | 0.27 | 3 | 3.75 | 4.59 |
| ENY2 | chr8 | exon4 | D65G | c.194A>G | 42 | 0.23 | 3 | 7.4 | 6.71 |
| SLC24A2 | chr9 | exon1 | I124N | c.371T>A | 34 | 0.27 | 2 | 2.5 | 2.47 |
| RORB | chr9 | exon4 | V146I | c.436G>A | 40 | 0.46 | 2 | 2.67 | 2.92 |
| TSC1 | chr9 | exon5 | L120F | c.358C>T | 33 | 0.32 | 2 | 5.34 | 5.69 |
| ZNF438 | chr10 | exon7 | Y582C | c.1745A>G | 96 | 0.34 | 2 | 3.52 | 4.17 |
| TDRD1 | chr10 | exon20 | T933M | c.2798C>T | 42 | 0.33 | 2 | 2.22 | 2.24 |
| TTC40 | chr10 | exon9 | A311V | c.932C>T | 54 | 0.45 | 2 | 0 | 0 |
| OR52K2 | chr11 | exon1 | Y254X | c.762C>A | 108 | 0.3 | 2 | 2.19 | 2.15 |
| ARHGEF17 | chr11 | exon19 | V1903M | c.5707G>A | 30 | 0.19 | 2 | 4.52 | 5.76 |
| OR10G9 | chr11 | exon1 | V7M | c.19G>A | 115 | 0.29 | 2 | 2.29 | 2.17 |
| CHD4 | chr12 | exon22 | G1098D | c.3293G>A | 40 | 0.25 | 2 | 7.8 | 7.44 |
| LRP6 | chr12 | exon13 | T933M | c.2798C>T | 44 | 0.35 | 2 | 6.42 | 7.02 |
| KRAS | chr12 | exon2 | G12A | c.35G>C | 57 | 0.24 | 2 | 6.15 | 5.89 |
| KRT71 | chr12 | exon5 | R305C | c.913C>T | 60 | 0.18 | 2 | 3.41 | 3.05 |
| HSP90B1 | chr12 | exon10 | R414H | c.1241G>A | 219 | 0.35 | 2 | 10.1 | 9.68 |
| MYCBP2 | chr13 | exon6 | Y377H | c.1129T>C | 112 | 0.29 | 3 | 6.46 | 6.96 |
| OR4M1 | chr14 | exon1 | C141F | c.422G>T | 189 | 0.24 | 1 | 1.75 | 1.8 |
| SAMD4A | chr14 | exon2 | S112F | c.335C>T | 93 | 0.52 | 1 | 4.17 | 5.77 |
| GNB5 | chr15 | exon5 | C159Y | c.476G>A | 105 | 0.58 | 2 | 4.32 | 4.67 |
| VWA9 | chr15 | exon10 | R379C | c.1135C>T | 150 | 0.63 | 2 | 0 | 0 |
| ADCY9 | chr16 | exon10 | S948L | c.2843C>T | 49 | 0.2 | 2 | 4.94 | 6.48 |
| SRCAP | chr16 | exon16 | G813D | c.2438G>A | 69 | 0.26 | 2 | 6.06 | 5.99 |
| ADAMTS18 | chr16 | exon3 | S154P | c.460T>C | 31 | 0.17 | 2 | 2.45 | 3.54 |
| SLC5A10 | chr17 | exon5 | R127H | c.380G>A | 63 | 0.42 | 1 | 3.86 | 3.43 |
| MYOM1 | chr18 | exon30 | K1393N | c.4179A>T | 41 | 0.39 | 1 | 2.45 | 2.68 |
| ARMC6 | chr19 | exon5 | R277C | c.829C>T | 36 | 0.32 | 2 | 5.45 | 4.83 |
| RYR1 | chr19 | exon1 | A4T | c.10G>A | 36 | 0.42 | 2 | 2.75 | 2.95 |
| ATP1A3 | chr19 | exon9 | A379T | c.1135G>A | 114 | 0.35 | 1 | 3.39 | 2.65 |
| ZNF285 | chr19 | exon4 | P455Q | c.1364C>A | 36 | 0.12 | 2 | 2.49 | 2.51 |
| MYBPC2 | chr19 | exon12 | D415G | c.1244A>G | 30 | 0.19 | 2 | 3.27 | 2.41 |
| ACTR5 | chr20 | exon4 | R313W | c.937C>T | 75 | 0.44 | 3 | 5.22 | 4.2 |
| TMPRSS15 | chr21 | exon22 | R871X | c.2611C>T | 84 | 0.34 | 1 | 1.51 | 1.61 |
| DEPDC5 | chr22 | exon28 | T864M | c. 2591C>T | 58 | 0.3 | 2 | 4.99 | 5.04 |
| GPKOW | chrX | exon2 | E68D | c.204A>C | 54 | 0.24 | 2 | 6.69 | 5.76 |
| TENM1 | chrX | exon21 | A1242V | c.3725C>T | 51 | 0.2 | 2 | 0 | 0 |
| SLITRK4 | chrX | exon2 | S34X | c.101C>A | 64 | 0.27 | 2 | 3.02 | 2.92 |
| HDAC6 | chrX | exon11 | F.S. | c.918_919del | 31 | 0.32 | 2 | 5.31 | 4.93 |
| Table II.Ingenuity pathway analysis (IPA) of
the high-confidence mutations. |
Table II.
Ingenuity pathway analysis (IPA) of
the high-confidence mutations.
| Rank | Functions
annotation | P-value | Genes |
|---|
|
| 1 | Lung cancer |
1.3×10⁻⁶ | ADCY2, ADCY9, APC,
ATP1A3, BCAN, C1orf173, C2orf78, CHD4, CNTN4, DEPDC5, DNAH11,
GPKOW, GRID2, HDAC6, HSP90B1, KRAS, LRP1B, MYBPC2, MYCBP2, MYLK,
OR10G9, RORB, RYR1, SAMD4A, SCN2A, SCN7A, SEMA6A, SLC24A2, SLC9C2,
SRCAP, TENM1, THADA, TSC1, ZNF285, ZNF438 |
|
| Rank | Ingenuity canonical
pathways | P-value | Genes |
|
| 1 | Phospholipase C
signaling |
2.2×10⁻⁴ | HDAC6, ADCY9,
ADCY2, GNB5, ARHGEF17, KRAS |
| 2 | Molecular
mechanisms of cancer |
2.5×10⁻⁴ | ADCY9, ADCY2, LRP6,
RBPJ, ARHGEF17, KRAS, APC |
| 3 | Colorectal cancer
metastasis signaling |
2.6×10⁻⁴ | ADCY9, ADCY2, LRP6,
GNB5, KRAS, APC |
The top 3 IPA Canonical Networks were ‘Phospholipase
C Signaling’ (a total of 263 genes in this network, 6 of which are
our somatic mutation submissions, or 6/263, p=2.2×10⁻⁴),
‘Molecular Mechanisms of Cancer’ (7/381, p=2.5×10⁻⁴),
and ‘Colorectal Cancer Metastasis Signaling’ (6/262,
p=2.6×10⁻⁴) (Table II).
Knowing this tumor was a metastatic colon cancer, the Colorectal
Cancer Metastasis Signaling network was of particular interest. The
6 genes (with somatic mutations in our sample) involved in
Colorectal Cancer Metastasis Signaling were ADCY2, ADCY9, APC,
GNB5, K-ras and LRP6. Aside from APC and
K-ras which are known cancer markers, ADCY2, ADCY9,
GNB5 and LRP6 also appear in Phospholipase C Signaling
and Molecular Mechanisms of Cancer networks, indicating their
potential role in colon cancer metastasis to the lung.
Mutation validation by targeted high
coverage deep sequencing
We selected 16 candidates for deep sequencing
validation by Ion Torrent PGM. Out of 16 candidates, 9 were either
kinases or genes identified in the COSMIC (Catalog of Somatic
Mutations in Cancer) Cancer Gene Census (http://cancer.sanger.ac.uk/cancergenome/projects/census/).
For the remaining 7, all but 1 mutation calls were identified by
both Strelka and MuTect.
Out of 16 mutation candidates, 15 were sucessfully
amplified by targeted ampliseq panel (Ion Torrent PGM) and 13 out
of 15 (87%) were validated as true mutations (Table III). For the validated mutations,
the mutant allele counts ranged from several hundreds to over a
thousand in the tumor, and less than 10 in the matched normal
tissue (average coverage >2,000X). The 13 validated mutations
include two mutations in APC and K-ras, well-known
genes frequently mutated in colon cancers, three nonsense mutations
in OR52K2, TMPRSS15, and SLITRK4, one frameshift
deletion in HDAC6, and seven missense mutations in
EIF4G3, MYLK, EPHB1, ROS1, JAZF1, TSC1 and
C1orf173.
| Table III.The mutations validated by customized
ultra-high coverage sequencing. |
Table III.
The mutations validated by customized
ultra-high coverage sequencing.
| Gene symbol | Nucleotide
change | Amino acid
change | Mut/wild counts
exome
| Mut/wild counts PGM
| Microarray
expression
| QSS | CNV |
|---|
| T | N | T | N | T | N |
|---|
| EIF4G3 | c.1003A>G | I335V | 30/58 | 0/108 | 778/1,963 | 5/2,536 | 6.81 | 6.66 | 118 | 2 |
| C1orf173 | c.2065G>A | G689R | 36/76 | 1/144 | 833/1,430 | 7/2,063 | 2.05 | 2.30 | 140 | 2 |
| MYLK | c.1570G>A | A524T | 22/44 | 0/72 | 869/1,652 | 6/2,579 | 5.08 | 7.64 | 81 | 2 |
| EPHB1 | c.2072G>A | R691Q | 35/43 | 0/91 | 976/1,714 | 2/2,507 | 3.34 | 2.93 | 145 | 2 |
| APC | c.2299C>T | Q767X | 8/18 | 0/37 | 580/1,294 | 3/1,622 | 4.57 | 5.02 | 39 | 2 |
| ROS1 | c.6308T>C | F2103S | 8/15 | 0/32 | 492/1,071 | 0/1,386 | 6.47 | 6.65 | 37 | 2 |
| JAZF1 | c.212G>A | R71Q | 6/26 | 0/39 | 587/1,738 | 7/1,894 | 4.95 | 5.56 | 27 | 3 |
| TSC1 | c.358T>T | L120F | 8/17 | 0/30 | 504/983 | 2/1,302 | 5.34 | 5.69 | 33 | 2 |
| OR52K2 | c.762C>A | Y254X | 27/64 | 1/129 | 828/1,765 | 5/2,420 | 2.19 | 2.15 | 108 | 2 |
| KRAS | c.35G>C | G12A | 12/37 | 0/83 | 536/1,019 | 2/1,588 | 6.15 | 5.89 | 57 | 2 |
| TMPRSS15 | c.2611C>T | R871X | 16/31 | 1/93 | 353/1,115 | 2/1,962 | 1.51 | 1.61 | 84 | 1 |
| SLITRK4 | c.101C>A | S34X | 22/61 | 1/96 | 1,102/2,656 | 8/3,236 | 3.02 | 2.92 | 64 | 2 |
| HDAC6 | c.918_919del | F.S. | 7/15 | 0/33 | 864/1,731 | 2/2,340 | 5.31 | 4.93 | 31 | 2 |
Copy number analysis of genes mutated in
metastatic colon cancer to the lung
We performed a copy number analysis using whole
exome sequencing data in order to have additional information on
the genes mutated in metastastic colon cancer to the lung. The Copy
Number Variation (CNV) calls for the 71 high-confidence and 13
validated mutation genes are shown in Tables I and III, respectively. Among the genes mutated
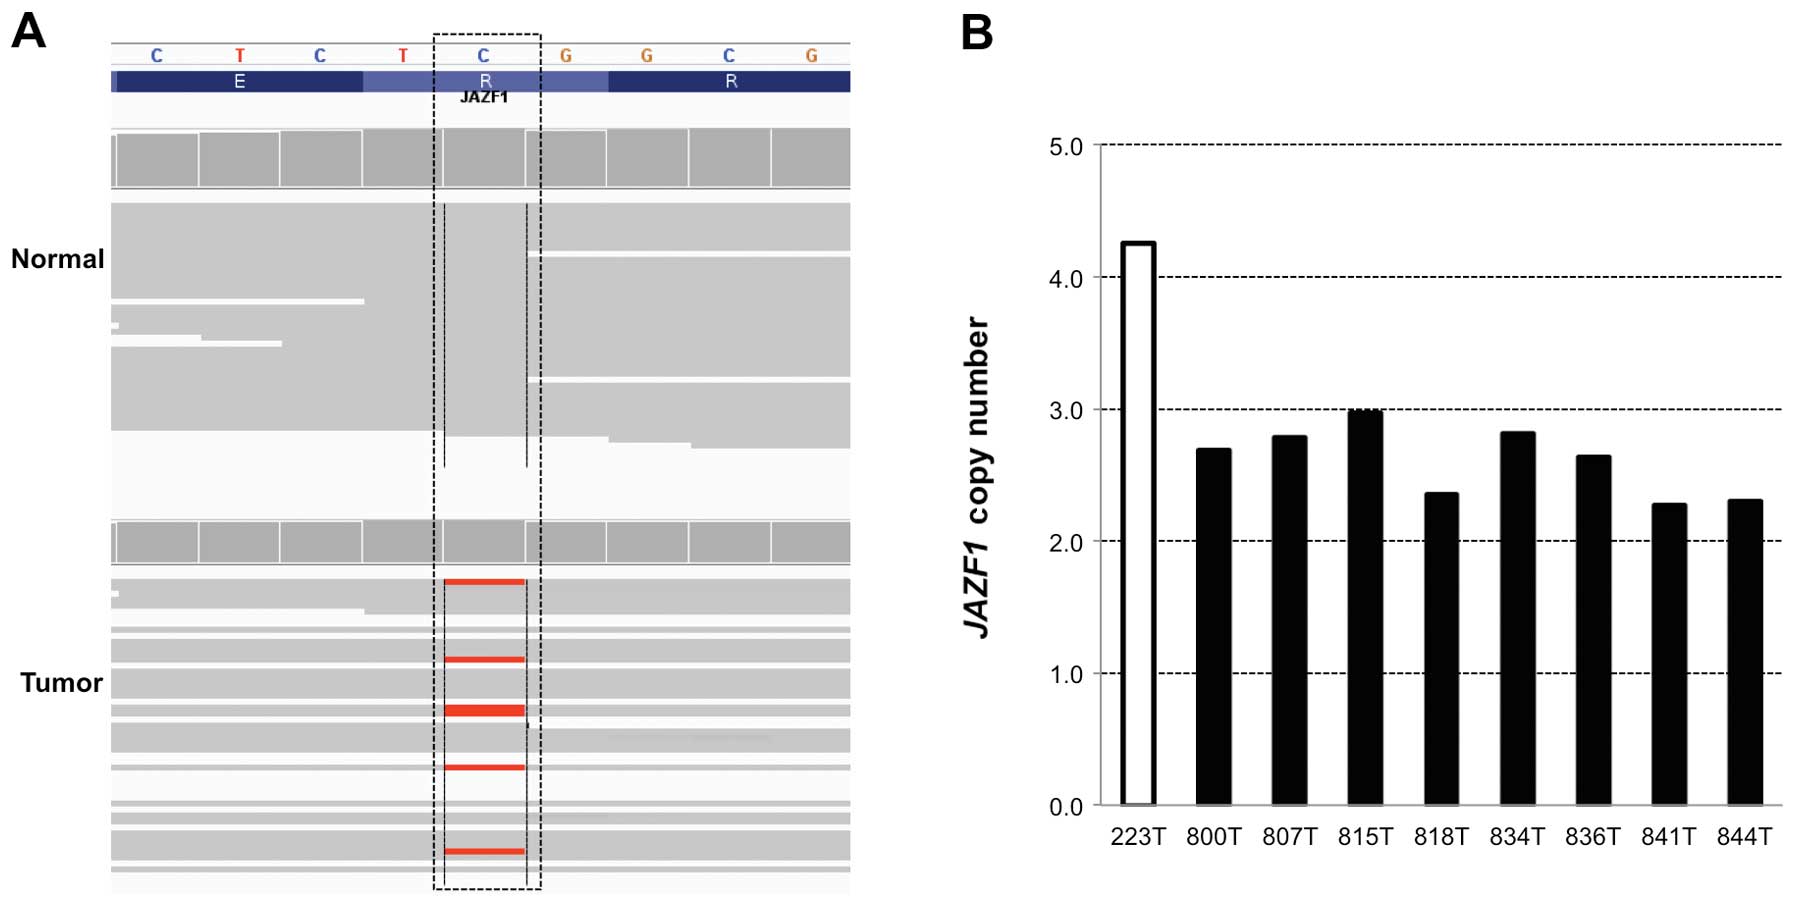
and either amplified or deleted, copy number of JAZF1
harboring a missense mutation and being amplified in a metastatic
colon tumor was further validated by TaqMan copy number assay. In
accordance with the CNV information from whole exome sequencing
data, the validation assay confirmed that JAZF1 was highly
amplified in a metastastic colon cancer to the lung (Fig. 1).
Genes differentially expressed in
metastatic colon cancer to the lung and their network analysis
Of more than 20,000 genes in the Gene ST 1.1 array,
3,231 genes showed 2-fold differential expression between the
metastatic tumor and the matched normal tissues. There were 786
genes with at least a 4-fold difference, and 247 genes with at
least an 8-fold difference (Table
IV). We entered these genes in 3 separate IPA analyses
(analysis with the 3,231, 786 and 247 genes, respectively). In each
case, the top ‘Disease and Disorder Network’ was Cancer category.
Interestingly, unlike the networks of mutation signatures earlier
described, top-ranked expression signatures of this metastatic
tumor, in each analysis, was Gastrointestinal Disease followed by
Respiratory Disease in the Disease and Disorder Network. Within the
Cancer network, colorectal cancer, intestinal cancer and digestive
tumor all rank above lung cancer. This analysis suggested that
expression profiles of metastatic colon cancer to the lung
represents more their primary tumor site (colon) retaining its
initial characteristics of tumor development.
| Table IV.A total of 247 genes with over 8-fold
differential expression between normal and metastatic colon cancer
to the lung. |
Table IV.
A total of 247 genes with over 8-fold
differential expression between normal and metastatic colon cancer
to the lung.
| No. | Probe set ID | Gene | N | T | T-N |
|---|
| 1 | 7969288 | OLFM4 | 3.2 | 11.3 | 8.1 |
| 2 | 8029086 | CEACAM5 | 2.9 | 10.7 | 7.8 |
| 3 | 8151795 | CDH17 | 2.0 | 9.5 | 7.6 |
| 4 | 8135033 | MUC12 | 3.0 | 10.2 | 7.2 |
| 5 | 7979658 | GPX2 | 2.7 | 9.6 | 7.0 |
| 6 | 8173979 | NOX1 | 2.4 | 9.2 | 6.9 |
| 7 | 8090180 | MUC13 | 2.2 | 9.0 | 6.8 |
| 8 | 8053654 | FABP1 | 1.8 | 8.5 | 6.7 |
| 9 | 8114964 | SPINK1 | 2.3 | 9.0 | 6.7 |
| 10 | 8036591 | LGALS4 | 3.5 | 10.0 | 6.6 |
| 11 | 7951297 | MMP12 | 2.1 | 8.5 | 6.4 |
| 12 | 8135031 | MUC12 | 3.8 | 10.0 | 6.2 |
| 13 | 8151730 | CALB1 | 1.8 | 8.0 | 6.1 |
| 14 | 7944164 | TMPRSS4 | 2.6 | 8.5 | 5.8 |
| 15 | 8015124 | KRT20 | 2.6 | 8.1 | 5.6 |
| 16 | 8048319 | VIL1 | 2.6 | 8.2 | 5.5 |
| 17 | 8173869 | POF1B | 2.6 | 8.1 | 5.5 |
| 18 | 8135048 | MUC17 | 2.4 | 7.8 | 5.4 |
| 19 | 7928766 | C10orf99 | 2.7 | 8.1 | 5.4 |
| 20 | 8037053 | CEACAM7 | 2.1 | 7.5 | 5.4 |
| 21 | 8026490 | UCA1 | 2.3 | 7.7 | 5.4 |
| 22 | 8142171 | SLC26A3 | 1.5 | 6.8 | 5.3 |
| 23 | 7984001 | GCNT3 | 3.1 | 8.3 | 5.2 |
| 24 | 7961413 | C12orf36 | 1.8 | 6.8 | 5.0 |
| 25 | 7915472 | SLC2A1 | 5.3 | 10.3 | 5.0 |
| 26 | 8063590 | PCK1 | 2.2 | 7.2 | 4.9 |
| 27 | 8062823 | HNF4A | 3.0 | 7.9 | 4.9 |
| 28 | 8132270 | NPSR1 | 2.6 | 7.4 | 4.9 |
| 29 | 8120088 | MEP1A | 2.2 | 7.0 | 4.8 |
| 30 | 8178070 | LY6G6D | 2.5 | 7.3 | 4.8 |
| 31 | 8179309 | LY6G6D | 2.5 | 7.3 | 4.8 |
| 32 | 7934898 | ANKRD22 | 2.8 | 7.6 | 4.7 |
| 33 | 8092726 | CLDN1 | 3.9 | 8.6 | 4.7 |
| 34 | 7962212 | PKP2 | 3.7 | 8.4 | 4.7 |
| 35 | 8162884 | ALDOB | 2.2 | 6.8 | 4.7 |
| 36 | 8070567 | TFF3 | 4.7 | 9.3 | 4.7 |
| 37 | 7983239 | CKMT1A | 3.5 | 8.2 | 4.6 |
| 38 | 7983256 | CKMT1A | 3.5 | 8.2 | 4.6 |
| 39 | 8038683 | KLK6 | 2.3 | 7.0 | 4.6 |
| 40 | 7901175 | TSPAN1 | 4.8 | 9.4 | 4.6 |
| 41 | 7918694 | BCL2L15 | 1.9 | 6.5 | 4.6 |
| 42 | 8064904 | FERMT1 | 2.2 | 6.8 | 4.6 |
| 43 | 7961455 | GUCY2C | 2.1 | 6.6 | 4.5 |
| 44 | 8081488 | HHLA2 | 2.5 | 7.0 | 4.5 |
| 45 | 8115623 | ATP10B | 3.5 | 8.0 | 4.5 |
| 46 | 8015133 | KRT23 | 2.8 | 7.2 | 4.5 |
| 47 | 8061579 | TPX2 | 2.8 | 7.3 | 4.4 |
| 48 | 8171449 | ACE2 | 3.3 | 7.7 | 4.4 |
| 49 | 7956229 | SLC39A5 | 2.6 | 7.0 | 4.4 |
| 50 | 7922029 | GPA33 | 4.1 | 8.5 | 4.4 |
| 51 | 8175747 | MAGEA3 | 2.3 | 6.7 | 4.4 |
| 52 | 8048864 | CCL20 | 2.0 | 6.4 | 4.3 |
| 53 | 8177222 | CD24 | 4.6 | 8.9 | 4.3 |
| 54 | 8099476 | PROM1 | 2.4 | 6.6 | 4.3 |
| 55 | 8124527 | HIST1H1B | 4.5 | 8.8 | 4.3 |
| 56 | 8140367 | CCL24 | 3.4 | 7.7 | 4.2 |
| 57 | 8058091 | SATB2 | 4.0 | 8.2 | 4.2 |
| 58 | 8122202 | MYB | 3.1 | 7.3 | 4.2 |
| 59 | 7912659 | AGMAT | 2.7 | 6.9 | 4.2 |
| 60 | 7970810 | SLC7A1 | 4.7 | 8.9 | 4.2 |
| 61 | 7997962 | DPEP1 | 5.6 | 9.8 | 4.2 |
| 62 | 8016994 | RNF43 | 3.8 | 7.9 | 4.1 |
| 63 | 7945169 | TMEM45B | 5.3 | 9.4 | 4.1 |
| 64 | 8140140 | CLDN3 | 4.3 | 8.4 | 4.1 |
| 65 | 7964927 | TSPAN8 | 6.2 | 10.3 | 4.1 |
| 66 | 8020762 | DSG3 | 1.8 | 5.9 | 4.1 |
| 67 | 8006865 | PPP1R1B | 3.9 | 7.9 | 4.1 |
| 68 | 8001082 | SLC6A8 | 4.0 | 8.0 | 4.0 |
| 69 | 7995292 | SLC6A8 | 4.3 | 8.3 | 4.0 |
| 70 | 8158167 | LCN2 | 3.0 | 7.0 | 4.0 |
| 71 | 7905918 | EFNA3 | 2.7 | 6.7 | 4.0 |
| 72 | 8170580 | CSAG2 | 2.2 | 6.2 | 4.0 |
| 73 | 8175710 | CSAG2 | 2.2 | 6.2 | 4.0 |
| 74 | 8166723 | XK | 2.3 | 6.3 | 4.0 |
| 75 | 8139640 | DDC | 2.9 | 6.8 | 4.0 |
| 76 | 7898809 | EPHB2 | 4.7 | 8.7 | 4.0 |
| 77 | 7946903 | USH1C | 2.4 | 6.4 | 3.9 |
| 78 | 8132031 | PRR15 | 4.3 | 8.2 | 3.9 |
| 79 | 7983650 | SLC27A2 | 2.2 | 6.1 | 3.9 |
| 80 | 8088425 | FAM3D | 3.4 | 7.3 | 3.9 |
| 81 | 8037205 | CEACAM1 | 3.4 | 7.3 | 3.9 |
| 82 | 8151032 | GGH | 4.4 | 8.3 | 3.9 |
| 83 | 8120335 | FAM83B | 2.4 | 6.3 | 3.8 |
| 84 | 7970727 | CDX2 | 3.4 | 7.2 | 3.8 |
| 85 | 8135037 | MUC12 | 1.9 | 5.7 | 3.8 |
| 86 | 7937612 | MUC5B | 2.8 | 6.6 | 3.8 |
| 87 | 7950534 | WNT11 | 3.3 | 7.1 | 3.8 |
| 88 | 8096301 | SPP1 | 6.7 | 10.4 | 3.8 |
| 89 | 7985213 | CHRNA5 | 2.1 | 5.9 | 3.7 |
| 90 | 8067167 | AURKA | 2.3 | 6.1 | 3.7 |
| 91 | 8068684 | FAM3B | 3.7 | 7.4 | 3.7 |
| 92 | 7957140 | LGR5 | 2.8 | 6.5 | 3.7 |
| 93 | 8136709 | LOC93432 | 1.9 | 5.6 | 3.7 |
| 94 | 8118242 | LY6G6D | 2.3 | 6.0 | 3.7 |
| 95 | 8136801 | TRY6 | 2.6 | 6.4 | 3.7 |
| 96 | 8083146 | PLS1 | 4.3 | 8.0 | 3.7 |
| 97 | 8136807 | PRSS2 | 3.0 | 6.7 | 3.7 |
| 98 | 8141328 | CYP3A5 | 3.4 | 7.1 | 3.7 |
| 99 | 7994109 | PLK1 | 3.4 | 7.0 | 3.7 |
| 100 | 8031999 | PPAP2C | 4.4 | 8.0 | 3.7 |
| 101 | 7988350 | DUOX2 | 2.4 | 6.0 | 3.6 |
| 102 | 7937016 | CLRN3 | 2.3 | 6.0 | 3.6 |
| 103 | 7964316 | MYO1A | 2.3 | 6.0 | 3.6 |
| 104 | 8081925 | NR1I2 | 1.9 | 5.6 | 3.6 |
| 105 | 8009517 | SOX9 | 4.9 | 8.6 | 3.6 |
| 106 | 7903565 | GPSM2 | 4.7 | 8.3 | 3.6 |
| 107 | 8155083 | CA9 | 4.1 | 7.7 | 3.6 |
| 108 | 8097017 | UGT8 | 2.3 | 5.9 | 3.6 |
| 109 | 8146986 | HNF4G | 1.8 | 5.4 | 3.6 |
| 110 | 8040374 | FAM84A | 3.8 | 7.4 | 3.6 |
| 111 | 8059525 | TM4SF20 | 1.7 | 5.3 | 3.6 |
| 112 | 8168146 | KIF4A | 2.5 | 6.0 | 3.6 |
| 113 | 8137271 | ABP1 | 2.4 | 5.9 | 3.5 |
| 114 | 7962183 | AK3L1 | 3.6 | 7.1 | 3.5 |
| 115 | 7919055 | HMGCS2 | 3.1 | 6.6 | 3.5 |
| 116 | 8030094 | FUT2 | 2.6 | 6.1 | 3.5 |
| 117 | 7930593 | C10orf81 | 2.0 | 5.5 | 3.5 |
| 118 | 8093950 | S100P | 3.1 | 6.6 | 3.5 |
| 119 | 8015016 | TNS4 | 2.4 | 5.9 | 3.5 |
| 120 | 7901748 | FGGY | 4.7 | 8.2 | 3.5 |
| 121 | 7933640 | A1CF | 2.0 | 5.5 | 3.5 |
| 122 | 7923347 | LAD1 | 4.1 | 7.6 | 3.5 |
| 123 | 8154848 | PRSS3 | 2.6 | 6.1 | 3.5 |
| 124 | 8062766 | MYBL2 | 3.3 | 6.7 | 3.5 |
| 125 | 8124707 | TRIM31 | 2.3 | 5.7 | 3.4 |
| 126 | 8117426 | HIST1H2BH | 5.1 | 8.6 | 3.4 |
| 127 | 8072587 | SLC5A1 | 3.5 | 6.9 | 3.4 |
| 128 | 7945204 | ST14 | 5.9 | 9.3 | 3.4 |
| 129 | 7937020 | MKI67 | 3.1 | 6.5 | 3.4 |
| 130 | 8092000 | TERC | 5.5 | 8.9 | 3.4 |
| 131 | 8124394 | HIST1H2BB | 2.7 | 6.1 | 3.4 |
| 132 | 8179617 | TRIM31 | 2.5 | 5.9 | 3.4 |
| 133 | 8117594 | HIST1H2BM | 4.9 | 8.3 | 3.4 |
| 134 | 7983478 | C15orf48 | 3.6 | 7.0 | 3.4 |
| 135 | 8178330 | TRIM31 | 2.1 | 5.5 | 3.4 |
| 136 | 8138381 | AGR2 | 4.9 | 8.2 | 3.3 |
| 137 | 8041853 | EPCAM | 7.4 | 10.8 | 3.3 |
| 138 | 8016476 | HOXB9 | 2.8 | 6.1 | 3.3 |
| 139 | 8066258 | SNORA71A | 6.4 | 9.7 | 3.3 |
| 140 | 7993815 | ANKS4B | 2.3 | 5.6 | 3.3 |
| 141 | 8086607 | LTF | 5.1 | 8.4 | 3.3 |
| 142 | 8014974 | TOP2A | 3.9 | 7.2 | 3.3 |
| 143 | 8018774 | ST6GALNAC1 | 2.8 | 6.0 | 3.3 |
| 144 | 7936144 | COL17A1 | 3.1 | 6.4 | 3.3 |
| 145 | 8135915 | C7orf68 | 3.9 | 7.1 | 3.3 |
| 146 | 7927998 | HKDC1 | 2.8 | 6.1 | 3.2 |
| 147 | 8106689 | CKMT2 | 3.8 | 7.1 | 3.2 |
| 148 | 8066260 | SNORA71C | 7.0 | 10.2 | 3.2 |
| 149 | 8028991 | CYP2S1 | 4.9 | 8.1 | 3.2 |
| 150 | 8132318 | ANLN | 3.1 | 6.3 | 3.2 |
| 151 | 8115455 | HAVCR1 | 2.9 | 6.1 | 3.2 |
| 152 | 8098439 | EPCAM | 7.1 | 10.3 | 3.2 |
| 153 | 7983393 | SORD | 4.1 | 7.4 | 3.2 |
| 154 | 8035083 | CYP4F2 | 2.3 | 5.5 | 3.2 |
| 155 | 8171161 | ARSE | 4.0 | 7.2 | 3.2 |
| 156 | 8117395 | HIST1H2BF | 3.7 | 6.8 | 3.2 |
| 157 | 7996819 | CDH3 | 4.0 | 7.1 | 3.1 |
| 158 | 7941401 | OVOL1 | 2.5 | 5.6 | 3.1 |
| 159 | 7989501 | CA12 | 4.4 | 7.5 | 3.1 |
| 160 | 8015806 | ETV4 | 3.6 | 6.7 | 3.1 |
| 161 | 7945321 | GLB1L2 | 3.6 | 6.7 | 3.1 |
| 162 | 8167973 | HEPH | 4.1 | 7.2 | 3.1 |
| 163 | 8046488 | CDCA7 | 3.0 | 6.1 | 3.1 |
| 164 | 8120838 | TTK | 2.2 | 5.3 | 3.1 |
| 165 | 8102523 | FABP2 | 1.4 | 4.5 | 3.1 |
| 166 | 7969544 | NDFIP2 | 5.4 | 8.5 | 3.1 |
| 167 | 8109629 | FABP6 | 3.9 | 7.0 | 3.1 |
| 168 | 7969428 | UCHL3 | 6.1 | 9.2 | 3.1 |
| 169 | 7969414 | KLF5 | 6.3 | 9.3 | 3.1 |
| 170 | 8013536 | NOS2 | 3.2 | 6.3 | 3.1 |
| 171 | 8062728 | SGK2 | 2.5 | 5.6 | 3.1 |
| 172 | 7929334 | CEP55 | 3.1 | 6.1 | 3.1 |
| 173 | 8170553 | MAGEA6 | 2.8 | 5.9 | 3.1 |
| 174 | 8003204 | GINS2 | 4.0 | 7.0 | 3.1 |
| 175 | 8108629 | VTRNA1-2 | 2.6 | 5.7 | 3.0 |
| 176 | 7914592 | TMEM54 | 5.4 | 8.4 | 3.0 |
| 177 | 7918394 | EPS8L3 | 2.9 | 6.0 | 3.0 |
| 178 | 7983969 | CCNB2 | 3.2 | 6.3 | 3.0 |
| 179 | 7928770 | CDHR1 | 2.7 | 5.7 | 3.0 |
| 180 | 8016387 | PRR15L | 4.6 | 7.6 | 3.0 |
| 181 | 8138749 | HOXA9 | 2.6 | 5.6 | 3.0 |
| 182 | 8107769 | SLC12A2 | 6.6 | 9.6 | 3.0 |
| 183 | 8170992 | SNORA56 | 2.2 | 5.2 | 3.0 |
| 184 | 7907271 | FMO2 | 8.7 | 5.7 | −3.0 |
| 185 | 8175016 | APLN | 6.1 | 3.1 | −3.0 |
| 186 | 8007420 | AOC3 | 7.9 | 4.9 | −3.0 |
| 187 | 8055323 | NCKAP5 | 6.9 | 3.9 | −3.0 |
| 188 | 7903227 | PALMD | 7.7 | 4.6 | −3.0 |
| 189 | 7917850 | ARHGAP29 | 7.6 | 4.6 | −3.0 |
| 190 | 8017964 | ABCA6 | 6.9 | 3.9 | −3.0 |
| 191 | 8036151 | HSPB6 | 6.5 | 3.5 | −3.0 |
| 192 | 7974902 | RHOJ | 8.5 | 5.5 | −3.0 |
| 193 | 8041644 | PLEKHH2 | 7.3 | 4.2 | −3.1 |
| 194 | 8007701 | HIGD1B | 7.6 | 4.5 | −3.1 |
| 195 | 8152297 | ANGPT1 | 6.4 | 3.2 | −3.1 |
| 196 | 8155734 | FAM189A2 | 7.2 | 4.0 | −3.1 |
| 197 | 8125341 | AGER | 10.6 | 7.5 | −3.1 |
| 198 | 8012475 | MYH10 | 8.4 | 5.3 | −3.1 |
| 199 | 8017885 | ABCA8 | 6.0 | 2.9 | −3.1 |
| 200 | 8101675 | ABCG2 | 6.5 | 3.3 | −3.1 |
| 201 | 8179967 | AGER | 10.5 | 7.3 | −3.1 |
| 202 | 8135594 | CAV1 | 10.7 | 7.5 | −3.1 |
| 203 | 8097080 | SYNPO2 | 6.7 | 3.5 | −3.2 |
| 204 | 8178771 | AGER | 10.6 | 7.4 | −3.2 |
| 205 | 8101957 | EMCN | 7.7 | 4.5 | −3.2 |
| 206 | 8134257 | GNG11 | 9.0 | 5.8 | −3.2 |
| 207 | 8146794 | PREX2 | 7.6 | 4.4 | −3.2 |
| 208 | 8082597 | COL6A6 | 6.7 | 3.5 | −3.2 |
| 209 | 8092970 | APOD | 7.8 | 4.6 | −3.2 |
| 210 | 7917182 | ELTD1 | 8.0 | 4.8 | −3.2 |
| 211 | 7968789 | C13orf15 | 9.5 | 6.3 | −3.2 |
| 212 | 8057506 | FRZB | 6.8 | 3.6 | −3.2 |
| 213 | 8069676 | ADAMTS1 | 8.0 | 4.7 | −3.3 |
| 214 | 8055952 | NR4A2 | 8.3 | 5.0 | −3.3 |
| 215 | 8094301 | SLIT2 | 8.5 | 5.2 | −3.3 |
| 216 | 7934979 | ANKRD1 | 7.7 | 4.4 | −3.3 |
| 217 | 8170119 | FHL1 | 8.4 | 5.1 | −3.3 |
| 218 | 7980908 | FBLN5 | 9.0 | 5.7 | −3.3 |
| 219 | 8175531 | CDR1 | 9.5 | 6.1 | −3.3 |
| 220 | 7960464 | VWF | 8.8 | 5.4 | −3.4 |
| 221 | 7923034 | B3GALT2 | 6.2 | 2.8 | −3.4 |
| 222 | 8174513 | CHRDL1 | 7.6 | 4.2 | −3.4 |
| 223 | 8111677 | LIFR | 8.3 | 4.8 | −3.4 |
| 224 | 8091402 | TM4SF18 | 8.3 | 4.9 | −3.4 |
| 225 | 8089145 | ABI3BP | 9.0 | 5.6 | −3.4 |
| 226 | 7933855 | RTKN2 | 8.6 | 5.2 | −3.5 |
| 227 | 7964722 | WIF1 | 7.6 | 4.1 | −3.5 |
| 228 | 7946579 | LYVE1 | 8.6 | 5.1 | −3.5 |
| 229 | 8151532 | FABP4 | 7.4 | 3.9 | −3.5 |
| 230 | 8052753 | GKN2 | 6.4 | 2.9 | −3.5 |
| 231 | 8105084 | C7 | 10.2 | 6.6 | −3.5 |
| 232 | 8152522 | ENPP2 | 10.4 | 6.9 | −3.6 |
| 233 | 8162373 | OGN | 6.6 | 3.0 | −3.6 |
| 234 | 8029693 | FOSB | 9.1 | 5.5 | −3.6 |
| 235 | 7922130 | DPT | 8.3 | 4.7 | −3.6 |
| 236 | 8013341 | MFAP4 | 8.6 | 5.0 | −3.7 |
| 237 | 7908312 | PRG4 | 8.3 | 4.6 | −3.7 |
| 238 | 8132092 | INMT | 10.0 | 6.2 | −3.7 |
| 239 | 7971150 | LHFP | 9.5 | 5.8 | −3.7 |
| 240 | 8155754 | MAMDC2 | 7.4 | 3.6 | −3.8 |
| 241 | 8101881 | ADH1B | 8.1 | 4.3 | −3.8 |
| 242 | 8163202 | SVEP1 | 7.1 | 3.3 | −3.8 |
| 243 | 8056518 | SCN7A | 7.2 | 3.4 | −3.9 |
| 244 | 8171427 | FIGF | 8.2 | 4.2 | −4.0 |
| 245 | 7921690 | ITLN1 | 7.7 | 3.6 | −4.0 |
| 246 | 8096415 | MMRN1 | 8.6 | 4.3 | −4.3 |
| 247 | 8149071 | ANGPT2 | 8.0 | 3.7 | −4.3 |
Discussion
In this study, a comprehesive genomic analysis was
performed on a patient with metastatic colon tumor to the lung.
Whole exome sequencing and genome-wide expression analysis revealed
characteristics of both somatic mutations and genes differentially
expressed aquired during primary tumor progression to the
metastasis. Exome analysis covers over 38 million base pairs. In
exome screening, we found hundreds of mutation candidates, with
varying confidence scores and allele frequencies. Thus, it is
critical to know by experimentation what cutoff level gives a
high-confidence threshold. To achieve this, we needed orthogonal
method different from the original platform, to eliminate the
possibility of false positives created by any platform specific
artifacts. Thus, customized deep-sequencing panel was further
designed and this allowed us to get validated mutations both in a
quantitative and qualitiative way.
We did pathway analyses using both mutation and gene
expression information from the same metastatic tumor.
Interestingly, mutation data more closely reflected a
characteristic of lung cancer (metastasized site) while gene
expression data showed signatures related with colorectal cancer
(primary cancer). There was only one colorectal cancer-related
network by mutations. Six genes (ADCY2, ADCY9, APC, GNB5,
K-ras and LRP6) were identified to be associated with
colorectal cancer metastasis. ADCY2, ADCY9, GNB5 and
LRP6 were also involved in Phospholipase C Signaling. It was
reported that Phospholipase C ɛ (PLCE1) inhibited proliferation of
colorectal cancer (19). Reduced
expression of PLCD1 and PLCE1 was also reported in
colorectal cancer biopsies and cell lines (20). Thus, it seems that genes involved
in Phospholipase C Signaling are playing an important role in
colorectal cancer progression and metastasis.
While the mutation signatures of the metastatic
tumor were more closely related with lung cancer, differentially
expressed genes with a significant change seemed to be more
associated with primary colon cancer. The most significant networks
by gene expression analysis were gastrointestinal and colorectal
cancer groups
(8.78×10⁻²⁶<p<1.37×10⁻²⁰). This
suggests that metastatic tumors still preserved its original mRNA
gene expression pattern while tumor cells acquired new mutations in
a metastatic site. Out of 13 validated mutations, only APC
seemed to be clearly related with colon cancer development. We
could not investigate further due to unavailability of the primary
tumor samples whether the identified K-ras mutation came
from its primary colon cancer or metastatic tumor to the lung.
In addition to mutation and gene expression
analysis, we also performed copy number analysis from the exome
data. Copy number alteration is a common genetic variation in the
human genome (21). Traditionally,
it has been difficult to estimate the copy number of a gene based
on the regional coverage in exome sequencing, because different
exome regions have different capture efficiencies, leading to
different base coverage in different chromosome regions. However,
the ExomeCNV model (17) assumes
that the same region of two different samples, due to their
similarity (nearly identical) in sequences, have the same capture
efficiency. However, the results would be different if the tumor
tissue is mixed with normal cells. The specificity for CNV calls
inevitably decreases if the tumor tissue is contaminated with a
large portion of normal cells. In our case, we have relatively low
normal tissue contamination rate, 0.3. Validation assay of the
JAZF1 gene using TaqMan copy number assay showed a good
correlation between the exome copy number analysis and Taqman data.
This suggests that whole exome sequencing data can be used to
generate mutation as well as copy number information.
We identified a missense mutation at codon 71 (R71Q)
in JAZF1, its gain-of-copy being validated. JAZF1 encoding a
nuclear protein with three zinc finger domains is a
well-characterized genetic susceptibility gene for type II diabetes
(22–23) and lupus erythematosus (24). Various types of fusions such as
JAZF1-SUZ12, JAZF1-JJAZ1 and JAZF1-PHF1 have been
reported in ESS (endometrial stromal sarcoma) (25). Although variations of JAZF1
have been involved in many diseases, mutations in the JAZF1
gene have barely been described in the literature. Our copy number
analysis showed that this gene was amplified in the tumor. In lung
cancer, EML4-ALK oncogenic fusion was first identified in
2007 (26), and its inhibitor
targeting MET-ALK (crizotinib) was approved for treatment of
patients with EML4-ALK. Based on the high frequency of
JAZF1 fusions in another type of cancer and our
amplification data in a metastatic tumor to the lung, JAZF1
may function as an oncogene leading to lung metastasis from colon
cancer. Further functional studies are required to validate roles
of JAZF1 in tumor progression and a lung metastasis from
colon cancer.
TMPRSS15 (transmembrane protease, serine 15)
had a nonsense mutation (R871X). TMPRSS15 is an
enteropeptidase or an enterokinase activating pancreatic trypsin
for releasing digestive enzyme (27). Interestingly, nonsense and
frameshift mutations of TMPRSS15
(enteropeptidase/enterokinase) were found in families with
congenital enteropeptidase deficiency (27). One of the reported nonsense
mutations occurred at codon 857 (R857X), which is close to the
nonsense mutation site (R871X) of our patient. This suggests that
the region containing codons 857 and 871 may be susceptible for
stop-causing mutation.
ACTR5 [ARP5 actin-related protein 5 homolog
(yeast)] is another noteworthy gene (Table I). There are scarce data on the
function of this gene in human cancer. In our data, ACTR5
has a missense mutation and an amplification. The mRNA expression
was also higher by more than 2-fold in tumor (log2 value
= 5.22) than normal (log2 value = 4.2). Although no
information is available for this gene in either lung or colon
cancers at this time, a novel missense mutation that is highly
expressed and amplified suggests that this gene could also be
important in either colon or lung cancer development and
progression.
Like ALK and JAZF1, a rearrangement or
a fusion is common in ROS1 ranging from 1 to 3% of NSCLC
(28,29). It was recenlty reported that a
secondary missense mutation at codon 2032 (G2032R) of ROS1
was involved in a resistance to crizotinib in a lung cancer patient
with CD74-ROS1 (30). Our mutation
(F2103S) is located near the identified G2032R and the L2026
gatekeeper residue of ROS1. Moreover, based on the crystal
structure model by Awad et al (30), the F2103 seems to be a critical
residue for crizotinib binding. We confirmed that our patient did
not receive crizotinib treament. Thus, it will be meaningful to
investigate the characteristics of the ROS1 mutations in
lung or colon cancer patients with and without crizotinib
treatment.
Taken together, we performed whole exome analysis in
addition to the copy number and genome-wide expression analysis in
a metastatic tumor. Pathway analyses of the genomic information
identified different enrichment of mutation and gene expression
levels in a metastatic colon cancer to the lung. Furthermore,
ultra-high coverage NGS sequencing (>1,000X) confirmed the
accuracy of exome sequencing, and have led to potentially novel
cancer-associated genes which may lead to a metastasis from a
primary organ.
Acknowledgements
This study was supported by the
Barbara Isackson Lung Cancer Research Fund (D.J.), the Eileen D.
Ludwig Endowed Fund for Thoracic Oncology Research (D.J.), Uniting
Against Lung Cancer (UALC) (I.-J.K.), and Mesothelioma Applied
Research Foundation (MARF) (I.-J.K.).
References
|
1.
|
Hanahan D and Weinberg RA: The hallmarks
of cancer. Cell. 100:57–70. 2000. View Article : Google Scholar
|
|
2.
|
Nguyen DX, Bos PD and Massagué J:
Metastasis: from dissemination to organ-specific colonization. Nat
Rev Cancer. 9:274–284. 2009. View
Article : Google Scholar : PubMed/NCBI
|
|
3.
|
Jemal A, Bray F, Center MM, et al: Global
cancer statistics. CA Cancer J Clin. 61:69–90. 2011. View Article : Google Scholar
|
|
4.
|
Pao W and Girard N: New driver mutations
in non-small-cell lung cancer. Lancet Oncol. 12:175–180. 2011.
View Article : Google Scholar : PubMed/NCBI
|
|
5.
|
Choi H, Kratz J, Pham P, et al:
Development of a rapid and practical mutation screening assay for
human lung adenocarcinoma. Int J Oncol. 40:1900–1906.
2012.PubMed/NCBI
|
|
6.
|
Vogelstein B, Fearon ER, Hamilton SR, et
al: Genetic alterations during colorectal-tumor development. N Engl
J Med. 319:525–532. 1988. View Article : Google Scholar : PubMed/NCBI
|
|
7.
|
Barrett JC: Mechanisms of multistep
carcinogenesis and carcinogen risk assessment. Environ Health
Perspect. 100:9–20. 1993. View Article : Google Scholar : PubMed/NCBI
|
|
8.
|
Rudin CM, Durinck S, Stawiski EW, et al:
Comprehensive genomic analysis identifies SOX2 as a frequently
amplified gene in small-cell lung cancer. Nat Genet. 44:1111–1116.
2012. View
Article : Google Scholar : PubMed/NCBI
|
|
9.
|
Imielinski M, Berger AH, Hammerman PS, et
al: Mapping the hallmarks of lung adenocarcinoma with massively
parallel sequencing. Cell. 150:1107–1120. 2012. View Article : Google Scholar : PubMed/NCBI
|
|
10.
|
Cancer Genome Atlas Network: Comprehensive
molecular characterization of human colon and rectal cancer.
Nature. 487:330–337. 2012. View Article : Google Scholar : PubMed/NCBI
|
|
11.
|
Bosco-Clément G, Zhang F, Chen Z, et al:
Targeting gli transcription activation by small molecule suppresses
tumor growth. Oncogene. May 20–2013.(Epub ahead of print).
|
|
12.
|
Irizarry RA, Hobbs B, Collin F, et al:
Exploration, normalization, and summaries of high density
oligonucleotide array probe level data. Biostatistics. 4:249–264.
2003. View Article : Google Scholar
|
|
13.
|
Saunders CT, Wong WS, Swamy S, et al:
Strelka: accurate somatic small-variant calling from sequenced
tumor-normal sample pairs. Bioinformatics. 28:1811–1817. 2012.
View Article : Google Scholar : PubMed/NCBI
|
|
14.
|
Cibulskis K, Lawrence MS, Carter SL, et
al: Sensitive detection of somatic point mutations in impure and
heterogeneous cancer samples. Nat Biotechnol. 31:213–219. 2013.
View Article : Google Scholar : PubMed/NCBI
|
|
15.
|
Wang K, Li M and Hakonarson H: ANNOVAR:
functional annotation of genetic variants from high-throughput
sequencing data. Nucleic Acids Res. 38:e1642010. View Article : Google Scholar : PubMed/NCBI
|
|
16.
|
Li H, Handsaker B, Wysoker A, et al: The
sequence alignment/map format and samtools. Bioinformatics.
25:2078–2079. 2009. View Article : Google Scholar : PubMed/NCBI
|
|
17.
|
Sathirapongsasuti JF, Lee H, Horst BA, et
al: Exome sequencing-based copy-number variation and loss of
heterozygosity detection: ExomeCNV. Bioinformatics. 27:2648–2654.
2011. View Article : Google Scholar : PubMed/NCBI
|
|
18.
|
Mao JH, Kim IJ, Wu D, et al: FBXW7 targets
mTOR for degradation and cooperates with PTEN in tumor suppression.
Science. 321:1499–1502. 2008. View Article : Google Scholar : PubMed/NCBI
|
|
19.
|
Wang X, Zhou C, Qiu G, et al:
Phospholipase c epsilon plays a suppressive role in incidence of
colorectal cancer. Med Oncol. 29:1051–1058. 2012. View Article : Google Scholar : PubMed/NCBI
|
|
20.
|
Danielsen SA, Cekaite L, Ågesen TH, et al:
Phospholipase c isozymes are deregulated in colorectal
cancer-insights gained from gene set enrichment analysis of the
transcriptome. PLoS One. 6:e244192011. View Article : Google Scholar : PubMed/NCBI
|
|
21.
|
Redon R, Ishikawa S, Fitch KR, et al:
Global variation in copy number in the human genome. Nature.
444:444–454. 2006. View Article : Google Scholar : PubMed/NCBI
|
|
22.
|
Grarup N, Andersen G, Krarup NT, et al:
Association testing of novel type 2 diabetes risk alleles in the
jazf1, cdc123/camk1d, tspan8, thada, adamts9, and notch2 loci with
insulin release, insulin sensitivity, and obesity in a
population-based sample of 4,516 glucose-tolerant middle-aged
Danes. Diabetes. 57:2534–2540. 2008. View Article : Google Scholar
|
|
23.
|
Zeggini E, Scott LJ, Saxena R, et al:
Meta-analysis of genome-wide association data and large-scale
replication identifies additional susceptibility loci for type 2
diabetes. Nat Genet. 40:638–645. 2008. View
Article : Google Scholar : PubMed/NCBI
|
|
24.
|
Gateva V, Sandling JK, Hom G, et al: A
large-scale replication study identifies tnip1, prdm1, jazf1,
uhrf1bp1 and il10 as risk loci for systemic lupus erythematosus.
Nat Genet. 41:1228–1233. 2009. View
Article : Google Scholar : PubMed/NCBI
|
|
25.
|
Chiang S, Ali R, Melnyk N, et al:
Frequency of known gene rearrangements in endometrial stromal
tumors. Am J Surg Pathol. 35:1364–1372. 2011. View Article : Google Scholar : PubMed/NCBI
|
|
26.
|
Soda M, Choi YL, Enomoto M, et al:
Identification of the transforming EML4-ALK fusion gene in
non-small-cell lung cancer. Nature. 448:561–566. 2007. View Article : Google Scholar : PubMed/NCBI
|
|
27.
|
Holzinger A, Maier EM, Bück C, et al:
Mutations in the proenteropeptidase gene are the molecular cause of
congenital enteropeptidase deficiency. Am J Hum Genet. 70:20–25.
2002. View
Article : Google Scholar : PubMed/NCBI
|
|
28.
|
Bergethon K, Shaw AT, Ou SH, et al: ROS1
rearrangements define a unique molecular class of lung cancers. J
Clin Oncol. 30:863–870. 2012. View Article : Google Scholar : PubMed/NCBI
|
|
29.
|
Oxnard GR, Binder A and Jänne PA: New
targetable oncogenes in non-small-cell lung cancer. J Clin Oncol.
31:1097–1104. 2013. View Article : Google Scholar : PubMed/NCBI
|
|
30.
|
Awad MM, Katayama R, McTigue M, et al:
Acquired resistance to crizotinib from a mutation in CD74-ROS1. N
Engl J Med. 368:2395–2401. 2013. View Article : Google Scholar : PubMed/NCBI
|