Introduction
Neuroblastoma (NB) is the most common extracranial
solid pediatric tumor and accounts for 10% of childhood cancers
(1). NB arises from neural-derived
crest cells, and this tumor is remarkable for its biological
heterogeneity, displaying a broad spectrum of clinical behavior,
which ranges from spontaneous regression or maturation into a
benign form that is referred to as ganglioneuroma, to rapid tumor
progression and even death (2).
Although major advances have been made in the
surgical and chemotherapeutic treatment of NB, the morbidity and
mortality still remain high. Thus far, the molecular mechanisms
responsible for the pathogenesis of NB remain elusive. In recent
years, emerging evidence has suggested that tumorigenesis is
dependent on a small subset of cells within the tumor itself. These
are termed as cancer stem cells (CSCs). Additionally, CSCs have
been identified and isolated from hematopoietic malignant and solid
tumors, including glio-blastoma, breast and colon cancer (3–7).
Moreover, NB stem cells (NBSCs) have been isolated from NB cell
lines (8,9).
Cell lines that have been established from human NB
also show the same cellular heterogeneity. Based on morphological
appearance, biochemical properties and growth patterns, three major
cell types have been identified in NB cell lines. These have been
designated as N-(neuroblastic), S-(substrate-adherent and
non-neuronal) and I-type (intermediate) NB cells (10). I-type cells exhibit a morphology
that is intermediate to those of N- and S-type cells. These cells
have small but flattened cell bodies, with or without neurite-like
processes, attach modestly to the substrate, and express low levels
of both N- and S-type cell marker proteins (11).
Several lines of evidence suggest that I-type cells
might represent a population of NBSCs or malignant neural crest
stem cells. I-type cells are multipotent and can differentiate into
either N- or S-type cells when induced by specific agents (12). I-type cells express stem cell
markers such as CD133 and c-kit (13). In contrast with N- and S-type
cells, I-type cells exhibit significantly higher clonogenic
activity in soft agar culture and exhibit tumorigenic potential in
immunodeficient mice. Moreover, the numbers of I-type cells in
primary NB tumors correlate with disease progression (10,13).
SOX2 is a member of the SOX (SRY-related high
mobility group box) gene family, which contains a high mobility
group (HMG) domain that is very similar to that found in the
sex-determining gene SRY (14).
The SOX family of transcription factors is expressed during various
phases of embryonic development, which affects cell fate and
differentiation (15). SOX2 plays
an important role in the maintenance of self-renewal and the
potential for differentiation. Further studies revealed that SOX2
is required for the self-renewing proliferation of many normal and
cancer stem cells (16–20). Moreover, SOX2 over-expressing mice
displayed extensive hyperplasia, and about half of the mice
expressing the highest levels of SOX2 also developed carcinoma over
a 12–34-week period (21).
However, little is known about the function of SOX2 in NB
tumorigenesis.
In our previous studies, we found that SOX2 was
overexpressed in human NB tissues, and its expression correlated to
the clinical stage of NB, but not with other clinicopathological
parameters including patient gender and age, tumor size, location
and histological classification (22). These findings suggest that the
expression of SOX2 might correlate with the genesis and progression
of NB.
In the present study, we examined the expression of
SOX2 in I-type neuroblastoma cells using the human neuroblastoma
cell line BE(2)-C as a model. BE(2)-C cells have a typical I-type
phenotype, and show consistent morphological and biochemical
responses to differentiation-inducing agents (12,23,24).
We further established stable cell lines that overexpressed and had
downregulated expression of SOX2 by infecting BE(2)-C cells via
lentiviral transduction vectors, following which we explored the
functions of SOX2 in cell proliferation, clonogenicity,
tumorigenicity and differentiation.
Materials and methods
Cell lines and animals
The NB cell line BE(2)-C and the retrovirus
packaging cell line 293T were purchased from the American Type
Culture Collection (ATCC, Manassas, VA, USA). BE(2)-C was cultured
in DMEM/F12 (Gibco-BRL, Grand Island, NY, USA) and supplemented
with 10% heat-inactivated fetal bovine serum (FBS; Biochrom AG,
Berlin, Germany) at 37°C in a humidified 5% CO2
atmosphere. 293T cells were maintained in DMEM (Gibco-BRL) and
supplemented with 10% FBS, 100 U/ml penicillin (Sigma-Aldrich, St.
Louis, MO, USA) and 100 μg/ml streptomycin (Sigma-Aldrich). The
4-week-old male nude mice (BALB/c-nu/nu) were obtained from the
Shanghai Slac Laboratory Animal Co., Ltd., (Shanghai, China) and
were housed in laminar-flow cabinets under specific pathogen-free
conditions. Animal care and experimental protocols were performed
in accordance with the procedures and guidelines established by the
Shanghai Medical Experimental Animal Care Commission, and the study
was approved by the Ethics Committee of Children’s Hospital of
Fudan University.
Reverse transcriptase-PCR analysis
Total RNA was isolated from cultured cells by TRIzol
reagent (Invitrogen, Carlsbad, CA, USA). Reverse transcription was
performed as previously described (22). The PCR mixture was initially
incubated at 95°C for 5 min, followed by 40 cycles of denaturation
at 95°C for 30 sec, annealing at 59°C for 30 sec and extension at
72°C for 40 sec. Primer pairs used for RT-PCR analysis of SOX2 were
5′-AACTCCATGACCAGCTCGCAGAC-3′ and 5′-TGGGAGGAAGAGGTAACCACAG-3′ with
an expected PCR product size of 158 bp, and
5′-TAGTTGCGTTACACCCTTTCTTG-3′ and 5′-TGCTGTCACCTTCACCGTTC-3′ for
β-actin with an expected product size of 156 bp. β-actin was used
as an internal control.
Immunofluorescence
Cells were washed with PBS, fixed with cold methanol
for 30 min at 4°C, rehydrated in PBS, permeabilized with 0.25%
Triton X-100 for 10 min, and then blocked with 0.5% BSA. They were
incubated overnight with the primary antibody (Sox2, 1:100,
cst2748; Cell Signaling Technology, Beverly, MA, USA) at 4°C,
followed by washes with PBS, and incubation with the secondary
antibody for 1 h at 37°C. Cells were stained with Hoechst 33342 to
visualize nuclei and examined with a fluorescence microscope
(Olympus, Tokyo, Japan).
Lentivirus vector construction and
transduction
The entire coding sequence of SOX2 cDNA was
amplified and cloned into the pLenti-CMV-RFP vector obtained from
Addgene. The sequence of SOX2 shRNA was amplified and cloned into
the pGCSIL-GFP vector, which was also obtained from Addgene. The
expression of SOX2 was confirmed by quantitative real-time PCR and
western blot analysis. Lentivirus production and transduction were
performed according to instructions supplied by Addgene http://www.addgene.org.
Quantitative real-time PCR analysis
Quantitative real-time PCR was performed in a
reaction mixture containing 10 μl SYBR Premix (Takara Bio, Shiga,
Japan), 0.8 μl each of the primer (10 μM), 0.4 μl of the ROX
reference dye II, 2 μl of the cDNA and 6 μl of dH2O.
Primer pairs used for real-time PCR analysis of SOX2 were
5′-ATCCCATCACCCACAGCAA-3′ and 5′-TCGGCATCGCGGTTTTT-3′ with an
expected PCR product size of 80 bp. All real-time PCR reactions
were performed using an ABI 7500 Real-Time PCR System (Applied
Biosystems, Foster City, CA, USA) with the following cycling
conditions: initiation at 95°C for 30 sec, amplification of 40
cycles at 95°C for 5 sec and 60°C for 34 sec. Each experiment was
done in triplicate and normalized to the β-actin gene as an
internal control.
Western blot analysis
Experiments were performed as previously described
(22). Briefly, cells were lysed
in RIPA buffer for protein extraction. The supernatant was
collected, and protein concentrations measured by an enhanced BCA
protein assay kit (Beyotime Institute of Biotechnology, Haimen,
China). Protein samples (20 μg) were separated in a 10% SDS-PAGE
gel and then transferred onto a PVDF membrane. Membranes were
blocked in 5% non-fat milk for 1 h and then probed with primary
antibodies followed by horseradish peroxidase (HRP)-conjugated goat
anti-rabbit antibodies. Primary monoclonal antibodies used were as
follows: rabbit polyclonal anti-Sox2 (1:500, cst2748; Cell
Signaling Technology), mouse monoclonal anti-peripherin (1:200,
P5117; Sigma-Aldrich), mouse monoclonal anti-S-100 (1:200,
sc-52204; Santa Cruz Biotechnology, Santa Cruz, CA, USA), mouse
monoclonal anti-NF-68 (1:5,000, ab78159l; Abcam, Cambridge, UK),
and rabbit polyclonal anti-Vimentin (1:1000, cst3932; Cell
Signaling Technology). A mouse monoclonal anti-β-actin antibody
(1:1,000, sc-69879; Santa Cruz Biotechnology) was used for the
internal control. Membranes were developed using an ECL detection
system (Thermo Fisher Scientific, Waltham, MA, USA). Band
intensities were determined using the Image Lab 3.0 software.
Cell proliferation assays
In the cell proliferation experiments, the
neuroblastoma cells were seeded into 96-well plates at
1×10⁴ cells/well for absorbance value assay or into
6-well plates at 1×10⁶/well for flow cytometric
analysis. Cells divided into groups according to the different
treatment: BE(2)-C group, pCMV-SOX2 group, pCMV group, SOX2-shRNA
group and control shRNA group. The number of viable cells was
measured indirectly as the absorbance value (AV) using the Cell
Counting Kit-8 (CCK-8; Dojindo Laboratories, Kumamoto, Japan) assay
as previously described (at 0, 24, 48 and 72 h) (25). Briefly, 10 μl of CCK-8 dye was
added to each well, and the plate was incubated for 2 h at 37°C.
The absorbance values were then measured at 450 nm using a
microplate reader (Model 680; Bio-Rad Laboratories, Hercules, CA,
USA). Each measurement was performed in triplicate and the
experiments were repeated 3 times.
To evaluate the cell growth, flow cytometric
analysis was performed using a FACScan flow cytometer (FACSCalibur;
Becton-Dickinson) at 72 h. The proliferation index (PI) was then
calculated with the following formula: PI (%)=[(S +
G2M)/(G0G1 + S + G2M)]
× 100%.
Colony formation assays
Cells were seeded into 6-well plates at a density of
500 cells/well and cultured at 37°C for 2 weeks. At the end of the
incubation, the cells were fixed with 100% methanol and stained
with 0.1% crystal violet. Megascopic cell colonies were counted by
Image-Pro Plus 5.0 (Media Cybernetics, Silver Spring, MD, USA).
Each measurement was performed in triplicate and the experiments
were each carried out at least three times.
Cell differentiation assays
Cells were seeded into 6-well plates at a density of
2×10⁵ cells/well. RA (2 μl) or BrdU was added to each
well, and the cells were cultured at 37°C for 1 week. Cell
morphology was observed everyday under phase contrast microscope.
At the end of the incubation, the cells were harvested and lysed in
ice-cold RIPA buffer containing proteinase inhibitors for protein
extraction. The proteins extracted were used for further western
blot analysis. Each measurement was performed in triplicate.
Xenograft experiments
Cells (2×10⁶ per mouse) were injected
sub-cutaneously into the right upper flank of three groups of
4-week-old male nude mice. Six animals per group were used in each
experiment. Mice were then monitored weekly for tumor size and
evidence of morbidity. Tumor size was measured in two dimensions
with Vernier calipers, and volume was calculated according to the
formula: V = (length × width2)/2. The xenograft in each
mouse was excised at the time of sacrifice after inoculation for 5
weeks.
Statistical analysis
Statistical analyses were performed using the SPSS
17.0 statistical software (SPSS, Inc., Chicago, IL, USA). The data
were expressed as the mean ± SEM from at least three separate
experiments. Differences in mean values were analyzed by the
Student’s t-test and one-way analysis of variance. An α value of
P<0.05 was considered to be statistically significant.
Results
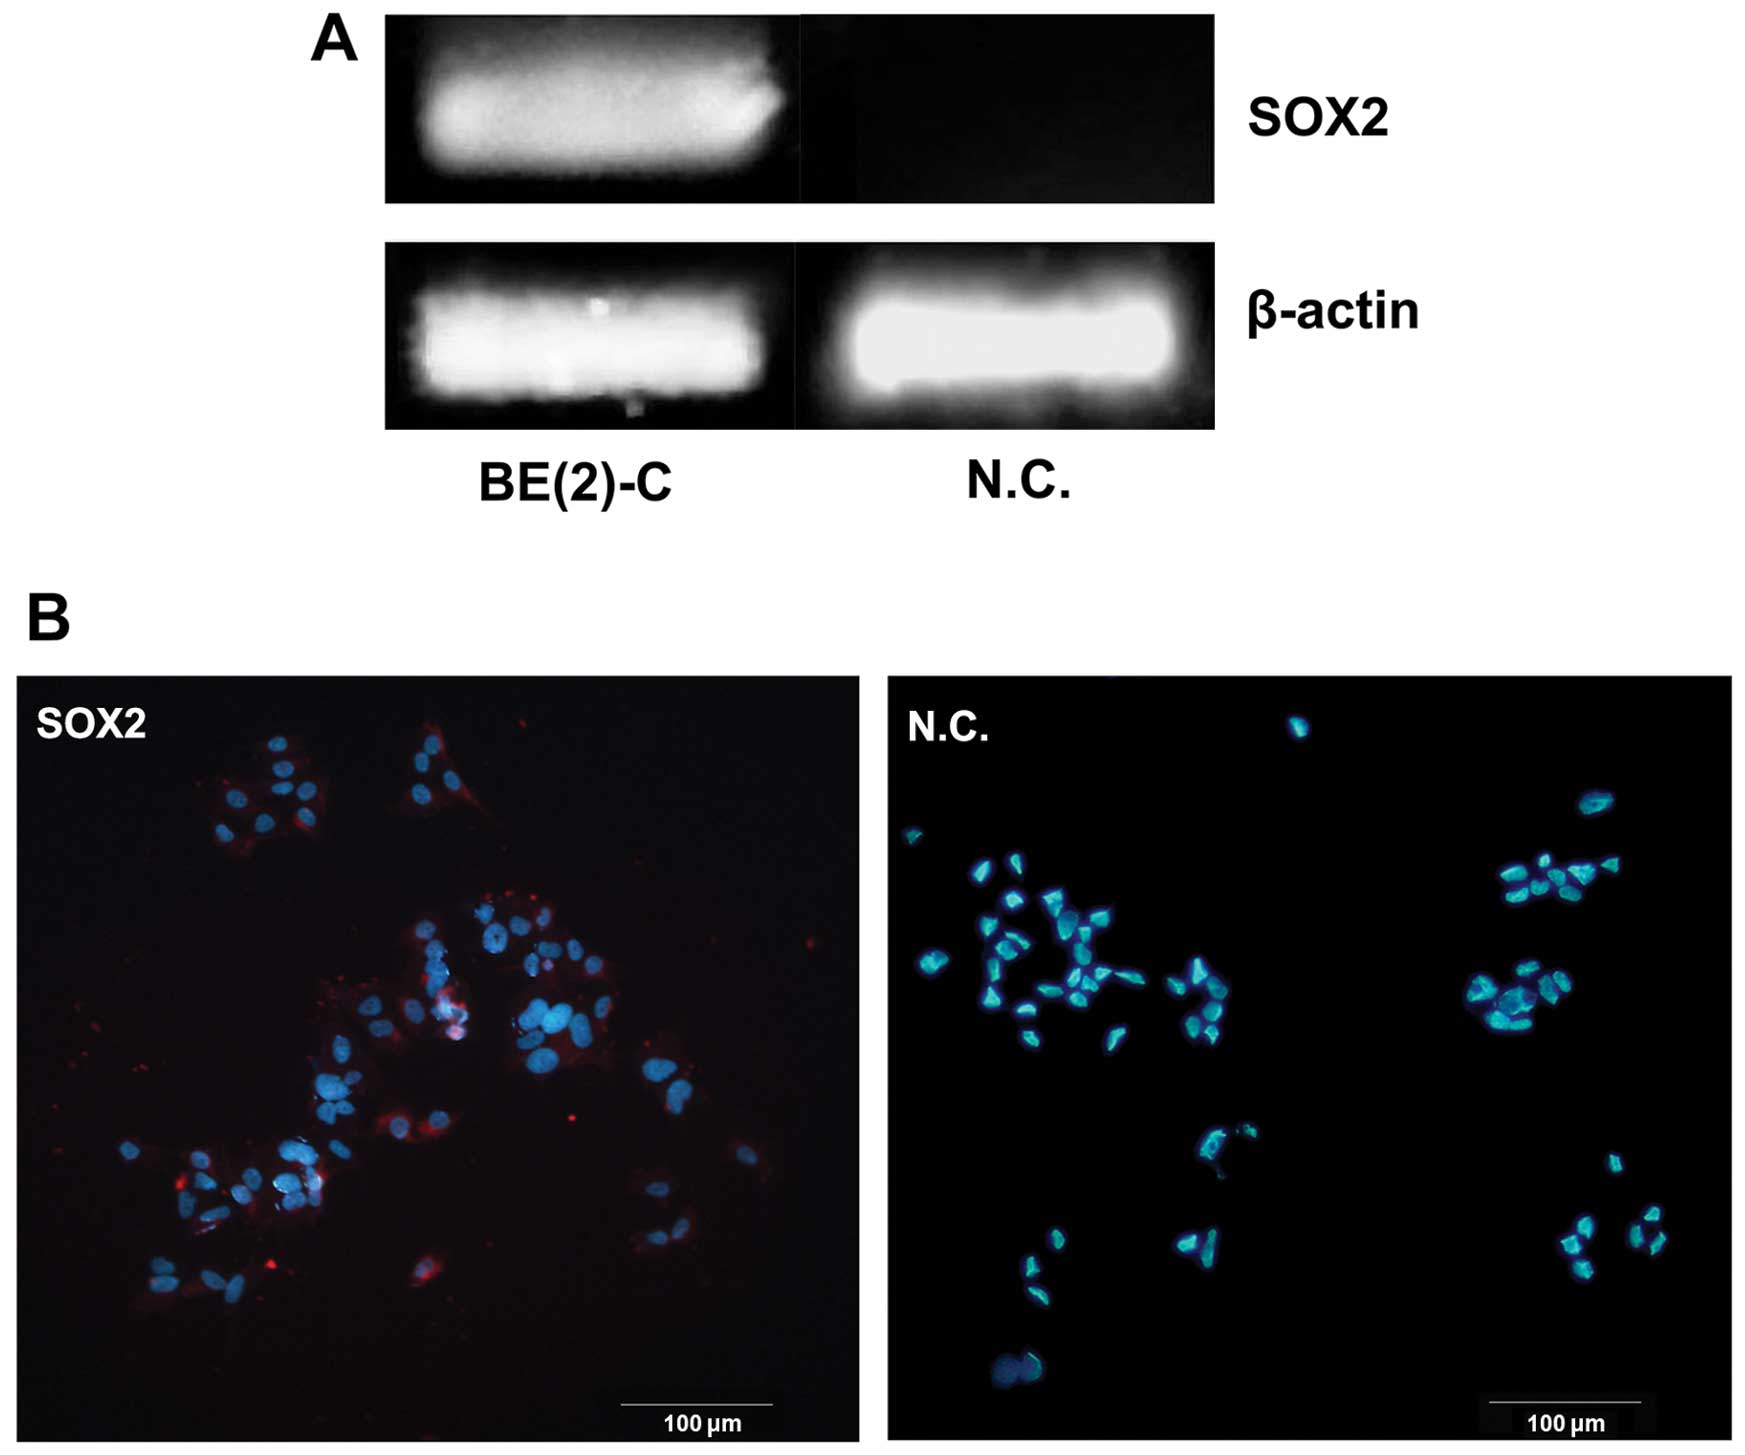
SOX2 expression in BE(2)-C cells
We examined the mRNA expression levels of Sox2 gene
in BE(2)-C cells by regular RT-PCR. There was detectable expression
of Sox2 gene in this cell line while not in the negtive control
(Fig. 1A). At the same time, the
expression was further confirmed at protein level by
immunofluorescence staining. It was primarily located in the nuclei
of BE(2)-C cells (Fig. 1B).
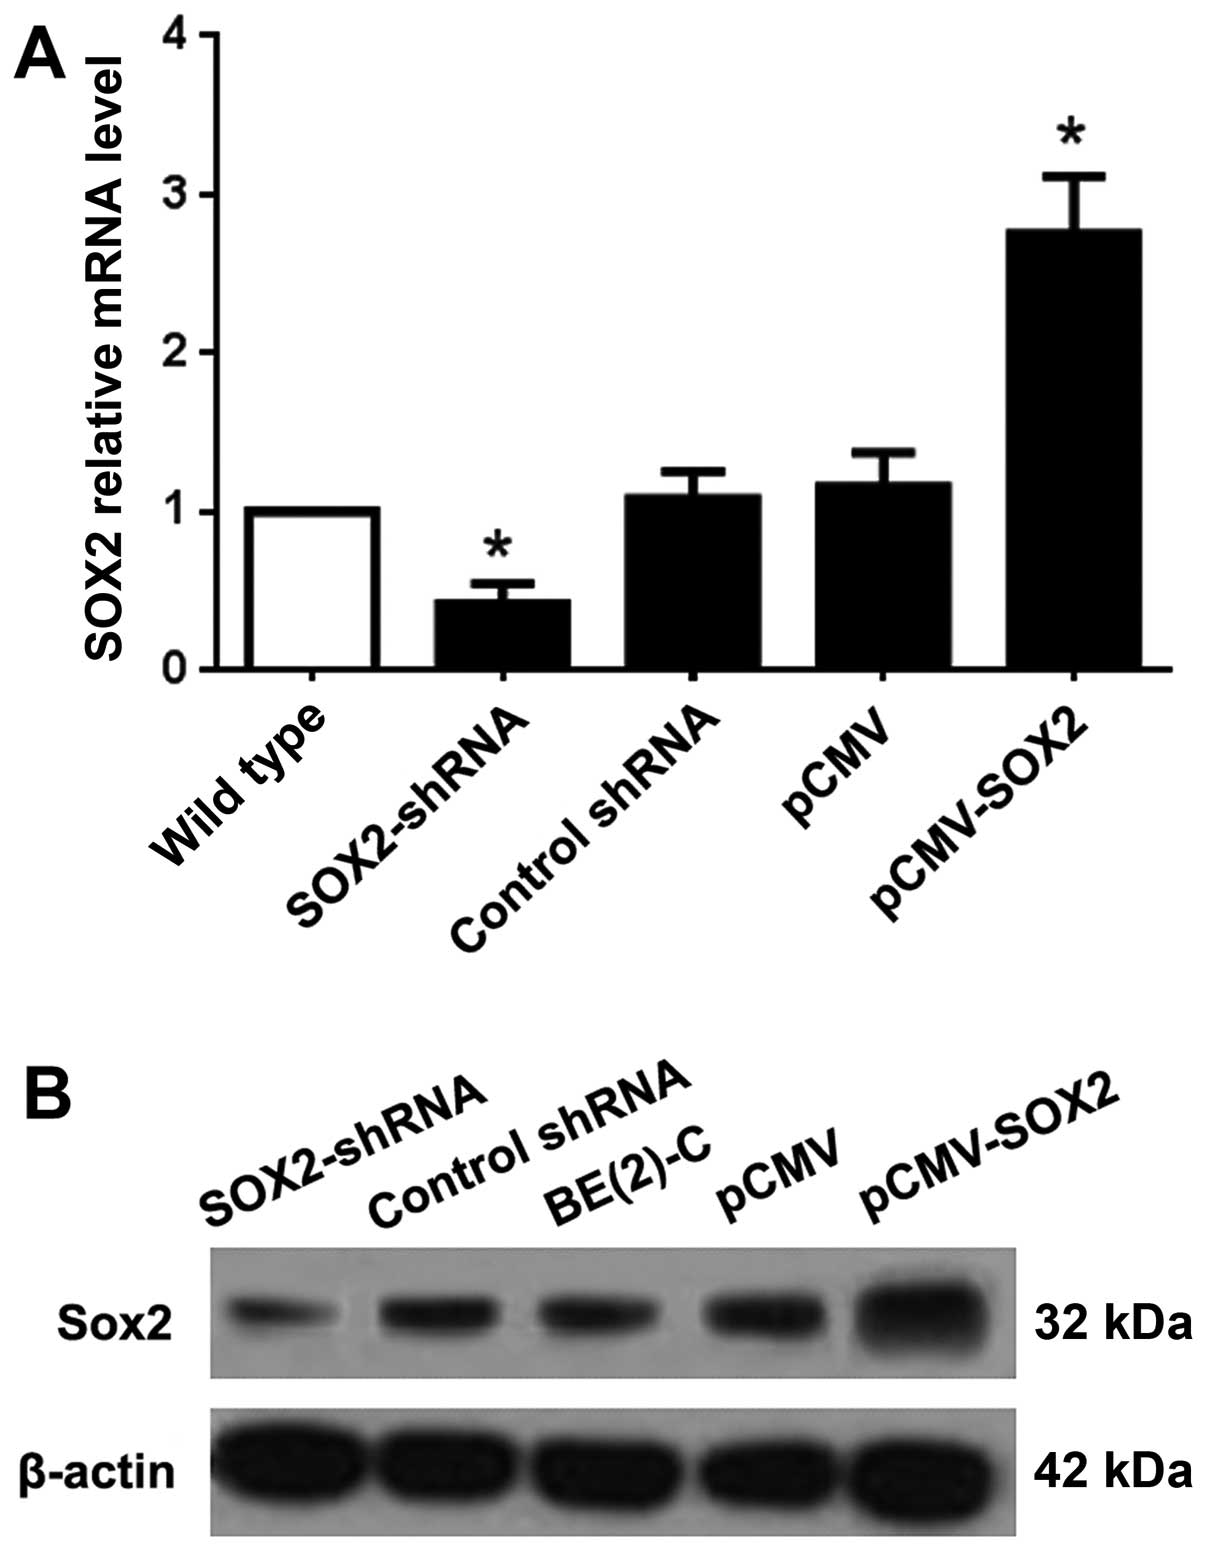
SOX2 promotes proliferation of BE(2)-C
cells in vitro
To explore the function of SOX2 in BE(2)-C cells, we
established SOX2-overexpressing and downregulated sublines of SOX2
(pCMV-SOX2 and SOX2-shRNA), with empty plasmid and non-functional
shRNA as control. The expression of SOX2 at the RNA level of
pCMV-SOX2 cells was ~2.75 times that of the wild-type. However, the
Sox2 mRNA level of the Sox2-shRNA cells was less than half of the
wild-type group (Fig. 2A). The
protein expression level of SOX2 was confirmed by western blot
analysis (Fig. 2B).
The proliferation of the cells was measured by the
CCK-8 assay. At 72 h, AV was 1.210±0.148 for the BE(2)-C group,
1.124±0.131 for the pCMV group, 1.626±0.175 for the pCMV-SOX2
group, 0.812±0.083 for the Sox2-shRNA group, and 1.156±0.097 for
the control shRNA group (Fig. 3A).
AV was increased by 39.3% in the pCMV-SOX2 group, when compared
with that of BE(2)-C group and pCMV group (P<0.05). AV was
decreased by 45.7% in the SOX2-shRNA group, when compared with that
of control shRNA group and BE(2)-C group (P<0.05).
Furthermore, to determine whether SOX2 increases the
cell number by increasing proliferation, cellular DNA content was
measured by flow cytometry (Fig.
3B). The proliferation index (PI) was 65.2±5.6% in the
pCMV-SOX2 group, and was significantly higher than the BE(2)-C
group (50.7±4.8%) and SOX2-shRNA group (36.3±3.2%) (P<0.05;
Fig. 3C and Table I).
 | Table IStatistical analyses of the cell cycle
determinations. |
Table I
Statistical analyses of the cell cycle
determinations.
| Cell cycle |
|---|
|
|
|---|
| Group | G1 (%) | S (%) | G2 (%) |
|---|
| BE(2)-C | 48.3±5.2 | 38.6±3.5 | 13.1±4.6 |
| pCMV-SOX2 | 34.8±3.8 | 55.2±4.3 | 10.1±2.9 |
| SOX2-shRNA | 63.7±5.9 | 21.8±5.7 | 14.5±3.2 |
SOX2 promotes colony formation of BE(2)-C
cells in vitro
The colony formation assay showed that the colony
forming numbers were significantly increased in pCMV-SOX2 cells
(103±18) with enhanced SOX2 and were decreased in SOX2-shRNA cells
(42±7) with downregulated SOX2 expression when compared with
wild-type cells (75±12, Fig. 4A;
both P<0.05). By light microscopy, the colony spheres of
pCMV-SOX2 cells displayed large bodies with more cells than that
found in SOX2-shRNA treated cells (Fig. 4B).
SOX2 promoted tumorigenicity in vivo
Subcutaneous nodules were observed 12 days after
initiating the tumor in the pCMV-SOX2 group, 15 days in the BE(2)-C
group, and 17 days in the SOX2-shRNA group. Tumor size was measured
weekly after inoculation for 21 days, following which, a tumor
growth curve was constructed according to the tumor volume
(Fig. 5A and Table II). The tumor volume was found to
be significantly different between the three groups (P<0.05).
Typical appearances of tumor nodules and views of the dissected
tumor in nude mice are shown in Fig.
5B.
| Table IIThe volume of tumors in nude mice
inoculated with different transfected BE(2)-C cells. |
Table II
The volume of tumors in nude mice
inoculated with different transfected BE(2)-C cells.
| | Volume
(mm3) |
|---|
| |
|
|---|
| Group | Number | 21 days | 28 days | 35 days |
|---|
| pCMV-SOX2 | 6 | 1264.0±754.8 |
2855.8±1412.7a |
8546.8±3416.2b |
| BE(2)-C | 6 | 405.4±133.1 | 914±254.5a |
2837.2±497.1b |
| SOX2-shRNA | 6 | 143.9±67.1 | 452.8±232.9a |
1101.8±639.8b |
Downregulation of SOX2 in BE(2)-C cells
promotes agent-induced differentiation
As shown in Fig.
6A, BE(2)-C cells were induced to differentiate towards N-type
cells after RA treatment, and S-type cells after BrdU treatment,
respectively. Peripherin and NF-68 were N-type cell marker
proteins. Vimentin and S100 were S-type cell marker proteins. To
investigate the effect of SOX2 on differentiation properties of
BE(2)-C cells, we performed western blot analysis to detect the
marker proteins after agent treatment. We found that SOX2-shRNA
cells exhibited increased expression levels of marker proteins of
N- or S-type cells when compared with BE(2)-C and pCMV-SOX2 cells
after agent-induced differentiation (Fig. 6B and C, Tables III and IV; both P<0.05).
| Table IIIRelative expression levels of marker
proteins after RA induced differentiation. |
Table III
Relative expression levels of marker
proteins after RA induced differentiation.
| Group | Peripherin | P-value | NF-68 | P-value |
|---|
| BE(2)-C | 0.465±0.030 | | 0.618±0.026 | |
| pCMV-SOX2 | 0.182±0.016 | 0.012 | 0.287±0.013 | 0.001 |
| pCMV | 0.487±0.021 | 0.363 | 0.665±0.022 | 0.077 |
| SOX2-shRNA | 0.698±0.029 | 0.003 | 0.924±0.067 | 0.008 |
| Control shRNA | 0.486±0.038 | 0.496 | 0.647±0.071 | 0.562 |
| Table IVRelative expression levels of marker
proteins after BrdU induced differentiation. |
Table IV
Relative expression levels of marker
proteins after BrdU induced differentiation.
| Group | Vimentin | P-value | S-100 | P-value |
|---|
| BE(2)-C | 0.583±0.056 | | 0.441±0.023 | |
| pCMV-SOX2 | 0.192±0.020 | 0.003 | 0.138±0.016 | 0.000 |
| pCMV | 0.576±0.058 | 0.848 | 0.443±0.062 | 0.962 |
| SOX2-shRNA | 0.850±0.031 | 0.005 | 0.719±0.097 | 0.033 |
| Control shRNA | 0.597±0.028 | 0.725 | 0.475±0.027 | 0.174 |
Discussion
Cancer stem cells have been described as small
populations of cells that have higher tumorigenicity,
differentiation ability and self-renewal ability (26). As CSCs have these characteristics,
they are thought to be associated with cancer recurrence after
treatment and distant metastasis. Additionally, CSCs have been
shown to be related to resistance to various treatments. Therefore,
elimination of CSCs is essential for cancer treatment (26). Thus, CSCs are likely to be the most
relevant targets in the treatment of neuroblastoma and further
studies on the characterization of these cells will help in the
design of more successful neuroblastoma therapies.
Several lines of evidence have shown that
neuroblastoma could arise from its own cancer stem cells (9,12,13,27,28).
In vitro, neuroblastoma cancer stem cells may correspond
with a population having an intermediate phenotype (I-type). These
cells express features of both N-type and S-type cells, possess
multipotent differentiation properties, and can be induced to
differentiate into neuroblastic or glial cell phenotypes. Of
interest, I-type cells are more malignant than N-type and S-type
cells in athymic mice. This further confirms that I-type cells may
also be considered the so-called tumor initiating cells (TICs) or
cancer stem cells (9,12,13,27,28).
Based on the above, we chose to evaluate the function of SOX2 in
the BE(2)-C neuroblastoma cell line that is composed of I-type
cells (12,29).
In the present study, we examined the expression of
SOX2 in BE(2)-C cells, and tests were carried out with model
systems displaying overexpressed and downregulated SOX2 in BE(2)-C
cells. BE(2)-C is a I-type neuroblastoma cell line, wherein SOX2 is
highly expressed. We found that overexpression of SOX2 in BE(2)-C
cells could promote both cell proliferation and growth of the tumor
by cloning formation assay. At the cellular level, knocking down
SOX2 expression resulted in an accumulation of cells in the G0/G1
phases of the cell cycle and decreased the proportion of cells in
the S and G2/M phases. In addition, SOX2 expression also enhanced
tumor formation in nude mice. However, suppression of SOX2 had the
opposite effect. Taken together, these data suggested that
exogenous SOX2 expression might promote neuroblastoma tumorigenesis
both in vitro and in vivo. These results were
consistent with previous studies in which SOX2 was found to be
overexpressed and could promote cell proliferation and
tumorigenesis (16–20).
An examination of changes in cell morphology showed
that the BE(2)-C cells were induced to differentiate towards N-type
or S-type cells after RA or BrdU treatment, respectively.
Furthermore, pCMV-SOX2 cells exhibited decreased expression levels
of marker proteins of N- or S-type cells when compared with BE(2)-C
and SOX2-shRNA cells. Conversely, downregulation of SOX2 showed an
inverse series of results. The data suggested that SOX2
overexpression inhibited BE(2)-C cells from differentiating towards
less malignant cell type, indicating that SOX2 plays an important
role in the maintenance of the differentiation potential of BE(2)-C
cells. These results also suggested that deregulated SOX2
expression distorted the balance toward a transformed phenotype,
leading to the development of neuroblastoma.
Our results are consistent with the growing body of
evidence that cancer is caused by deregulation of transcription
factors that affect cell fate and proliferation. Additionally,
recent studies have suggested that dysregulation of self-renewal
plays a key role in the generation of CSCs. Thus, it is reasonable
to suggest that the high-expression levels of SOX2 were related to
the generation of neuroblastoma CSCs. However, the mechanism
remains unknown and requires further analysis. In our future work,
we propose to use microarray analysis to identify genes regulated
by SOX2 by comparing expression profiles of BE(2)-C cells and
SOX2-shRNA cells.
In conclusion, we have demonstrated SOX2 expression
in the human neuroblastoma I-type cell line BE(2)-C. SOX2 promoted
BE(2)-C cell proliferation, colony formation and tumorigenesis.
Additionally, SOX2 maintained BE(2)-C cells in an undifferentiated
state. Our results may provide further evidence for the cancer stem
cell theory. By contrast, it may also imply the existence of
undifferentiated cells in these tumors, in which SOX2 contributes
to the character of these cells. These results demonstrate that
SOX2 might play an important role in NB tumorigenesis and suggests
a possible therapeutic target in NB.
Acknowledgements
Authors gratefully acknowledge technical assistance
by Yi Yang, Man Xiong, Bingbing Wu and Ying Wang from institute of
pediatrics, Children’s Hospital of Fudan University. This research
was supported by the National Natural Science Foundation of China
(grant no. 30801198).
References
|
1
|
Maris JM, Hogarty MD, Bagatell R and Cohn
SL: Neuroblastoma. Lancet. 369:2106–2120. 2007. View Article : Google Scholar : PubMed/NCBI
|
|
2
|
Cohn SL, Pearson AD, London WB, et al: The
International Neuroblastoma Risk Group (INRG) classification
system: an INRG Task Force report. J Clin Oncol. 27:289–297. 2009.
View Article : Google Scholar : PubMed/NCBI
|
|
3
|
Singh SK, Clarke ID, Terasaki M, et al:
Identification of a cancer stem cell in human brain tumors. Cancer
Res. 63:5821–5828. 2003.PubMed/NCBI
|
|
4
|
Gonzalez-Sarmiento R and Perez-Losada J:
Breast cancer, a stem cell disease. Curr Stem Cell Res Ther.
3:55–65. 2008. View Article : Google Scholar : PubMed/NCBI
|
|
5
|
Atlasi Y, Mowla SJ, Ziaee SA and Bahrami
AR: OCT-4, an embryonic stem cell marker, is highly expressed in
bladder cancer. Int J Cancer. 120:1598–1602. 2007. View Article : Google Scholar : PubMed/NCBI
|
|
6
|
Ricci-Vitiani L, Lombardi DG, Pilozzi E,
et al: Identification and expansion of human
colon-cancer-initiating cells. Nature. 445:111–115. 2007.
View Article : Google Scholar : PubMed/NCBI
|
|
7
|
Ailles LE and Weissman IL: Cancer stem
cells in solid tumors. Curr Opin Biotechnol. 18:460–466. 2007.
View Article : Google Scholar : PubMed/NCBI
|
|
8
|
Komuro H, Saihara R, Shinya M, et al:
Identification of side population cells (stem-like cell population)
in pediatric solid tumor cell lines. J Pediatr Surg. 42:2040–2045.
2007. View Article : Google Scholar : PubMed/NCBI
|
|
9
|
Ross RA and Spengler BA: Human
neuroblastoma stem cells. Semin Cancer Biol. 17:241–247. 2007.
View Article : Google Scholar
|
|
10
|
Ross RA, Biedler JL and Spengler BA: A
role for distinct cell types in determining malignancy in human
neuroblastoma cell lines and tumors. Cancer Lett. 197:35–39. 2003.
View Article : Google Scholar : PubMed/NCBI
|
|
11
|
Ciccarone V, Spengler BA, Meyers MB,
Biedler JL and Ross RA: Phenotypic diversification in human
neuroblastoma cells: expression of distinct neural crest lineages.
Cancer Res. 49:219–225. 1989.PubMed/NCBI
|
|
12
|
Ross RA, Spengler BA, Domenech C, et al:
Human neuroblastoma I-type cells are malignant neural crest stem
cells. Cell Growth Differ. 6:449–456. 1995.PubMed/NCBI
|
|
13
|
Walton JD, Kattan DR, Thomas SK, et al:
Characteristics of stem cells from human neuroblastoma cell lines
and in tumors. Neoplasia. 6:838–845. 2004. View Article : Google Scholar : PubMed/NCBI
|
|
14
|
Sinclair AH, Berta P, Palmer MS, et al: A
gene from the human sex-determining region encodes a protein with
homology to a conserved DNA-binding motif. Nature. 346:240–244.
1990. View
Article : Google Scholar : PubMed/NCBI
|
|
15
|
Kamachi Y, Uchikawa M and Kondoh H:
Pairing SOX off: with partners in the regulation of embryonic
development. Trends Genet. 16:182–187. 2000. View Article : Google Scholar : PubMed/NCBI
|
|
16
|
Xiang R, Liao D, Cheng T, et al:
Downregulation of transcription factor SOX2 in cancer stem cells
suppresses growth and metastasis of lung cancer. Br J Cancer.
104:1410–1417. 2011. View Article : Google Scholar : PubMed/NCBI
|
|
17
|
Ji J and Zheng PS: Expression of Sox2 in
human cervical carcinogenesis. Hum Pathol. 41:1438–1447. 2010.
View Article : Google Scholar : PubMed/NCBI
|
|
18
|
Fang X, Yu W, Li L, et al: ChIP-seq and
functional analysis of the SOX2 gene in colorectal cancers. OMICS.
14:369–384. 2010. View Article : Google Scholar
|
|
19
|
Gen Y, Yasui K, Zen Y, et al: SOX2
identified as a target gene for the amplification at 3q26 that is
frequently detected in esophageal squamous cell carcinoma. Cancer
Genet Cytogenet. 202:82–93. 2010. View Article : Google Scholar : PubMed/NCBI
|
|
20
|
Nakatsugawa M, Takahashi A, Hirohashi Y,
et al: SOX2 is overexpressed in stem-like cells of human lung
adenocarcinoma and augments the tumorigenicity. Lab Invest.
91:1796–1804. 2011. View Article : Google Scholar : PubMed/NCBI
|
|
21
|
Lu Y, Futtner C, Rock JR, et al: Evidence
that SOX2 overexpression is oncogenic in the lung. PLoS One.
5:e110222010. View Article : Google Scholar : PubMed/NCBI
|
|
22
|
Yang S, Zheng J, Ma Y, et al: Oct4 and
Sox2 are overexpressed in human neuroblastoma and inhibited by
chemotherapy. Oncol Rep. 28:186–192. 2012.PubMed/NCBI
|
|
23
|
Melone MA, Giuliano M, Squillaro T, et al:
Genes involved in regulation of stem cell properties: studies on
their expression in a small cohort of neuroblastoma patients.
Cancer Biol Ther. 8:1300–1306. 2009. View Article : Google Scholar : PubMed/NCBI
|
|
24
|
Cui H, Ma J, Ding J, et al: Bmi-1
regulates the differentiation and clonogenic self-renewal of I-type
neuroblastoma cells in a concentration-dependent manner. J Biol
Chem. 281:34696–34704. 2006. View Article : Google Scholar : PubMed/NCBI
|
|
25
|
Zheng J, Xiao X, Liu J, et al:
Growth-promoting effect of environmental endocrine disruptors on
human neuroblastoma SK-N-SH cells. Environ Toxicol Pharmacol.
24:189–193. 2007. View Article : Google Scholar : PubMed/NCBI
|
|
26
|
Visvader JE and Lindeman GJ: Cancer stem
cells in solid tumours: accumulating evidence and unresolved
questions. Nat Rev Cancer. 8:755–768. 2008. View Article : Google Scholar : PubMed/NCBI
|
|
27
|
Hansford LM, McKee AE, Zhang L, et al:
Neuroblastoma cells isolated from bone marrow metastases contain a
naturally enriched tumor-initiating cell. Cancer Res.
67:11234–11243. 2007. View Article : Google Scholar : PubMed/NCBI
|
|
28
|
Tong QS, Zheng LD, Tang ST, et al:
Expression and clinical significance of stem cell marker CD133 in
human neuroblastoma. World J Pediatr. 4:58–62. 2008. View Article : Google Scholar : PubMed/NCBI
|
|
29
|
Jori FP, Galderisi U, Piegari E, et al:
RB2/p130 ectopic gene expression in neuroblastoma stem cells:
evidence of cell-fate restriction and induction of differentiation.
Biochem J. 360:569–577. 2001. View Article : Google Scholar : PubMed/NCBI
|